Violence in London: what we know and how to respond - A report commissioned by the Mayor of London's Violence Reduction Unit - The Behavioural ...
←
→
Page content transcription
If your browser does not render page correctly, please read the page content below

Violence in
London: what
we know and
how to respond
A report commissioned
by the Mayor of London’s
Violence Reduction Unit
Handan Wieshmann, Matthew Davies, Ollie
Sugg, Sophie Davis and Simon Ruda

The Behavioural Insights Team / Violence in London                                2

            Acknowledgements

            We would like to thank Dilhan Perera and Ben Szreter for their
            excellent research assistance; and Alex Sutherland, Hugo Harper and
            David Halpern for their feedback, which significantly improved this
            report.
            As a London based organisation, we are grateful to the Violence
            Reduction Unit for the opportunity to support its vital work.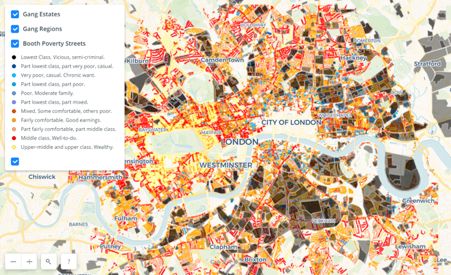
3                                                     The Behavioural Insights Team / Violence in London

Contents

04   Executive Summary

11   1. Introduction

13   2. Understanding violence in London
13   2.1 What do we know about violence in London?
23   2.2 What drives violence in London?
28   2.3 Why has violence increased in the last five years?

33   3. Responding to violence in London
33   3.1 Stabilise and reduce violence
35   3.2 Drive a culture of iterative research and experimentation

47   4. What works to prevent violence: a rapid evidence review
49   4.1 Approaches with promising evidence
54   4.2 Approaches with limited evidence that are worth pursuing
56   4.3 Approaches with mixed evidence

59   Appendix

61   Endnotes
The Behavioural Insights Team / Violence in London                                                                                4

            Executive Summary
            In the early hours of the first day of January 2019, a man was killed while working as a security guard at a New
            Year’s Eve party after he intervened to help a colleague involved in a struggle. In February, a man was murdered
            after refusing to give a stranger a cigarette in an off-licence. In March, a teenager was stabbed to death by
            another teenager in an alleyway. In April, a woman was found beaten to death in a flat. Her partner was charged
            with her murder.

            These are some of the Londoners who lost their lives to violence last year. Their deaths illustrate the human
            consequences of violence in the capital, to the victims, those who loved them and their communities. They bring to
            the fore the pressing question - how can we prevent these tragic incidents from happening?

            Though it plays a vital part, the criminal justice system alone cannot prevent violence and its consequences. A
            different approach is needed. One that seeks to understand the underlying drivers of violence, and can bring
            public sector agencies together with communities to address them.

            The London Violence Reduction Unit (VRU) was set up in 2018 to drive this change in approach. Its goal is two-
            fold: firstly, to stabilise and reduce violence in the short term; secondly, to understand the underlying causes of
            violence and coordinate London’s communities and public organisations to address those causes in the longer
            term.

            Last year, the VRU commissioned the Behavioural Insights Team (BIT) to develop a Strategic Needs Assessment
            to inform its approach to violence prevention in London. Strategic Needs Assessments are typically used in
            health and social care to identify the current and future health needs of local populations to inform and guide the
            planning of services within a local authority area.

            Violence encapsulates a broad and complex set of behaviours, which can be both difficult to measure and difficult
            to prevent. Partly as a result of this, the evidence on what works to prevent violence is thin. The VRU and its partners
            must confront the problem that exists now – making the best decisions they can with the available evidence – whilst
            at the same time they must build the evidence base to inform future decisions.

            This report will help the VRU and partners achieve that. We bring together existing research and analysis to
            present an assessment of what we know about violence in London, highlight what we do not know and set out
            recommendations for how the VRU and partners should respond.

            Where possible, we draw on data and empirical evidence identified through research methods that enable us to
            test theories and hypotheses. In doing so, we do not disregard the human experiences that are behind the data,
            nor the voices of experienced practitioners and London’s communities. Instead, we aim to complement these with
            evidence of large-scale patterns and trends to help inform the VRU’s activities.

            Understanding violence and working out how to prevent it is difficult. There is unlikely to be any quick fix or simple
            answer. But drawing on evidence to complement the strength and expertise of London’s communities and public
            services, and with the additional funding that has been provided by the Mayor of London and central government,
            we have an opportunity to pave the way for significant reductions in violence now and for future generations of
            Londoners.
5 The Behavioural Insights Team / Violence in London Understanding violence in London Last year, violence in London cost £3 billion. Though London is one of the safest cities in the world,1 violence in the capital has tragic human consequences and high costs. These costs include those incurred in anticipating and responding to violence as well as the direct consequences of violence, such as losses in victims’ years of life, quality of life, and economic output. After almost a decade of decline, violence in London has increased in recent years. Police recorded data have shown significant increases in violence. For example, violence against the person offences, which include homicide and violence with and without injury, have increased by more than 60 per cent since 2014. While this is in part driven by improvements in police recording, hospital admissions data corroborate this increase to some extent: hospital admissions for assaults with a sharp object increased by 32 per cent from 2013/2014 to 2017/18. Of most concern is the fact that violence appears to have become more serious, as well as more frequent, likely driven by an increase in the use of knives: the proportion of attempted murders and robberies involving a knife has increased by five percentage points since 2014. Violence in London is highly geographically concentrated. As a result, considering a London-wide picture of violence can mask significant variation. Violence in some boroughs may be low, or decreasing, but there may be specific locations within those boroughs where violence is high or increasing. Borough level – or even ward level – comparisons are often unable to detect this. Recent analysis confirms that many forms of violent crime are heavily clustered in a tiny proportion of small geographical units (or Lower Layer Super Output Areas, LSOAs), which contain a maximum of 3000 residents. (From here, we refer to LSOAs as “neighbourhoods”). This brings us to an important conclusion of this report: that smaller is better – a highly localised approach is essential for understanding and responding to violence in London. The majority of London’s neighbourhoods have not experienced increases in violence between 2013 and 2017 and violence actually decreased in many areas over this period (sometimes in close proximity to areas of high increases). Just six (i.e. fewer than 1 per cent) of all of London’s neighbourhoods showed a large and increasing violent crime rate between 2013 and 2017. Given this geographic concentration of violence in the capital, it is essential that we understand the interaction between specific locations with broader demographic and attitudinal characteristics before concluding who might be at risk of violence (both as victims and perpetrators). Failing to do this will likely lead to ineffective and potentially stigmatising targeting. Neighbourhoods that have suffered high levels of violence are also likely to have higher levels of deprivation. It is not possible to say for certain what explains the concentration of violence in London, but deprivation appears to be an important part of the story. Income deprivation is the strongest predictor of high violence in a specific neighbourhood. Deprivation, poor community cohesion, and weak trust between neighbours may set the conditions for gangs to prosper. As forthcoming research from the London School of Economics (LSE) shows, gangs tend to ‘form’ in areas of London where there are higher levels of deprivation, higher proportions of migrants, lower house prices, and lower average education levels. In addition, the deprivation of certain London neighbourhoods and their vulnerability to gangs appears to be deep seated. Just over half of all the poorest neighbourhoods in London were also the poorest over a hundred years ago and gang territories identified today map on well to streets identified as poor in 1900. 1 In 2018/19 London’s homicide rate was lower than that of other cities with which it is often compared, including New York and Glasgow.
The Behavioural Insights Team / Violence in London                                                                                 6

            However, levels of community cohesion and social trust have a protective impact against violence.
            Though income deprivation is the strongest predictor of neighbourhood vulnerability to violence, the relationship
            between neighbourhood deprivation and violence is not consistent. Neighbourhoods that do not have levels of
            high violence exist in highly deprived areas and, indeed, a smaller number of high-violence neighbourhoods exist
            in areas that are not deprived. We cannot be certain about what explains the resilience against violence of some
            London neighbourhoods but community cohesion and social trust seem to be protective factors. Evidence suggests
            that when neighbours know and trust each other, and share common expectations for their neighbourhood, they
            are more likely to take greater collective responsibility over public safety in their area. This can translate into
            actions like confronting people who are visibly disturbing public spaces. In addition, neighbourhoods with greater
            collective efficacy may be more likely to organise themselves to work with the police and other agencies to
            prevent violence.

            The 2008 recession, along with subsequent reductions in public spending, is likely to have increased
            the vulnerability of some London neighbourhoods to violence. It is not possible to determine a causal
            link between the effects of the 2008 recession and rates of violence in London. However, based on past research
            and current data, we think it is very likely that reduced opportunities, declining real wages and reductions in public
            spending have increased the vulnerability of some of London’s most deprived communities to violence.

            Research shows that the recessions are linked to increased crime rates due to fewer labour market opportunities,
            greater stress due to financial worry, and more leisure time. In addition to these direct effects, it is likely that
            reductions in funding for public services since 2010 and associated increases in caseloads, have made it more
            difficult to identify and seize opportunities to prevent violence. To illustrate, between 2011/12 and 2018/19,
            46 per cent of funding from London council youth services was withdrawn. Analysis by the London School of
            Economics shows a correlation between large reductions in funding for boroughs and increases in the knife crime
            rate.

            Finally, reductions in police and wider criminal justice capacity are likely to have made it more difficult to disrupt
            and deter violence. The number of front-line staff in the Metropolitan Police Service (MPS) fell by 10 per cent from
            2010, while the number of civil support staff fell by 37 per cent. Over the same period, reductions in funding for
            the wider public sector led to an increase in so-called non-crime demand to the police, meaning that officers’ time
            was stretched even more. This has made it more difficult for the MPS to invest time to build relationships and carry
            out preventative work in neighbourhoods vulnerable to violence.

            The most important indicators of the ability of the police (and wider criminal justice system) to apprehend and
            punish violent offenders tell the same tale. Since 2010, sanction detection rates for knife crime have halved from 27
            per cent in March 2014 to just 13 per cent in March 2019; homicide detection rates have fallen; and charge rates
            for violent offences have almost halved from around 15 per cent in 2014/15 to around 8 per cent in 2018/19.
            To compound this, the public’s perception that the police and other agencies can protect them has worsened.
            Coupled with perceptions of rising violence, these perceptions can themselves increase the risk of violence further:
            a lack of trust in the police and criminal justice system can lead victims to become perpetrators as they seek
            revenge, carry a weapon, or seek protection from others as opposed to the police.

            The effect of these changes in labour market conditions and public sector safety nets may have been
            compounded by changes in drug markets. There is evidence that over the same period the street drug market
            has become both more lucrative (due to increases in the supply and purity of cocaine) and more competitive
            (due to greater competition from online suppliers of narcotics). This combination of a more lucrative yet smaller
            street market may have driven violence by increasing the competition between organised criminal groups. It may
            also have driven the rise of county lines, the term used for drug gangs from big cities expanding their operations
            to smaller towns. County lines enterprises often rely on violence to drive out local leaders and the exploitation of
            vulnerable people as couriers for drugs.
7 The Behavioural Insights Team / Violence in London
Responding to violence in London
So how should the VRU and partners respond to violence in the capital? To answer this question, we first set out
how the VRU can optimise its efforts to stabilise and reduce violence in the immediate term. We then present a
framework for driving long-term reductions in violence.
Conduct street and neighbourhood level analysis to identify severe vulnerability and target
resources for maximum impact. The most effective way the VRU and partners can target resources and
funding in the short term is by focussing on those neighbourhoods where violence is highest. In practice, this means
targeting, for example, the top five or ten per cent of neighbourhoods vulnerable to violence; carrying out analysis
using the smallest units possible, such as street segments; and using coordinate-level data to explore patterns in
violence within these neighbourhoods, including identifying specific times when risk is high, such as the end of the
school day.
Once neighbourhoods have been identified, the VRU should work with the police, local partners and communities
to develop bespoke strategies for preventing violence and helping people feel safe. This could be achieved by
deploying police officers to specific locations such as schools or bus stops at certain times; or making changes to
the physical environment, for example through improvements in street lighting. An important part of this short term
response should be to build the trust of those with low levels of trust and confidence in institutions, particularly in the
police.
Drive a culture of iterative research and experimentation to bring about long-term reductions in
violence. As this report will show, based on existing data and research there is still a lot it is not possible to know
about violence in London: our understanding of the problem is incomplete, as is our knowledge of what will work
to prevent it.
As a result, to bring about sustainable reductions, the VRU should drive a culture of iterative research and
experimentation. In practice, this means collecting and using data to understand violence and its causes; building
evidence to develop responses; and evaluating violence prevention approaches to establish what works and for
whom. It also means being willing to find out that some approaches do not work; and having the courage to try
things that might fail. If the VRU and partners successfully drive this change in approach, they can bring about a
step-change in violence prevention in London. Below we present a framework for achieving this.
Figure 1. A framework for driving long term reductions in violence
Understand Design Evaluate Make it work
the problem solutions in practiceThe Behavioural Insights Team / Violence in London 8
Understand the problem
Improve our ability to measure, understand, monitor and anticipate violence. With a more precise
understanding of violence, the VRU and partners are more likely to be able to respond effectively. However, our
understanding of the frequency of violence, why it happens and to whom is significantly limited by what data is
available, and how reliable that data is. For example, data limitations make it difficult to assess prevalence and
trends in domestic abuse in London. As a result, plugging gaps in data collection and improving the accuracy of
data that is collected must be an early priority for the VRU. To achieve this, the VRU should compile data sources
into an easy to use, publicly available set of metrics. In doing so, it should:
1. Ensure that the metrics monitor the harm which is a consequence of violence, as opposed to only the frequency
of violence;
2. Ensure that the metrics address gaps arising from under reporting (and gaps in measurement) by drawing on a
wide range of data sources;
3. Ensure that the metrics capture the consequences of repeat victimisation and the unequal distribution of
violence and harm across the population;
4. Work with partners to improve the accuracy of data that is recorded;
5. Ensure the metrics monitor Londoners’ concerns about violence;
6. Track the correlates of violence (for example through more sensitive measures of drug consumption).
Commission research on the neighbourhood and situational drivers of violence in London. This
report will highlight many unanswered questions. For example, why are some deprived neighbourhoods more
vulnerable to violence than others; or what proportion of violent incidents are premeditated rather than impulsive?
By commissioning research to shore up the hypotheses and facilitate answers to unanswered questions, the VRU
can ensure its partners have access to the best evidence possible in designing responses. We identify two early
research priorities for the VRU, based on where the gaps are greatest. The first is investigating the neighbourhood
level risk and protective factors for violence in London. The second involves using unpublished data to understand
the situational (immediate or catalysing) causes of violence (i.e. understanding the motives for violence, the contexts
in which they happen, and the behaviours that precede them).
Use advanced analytical models to identify predictors of risk and intervention opportunities. The
VRU and its partners have access to large swathes of administrative data, which present a good opportunity
for identifying behaviours or combinations of risk factors which predict violence (as opposed to simply being
associated with it). By drawing on advanced analytical techniques such as algorithmic analyses and natural
language processing, the VRU can micro target resources where risk is highest and bolster the ‘safety net’ around
those most vulnerable to violence. In particular, we recommend early analytical projects focus on: going missing
and violence; the use of social networks for predicting violence; analysing social media sentiment to predict threat
online; and exclusions and violence.9 The Behavioural Insights Team / Violence in London
Design solutions
Design solutions drawing on evidence of what works. Drawing on what works to prevent violence is
easier said than done due to the limitations of the evidence base on violence prevention. That said, the VRU and
partners should not be constrained by the limitations of the evidence base (i.e. they should not take its limitations as
a barrier to innovation – simply because an approach has not previously been evaluated, that does not mean it
won’t work). Instead, they should be informed by it, incorporating insights about what has previously been effective
and why into new or existing programmes, and making commissioning decisions based on a good understanding
of what we do and do not know. To support this, we have carried out a rapid review of the evidence on violence
prevention approaches, which we present in the final chapter of this report.
Work with communities to adapt evidence for the local context. Simply ‘lifting and shifting’ approaches
that have worked elsewhere is unlikely to be effective as the nature and underlying drivers of violence will vary
from place to place and the effectiveness of an approach will depend on what is already in place. As a result, the
VRU and partners should translate evidence, scrutinising whether what has worked elsewhere addressed equivalent
underlying problems and working with communities to adapt approaches for local needs.
Ensure interventions reach those who need them. Even the best-designed programmes and services will
not succeed if those who most need them do not want to, or cannot access them. To mitigate this risk, the VRU
and partners should identify obstacles to accessing services and remove them so that services can be accessed
by those who need them. These obstacles may be structural (for example a lack of time or money to engage) or
behavioural and psychological (for example people who have been let down by services in the past may not
want to engage with them again). By understanding the needs and perspectives of those who interventions seek
to engage, and designing approaches based on this, the VRU and partners can increase the likely impact of
preventative interventions.The Behavioural Insights Team / Violence in London 10
Evaluate
Take a pragmatic approach to evaluation in the immediate term. Without evaluation, the VRU and
partners will not know which parts of their approach work, nor how much and where resources should be invested
as a result. There are currently hundreds of violence prevention interventions and approaches being delivered
across London, of which the vast majority are not being rigorously evaluated. It is not realistic to expect there will
be high quality evaluations to measure impacts on violence for each of these interventions overnight. Instead, the
VRU will need to work with partners to incrementally build these programmes up so they are ready for evaluation.
This should include working with partners to establish whether programmes are reaching those who are at risk of
violence; and measuring their impact on vulnerability to violence (based on risk factors or outcomes associated
with violence, identified through academic research). The VRU can then work with those programmes or
approaches that are most promising and prepare them for more rigorous evaluation.
Generate a pipeline of interventions that can be more rigorously evaluated in the medium to
long-term. In the medium term, the VRU should work with partners to foster a pipeline of interventions that can
be more rigorously evaluated by the Youth Endowment Fund (YEF), a ten year, £200 million fund, established by
the Government in 2019. To achieve this, the VRU should bring together the knowledge and local experience of
its partners and London’s civil society, provide them with evidence to complement their understanding; and build
relationships between intervention providers and researchers.
Make it work in practice
Provide the resources, incentives and connections to drive iterative research and experimentation.
While direct responsibility for many of the recommendations we present above sits with the VRU’s partners, the
VRU itself, through its convening, enabling and funding power has a critical role to play in providing the resources,
incentives and connections to make them happen. In particular, the VRU can play an essential role in brokering
data sharing agreements between partners; it can provide partners with analytical and research capability they
need; and it can incentivise the use of evidence and evaluation through its funding arrangements.
Make multi-agency working as easy as possible. The VRU, as a new body independent from London’s
statutory agencies and councils, can play an enabling role in driving effective partnership working. To achieve this
it can help to remove the barriers to partnership working (such as lack of shared space for meeting and different
working patterns); take steps to break down cultural differences and increase cohesion across agency boundaries;
and embed feedback loops to sustain multi-agency partnerships (for example feeding back how data collected in
one organisation is used by another to prevent violence).11 The Behavioural Insights Team / Violence in London 1. Introduction Last year, the VRU commissioned two reports to help shape its approach to violence prevention in the capital. It asked BIT to develop this Strategic Needs Assessment for violence in London and the Social Care Institute for Excellence (SCIE) to conduct an analysis of statutory reviews of homicides and violent incidents to identify key causes and common patterns in homicides and harmful incidents in London. (Statutory reviews take place after certain types of homicides or harmful incidents). The two reports, which have been published in parallel, are intended to help the VRU and partners understand why violence happens and how it might be prevented. The findings we present in this Strategic Needs Assessment are the culmination of six months of research, in which we have conducted interviews with academics, experts and VRU stakeholders to identify lines of inquiry; reviewed and synthesised published analysis and data to understand the nature of violence in London; and conducted a rapid evidence review on existing violence prevention approaches.2 How we define violence in this report Violence, according to the World Health Organization (WHO), is: “the intentional use of physical force or power, threatened or actual, against oneself, another person, or against a group or community that either results in or has a high likelihood of resulting in injury, death, psychological harm, maldevelopment, or deprivation”.i The focus of this report, agreed with the VRU, is specifically on interpersonal forms of violence between family members, intimate partners, friends, acquaintances and strangers, including youth violence, intimate partner violence and sexual violence.3 We agreed that this would include the following offences: all violence against the person offences (homicide, violence with injury, and violence without injury); sexual assaults (rape and other sexual offences); and robbery. Note that though they are specific forms of violence that are frequently referred to, domestic abuse, gang violence and knife crime are not specific offence types and so are not demarcated in offence data. Instead, any violent offence can be ‘flagged’ as domestic, gang-related or knife-enabled. We excluded modern slavery and terrorism offences, along with offences pertaining to deprivation and neglect. How we measure violence and interpret trends Understanding violence and interpreting trends is challenging for a number of reasons. Violence is a behaviour that is often witnessed only by those involved, which makes it difficult to observe and measure. In this report, we primarily use recorded crime to measure violence. However, this has limitations because what constitutes an act of violence (in the eyes of the law, victims and perpetrators) changes over time. For example, victims of sexual violence may be more likely to recognise that they have suffered an act of violence due to changing social attitudes. As a result, the patterns we see in the data may at times reflect changes in attitudes towards certain behaviours as opposed to changes in the underlying prevalence of those behaviours. In addition, some of the most serious forms of violent offences, such as homicide and firearms offences, are in statistical terms infrequent in England and Wales. When numbers are small, what look like changes in trend are more likely to be due to random variation. As a result we can be less confident in the patterns we see in the data for categories of violence where the base-rate is low. Finally, all available measures of violence have their specific limitations. Below, we summarise the three main sources we draw on to form our assessment of violence in this report, along with their limitations. Throughout this report, we try to triangulate data sources wherever possible and highlight any caveats to assist the reader’s interpretation. 2 Full details of our methodology are in the Appendix. 3 This does not include child maltreatment and elder abuse, which are distinct from other forms of interpersonal violence and require bespoke responses.
The Behavioural Insights Team / Violence in London                                                                                                         12

           Table 1. Data sources used in this report and their limitations

                Source                Description                                    Limitations

              The Crime             A face-to-face victimisation survey that       Not all violent crimes are covered by the CSEW. The survey does
              Survey for            asks people about their experiences of         not cover homicide as it is based on the responses of victims.
              England and           a selected range of offences in the 12
              Wales (CSEW)          months prior to the interview.                 The CSEW is also not well suited to measuring crimes that occur in
                                                                                   relatively low volumes, for example, higher-harm violent crimes like
                                    It is considered to provide a reliable         gun and knife crime.
                                    estimate of trends as a consistent
                                    methodology has been used to                   Certain types of violence (such as domestic violence) may be
                                    measure these crimes since it began            under-reported in the survey because respondents may be inhibited
                                    in 1981.                                       from answering openly.

                                                                                   The way respondents are identified may also limit the
                                                                                   generalisability of the findings (e.g. the survey only includes those
                                                                                   living in private households).4

              Police                Incidents reported or identified               Police recorded crime statistics are affected by changes in police
              recorded              by the police where there is an                activity (for example, an increase in stop and search may lead to
              crime                 identified victim and, on the balance          an increase in knife-possession offences).
                                    of probability, the circumstances as
                                    reported amount to a crime defined by          This measure cannot provide a full count of crime as not all crimes
                                    law and there is no credible evidence          are reported to the police.
                                    to the contrary.
                                                                                   A renewed focus on the quality of crime recording by the police
                                    Police recorded crime is considered            since 2014 is thought to have led to a greater proportion of
                                    a better source of data for high-harm          reported crimes being recorded by the police, which means we
                                    low- violent crimes that are not well          must be cautious in drawing conclusions about trends we see in that
                                    measured by the CSEW due to their              data since 2014.
                                    infrequency.

              Hospital              Incidents recorded by the NHS.                 Hospital admissions are likely to capture more serious offences,
              admissions,                                                          as for the large majority of some violent offences recorded by the
              London                These are not affected by changes in           police the victim does not require hospital treatment.ii
              Ambulance             police activity or changes in recording
              Service (LAS)         practices. They also capture incidents         This data also excludes some victims who may have needed/
              or Helicopter         of violence that are not reported to the       received treatment, e.g. they may have been seen at a walk-in
              (HEMS) data           police but for which the victim seeks          clinic, or pharmacy.
                                    treatment.

           4 This means that the results may be skewed, as these individuals may be those who are most vulnerable to victimisation (e.g. those without a
           fixed abode). Additionally, approximately 16 per cent of responses are ‘refusals’ whereby the person selected for interview refuses to take part.
           Crime Survey for England and Wales (2018) Technical Report 2016/17. Office for National Statistics
13 The Behavioural Insights Team / Violence in London 2. Understanding violence in London In this chapter, we set out an assessment of violence in London. We begin with what we know about the scale and nature of violence in the capital before turning to the likely drivers of these findings. 2.1 What do we know about violence in London? In general violence in London is proportionate to the city’s share of the population, but the robbery rate is disproportionately high Table 2 and Figure 2 show that violence against the person offences are the most prevalent forms of violence in London and also account for the largest proportion of the overall cost of violence (violence with injury and violence without injury cost £1.2 billion and £550 million respectively).5 The rate of overall violence in London is proportionate to its population (London accounts for 15 per cent of the population and 15 per cent of all violent offences in England and Wales).6 The exception to this is London’s robbery rate, which is four times that of the rest of England and Wales (London accounts up to 40 per cent of all robberies). This is likely driven in part by the large numbers of people travelling into and around this large metropolitan area on a daily basis (around two million people travel into London every day, with the day-time population increasing to over ten million).7 This larger supply of potential victims, potentially carrying more valuable possessions, is likely to be an important factor in explaining the higher rates of street-based acquisitive violence in the capital. Greater Manchester,8 another large metropolitan area, has a similarly high robbery rate, which supports this hypothesis (Figure 3).9 5 See Table 3 in the appendix for detail on how these costs were calculated. 6 London accounts for approximately 15 per cent of the population of England and Wales and similarly accounts for 15 per cent (219,785 out of 1,474,008) of all violent offences in England and Wales (including homicides, violence with injury, and violence without injury, sexual offences and robberies). 7 Based on 2014, which is the latest data available. Taken from the London Data Store Daytime Population of London. 8 Greater Manchester has a population of 2.8 million people and is the third largest city in England and Wales after Birmingham. It is most comparable to London in the sense that the police force is coterminous with the city (albeit London is also policed by City of London Police). 9 Given that metropolitan areas have a greater number of people travelling for different purposes, e.g. work, school, socialising, it is perhaps unsurprising that such street-based offences are disproportionately concentrated in these locations.
The Behavioural Insights Team / Violence in London                                                                                                                                 14

            Table 2. Rates and costs of violence in London. City of London Police, Metropolitan Police and Office for National
            Statistics

             Violence type                                            Sub-type                  2013/14         2018/19     Change in        Knife-               Cost (2018/19)
                                                                                                rate per        rate per    rate since       enabled              (£).iii
                                                                                                100,000         100,000     2014             proportion
                                                                                                                                             of offences
                                                                                                                                             (2018/19)

                                                                      Homicide                        1.32          1.37             4%                 56%             420,512,008
             Violence
             against the                                              Violence with injury             709          887             25%                  7%b           1,187,582,528
             person
                                                                      Violence without
                                                                                                      844          1,563            85%                 17%b           553,549,246c
                                                                      injurya

                                                                      Raped                             50           93                                                 355,464,342
             Sexual                                                                                                                 85%                 1.1%
             assaults
                                                                      Other sexual
                                                                                                        83          136            64%                                    86,271,813
                                                                      offencesd

             Robbery                                                  Personal robberyd                313          355             13%                 25%              391,264,213

            Figure 2. Police recorded violence in London, 2014/15 to 2018/19. Source: Metropolitan Police Service.10
                  Number of police-recorded offences per year

                                                                300,000

                                                                250,000

                                                                200,000

                                                                150,000

                                                                100,000

                                                                50,000

                                                                      0
                                                                                 2014/15        2015/16           2016/17          2017/18              2018/19

                                                                                             Personal robbery                 Violence with injury and homicide
                                                                                             Sexual offences                  Violence without injury

            a. Includes stalking and harassment in both 2013/14 and 2018/19. Stalking and harassment was split out of violence without injury from 2017
            onwards, but we include it in both years for consistency.
            b. For violence with injury, we use data on the proportion of ‘assaults with injury and assault with intent to cause serious harm’ involving knives,
            while for violence without injury we used the proportion of ‘threats to kill’. More precise measures of knife-enabled violence with and without
            injury are not available from the ONS.
            c. Cost does not include stalking and harassment, since the unit costs available for violence without injury are unlikely to be representative of the
            current extent of (reported) stalking and harassment, given its rapid rise since the inputs to unit costs were collected.
            d. London-wide rates for rape, other sexual offences and personal robbery are estimated by combining data sourced from the Metropolitan
            Police and the City of London Police.

            10 ‘Violence without injury’ as reported by the Metropolitan Police includes stalking and harassment. Stalking and harassment has increased
            rapidly over recent years, partly due to an expansion in coverage and an improvement in recording.
15 The Behavioural Insights Team / Violence in London
Figure 3. Police recorded rates of violence per 1,000, March 2018-2019. Source: ONS11
15
Offence rate per 1,000 population
10
5
0
Violence with injury Violence without injury Sexual offences Robbery
England and Wales London Greater Manchester
excl. London
In line with trends in England and Wales violence in London has increased
since 2014
From the early 1990s onwards, in a period often referred to as “the great crime decline” many forms of crime,
including violence, fell across Europe, North America and Australasia. In England and Wales victimisation rates, as
measured by the Crime Survey for England and Wales (CSEW), fell from 4.7 per cent of adults reporting being a
victim of violent crime in 1995, to 1.7 per cent 2017 - 18.12 iv
However, in recent years, police recorded data has shown increases in less frequent forms of violence, which the
CSEW is less apt to measure. For example, police recorded violence against the person offences in England and
Wales increased by more than 150 per cent from 2013/14 to 2018/19.13
These striking percentage increases in some forms of police recorded violence are in part due to improvements
to police recording over the same period. In 2013 and 2014, following concerns that true crime levels were
not represented in statistics recorded by the police, all police forces in England and Wales were inspected to
determine whether their crime data could be trusted. This inspection found that more than 800,000 crimes were
unrecorded each year, with violence against the person and sexual offences in particular under-recorded. As
a result, since 2014, police forces have made significant improvements to their recording practices.v This makes
it difficult to know if increases in police recorded violence since 2014 are driven by increases in the underlying
prevalence of violence and are simply the result of improved recording.
As a result, we must look to other data sources to triangulate police recorded crime. In doing so, we see
evidence of a genuine increase in the underlying prevalence of some forms of violence in London. This increase
is significantly less marked than the increase in police recorded violence alone, but there are some concerning
trends: increases in the severity, as well as the frequency of recorded violence (including robbery) and increases in
the use of knives. We discuss these trends in detail below, reporting all changes since 2014, as the pre-2014 police
recorded data is not reliable.
11 The figure excludes homicides due to their low frequency.
12 ONS have explored the impact of repeat victimisation on these figures but found that repeat victimisation does not change the number of
victims. See ONS, 2019, Improving victimisation estimates derived from the Crime Survey for England and Wales.
13 VAP offences include homicide, death or serious injury through unlawful driving, violence with injury, violence without injury, and stalking and
harassment.The Behavioural Insights Team / Violence in London 16
Violence against the person has increased in harm and severity, in line with trends in England and
Wales
Police recorded violence against the person offences in London have become both more prevalent and more
serious (see Figures 4 and 5).
Firstly, the rate of increase is greater than the previous rate of under-recording. Secondly, we see an increase
in hospital admissions due to assaults with sharp objects, which confirms increases in the use of knives. (From
2013/2014 to 2017/18 hospital admissions for assaults with a sharp object increased by 32 per cent and there
was also an increase in ambulance calls to violence. See Figures 6 and 8). Finally, homicides, which are reliably
recorded due to their severity, have also increased by 4 per cent over this period.
Figure 4. Violence against the person offence rate per 1,000 population, 2002/03 - 2018/19. Source: ONS
Experimental Statistics using Home Office Police Recorded Crime Datavi
30
25
Offence rate per 1,000 population
20
15
10
5
0
2002/03 2004/05 2006/07 2008/09 2010/11 2012/13 2014/15 2016/17 2018/19
London England and Wales17 The Behavioural Insights Team / Violence in London
Figure 5. Violence against the person Crime Severity Score,14 2002/03 - 2018/19. Source: ONSvii
5
4
Crime severity score
3
2
1
0
2002/03 2004/05 2006/07 2008/09 2010/11 2012/13 2014/15 2016/17 2018/19
London England and Wales
Figure 6. Ambulance calls to violence and hospital admissions for assault with a sharp object, London 2012/13 -
2018/19. Sources: Greater London Authority; NHS Digital15
12,000 3000
10,000 2500
8000 2000
Number of hospital admissions
Number of incidents
6000 1500
4000 1000
2000 500
0
2012/13 2013/14 2014/15 2015/16 2016/17 2017/18 2018/19
Hospital admissions due to assault with sharp object
14 The Crime Severity Score is a measure of crime harm, calculated using average sentencing lengths. One limitation with the Crime Severity
Score is that it may reflect attitudes towards sentencing rather than actual changes in seriousness of crimes. However, these trends are
supported by other sources of data, e.g. hospital admissions.
15 London ambulance data has been updated since the first release of this report on 30 January 2020 due to a change in how incidents of
violence attended by an ambulance are categorised. Due to data limitations, the data presented now excludes incidents categorised using
paramedic information and is based only on incidents categorised using information from the caller.The Behavioural Insights Team / Violence in London 18
Robberies have increased and become more serious due to an increase in the use of weapons
In line with increases in England and Wales, the robbery rate in London has increased by 13 per cent since 2014.
The increases in robbery recorded are likely to reflect genuine rises in the underlying prevalence of robbery as the
impact of changes in police recording practices are likely to be less pronounced than for other crime-types.16
In England and Wales, there has also been an increase in the proportion of robberies that are knife-enabled,
though this may be driven by improvements in the way knife-enabled offences are recorded.viii There is a similar
trend in London, where the proportion of robberies involving a knife has increased by five percentage points since
2014.
England and Wales appears to be an exception when it comes to the upward trend in robberies: it is the only
jurisdiction out of six comparable regions in which robberies rose between March 2013/14 and 2018/19, see
Figure 7. 17 18 19 This suggests that to understand changes in robbery, we need to explore drivers of violence that
have affected England and Wales as a whole, such as macroeconomic changes or reductions in public spending.
We turn to this later in this section.
Figure 7. Robbery rates in selected comparable countries. Source: UNODC, World Bank and ONSix
200
Offences per 100,000 population
150
100
50
0
2010 2011 2012 2013 2014 2015 2016 2017
Australia France Ireland Northern Ireland
Canada Germany England and Wales Scotland
16 This increase is likely to reflect some real change in these crimes. Recording improvements are likely to have contributed, but the impact is
thought to be less pronounced than for some other crime types. See ONS, 2019, Crime in England and Wales: year ending March 2019.
17 Specifically, US, Canada, Australia, Germany, France and Scotland - regions with which England and Wales are often compared. For
example, see Home Office, 2018, Serious Violence Strategy.
18 Robbery had an increase of 71 per cent, from 50,153 to 85,736 offences.
19 The United Nations Office on Drugs and Crime (UNODC) form these estimates using nationally recorded police data. To ensure
consistency across datasets, the UNODC define serious assaults as ‘Intentional or reckless application of serious physical force inflicted upon
the body of a person resulting in serious bodily injury’, while robberies are defined as ‘Unlawfully taking or obtaining property with the use of
force or threat of force against a person with intent to permanently or temporarily withhold it from a person or organization’. See UNODC
(2015), ‘International Classification of crime for statistical purposes’.19 The Behavioural Insights Team / Violence in London
There has been an increase in the use of knives and Londoners’ concerns about knife crime have risen
in line with this
In England and Wales, knife and sharp instrument offences have increased by around 40 per cent since the year
ending March 2011.20 21 Police recorded data on knife-enabled offences is unreliable due to inconsistencies in the
way forces have recorded these over the period, but hospital admissions data suggest that at least 10 per cent of
this rise in England and Wales is genuine: admissions for assault by sharp object increased by 13 per cent (4,490
admissions to 5,069) between 2011/12 and 2018/19.x As Figure 8 shows, London is a major contributor to this
trend.
There is evidence that the rise in knife-enabled crime is driven by the increasing use of knives in robberies. In
England and Wales, knife enabled robberies increased by more than 30 per cent from March 2014 to March
2018.xi In London, the proportion of robberies and attempted murders involving a knife has increased by five
percentage points since 2014, while the use of knives in other violent offences has remained roughly stable.
In line with this, Londoner’s concerns that knife crime is a problem in their area have increased over the same
period. Based on data from the Public Attitudes Survey (PAS),22 the proportion of Londoners reporting that they
feel knife crime is a problem in their local area has increased by around 5 percentage points across London as a
whole since 2014 (from 23 per cent in 2014/15 to 28.6 per cent in 2018/19).
This London-wide average masks local variation in Londoners’ concerns about knife crime. For example, there
was a 9 percentage point increase in Barking and Dagenham (from 24 per cent in 2014/15 to 33 per cent in
2018/19), compared with Ealing where the percentage of residents who feel knife crime is a problem in their area
has remained roughly stable (at around 25 per cent). In addition the three-year comparison masks changes within
the period. To illustrate, in Lambeth, concerns fell from 52 per cent in 2014/15 to 26 per cent in 2016/17, before
increasing again to 42 per cent in 2018/2019.
Figure 8. Annual counts of hospital admissions for sharp objects for England and Wales, 2012-2019. Source:
NHS Digital
1,400
1,200
1,000
Hospital admissions per year
800
600
400
200
0
2013/14 2014/15 2015/16 2016/17 2017/18
London North East South West
East Midlands North West West Midlands
East of England South East Yorkshire & the Humber
20 An offence is recorded as involving a knife or sharp instrument when the weapon is present during the offence or the threat is believed to be
real. The weapon does not necessarily have to be used. Offences of “possession of an article with a blade or point” are covered separately by
a specific recorded crime category.
21 Firearm offences increased by 11 per cent (from 6,022 to 6,684) between 2011/12 and 2018/19. However, it is unclear to what extent
this increase has been driven by improvements in recording, and given the relatively low volumes, we focus on knife-enabled violence. ONS
(2019) Crime in England and Wales: year ending March 2019.
22 The PAS is a quarterly public perceptions survey in London, based on a random sample of respondents at pre-selected addresses with
a total of 3,200 Londoners normally interviewed face-to-face each quarter to yield an annual sample of 12,800 interviews. The survey is
designed to achieve 100 interviews each quarter in the 32 London boroughs (excluding the City of London) in order to provide a borough-level
sample of 400 interviews in any 12-month rolling period.The Behavioural Insights Team / Violence in London 20
Increases in police recorded sexual offences are likely to be due to improved recording
There has been a 73 per cent increase in the rate of police recorded sexual assaults in London since 2014.
However, analysis by the Mayor’s Office for Policing and Crime (MOPAC) suggests the increases in sexual
offences in London is likely to be driven in large part by improved recording of these offences since 2014. Along
with violence against the person offences, sexual offences were among the most under-recorded, with 26 per cent
not recorded.xii
Data limitations make it difficult to assess prevalence and trends in domestic
abuse in London
It is difficult to assess the extent of domestic abuse and understand trends using police recorded data for two
reasons. Firstly, domestic abuse is frequently under-reported as victims are often not willing to come forward, which
means many instances of domestic abuse cannot be captured by the police. Secondly, there is not a specific
offence of domestic abuse; instead, offences are ‘flagged’ as domestic when recorded. Inconsistencies in how this
is done mean it is not possible to identify the proportion of violence in London that is domestic.
Police recorded data shows a 19 per cent increase in domestic violence with injury compared to 2014, which
suggests that there may have been an increase in more serious forms of domestic abuse over this period.23
However, due to the limitations described, we cannot be confident this trend reflects a true increase.
To address the limitations of police recorded data, MOPAC analysed CSEW data for London and found that
approximately four in 100 adults aged between 16 and 59 experienced some form of domestic abuse in the
previous year. This analysis showed London had a lower proportion of females reporting having been a victim of
all forms of domestic abuse once or more in the previous year compared to England and Wales.24 However, small
sample sizes in CSEW data mean that it is difficult to detect robust patterns at a London level, so we cannot be
completely confident in these findings.25
Violence is highly concentrated and fewer than 1 per cent of
neighbourhoods have had a large and increasing crime rate between 2013
and 201726
London is one of the biggest cities in the world, covering 1,572 km² and home to over nine million people.27 There
are 32 boroughs of varying sizes (in addition to the City of London), some of which are the size of medium sized
cities in their own right. The combined population of Barnet (397,049) and Croydon (391,296) is larger than cities
that London is sometimes compared with (for example, the population of Glasgow is 626,410). In addition, the
characteristics of London’s communities vary significantly. For example, the population per hectare ranges from 160
people per hectare in Tower Hamlets, down to 22 in Bromley; and the proportion of households who own their
house outright ranges from 36 per cent in Bexley to 11 per cent in Hackney.xiii
Given the scale and diversity of the capital, it is not surprising that London-wide conclusions on levels and trends
of violence mask significant variation within London. At borough level combined rates of violence against the
person, sexual offences and robbery range from just under 2,000 per 100,000 people in Richmond-upon-Thames,
to almost 4,000 in Hammersmith and Fulham. Violence rates also vary significantly within boroughs. Recent
research using data from small geographical units (Lower Layer Super Output Areas, LSOAs), which on average
contain approximately 1,500 residents, found that over two thirds (69 per cent) of knife-enabled (KE) homicides
in 2017/2018 occurred in just 1.4 per cent (67) out of all 4,835 LSOAs.xiv From here, we refer to LSOAs as
“neighbourhoods."
23 The rate of domestic abuse homicides is relatively low in statistical terms (ranging between a low of 10 and a high of 30 per year between
2011 and 2019), meaning that the data is subject to statistical fluctuations and is a poor indicator of wider trends.
24 It is not possible to make comparisons with other cities using CSEW data because these are not reported in publicly available data.
25 The total sample size of the CSEW is 35,000.
26 Neighbourhoods vulnerable to violence are defined by Sutherland et al. (2020) as neighbourhoods that have levels of violence
significantly above average, specifically those in the 75th percentile or higher compared to the rest of London in a given year.
27 Specifically, the population in 2018 was 9,006,352, see London Datastore, 2019.21 The Behavioural Insights Team / Violence in London
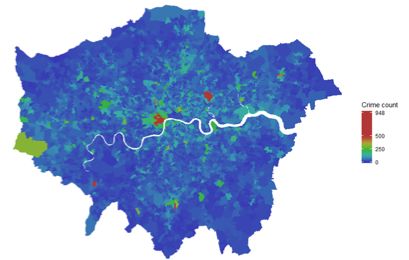
Building on this, forthcoming analysis for the College of Policing shows that many forms of violent crime are heavily
clustered in a very small proportion of neighbourhoods (e.g. Figure 9, below); 28 and the majority of London’s
neighbourhoods have not experienced increases in violence since 2014. Violence overall increased in a very small
number of neighbourhoods between 2013 and 2017; and actually decreased in many areas (sometimes in close
proximity to areas of high increases). Just six (0.12 per cent) of neighbourhoods had a large and increasing violent
crime rate between 2013 and 2017 (three in Lambeth, one in Wandsworth, one in Haringey, and one in Barking
& Dagenham). Three other groups of high violence LSOAs had relatively high violent crime rates across the same
period, and three others had comparatively higher increases over time. As Figures 9 and 10 show, these LSOAs
or neighbourhoods are quite geographically dispersed, which suggests violence is very localised. It is possible
that since the analysis was conducted, that the LSOAs most affected may have altered. However, the geographic
concentration of violence that this analysis shows brings us to a key conclusion of this report: that smaller is better –
a highly localised approach is essential for understanding violence in London.29 30
As a result, drawing on demographic characteristics to identify cohorts who might be at risk of violence (both as
victims and perpetrators) without exploring how these characteristics interact with geographic locations is likely
to be misleading. For example, recent analysis found that young black men were disproportionately likely to be
affected by violence in London (both as victims and perpetrators). However, this analysis did not consider whether
young black men were also disproportionately likely to live or spend time in high violence neighbourhoods. As
a result, targeting young black men across London is likely to be ineffective and stigmatising. This is supported
by recent research that used CSEW data to show that, in England and Wales, more than any demographic
characteristics, area level deprivation was a key risk factor for violence victimisation.xv
Figure 9. Violent crime in London, 2017. Source: Sutherland et al (forthcoming)
Crime count
948
500
250
0
28 Sutherland et al (forthcoming) defines violence as all notifiable offences that are violent or aggressive in nature, including: Violence with
Injury, Violence without Injury, Aggravated Vehicle Taking, Firearm Offences (other), Knife Offences (other), Possession of Article with Blade or
Point, Rape, Robbery of Business Property, Robbery of Personal Property, Violent Disorder, and Domestic Abuse.
29 These groups are LSOAs that share similar distribution of offences over time, derived using Group Based Trajectory Modelling (GBTM)
Sutherland et al (forthcoming).
30 These trends are consistent when also looking at rates per 1,000 of the working population based on the 2011 census estimate for each
LSOA (as opposed to the resident population). The working population is preferable to resident population because most (recorded) violent
crime tends to occur outside of the home, and there are a number of areas in London that experience considerably higher daily footfall than the
number of resident properties (for example in the West End).The Behavioural Insights Team / Violence in London 22
Figure 10. Map of high violent crime trajectories (Blue = LSOAs with a high and increasing violent crime
trajectory; Red = other groups of LSOAs with relatively high rates of violent crime).31 Sutherland et al (forthcoming)
LSOAs with a high and
increasing violent crime trajectory
Other groups of LSOAs with
relatively high rates of violent crime
31 These vulnerable groups are clusters of LSOAs with similar distributions of offences over time, identified using Group Based Trajectory
Models analyses. Sutherland et al (forthcoming).23 The Behavioural Insights Team / Violence in London 2.2 What drives violence in London? Violence is most concentrated in areas with high and entrenched deprivation Why do particular neighbourhoods in London experience higher rates of violence? We do not know for certain, but deprivation appears to be part of the explanation. Past research shows that poverty and violence are strongly correlated. For example, a longitudinal study of 4,300 young people in Edinburgh found that those from low socio-economic status households had 1.5 times greater odds of involvement in violence, as either the victim or perpetrator, than those from more affluent family backgrounds.32 33 xvi There is evidence of a link between area-level poverty and violence in London: three-quarters of the boroughs in London with the highest levels of violent offending are also in the top ten most deprived, and have higher proportions of children under 20 living in poverty than the London average.xvii Recent analysis by the Greater London Authority (GLA) shows rates of youth violence are highest in boroughs that are deprived in multiple ways, including: high long-term unemployment; low educational attainment; high numbers of residents on Universal Credit; high numbers of mortgage non-payment claims; more people earning below the minimum wage; and higher estimates of rough sleepers.34 35 36 37 xviii This relationship between area-level deprivation and violence holds across different types of violence. MOPAC have identified that six in ten of the highest volume wards for domestic abuse offences are also ‘most vulnerable’ wards as measured by the Vulnerable Localities Profile (VLP). xix 38 At LSOA level, neighbourhoods with high rates of violence tend to be deprived in multiple ways. Though income deprivation is the strongest predictor of high violence in a specific neighbourhood, high violence neighbourhoods also suffer greater barriers to housing and services, greater health problems, and worse living environments (such as poorer housing quality and lower air quality).xx 39 40 Social cohesion and trust are likely to protect neighbourhoods from violence The relationship between neighbourhood deprivation and violence is not consistent. There are some places that buck the trend described above: there are neighbourhoods that do not have levels of high violence in highly deprived areas and a smaller number of high violence neighbourhoods in areas that are not deprived. Though it is not certain what explains the resilience of some London neighbourhoods to violence, community cohesion and social trust are likely to be important protective factors. Research from the United States (US) has shown that collective efficacy, defined as social cohesion between residents in an area and their willingness to intervene for the good of the neighbourhood, can protect against neighbourhood vulnerability to violence. Put simply, when neighbours know and trust each other and share common expectations for their neighbourhood, they may take greater collective responsibility over public safety in their area. This can translate into actions, such as intervening to discourage teenagers from congregating in a way that might lead to arguments or confronting people who are visibly disturbing public spaces. By being able to organise themselves effectively, neighbourhoods with higher collective efficacy may also be able work with the police and other agencies to prevent violence in their area (for example, through extra neighbourhood patrols, or the demolition of public buildings that attract disorder).xxi As a result, past research has shown that where collective efficacy is high, neighbourhoods are less likely to have high rates of violence, even if they are economically deprived. 32 Socio-economic status was calculated based on respondents’ descriptions of their caregiver’s occupations, coded using the Registrar General Social Classification Scheme. Respondents were divided into two broad social class groupings according to whether their caregiver’s occupation was classed as ‘non-manual’ or ‘manual or unemployed’. 33 Poverty was a significant predictor of violence when controlling for gender and family structure at age 13. 34 As measured by the Index of Multiple Deprivation (IMD). 35 Educational attainment measured by GCSE pass rates. 36 UC claimants measured by the rate of Job Seekers Allowance claims of one year or more. 37 Other correlates at the community level included the proportion of children living in out of work benefit claimant households, the rate of conception in mothers under the age of 18, the rate of children in need, and the proportion of dependent children living in low-income households. 38 The VLP integrates data collected at the neighbourhood level to form an overall composite index value of vulnerability for a locality. It is calculated using six variables (measured at the same geographical units), including: counts of burglary dwelling; counts of criminal damage to a dwelling; income deprivation score; employment deprivation score; count of 15-24 year olds; and educational attainment. 39 Based on Index of Multiple Deprivation (IMD) Living environment scores. This measures the quality of the local environment, and includes indoors living environment (e.g. the quality of housing) and the outdoors living environment (e.g. air quality and road traffic accidents). 40 As measured by the IMD.
You can also read