2015 Framework to assess the economic reality of shale gas in South Africa Climate and Energy
←
→
Page content transcription
If your browser does not render page correctly, please read the page content below
©

                              TECHNICAL
                               REPORT
                                 ZA

                              2015

                                Climate and Energy

                                Framework to assess the economic reality
                                of shale gas in South Africa
Treasure Karoo Action Group
ABOUT WWF
    WWF is one of the world’s largest and most experienced independent
    conservation organisations, with over 5 million supporters and a global network
    active in more than 100 countries.

    WWF’s mission is to stop the degradation of the planet’s natural environment
    and to build a future in which humans live in harmony with nature, by
    conserving the world’s biological diversity, ensuring that the use of renewable
    natural resources is sustainable, and promoting the reduction of pollution and
    wasteful consumption.

    CREDITS
    Author: Saliem Fakir
    Designer: Michelle Heyns, Apula

    ACKNOWLEDGEMENTS
    The author is grateful for having had the privilege of informative conversations
    with David Hughes, Michael Schwatz, Mitchell Austin, Avner Vengosh and
    Thomas Darrah who have written and studied the US shale plays extensively.
    The author also received support from WWF colleagues Manisha Gulati and
    Ellen Davies in the compilation of this report. The report began as a set of
    powerpoint slides following two months of intensive research. The presentations
    were shared with and commented on by various interest groups totaling more
    than 200 people from whom feedback was drawn in creating the final report.

    Thanks go to David Bush, Edwin Ritchken, Louise Naude, Tjaša Bole-Rentel,
    Louise Scholtz, Duncan Pieterse, Megan Segar and Carolyn Cramer for their
    valuable comments.

    Any errors contained in the document remain the responsibility of the author.

    Designed by Apula
    Published in January 2015 by WWF-SA – World Wide Fund for Nature (formerly
    World Wildlife Fund), South Africa.
    © Text 2015 WWF-SA
    All rights reserved

2
TABLE OF CONTENTS
Preface			                                                                                            4

Glossary of Terms			                                                                                  5

1. Introduction			                                                                                    6
     1.1 Gas in the global energy mix			                                                              6
     1.2 The five key drivers of shale gas economics			                                               6
     1.3 Development of South African shale gas 			                                                   7
     1.4 Is a shale gas industry viable in South Africa?			                                           7

2. A brief history of shale gas in the US			                                                          9

3. Shale-gas geology and the role of water			                                                         11
     3.1 The origin of shale gas			                                                                   11
     3.2 Conventional versus unconventional reserves			                                               11
     3.3 Thermogenesis			                                                                             12
     3.4 Frack fluids and the role of water			                                                        14

4. The economics of shale gas			                                                                      17
     4.1 Recovery and learning			                                                                     17
     4.2 Decline rates			                                                                             17
     4.3 Methods for decline rates analysis 			                                                       18
     4.4 Application of the Arps formula			                                                           19
     4.5 Aspects of shale-gas wells affecting well economics in comparison to conventional wells			   22

5. Context of a wellhead base cost model			                                                           25
     5.1 Base model considerations			                                                                 25
     5.2 The importance of technology learning rates			                                               27
     5.3 Financing of shale gas and prospects for South Africa			                                     27
     5.4 The MPRDA and South Africa’s oil and gas sector			                                           29
     5.5 Royalty rates			                                                                             30
     5.6 Free carry and tax waivers in South Africa			                                                30
     5.7 Timing for optimal revenue streams			                                                        31
     5.8 Shale-gas pricing			                                                                         31
     5.9 Shale-gas pricing in the South African context			                                            32
     5.10 Shale-gas beneficiation			                                                                  32

6. Costs and benefits of shale gas in South Africa			                                                 34

7. Towards a base economic model for shale gas			                                                     37

8. The economic potential and environmental challenges for South Africa			                            38
     8.1 Environmental costs			                                                                       38
     8.2 The unknown impacts of seismicity			                                                         39
     8.3 Environmental damage claims			                                                               39
     8.4 Reclamation provisions			                                                                    39
     8.5 Carbon tax			                                                                                40
     8.6 Water costs			                                                                               40
     8.7 Shale-gas beneficiation pathways			                                                          41
     8.8 The impact of shale gas on South Africa’s GDP			                                             42
     8.9 Job creation potential of shale gas			                                                       42

9. Conclusion 			                                                                                     43

References and footnotes			                                                                           45

                                                                                                           3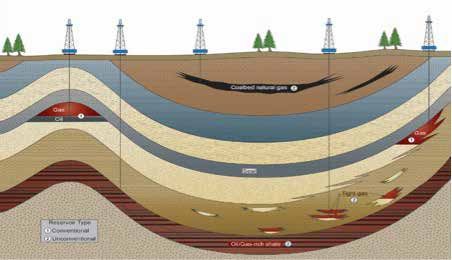
PREFACE
    This paper was borne in response to various claims made by both private firms and state agencies
    regarding the promise of shale gas as a cheap source of energy in South Africa. We undertook our
    own research and analysis on some of these claims. We have gone into far more detail than many
    reports have attempted by linking geology, environment, technology and financing. This report is
    the first edition as we will try to regularly update our analysis as our own knowledge grows. The
    issues we cover here are as comprehensive as we could be; hopefully we can set the basis for more
    work in this area in future.

    Many of the claims made locally are based on the US experience. The majority of such claims reflect
    a lack of understanding both of the US experience and of the fact that for something to be replicable,
    the context has to be similar. As is already known, conclusions reached regarding the extraction of
    shale gas in the US have to be understood within the correct context and any extrapolations made
    must be adjusted for local conditions. Much of what is said in the local media merely touches on
    the politics of the debate rather than exploring the technical and economic aspects in more detail.
    Our own need to understand the issues led to a multitude of literature reviews, conversations and
    analyses of the technical material in order to undertake a proper unpacking of the economics of
    shale gas in more detail.

    The publicity around the potential of shale gas in South Africa has focused primarily on the
    environmental and social implications. There has been comparatively little attention given to the
    critical assessment of whether or not hydraulic fracturing (fracking) would be commercially viable.
    The implied assumption (claimed by proponents of the oil and gas industry) is that vast amounts of
    money could be made by the oil and gas industry, landowners, local communities and government.
    The purported benefits of shale gas are largely based on what can be drawn from the US and Canadian
    experience. We draw, though, the bulk of our analysis from the US experience. Opinions on these
    benefits are divided between different experts in the light of the large write-offs of assets and value
    experienced by the oil majors such as Shell and others.

    Given that the field of shale-gas economics is fairly new and that there is much room for growth in
    our understanding in South Africa, this paper attempts to summarise the core issues as they relate
    to the geology, the hydraulic fracturing technologies and the environmental factors that drive the
    extraction of shale resources and shale gas in particular. The author is not an expert geologist nor
    shale-gas operator and has relied on various sources in his attempt to connect the dots between the
    various fields to make an early appraisal of the issues that are likely to influence shale gas extraction
    in South Africa. This paper at best represents a modest attempt at the synthesis of the prevailing
    knowledge.

    This report is designed to frame the economic issues pertinent to shale gas in South Africa. While
    the model proposed for assessing the economics of shale gas has not been tested for South African
    conditions, it does provide some possible approaches that warrant consideration. The report
    provides some preliminary conclusions. Readers who are unfamiliar with the technical aspects of
    the subject can refer to the references for further explanations of some of the technical issues. We
    hope the reader will find this informative and be better equipped to participate in the ongoing debate
    and policy-making process for shale gas as a result.

4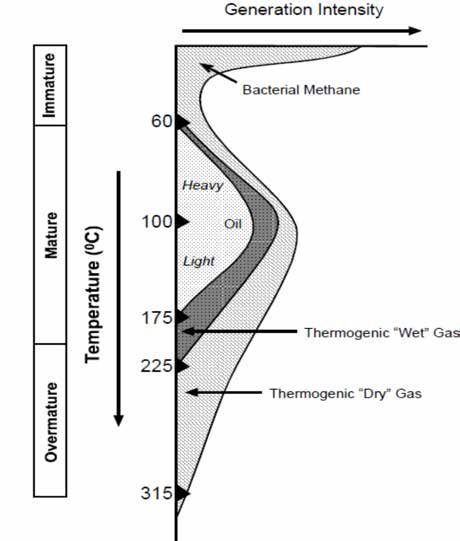
GLOSSARY OF TERMS
Bcf - Billion Cubic Feet
      [1 billion cubic feet of gas can supply the cooking, heating and other household needs of
      10-11000 homes for a year]

CBM - Coal Bed Methane

CNG - Compressed Natural Gas

DCF - Discounted Cash Flow

DFW - Dallas Fort Worth

EIA - Energy Information Administration

EUR - Estimated Ultimate Recovery

F&D - Finding and Development

G&A - General and Administrative Costs

GIP - Gas in Place

GTL - Gas to Liquids

IDDRI - Institute for Sustainable Development and International Relations

IP - Initial Production

IRR - Internal Rate of Return

LNG - Liquefied Natural Gas

LOE - Lease Operating Expense

LPG - Liquid Petroleum Gas

Mcf - Thousand Cubic Feet

MPRDA - Mineral and Petroleum Resources Development Act

NGL - Natural Gas Liquid

NGV - Natural Gas Vehicle

NOC - National Oil Companies

NPV - Net Present Values

OEM - Original Equipment Manufacturer

SRV - Stimulated Reservoir Volume

T&F - Transportation and Fractionation

TOC - Total Organic Carbon

USGS - US Geological Survey

VPP - Volumetric Production Payment

WACC - Weighted Average Cost of Capital

                                                                                                  5
1. INTRODUCTION
MAIN FINDINGS
• There is growing global interest in gas as a means of diversifying the energy mix.
• Gas demand is expected to double within the next two decades.
• Publicity around the potential of shale gas in South Africa has focused primarily on
environmental and social implications with insufficient attention to the economics.
• Five key drivers influence economics and commercial viability of shale gas dealing with
environmental externalities issues.
• Initial South African shale-gas resource estimates are substantial but subject to great
uncertainty and possible further revision.
• The economically recoverable reserve is yet to be determined.
• Exploration rights are still to be granted.
• The economic proposition of shale gas holds relevance for the public sector and society at
large.
• The economic viability of shale gas could be assisted by the regulated domestic price of gas or
international benchmark prices determined by the global market.
• Wellhead economics are key to the economic sustainability of shale-gas extraction.
This paper seeks to reflect on a number of contending issues related to shale-gas development and
economics in South Africa. This is WWF South Africa’s first high-level assessment of the issue.
1.1 GAS IN THE GLOBAL ENERGY MIX
Because many countries have used most of their coal reserves, gas is a serious consideration as a
means to diversify energy supply. In addition, considerations of cost, environmental externalities
and energy security would weigh heavily on the minds of energy planners. It is fair to say the world is
certainly transitioning to a more diverse energy mix, though it is probably still too early to say which
is going to be the dominant source in the future. Gas, though, will play an influential role.
Global use of coal is subject to increasing constraints and this is one of the reasons why gas is being
looked at more seriously. World supply of gas is primarily from conventional sources. In the last
decade, increased supplies of gas from unconventional sources have been forthcoming from shale
gas, tight gas and coal bed methane (CBM) following the shale-gas boom in the US and exploitation
of CBM sources in Australia. Unconventional sources of oil and gas are reliant on reasonable or high
enough oil and gas prices to ensure economic viability. Interest in gas exploitation in South Africa
follows growing interest globally. Gas demand is expected to double within the next two decades.
1.2 THE FIVE KEY DRIVERS OF SHALE-GAS ECONOMICS
Based on our current knowledge and assessment, we argue that shale-gas extraction has, at best,
marginal economics and that its commercial success is largely dependent on five key drivers: 1) rate
of technology learning and efficiencies, 2) good knowledge and understanding of the geology, 3) a
high enough price for gas or oil and other incentives, 4) the timing and scaling of drilling intensity,
and 5) the cost of mitigating the externalities for both the short and long-term.
6All five of these drivers are at the core of the economic and financial viability of shale-gas production
and, despite the hype, are sensitive to various conditions. Whether or not one is in favour of fracking
for shale gas, the drivers remain the cornerstone of the economics and any one of these factors can
throw out the economic viability.
It will be useful, in future, to compare the US experience with that of other countries and assess
how these five factors exert an influence on the commercial viability of shale gas in these countries.
As we will show later, some preliminary work in other countries – which we have yet to study
extensively – shows that it can be difficult to make the economics work when you consider all
the factors that have to be taken into account and the degree of inconsistency and variability in
performance they can throw up.
As far as externality costs are concerned, our primary focus will be on in-field or production
externalities and reclamation costs. In other words, they will be confined to the development
and production aspects of shale gas. Some externalities may be unknown in terms of their
nature, frequency, risk characteristic and future mitigation costs. As our knowledge grows, such
externalities will have to be factored into the production cost of shale gas. This report will not go
into the draft regulations for hydraulic fracturing currently being developed by the Department of
Mineral Resources. The Department of Mineral Resources has released draft technical regulations
on oil and gas exploration and production, including shale gas and hydraulic fracturing. The draft
regulations were gazetted on 15 October 2013. In addition, in August 2013, the Department of Water
Affairs (DWA) declared fracking a controlled activity in terms of the National Water Act, requiring
the approval of a water use license for this activity. Detailed regulations are still be developed and
released for comment.
1.3 DEVELOPMENT OF SOUTH AFRICAN SHALE GAS
South African shale gas resource estimates are placed at around 485 trillion cubic feet (Tcf) while the
economically recoverable reserve is yet to be determined. Exploration rights are still to be granted
even though a government moratorium has been lifted. Exploration for shale gas in South Africa is
only likely after drilling, water and minerals regulations have been finalised.
Much of our analysis has been dependent on knowledge and experience from the US. As a result, we
do not know the true economic potential, the well head costs, nor whether the Karoo geology will
yield any long term sustainable product. While the information gaps are significant, the domestic
knowledge base is growing in leaps and bounds.
1.4 IS A SHALE GAS INDUSTRY VIABLE IN SOUTH AFRICA?
We seek to address the question of whether wellhead prices will be competitive by constructing a
base economic framework for how to assess the economics of wellhead costs, the implications on
the pricing of shale gas for the domestic market, and the domestication and beneficiation from gas
usage. We thereby develop a collage of potential environmental externalities and explore whether
these can be mitigated by building these costs in the drilling and production phase of shale gas. We
further consider long-term externalities where costs are difficult to predict but can be dealt with
through various interventions.
7While it is true that private developers should be left to decide the economic proposition of shale gas,
extractives are not only about private investment and the associated risks to investors.
They also hold relevance for the public sector and society at large. From the perspective of the public
sector, an understanding of the economics of shale gas not only influences appropriate fiscal policies
and regimes, but also helps to clarify whether the exploitation of the resource justifies other public
spend and incentives to make shale-gas extraction a viable proposition. A more sober assessment of
the resource potential is essential, not only to allow for a more robust debate, but also to inform the
extent to which public funds should be allocated towards the development of the resource.
Secondly, the economic viability of the production cycle of shale gas could be determined by the
regulated domestic price for gas. To arrive at such a price, the wellhead economics need to be
understood and made transparent. These costs should be inclusive of environmental mitigation
costs. At present there is an information asymmetry. Multinational corporations vying for
shale-gas plays in South Africa enjoy an information and knowledge advantage that is already
influencing not only the nature of the debate, but could in future influence the framing of fiscal
policy and how environmental externalities are dealt with going forward. Asymmetries can only be
resolved through better information and transparency.
Better understanding of the make up of welhead costs begins to level the knowledge playing field.
Greater understanding of the issues enables different decision pathways to be thought through more
carefully when considering whether to exploit a resource, the timing of the exploitation and the pace
at which it should be exploited.
A vast resource can be both a bane and a boon for the domestic economy. Beneficiation pathways
are not only determined by gas prices, but also by the longevity of the production process and the
size of the resource. The scale and thresholds of the externality impacts give a measure of the benefit
and costs so that trade-offs can facilitate prudent choices while decisions are facilitated by sound
grounding of the science and economics. In the end, those with a personal incentive to extract make
their case on the promise of jobs and benefits to the economy. All claims in this regard must be
properly evaluated1 as claims of jobs and benefits are meaningless in the absence of proper context
to establish their veracity and the capacity to deliver these outcomes in reality.
We believe the wellhead economics are key to the economic sustainability of shale-gas extraction and
the use of gas in the broader economy. We believe a grasp of this provides for a better assessment of
downstream benefits and puts more realism to claims being made about economic spin-offs. The US
example is used widely. These are the only shale-gas plays we can draw on for real life experience.
The explosive growth in academic and grey literature only testifies to the hunger for understanding
given that the commercial production of shale gas dates back to 20042. An understanding of the
performance of the shale-gas industry is only growing as more experts analyse the experience in
field. We draw on some of these experiences to pull lessons for South Africa. Our study is based on
several interviews along with a review of academic and non-academic literature.
82. A BRIEF HISTORY OF SHALE GAS IN THE US
MAIN FINDINGS
• The US shale-gas experience is not necessarily replicable elsewhere.
• In other countries, extraction has proven less economical than envisaged.
• Recently, oil prices have plummeted putting mega projects at financial risk.
• Several endowment factors have supported the rapid commercial development of shale-gas
extraction in the USA.
• Technological improvements have been key, but geophysical characteristics may, in the end,
defeat technogical breakthroughs.
Drawing from the US is useful with the caveat that the US experience is, perhaps, unique and possibly
not replicable elsewhere. It is a point repeatedly made by experts like Leonardo Maugeri3; a well-
known oil and gas expert in the US. Maugeri goes as far as to say the US shale-gas experience will
stay in the US4. The proposition remains to be tested, but preliminary attempts in Mexico5, Poland
and other European countries6, China7 8 and Australia9 are proving to be difficult10 and extraction
has been found to be less economical than originally envisaged11. Maugeri’s thesis may still hold for
a while. Others who have also examined US shale-gas plays are contesting the long-term economic
viability12 of shale gas arguing there is more hype13 than is warranted by reality14 15. The debate on the
longevity of shale gas is a contested issue and one which requires some clarity regarding different
aspects of shale gas in order to properly appraise the various claims16. We provide some insight
into these issues later in the report that no doubt will give a far clearer perspective than has been
attempted for the South African context.
The exploration of unconventional reserves comes at a period in the oil and gas history when the
majority of oil and gas reserves are owned by national oil companies (NOCs). The ‘seven-sisters’
(now the big five oil majors) have restricted access to and ownership of a substantial portion of
the world’s conventional plays. Many of these conventional sources are low-cost fields. In order to
ensure reserve replacements that are large enough to keep their businesses going they are scouring
the earth for new reserves, primarily unconventional plays that have largely remained unprofitable
as these are frontier petroleum activities characterised by high risk and significant technological
challenges17. Unconventional sources and riskier oil and gas finds require good rates of return from
high gas and oil prices to make the economics work. Recently, oil prices have plummeted by 50%
from historic highs. This puts some of the trillion dollars worth of mega projects at financial risk as
many projects were planned when oil prices were around $100/barrel. Frontier petroleum and gas
exploitation implies higher capital cost with lower rates of reserve replacement compared to the
historical trends that were possible with easier and lower cost oil and gas finds18.
In the US, frontier petroleum reserves became the only real option after geologist M.K. Hubbert
convincingly showed that the US conventional reserves of oil and gas would peak in the 1970s19. This
opened the space for new players as the majors vacated the US. Medium-size firms or oil and gas
minors were less risk averse. Desperation became the mother of innovation and this, combined with
operational flexibility to experiment, helped unlock the potential of shale gas. George Mitchell, the
early pioneer of hydraulic fracturing, was desperate for new sources of oil and gas to ensure continuity
of supply for his company, Mitchell Energy20. Mitchell invested over a quarter billion dollars in the
development of the Barnett Shale from 1981 to 1997 to unlock its shale hydrocarbon reserves21.
9Mitchell was able to take advantage of existing geological knowledge from conventional plays to
exploit hydrocarbons from sources beneath these conventional fields. The early exploratory work by
Mitchell was able to capitalise on favourable geology and sound knowledge.22
There are several in-country endowment factors that have supported the rapid commercial
development of shale-gas extraction in the USA in the context of an already well-developed and
mature oil and gas industry23:
1. Technological innovation and learning spill-overs are a product of US entrepreneurs and were
largely developed by minors who were willing to take some big bets and conduct rapid in-field
innovations. Once these were accomplished, the spread of knowledge and innovation was rapid
due to the geographic proximity of players in the industry;
2. The US has a well-developed oil and gas industry with certain long settled capabilities, specialised
drilling, well-engineering and, to a great degree, a good knowledge of the geology and resource
base;
3. The dominant service and original equipment manufacturing (OEMs) companies, just to
mention a few, are Halliburton, KBR, Schlumberger and Baker-Hughes. The ability to secure
cheap commoditised services and equipment is crucial to the commercial development of
shale-gas;
4. The mineral rights are in the ownership of private land holders, unlike other countries where
land is owned by the State. Land owners themselves may be desperate for extra income
sources, particularly in farming areas, and readily sign up to leases or other types of land-deals.
Private ownership has allowed large acreage across various US plays to be brought rapidly into
production;
5. The US has an extensive pipeline and gas storage infrastructure in many of the plays, this
includes midstream and downstream parts of the gas value chain;
6. The US has a well-developed gas use market in which wellhead gas prices are deregulated at
the producers’ end through the Henry Hub24 (which has its advantages25 and disadvantages26)
allowing for easy clearance of gas and trade in gas;
7. The majority of horizontal drilling rigs in the US are concentrated in shale plays;
8. The US has a well-developed financial sector which is used to dealing with the oil and gas
industry. A number of financial products and innovations cater for various financial needs of
the oil and gas industry in different parts of the value chain.
Maugeri and others argue that the absence of these endowments in other countries interested in shale
exploitation will lead to higher cost structures in the full exploitation of shale gas or oil resources
as established endowments lower the cost of frontier oil and gas reserves exploitation if they are
simply an extension of the existing system27. Countries that take a strategic view on long term energy
security may not judge the investment in shale gas on pure commercial terms and returns, but also
in terms of sovereign risk and energy independence. China is the most likely candidate for such a
policy position and could, in the long term, exploit its shale-gas reserves even though it struggles to
do so at present.
103. SHALE-GAS GEOLOGY AND THE ROLE OF WATER
MAIN FINDINGS
• Early formation of gas and oil occurs within layers of impermeable and laminated shale rock.
• Shale gas is termed an unconventional resource in reference to the methods required to extract
it.
• Thermogenesis yields various by-products from the conversion of organic material.
• Shale-play sites that contain high total organic content are likely to produce high yields of oil
and gas.
• Wellhead design and fracturing is both a science and an art.
• Water has proven to be the best medium for frack fluid chemistry.
• The use of fresh water in hydraulic fracturing may compete with other uses.
• Recycling and reuse of water depends on the chemical composition of water as the removal of
these determine cost of treatment.
• The danger of ground water contamination exists and can be mitigated through the creation
of buffer zones or by restricting drilling in sensitive areas.
3.1 THE ORIGIN OF SHALE GAS
Perhaps the best way to describe the geology of shale is by way of reference to its place of origin
through geological time as the source rock for oil and gas. The early formation of gas and oil takes
place within these compacted layers of impermeable and laminated shale rock. As one expert puts
it more technically, shale is “made of up of clay size weathering debris, shale formations are fine-
grained, laminated clastic sedimentary rocks that are soft and fissile. Typically, they have a thickness
of 50-600 ft, porosities between 2-8%, permeabilities 10-100 nano darcy28, organic content of 1-14%.
They are encountered at depths ranging from 1000-13000 feet”29. In other words, the rock is so
compact with pore sizes so small that trapped gas would only be able to escape by fracturing the
rock.
Millions of years ago, large masses of organic material (whether plant, woody mass, marine life,
animals or algae) were buried deep within the earth’s surface. This organic material was compacted
and subjected to various stresses – mainly heat and pressure. Figure 1 depicts the distinction between
conventional and unconventional sources.
3.2 CONVENTIONAL VERSUS UNCONVENTIONAL RESERVES
Oil and gas seep from the source rock and move towards the surface until they pool and get trapped
by other types of impermeable rock barriers, such as salt domes which then act as a natural seal and
result in a reservoir which is usually closer to the surface and easily accessed. This is the source for
conventional reserves of oil and gas.
Unlike conventional pools of oil and natural gas, unconventional oil and natural gas are far more
difficult to extract. The term “unconventional” simply refers to the methods that are used to access
these resources, as well as the types of rock from which the oil and natural gas are produced.
11Figure 1: Depiction of conventional and unconventional oil and gas resources30
Source: Rodgers, Wyoming State Geological Survey, 2014
3.3 THERMOGENESIS
Given that this material is buried deep within the earth’s surface, the organic material is subject
to intense heat and undergoes thermogenesis. The pictorial representation in Figure 2 depicts the
variation of oil and gas phases or conversions as temperature gradients vary over time.
The thermogenesis process yields different by-products from the conversion of the organic material,
usually kerogen, into bitumen and then into heavy and light oil, wet gas and dry gas. Bacteria can also
convert organic material into gas, but bacteriogenic gas is more likely to occur closer to the surface
although there have been reports of bacteriogenic activity at much deeper geological formations.
There is, nonetheless, a possibility of co-mingling between bacteriogenic and thermogenic gas if
there are natural fractures that connect the two gas types over time – interconnecting deep sources
with shallower sources of gas31. This potential for co-mingling relates to contamination issues and
the identity of the origins of the gas when assigning liability which is discussed later in the report.
12Figure 2: The variation of oil and gas phases as temperature gradients vary over time
Source: Ozgul, Texas A&M University, 2002
During the prospecting phase, potential shale play areas that contain high Total Organic Carbons
(TOCs) are identified as likely to produce high yields of oil and gas. TOCs are indexed as holding viable
yields if they range between 4-12% for optimal gas or oil extraction from shale. Table 1 differentiates
between different TOC levels and the quality of the shale rock. If there is sufficient high quality TOC,
the material is subjected to further chemical analysis through a process called pyrolysis32.
Table 1: The relationship between TOC and kerogen quality33
TOTAL ORGANIC CONTENT
KEROGEN QUALITY
WEIGHT%
12 Excellent
Source: Shlumberger
13It is important to note that the presence of high TOC shale from early drilling results is not an
indication of economically recoverable gas. It is merely a pointer of the potential for high gas-in-
place (GIP). TOCs can be tested for their oil-to-gas ratio windows based on the measured readings of
vitrinite reflectance34 indicating their level of maturity. The Karoo is expected to have fully matured
thermogenesis in the most promising areas. Although insufficient drilling has taken place to be
definitive, the presence of doleritic intrusions and other features seems to support the assumption
that the Karoo will primarily consist of dry-gas plays or the gas has been over-cooked and the gas
expelled from the shale over time. In the US, various shale plays have pure oil, dry gas and/or wet
gas35 windows (wet gas is a mixture of methane gas and heavier hydrocarbons like butane and
propane). For instance, the Marcellus play, which is a vast resource, has both dry- and wet gas
windows where the west is primarily wet gas and eastern sections of the Marcellus segments contain
methane rich dry gas.
In addition to the consideration of TOC and vitrinite readings, further determinations for successful
gas extraction would include the minerology of the shale formation. In other words, what is the
ability of the rock to fracture under high pressure and, in so doing, yield high gas or oil production
rates. This depends on the levels of permeability that can be artificially created through fracking36.
The key is to ensure a high degree of connectivity between natural and artificial fractures so that the
permeability for gas transmission through the channels into gas outlets, such as the wellbore, can be
improved37. Porosity is influenced by rock structure and the degree to which the shale rock is itself
saturated with formation water38. High water saturation can impede permeability and gas flow39.
Even after fracking, the pores and fractures should stay intact to allow for gas and oil to flow when
production commences.
It seems that wellhead design and fracturing is both a science and an art. The mineral mix of the
shale formation, the proportion of clay, silicate or carbonate and quartzite, will influence the type of
frack technique and chemical mixture required.
3.4 FRACK FLUIDS AND THE ROLE OF WATER
Fracking has to take place under high pressure with high volumes (to date) of frack fluids to succeed.
Water has proven to be the best medium for frack fluid40 chemistry and its high volume low viscosity
properties allow for various manipulations tailored in relation to its interaction with the rock to be
fractured. While alternatives to water (such as Liquid Petroleum Gas (LPG) or concentrate and the
use of enhanced carbon dioxide techniques) have had some application on a trial basis, mainly in
Texas, such trials have not been at a commercial scale that would warrant commercial application
at this point in time41. At present, a Canadian company is the only company that is developing LPG
as an alternative. If LPG gains wider use in this sense, special legislation would be necessary to
deal with potential gas emissions and flammability issues as well as liability cover in the case of
accidental explosions42.
Table 2. Illustrative fracturing phases43 in a typical shale-gas well44
Prepad Low-viscosity saline solution is pumped into the borehole to ensure rock formation
is not damaged. The solution usually contains fluid loss prevention additives and
surfactants45.
Pad A viscous fluid46 is pumped into the borehole under pressure to produce fractures.
Proppant Proppants are added to low viscosity fluids to keep fractures open which can
otherwise close quickly under pressure.
Flush Use of fluids to clean out fracture fluid within fracked zones.
Source: Knudsen, University of Florida, 2012
14Water remains a cost-effective fluid and so most wells make use of water as the major medium for
the creation of artificial fractures and well stimulation. Table 2 illustrates the shale gas fracking
preparation phases. The viscosity of water47 can be modified using gels sourced from guar48, as a
case in point, so that the higher viscosity facilitates the transport of high concentrations of proppant
into the fractures where the artificial fractures have been created. This is usually applied under
conditions where the shale rock brittleness factor is low and the clay content of the rock is high. The
proppants, which can be sand or, in some cases, walnut shell resins (other types of materials such as
ceramics are also being tested), enable the artificial fractures to be kept open after the cracks have
been created.
The issue of water is an important concern if water continues to be the preferred frack fluid49.
The volume of water required depends on the nature of the frack that has to be performed. This
could have material consequences in localised conditions where fresh water is used that could
compete with other uses, although nationally the effects of water consumption for fracking are not
significant50. That said, South Africa is a water-stressed country, and so caution must be taken in
terms of how we deal with water allocation for industries or activities that will, over time, require
more water as more wells are drilled. The problem with the use of potable water is that invariably a
quantity of it is permanently lost and what is returned as flowback and produced water (essentially
fracking wastewater) is a mixture of the originally pumped fresh water (which is now contaminated)
and formation water (water rich in brine from the targeted shale gas-rich rock). The amount of
water that returns to the surface varies greatly across and even within shale plays, with most figures
indicating that between 15-80%51 of the water is returned. Water that is not recycled or reused will
incur an opportunity cost, especially in the local context where water may be in high demand. This
is something which warrants a more detailed examination in future studies. It is necessary, in any
case, to consider a total cost model for the acquisition of water in terms of transport, disposal, reuse/
recycle and the opportunity cost.
Technical measures can be required to deal with shale-gas wastewater and should be standard
practice with operators. The recycling of flowback and produced water or various types of brine52
is one option, which is increasingly being used in the US53. Depending on the characteristics of
the brine, processing technologies to treat it for reuse can be expensive54. Early essential work in
considering the development of recycling is to investigate the various types of brines generated from
shale-gas extraction, their chemical composition and the water treatment technologies required to
treat water to acceptable levels for reuse or to be returned to the system.
In the US it has been cheaper to dispose of flowback water and produced water in injection wells,
but the recycling and reuse of water is increasingly becoming an option due to economic reality (as
it is costly to truck and dispose of water), political pressures and environmental concerns55. Reusing
frack fluids will require new technology innovations56. If fracking happens in the Karoo, recycling
and reuse of water would be the only option. The reuse of flowback or produced water depends on
treatment options available for the given level and type of chemical contamination as, in order for
its reuse to be feasible, the after-treatment quality has to be ideal for the various chemical mixtures
that go into the fracking fluid. Experience has shown that fracking fluid chemistry is a combination
of chemicals that involves a recipe for each different type of geophysical characteristic of shale rock
and to create the capacity to carry the proppant down the borehole whilst reducing the friction felt
in the borehole as the frack proceeds.
The danger of ground water contamination depends on whether high standards are being adhered
to for drilling of the borehole, installing the well-casings and cementing them in place. Minimising
risk requires that best practice is followed when implementing standards to protect ground water
and surface water resources.
15The possibility of contamination increases if shale wells are close to either natural fractures or
ground water sources. This could possibly be mitigated through the creation of buffer zones or by
restricting drilling to shale plays well below 1500m or a distance from ground water sources. In
the Karoo, the creation of a buffer and well-spacing regime will most likely narrow the area of the
resource base that can be exploited57. All of these factors will play a role in economics of shale gas
drilling and development.
The key to unlocking the gas from shale is to make the impermeable geology yield to engineering and
technology and this is where unconventional wells differ from conventional wells. Unconventional
wells require far more effort to unlock as much of the GIP58 as possible as detailed in Table 3.
Table 3: Summary of Some the Key Factors for Successful Fracking59 60
• Minimum GIP should be around three cubic metres/ton with water saturation lower than 40%;
• The GIP is also influenced by other factors: high temperature and low TOCs (2.9%) will have
minor contribution from adsorbed gas while low temperatures with high TOCs (5-6%) will have
higher fracktion of adsorbed gas. In some cases of extremely high temperatures there have been
wells with no adsorbed gas61;
• Plays with higher adsorbed gas will have a flatter decline curve than plays with little adsorbed
gas;
• The higher the pressure, the better the frack outcome;
• Brittle shale is more conducive to large volume, high rate water treatments in what is called slick
water use62;
• It is key to develop a complex network of fractures with high potential for gas flow63;
• Large treatment leads to large fractures64;
• Smaller proppant65 particles are preferable as they tend to go deeper into the fractures;
• Brittle shale is mostly fractured with water as water is the least viscous and less brittle shale
is fracked with high-viscosity fluids which have higher concentrations of polymer and gelling
agents which enable them to carry the proppant66 to the fracture zones;
• A Brittle Index67 of more than 40% is desirable. By way of example, it was found that the Barnett
Shale was more brittle when it was rich in silica and low in clay68;
• Permeability for shale rock, because it is so fine grained and compact, is measured in milli- and
nano-Darcy ranges69;
• Pressure gradients of 0.5 Psi and above are ideal for high success rates in the creation of
fractures;
• Temperature and pressures change as fluids or gases are brought to the surface;
• The quality of the oil and gas is also important as they may contain many impurities such as
nitrogen, carbon dioxide and hydrogen sulphide which will have to be removed and so add to the
cost of extraction.
164. THE ECONOMICS OF SHALE GAS
MAIN FINDINGS
• The economics depend on how much gas can actually be recovered versus gas-in-place
estimates against sunk capital cost.
• Total recovery depends on technology, well design, fracture creation and geology.
• Shale decline curves depict high decline rates in the first two to three years of production
followed by leveling off.
• Initial production (IP) and decline rates determine economic limit and profitability.
• Deriving realistic production figures and economic limits is encumbered by limited drilling
history and production data.
• The industry tendency is to give optimistic expectations.
• Only after an extended drilling and completion programme can the true potential of the
shale-gas play be determined.
• Shale-gas wells are high cost, low producing wells that require drilling in large numbers to
commoditise the gas.
4.1 RECOVERY AND LEARNING
The economics of shale-gas extraction is also dependent on how much gas can actually be recovered
compared to the GIP estimates70. The total recovery rate is a function of the technology used, well
design, fracture creation and geology. The importance of making mention of this is to illustrate
that TOC levels are one part of the story, but the use of a combination of techniques and geological
knowledge to create a successful well is a function of experience. Reserve estimates are based on
methodologies that are able to assess the total Stimulated Reservoir Volume (SRV)71. Learning
rate dynamics will influence not only technology application, but also the levels at which in-field
discovery and production costs are reduced over time.
4.2 DECLINE RATES
In recent years, various experts have examined the data from producing wells in different US
plays72 73. The general pattern of well production performance for shale-gas wells is now fairly well
known74 75. In Figure 3, the decline curves depict high decline rates76 in the first two to three years of
production77 and then each year levels off as more gas is extracted from completed wells78. However,
these decline rates are much more aggressive than in conventional wells. Shale-gas wells differ from
conventional wells in that the initial production decline is steep and then gradual as shown79 in
Figure 3. This makes sense considering the geology of shale as described above.
The curve (Figure 3) corresponds generally to the geophysical and pretrophysical characteristics of
the wells when the gas production profile moves from free gas to adsorbed gas states. This is when
production dominated by fractures moves to production dominated by the rock matrix. The volume
of shale gas that can be produced over time for a specific well is defined as the Estimated Ultimate
Recovery (EUR) which is usually measured in billion cubic feet (Bcf). Daily production estimates are
given in million cubic feet (Mcf).
174.3 METHODS FOR DECLINE RATES ANALYSIS
Shale-gas well IP and decline rates determine their economic limit and profitability. EUR estimations
are important to both investors and regulators as they need to be given a view of future well behaviour
which is as accurate as possible. Investors need to know they are not investing in unproductive wells
or wells that will show lower revenue due to wrong or over-optimistic estimates.
Shale-gas production estimates are usually calculated in an aggregate or field basis. Within the field,
individual wells will have different production characteristics, with some wells producing more than
others. In shale-gas economics, it is not a single well that matters, but rather the average volume of gas
that can be produced by a group of wells. On average, field decline rates are lower than decline rates
for individual wells. Field decline rates are dependent on:
• Decline rates of individual wells;
• Total number of wells in the field;
• Period of time over which older wells were added;
• Rate at which new wells are added reduces as field production rates begin to decline80 as the
already drilled wells age
The amount one can drill depends not only on the size of land that is available, but also on the ease
with which the geology can be made to work, and the number of rigs that can be deployed. Field
decline rates can accelerate if drilling rates are not kept up in what is sometimes referred to as the
drilling treadmill. The more you drill, the more you have to lay out capital and each well, in turn,
remains uncertain with respect to its EURs and initial production.
Every well drilled is a lottery – it may produce a lucky draw, a poor draw or a dud draw meaning that
shale-gas drilling and economics remain a continual challenge to the industry given the uncertainty
of the production rates and life times of individual wells. More crucially, the more wells you have
to drill at a faster pace, the greater the danger of accidental events, contamination from polluted
water and methane leaks. Hence, vigilance has to be maintained when it comes to health, safety and
environment standards.
Within a given play or field, wells are tiered based on their gas production EURs. The industry
classification system for wells is arranged according to P10, P50, and P90 ranges. These are determined
by estimating the gas production rates based on the estimated production decline curve for a well. P10
wells are the most productive and long lasting and P90 wells are the least productive with shorter life-
spans. The tiering system also determines which wells will be exploited first depending on the price of
gas. The combination of P10 and P50 wells will lead to a strategy which optimises the production rates
or average yield for the whole shale-gas play when gas prices are reasonable or high. The exploitation
of ‘sweet-spots’ earlier in the field production schedule will tend to give higher earlier average
production rates (measured in MCf/day), but as operators move to less productive areas these wells
will have lower IPs and overall lower production rates. Optimising early drilling of ‘sweet-spots’ also
increases cash-flow and working capital that allows for more wells to be drilled in a field in that poorer
wells can be drilled later in the development of the field when gas prices are predicted to be higher.
Production rates can be improved by opening newer wells with better learning, the optimisation of
techniques and expanding the intensity of extraction by reaching a greater surface area.
The calculation of decline rates using mathematical formulae and geological assumptions can give
real or exaggerated gas production. The determination of these values is far from a perfect science and
the science of decline curve estimates for shale continues to improve led by industry’s need for better
estimates and enabled by more wells with longer production histories that allow better analysis.
184.4 APPLICATION OF THE ARPS FORMULA
Since 1945, the Arps formula81 has been used to calculate the amount of oil or gas that can be produced
by a well and to predict when production will come to an end. In the past it has been used extensively
in conventional plays and its application to shale plays is more recent82. The first commercial
shale-gas wells were drilled in 2004 about 59 years after Arp first applied his formula to conventional
wells83. Modifications to the equation are ongoing to ensure production estimates of shale plays prove
more robust and accurate. There have been modifications to the Arps equation, {q=qi (1+ bDit)-1/b}84
by Fetkovich85 to adjust for discrepancies in the Arp method curves86. In any case, deriving realistic
production figures and economic limits for shale gas is encumbered by limited drilling history and
production data. This can lead to overestimations for shale gas production.
There tends to be inconsistency in the approaches of different companies. Nonetheless, reserve
estimates are regularly revised with a new view taken every 10 to 12 months as more data is available.
There are attempts to create a uniform method of assessing the productivity and economic reserve of
shale-gas wells. Decline curve analyses are dependent on production data and are useful for forecasting
how long wells will last after desorption87 is fully exhausted. Alternative methods to the Arps formula
include the use of the power law88 loss-ratio method that is thought to give far more accurate
estimations of the EURs. The application of power law ratios89 have shown that initial estimations
using traditional methods for decline curve analysis have to be adjusted down by 40-60%90. Further
methods include the Stretched Exponential91 to allow for cumulative production estimates where
production data is either available for less than a year or more than three years92. The technical details
of these methods are not entirely relevant here, but are referenced in order to illustrate the fact that
decline curve analysis involves methods that are still evolving and are more probabilistic in nature
than exact figures93 94. Even so, decline curves form the basis of shale-gas economics which means that
information is based on probabilistic estimations rather than hard and fast estimates. The room for
error and bias in estimations cannot be ignored95. The more robust the scrutiny of estimates or claims,
the more rigorous the approximation of the economics.
Various formulae aim to mathematically mimic or describe the relation between gas production
and geophysical characteristics of shale rock or formations. The creation of fractures in the shale
rock opens passageways in such a way that they are able to connect the fractures to the production
tubing of the well. The cumulative volume of gas that can be extracted is largely determined by the
degree to which both natural and artificial fractures create sufficient escape routes for the free gas and
adsorbed gas96. The relative proportions of free and adsorbed gas as depicted in Figure 3 influence the
characteristics and shape of the decline curve.
Figure 3: Conventional versus Unconventional Decline Curves 97
Monthly Rate (Mcf/month)
Unconventional
Conventional
Free Gas
Adsorbed Gas
Time(month)
Source: Kogler, Montanuniversität Leoben, 2010
19Adsorbed gas is what exists in the rock matrix and flows at the tail end of the curve or well-life. Because
it is attached to organic matter or clay, it is harder to extract as it requires depressurisation to occur
as part of a desorption process. As McGlade et al note: “Higher rates of production decline lead to a
shorter production experience, it is difficult to know whether production will continue to decline at
the same rate or whether the rate of decline will slow in the future”98.
Initial Production (IP) normally varies for every well. The IP rate is a function of maximum (early)
production rate per well after well completion, while the decline curve provides an estimate of how fast
a well is depleted and how long it will last. Decline curves can be further adjusted based on estimates
the engineer attaches to how much of the adsorbed gas can be released as a result of depressurisation.
Significant amounts of gas can exist in an adsorbed state on the organic kerogen and clay depending on
temperature and pressure (or the adsorption isotherm)99. The importance of maintaining a pressure
gradient must not be underestimated as Kaiser notes: “A reservoir is pressurised because of its depth,
trap characteristics, geologic properties, and other factors. When a well is drilled into a reservoir, the
reservoir pressure is an important determinant of the potential flow rate. As oil (or gas) is produced,
the reservoir pressure decreases, leading to a drop in driving force and oil production” 100.
IP is crucial as it generates high initial revenue and determines whether the payback period is shorter
or longer for each well that is drilled101. The key challenge in shale formations is the high variance of
IP in unconventional plays. Break-even costs are heavily influenced by estimations of IP, the decline
rate and the life-span to the economic limit of a well.
Imprecise knowledge and achieving an optimal frack method determine IP, as has been pointed out
in Table 3, as the IP will also influence subsequent gas flow rate and EUR. EURs vary based on what
characteristics decline curves take, as shown in Figures 4 and 5, whether they are exponential or
hyperbolic during the IP and tail-end phase for shale-gas wells.
Figure 4: Examples of production decline curves for shale gas102
900.0
800.0
700.0
600.0
500.0
}
mmcf / day
Hyperbolic Decline
400.0
300.0
Exponential Tail Decline
200.0
}
100.0
0.0
1 2 3 4 5 6 7 8 9 10 11 12 13 14 15 16 17 18 19 20 21 22 23 24 25 26 27 28 29 30
EUR 3.6BCF Years after Initial Production
EUR 4.6BCF
Source: Blumshack, Penn State University, 2014
20Adjustments to the hyperbolic curve, as depicted in Figure 5, can be made on the basis of the assignation
of a b factor. If the company believes it can extract more gas from its own estimated recovery rate from
a total resource defined by the GIP, it can adjust the b factor to be higher than its conservative estimate
of 0.99. (Figure 5 shows only b factors from 0.1-0.99 but they can be greater than this). High optimism
earns a higher b factor where b is greater than 1. This has been the general industry tendency103.
Adjustments to a general hyperbolic curve are made to match the well’s existing production history.
However, due to imperfect predictive ability of what the combination of technical efforts and physical
resources can yield in the future, prudent operators err on the conservative side. B factors104 greater
than 1 will have a higher EUR and b factors less than 1 a lower EUR as shown in Figure 5 for b factors
of 0.99, 0.5 and 0.01105. Production data from early producing wells to later producing wells – this
exercise of history matching – are important empirical information in the way b factors are determined.
Figure 5: Depiction of b curve adjustments in relation to a classic hyperbolic curve
shape106
q(t)
b = 0.99
b = 0.5
b = 0.01
t
Variation of hyperbolic decline with the value of b
Source: McGlade et al, Energy, 2013
The industry practice can tend towards optimistic expectations which is an outcome of how estimates
of the b factor are done. Such estimates may have no bearing on reality as the well’s real economic
limit may prove different during the production period. Given that it can be difficult to have high
levels of certainty around the amount of gas that can eventually be produced and based on the
limited early production history to predict from there is a risk to investments being made in the
opportunity that does not materialise. A classic case of over-optimism was evident in the example
of the Dallas Fort Worth (DFW) Airport deal with Chesapeake, one of the leading companies in the
hydraulic fracturing industry107. As this case study demonstrates, if there is over-optimism on the
amount of gas that can be extracted from the shale and this does not materialise, the results of such
an intiative can go terribly wrong108. One of the challenges Chesapeake faced in this agreement is
that it had to pay royalties upfront and realised, after drilling several dozen wells, that the economics
was not working out as expected. The upfront payment of royalities resulted in losses because the
company was then unable to recover the cost of drilling and revenues to support the upfront royalty
payments. It is no surprise that the DFW situation occurred as predictability of wells is not always
precise and was from limited early production data.
21From 2009 to 2011 the Energy Information Administration (EIA) estimated that the total volume of
recoverable gas for the US would more than triple. These figures had to be revised downward by 46%
in 2012109.
The potential exists for wells to be refracked in order to expand the economic limit and hence the EUR
and life of the well. But this decision is dependent, amongst other things, on three things: 1) Whether
the technical feasibility of refracking will justify the extra spending 2) the gas production rate of a
well (refracking is likely to be more successful in wells that are ‘sweet-spots’ around P10), and 3) the
price of gas (this should be high enough to sustain additional capital outlays). Expert opinions so far
suggest that refracking at low gas prices is unlikely. It is better to drill fresh wells. However, future
innovations may make refracking feasible for all types of wells110.
4.5 ASPECTS OF SHALE-GAS WELLS AFFECTING WELL ECONOMICS IN COMPARISON TO
CONVENTIONAL WELLS
There are several features of shale-gas wells that make the economics of these wells different from
conventional wells; we provide a summary of the key features:
1. The heterogeneity of the wells and uncertainty around production rates from shale rock formations
always poses a challenge for the economics.
2. Shale surface areas are wider and longer in nature while those of conventional wells are contained
and usually secured by overlying impermeable rock, such as shales or salt barriers. To optimise
recovery you need to frack as much of the laterals.
3. Unlike conventional wells, the viability of a shale-gas well can only be determined after it has
been fracked. The importance of this is that well completion can only take place after the reserve
has been proved. Well costs are made up of two parts. Drilling costs make up 40 - 50%111 and the
balance of costs are associated with stimulation, casing, cementing and final well completion112.
4. Given the characteristic of free and adsorbed gas behaviour in wells, not all the GIP is recoverable.
Recovery rates vary per well from 10-30% based on estimates from literature surveys and expert
views. Probabilistic methods have to be used to determine resource potential and in determining
recovery factors113.
5. IPs also vary per well requiring that wells be classified into different tiers (according to their
P ranges) in a field to derive average production rates per set of wells. It is for this reason that
more wells have to be drilled for shale plays than conventional wells in the appraisal phase so that
the full potential of the resources can be recognised. This helps to determine the pace of drilling
and extraction in the development phase.
6. To maintain high average production rates per field, drilling intensity has to be ramped up and
maintained over time. Ramping up models can be garnered from US experience and these can be
set for different field conditions, IP, EURs and land size. Different scenarios are typically modelled
for specific fields or shale-gas areas114.
7. For the large amount of shale-gas wells, the proportion of ‘sweet-spots’ are smaller in relation to
other wells. In other words, for all the capital outlay, a smaller portion of wells will be in the P10
range and the rest will be P50 or P90 wells. As a result, a smaller share of shale-gas wells are as
productive as would typically be the case for conventional gas wells as depicted in Figure 6115.
22You can also read