WORKING GROUP ON MARINE MAMMAL ECOLOGY (WGMME) - VOLUME 2 | ISSUE 39 ICES SCIENTIFIC REPORTS
←
→
Page content transcription
If your browser does not render page correctly, please read the page content below
WORKING GROUP ON MARINE MAMMAL
ECOLOGY (WGMME)

VOLUME 2 | ISSUE 39
ICES SCIENTIFIC REPORTS

RAPPORTS
SCIENTIFIQUES DU CIEM

 IC E S INTERNATIONAL COUNCIL FOR THE EXPLORATION OF THE SEA
 CIEM CONSEIL INTERNATIONAL POUR L’EXPLORATION DE LA MER
ICES Scientific Reports

Volume 2 | Issue 39

WORKING GROUP ON MARINE MAMMAL ECOLOGY (WGMME)

Recommended format for purpose of citation:
ICES. 2020. Working Group on Marine Mammal Ecology (WGMME).
ICES Scientific Reports. 2:39. 85 pp. http://doi.org/10.17895/ices.pub.5975

Editors
Anders Galatius • Anita Gilles

Authors
Markus Ahola • Matthieu Authier • Sophie Brasseur • Julia Carlström • Farah Chaudry • Ross Culloch •
Peter Evans • Anders Galatius • Steve Geelhoed • Anita Gilles • Philip Hammond • Ailbhe Kavanagh •
Karl Lundström • Kelly Macleod • Abbo van Neer • Kjell Nilssen • Graham Pierce • Janneke Ransijn • Bob
Rumes • Begoña Santos
ICES | WGMME 2020 | I

Contents
i Executive summary .......................................................................................................................iii
ii Expert group information ..............................................................................................................iv
1 ToR A. Review and report on any new information on seal and cetacean population
 abundance, population/stock structure, management frameworks (including indicators
 and targets for MSFD assessments), and anthropogenic threats to individual health and
 population status........................................................................................................................... 1
 1.1 New abundance and distribution information ................................................................ 1
 1.1.1 Seal abundance and distribution ..................................................................................... 1
 1.1.1.1 Abundance, Iceland ......................................................................................................... 4
 1.1.1.2 Abundance, Baltic Sea...................................................................................................... 6
 1.1.1.3 Abundance, Atlantic Scandinavia ................................................................................... 10
 1.1.1.4 Abundance, Continental coast, Wadden Sea to France................................................. 12
 1.1.1.5 Abundance, UK .............................................................................................................. 15
 1.1.1.6 Abundance, North America ........................................................................................... 17
 1.1.1.7 New information on seal distribution ............................................................................ 18
 1.2 Cetacean abundance and distribution ........................................................................... 19
 1.2.1 Passive acoustic monitoring (PAM) of harbour porpoises in the Baltic Sea .................. 19
 1.2.1.1 Visual monitoring and strandings .................................................................................. 20
 1.3 Management frameworks (including indicators and targets for MSFD
 assessments) .................................................................................................................. 32
 1.3.1 Seal management frameworks ...................................................................................... 32
 1.3.2 Cetacean Management frameworks (including indicators and targets for MSFD
 assessments) .................................................................................................................. 33
 1.4 New information on anthropogenic threats .................................................................. 34
 1.4.1 Update on cumulative effects ........................................................................................ 34
 1.4.2 Foodweb ........................................................................................................................ 34
 1.4.3 Fishery bycatch .............................................................................................................. 35
 1.4.4 Pollution ......................................................................................................................... 35
 1.4.5 Underwater noise .......................................................................................................... 36
 1.4.6 Disturbance .................................................................................................................... 41
 1.5 References ..................................................................................................................... 41
2 ToR B. Review foraging areas and estimate consumption by relevant seal and cetacean
 species in case study areas .......................................................................................................... 48
 2.1 References ..................................................................................................................... 56
3 ToRC. Review selected aspects of marine mammalfishery interactions. Details of this ToR
 to be agreed with WGBYC ........................................................................................................... 60
 3.1 Conservation objectives and targets with respect to maximum mortality ................... 60
 3.2 New legislation at the European Union level ................................................................. 61
 3.3 Stranding records of marine mammals.......................................................................... 62
 3.3.1 Country by country stranding information .................................................................... 63
 3.4 Seal fisheries interactions .............................................................................................. 67
 3.5 References ..................................................................................................................... 73
4 ToR D. Update the database for seals ......................................................................................... 76
 4.1 The ‘ICES/WGMME seal database’ ................................................................................ 76
 4.2 Other species and missing areas .................................................................................... 76
 4.3 References ..................................................................................................................... 80
5 ToR E. Address the special request from EU on emergency measures bycatch Northeast
 Atlantic by: .................................................................................................................................. 81
Annex 1: List of participants.......................................................................................................... 82
 Acknowledgements ..................................................................................................................... 84
ii | ICES SCIENTIFIC REPORTS 2: 39 | ICES

 Annex 2: Resolutions .................................................................................................................... 85
 ToRs 2020 .................................................................................................................................... 85
ICES | WGMME 2020 | III

i Executive summary

 The Working Group on Marine Mammal Ecology (WGMME) meeting 2020 was chaired remotely
 by Anita Gilles (Germany) and Anders Galatius (Denmark) and on-site chairs Matthieu Authier
 (France) and Ross Culloch (Scotland, UK).
 Two terms of references were standing ToRs; under the first of these, ToR A, new and updated
 information on seal and cetacean population abundance, population/stock structure, manage-
 ment frameworks as well as anthropogenic threats to individual health and population status
 were reviewed. The latest abundance data on harbour, grey and ringed seals are also reviewed
 under this ToR along with findings on threats to marine mammals such as bycatch, pollution,
 marine debris and noise.
 ToR B arose to facilitate the work of WGBIOIV’s ToR A; “Investigate mechanisms linking trophic
 guilds under contrasting levels of pressure and/or primary production in case study areas”. The
 initial focus of work should be on harbour porpoise, grey seal and harbour seal in the North Sea
 as a case study and, therefore, a number of recent studies addressing diet, foraging distribution
 and trophic interactions were reviewed. Additionally, an overview of published and un-
 published data on diet and distribution of marine mammals in the North Sea was synthesized.
 ToR C was implemented to review aspects of marine mammal-fishery interactions not covered
 by ICES WGBYC. In 2020, WGMME focused its efforts on i) reviewing conservation objectives
 with respect to maximum mortality since the lack of conservation targets was identified as hin-
 dering the ability to address marine mammal-fisheries interactions, ii) assessing the use of
 stranding records as a source of information to identify abnormal mortality and possible rela-
 tions to fisheries. A country-by-country review of current stranding network activities was in-
 cluded.
 ToR D, updating the database for seals, is the second standing term of reference. The database
 format generated in 2019 was updated with the most recent data on seal abundance.
IV | ICES SCIENTIFIC REPORTS 2:39 | ICES

ii Expert group information

 Expert group name Working Group on Marine Mammal Ecology (WGMME)

 Expert group cycle Annual

 Year cycle started 2020

 Reporting year in cycle 1/1

 Chairs Anita Gilles, Germany

 Anders Galatius, Denmark

 Meeting venue and dates 10–14 February 2020, Barcelona, Spain (32 participants)
ICES | WGMME 2020 | 1

1 ToR A. Review and report on any new information
 on seal and cetacean population abundance, popu-
 lation/stock structure, management frameworks
 (including indicators and targets for MSFD assess-
 ments), and anthropogenic threats to individual
 health and population status

 New information on seal and cetacean abundance, including distribution, and population/stock
 structure, as well as management frameworks and anthropogenic threats is reviewed and re-
 ported in this section. New information on fisheries bycatch is included under ToR C.

 1.1 New abundance and distribution information
 1.1.1 Seal abundance and distribution
 In many ICES areas, seal populations are surveyed regularly, providing for a comprehensive
 long-term monitoring of these pinnipeds. Here abundances of harbour, grey and ringed seals in
 the North Atlantic and Baltic are described based on available data. Trends of harp and hooded
 seals are described in the WGHARP reports (ICES, 2019).
 Table 1, Table 2 and Table 3 summarise the most recent available seal survey data, analogous to
 what WGMME has presented in former years. In the following, assessments of population status
 and developments are presented individually for the different countries/management units and
 species, including trajectories of (available) counts.
 Unless it is stated that a figure refers to a population abundance estimate, numbers of seals re-
 ported are those counted on haul outs, which do not include seals at sea during surveys.
2 | ICES SCIENTIFIC REPORTS 2:39 | ICES

 Table 1. Recent harbour seal survey data.

 Country Survey Year(s) Adults Pups References
 (moult)

 Norway Nilssen and Bjørge, 2018

 North of 62N 2015 3872

 South of 62N 2016–2018 1054 Nilssen and Bjørge, 2019

 Finnmark 2012–2013 981

 Skagerrak 2016–2018 880

 Iceland 2016 7652 Thorbjörnsson et al.,
 2017

 Wadden Sea 2019 27 763 9683 Galatius et al., 2019

 Dutch Delta 2017/2018 969 (2017) 119 (2018) Arts et al., 2019
 Area

 France 2019 1124 224 Poncet, 2019 (un-
 published data)

 UK

 Scotland 2014–2018 26 864 SCOS, 2019

 England and 2014–2018 5095 SCOS, 2019
 W l
 Northern Ireland 2018 1012 SCOS, 2019

 Ireland 2017–2018 4007 Morris and Duck, 2019

 USA 2012 75 834 Waring et al., 2015

 Canada NAMMCO

 south of Labrador 1970s 12 700

 Estuary and Gulf 1994–2000 4000–5000
 of St Lawrence

 Sweden and
 Denmark

 Skagerrak east 2019 7310 Swedish Museum of Nat.
 coast Hist.

 Kattegat/ Danish 2019 9916 2112 (only counted Swedish Museum of Nat.
 Straits in Danish area) Hist., Aarhus University

 southern Baltic 2019 1130 Aarhus University

 Limfjord 2019 1048 521 Aarhus University

 Kalmarsund 2019 1778 Swedish Museum of Nat.
 Hist.
ICES | WGMME 2020 | 3

Table 2. Recent grey seal survey data.

 Country Recent Sur- Adults Pups References
 vey Year(s) (moult)

 Norway Troms and Finnmark 2015–2016 271 Nilssen and Bjørge, 2017a and b

 Norway north of 2014–2018 349 Nilssen and Bjørge, 2019
 62N

 Norway south of 2017 40 Nilssen and Bjørge, 2017a and b
 62N

 Iceland 2017 6269 1452 Granquist, S.M. and Hauksson,
 E. 2019

 Wadden Sea 2019 6538 1684 Cremer et al. 2019

 Dutch Delta 2018 1269 Arts et al., 2019
 Area

 France 2019 750 72 Poncet, S. 2019 (unpublished
 data)

 UK Inner Hebrides 2016 4541 SCOS, 2018

 Outer Hebrides 2016 15 732 SCOS, 2018

 NW Scotland 2016 706 SCOS, 2018

 Scottish North Sea 2016, 2004* 33 177 SCOS, 2018; * Shetland

 English North Sea 2018 9884 National Trust, Lincolnshire
 Wildlife Trust, Natural England,
 Friends of Horsey Seals

 SW England and 2016, 2005^ 2000 SCOS, 2018; ^Wales
 Wales

 Republic of 2012 2100 Ó Cadhla et al., 2013
 Ireland

 Canada Sable Island 2016 83 594 den Heyer et al., 2017

 Gulf of St Lawrence 2016 15 090 den Heyer, et al., 2017; Hammill
 + eastern shore Can- et al., 2017
 ada

 USA USA east coast 2019 6253 Wood et al., 2019

 Baltic Baltic 2019 38 000 HELCOM
4 | ICES SCIENTIFIC REPORTS 2:39 | ICES

 Table 3. Recent ringed seal survey data.

 Country Survey Adults (moult) Pups References
 Year(s)

 Sweden, Bothnian 2018 9919 HELCOM (normal ice conditions)
 Finland Bay

 Bothnian 2019 12 615 HELCOM (unusual ice conditions)
 Bay
 2015 19 936

 Estonia, Fin- Gulf of Fin- 2018 95 + 13 M. Verevkin, 2018 (Russian side: 95, average
 land, Russia land taken of range, Finnish side: 13, all animals
 observed in complete survey, Estonia: re-
 maining ice was observed, but no seals were
 observed)

 Estonia, Lat- Gulf of Riga 2018 1152 I. Jüssi, 2018
 via

 Finland Finnish Ar- 2018 122 observed, M. Kunnasranta, 2018
 chipelago population esti-
 Sea mate 200–300

 1.1.1.1 Abundance, Iceland

 Harbour seals
 Icelandic harbour seal (Phoca vitulina) and grey seal (Halichoerus grypus) populations are cur-
 rently in decline. The harbour seal population has decreased from 33 000 animals in the first
 census in 1980 to 7700 animals in 2016 (Figure 1). The largest observed decline, however, oc-
 curred between 1980 and 1989, when a bounty system was in effect, but the declining trend con-
 tinues, and the current estimated population size is the smallest that has ever been observed
 (Thorbjörnsson et al., 2017).
ICES | WGMME 2020 | 5

Grey seals

Figure 1. The trend of survey results of harbour seals in Iceland.

The Icelandic grey seal population has been surveyed at irregular intervals since 1982 when the
population abundance was estimated at 9000 animals. The latest estimate from 2017 indicated a
population abundance of 6269 animals, based on a pup survey yielding 1452 pups (Figure 2;
Granquist and Hauksson, 2019).

Figure 2. The trend of counted grey seal pups in Iceland.

Annual marine mammal bycatch in the lumpsucker fishery based on observations from 2014–
2018 was estimated at 3223 (1225–5221) animals, comprising 1389 (903–1875) harbour seals, 989
(405–1573) grey seals, 240 (82–398) harp seals, 49 (1–98) ringed seals and 28 (10–46) bearded seals.
These estimates are per year and are stratified by management area (Bonanom et al., 2019). There
6 | ICES SCIENTIFIC REPORTS 2:39 | ICES

 is some discussion within NAMMCO on the accuracy of the estimated bycatch of this specific
 fishery, there might be reason for concern that fisheries mortality is affecting the Icelandic har-
 bour and grey seal populations, especially as other fisheries also occur in the area. In addition to
 this threat, growing tourism including seal watching could affect the seals in the area (Granquist
 and Sigurjonsdottir, 2014).

 1.1.1.2 Abundance, Baltic Sea

 Ringed seals
 Ringed seal (Pusa hispida ssp. botnica) breeding and moulting distribution is connected to sea ice
 in winter and spring. Their breeding success is highly dependent on sufficient ice-cover and
 overlaying snow layer through the breeding and nursing season. After breeding, ringed seals
 haul out scattered on ice during their annual moult, during which they have traditionally been
 surveyed using line-transect methodology. Favourable ice-conditions usually occur to some ex-
 tent every year in the Bothnian Bay, where the surveys have been carried out since 1988. The
 number of hauled out individuals during the surveys in largely normal ice-conditions has in-
 creased from the level of around 2000 in the first survey years to 9919 in 2018 (Figure 3), corre-
 sponding to an annual average population increase of 4.7% per year. The increase rate has been
 slightly higher in the latter half of the period (2004–2018: 5.6% per year). Both increase rates are
 clearly below the intrinsic natural rate in a situation without limiting factors. Anomalous survey
 results in 2013, 2014, 2015, 2017 and 2019 are considered to be a result of early ice-breakup. These
 datapoints have been excluded from the trend analysis, as they are not comparable to previous
 data. The phenomenon behind the anomalous results and the role of early ice-breakup are not
 fully understood, and besides their deviation from results from ‘normal’ ice years, there is a large
 amount of variation in counts among ‘anomalous’ ice years. The situation was discussed in the
 WGMME 2018 report (ICES, 2018).

 Figure 3. Trends of estimated numbers of ringed seals hauled out on sea ice during moult surveys in the Baltic.

 The ringed seal subpopulation in the Bothnian Bay is the largest in the Baltic. It has recovered
 from the hunting-derived population decline during the 20th century and subsequent reproduc-
 tive problems caused by environmental contaminants. However, recently raised hunting quotas
ICES | WGMME 2020 | 7

together with deteriorating ice-conditions increase the pressures on this subpopulation. It is con-
cerning that the deteriorating ice conditions affecting breeding success are also compromising
monitoring data, making impacts on abundance trends difficult to assess.
Southern ringed seal populations in the Baltic Sea: As a result of population decline during the 20th
century, the current Baltic ringed seal population is divided into four geographical subpopula-
tions.
In addition to the largest subpopulation in the Bothnian Bay, Baltic ringed seal subpopulations
can be found in the Gulf of Riga, the Finnish Archipelago Sea and the Gulf of Finland. The three
southern subpopulations are threatened with extinction, largely as a result of reduced breeding
success caused by reduced extent and duration of sea ice with less snow compared to historically
average winters. This was covered in more detail in the WGMME 2018 report (ICES, 2018).
While the warmer winters have recently challenged population monitoring of ringed seals in the
Bothnian Bay, traditional surveys have been impossible in the areas occupied by the southern
subpopulations in most years. The lack of continuous monitoring data provides a severely frag-
mented view of population development, although the few survey results indicate stable or de-
creasing trends. The status of the southern ringed seals as well as the roles of climate warming
and other factors on them was discussed in more detail in the WGMME 2018 report (ICES, 2018).
In 2019, no aerial surveys were carried out in the southern areas of ringed seal distribution due
to lack of ice. Instead, almost all known land haul outs in Väinämeri area in western Estonia were
surveyed from land or boat (I. Jüssi, personal communication). The result, a count of 884 ringed
seals, is in line with the recent results, a sea ice count (2013: 1077 ± 449, 2018: 1152) as well as a
two counts in ice-free conditions (2008: 1055, 2014: 1010, 2016: 834; Figure 3).
If ice conditions continue to deteriorate, alternative monitoring techniques need to be developed
for all the areas to survey the species in the near future.

Harbour seals
Harbour seals in the Baltic (HELCOM) area (Denmark and Sweden) are surveyed annually using replicate annual aer-
 ial surveys during the moulting period in August (

Figure 4). They are split into the four management units: Limfjord, Kattegat and the Danish Belt
Sea, Southwestern Baltic and Baltic Proper (Kalmarsund).
8 | ICES SCIENTIFIC REPORTS 2:39 | ICES

 LIMFJORD: The number of counted seals of the Limfjord harbour seal population has been fluc-
 tuating around 1000 individuals since the early 1990s and appears to have reached its carrying
 capacity. Genetic analyses indicate that the seals in the fjord originate in two different popula-
 tions, (1) the population originally inhabiting the fjord, before a storm opened the passage to the
 North Sea in 1825, and (2) seals from the Wadden Sea (Olsen et al., 2014). It is not known to what
 extent the seals from the Wadden Sea use the fjord for other purposes than hauling out and to
 which extent they interbreed with the native seal population. A proper assessment of the Lim-
 fjord harbour seals is contingent on clarification of these issues. In 2019, 1048 seals were counted
 in the fjord (Aarhus University).
 KATTEGAT and the DANISH BELT SEA: The harbour seal population in Kattegat and the north-
 ern Danish Belt Sea experienced two dramatic mass mortality events due to PDV when more
 than 50% of the population died in 1988 and about 30% in 2002 (Härkönen et al., 2006). Unusually
 large numbers also died in 2007, but the reason for this mortality remains unclear (Härkönen et
 al., 2007). In spring and summer of 2014, some seals appearing to show signs of pneumonia were
 found in Sweden and Denmark. Avian influenza H10N7 were isolated from a number of these
 seals (Zohari et al., 2014; Krog et al., 2015; Bodewes et al., 2016). The rate of increase between the
 two PDV epidemics was close to 12% per year, as in the adjacent North Sea populations. The
 annual population growth rate in Kattegat and the Danish Belt Sea remained close to 12% per
 year until 2010, but data suggest that it is levelling off, even if the increased mortality in 2014 is
 taken into account. This is likely to be caused by density-dependence, indicating that the popu-
 lation is approaching carrying capacity. Hauled-out population estimate was 9900 in 2019 (Aar-
 hus University, Swedish Museum of Natural History).
 SOUTHWESTERN BALTIC: Southwestern Baltic harbour seals were also hit hard by the PDV
 epidemics of 1988 and 2002. 1130 seals were counted in the area in 2019 (Galatius et al., 2019).
 Since 2002 and until 2011, the population grew with an average annual rate of 13%. From 2012
 to 2019, this rate has been reduced to 6%. This reduced growth may be the result of the popula-
 tion approaching carrying capacity of the area or may stem from competition with the increasing
 number of grey seals in the area.
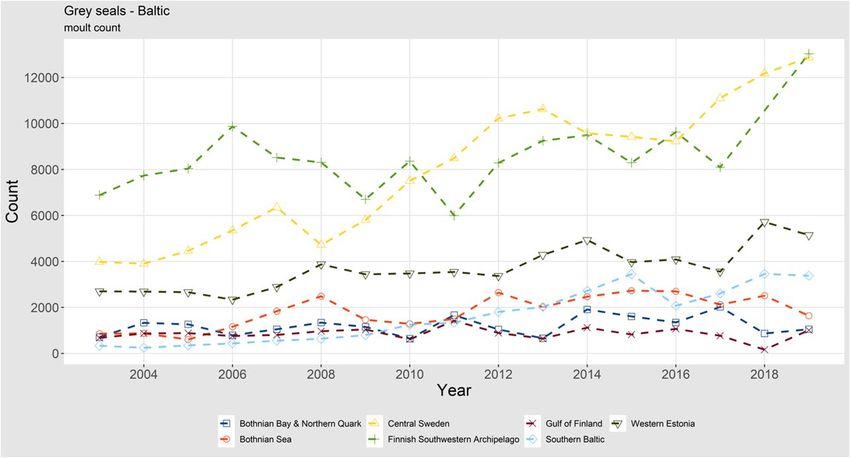
ICES | WGMME 2020 | 9

Figure 4. Trends of moult counts of harbour seals in the Kattegat and the Danish Belt Sea, Southwestern Baltic, Limfjord
and Kalmarsund.

Figure 5. Trends for results of moult counts of grey seals in subareas of the Baltic Sea.

BALTIC PROPER/KALMARSUND: The harbour seal population in Kalmarsund is genetically
divergent from adjacent harbour seal populations (Goodman et al., 1998) and experienced a se-
vere bottleneck in the 1970s when only some 30 seals were counted. Long-term isolation and
small numbers have resulted in low genetic variation in this population (Härkönen et al., 2006).
The population has increased annually by ca. 9% since 1975 and counted numbers amounted to
nearly 1800 seals in 2019 (Swedish Museum of Natural History).

Grey seals
Monitoring of the grey seal population in the Baltic Sea (Halichoerus grypus ssp. grypus) is based
on internationally coordinated censuses during the moulting season, covering the entire Baltic
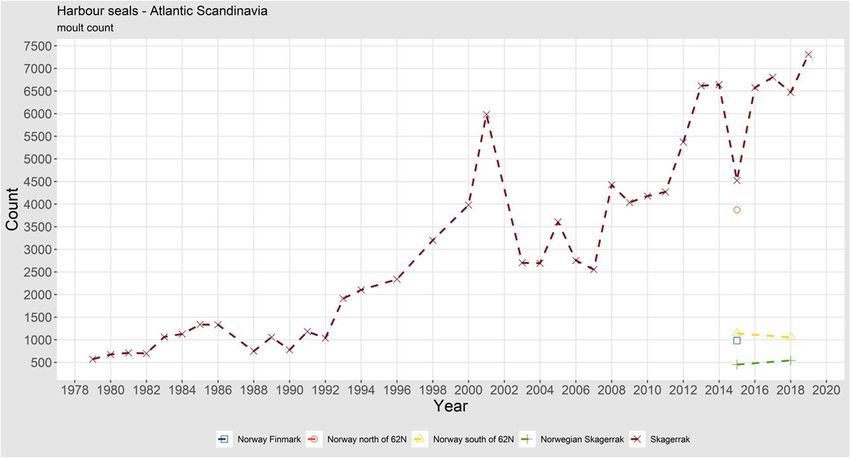
10 | ICES SCIENTIFIC REPORTS 2:39 | ICES

 moulting distribution of the species. The maximum number (not corrected for individuals in
 water) counted during 2–3 replicate surveys in each sea area is used for assessing abundance and
 trends. The grey seal population in the Baltic has been growing throughout the span of the coor-
 dinated surveys (starting in 2003) with the most pronounced growth in the southern and western
 parts of the moulting distribution (Figure 5). During recent years, however, the growth has
 shown signs of stabilising around 30 000 counted seals. Several factors alter the dynamics of the
 grey seal population. Hunting pressure (Kauhala et al., 2016) and bycatch (Vanhatalo et al., 2014)
 may have their roles in increased mortality, but decreasing birth rate and blubber thickness
 linked to decreasing food quality (Kauhala et al., 2016; 2017; 2019) can be signs of the population
 approaching the carrying capacity of the current Baltic Sea environment. However, in 2019,
 around 38 000 seals were counted, indicating that the population is still growing (HELCOM EG
 MAMA). Of the hauled-out population, around 80% were found in the core moulting area in the
 central Baltic proper (archipelagos of central Sweden, southwestern Finland and western Esto-
 nia). Outside the breeding and moulting seasons, grey seals travel and forage in other areas too.
 As the abundance of the population has increased, its range has expanded to also include the
 southern Baltic, where grey seals have been breeding regularly, although in small numbers, since
 2003 (Galatius et al., 2019). In recent years, pups are now also observed annually in Kattegat.
 (Galatius et al., 2019). This expansion has brought Baltic grey seals in contact with the Atlantic
 subspecies, and there are strong indications for hybridisation between the two groups based on
 microsatellite data from the southern Baltic (Fietz et al., 2016). The annual numbers of grey seals
 observed during moult surveys in different subareas of the Baltic are shown in Figure 4.

 1.1.1.3 Abundance, Atlantic Scandinavia

 Harbour seals
 The Skagerrak harbour seal population collapsed by roughly 50% during both mass mortality
 events due to PDV, in parallel with the Kattegat population, in 1988 and 2002. Before the two
 collapses, the population increased at high rates, indicating no factors retarding the growth. Af-
 ter the latter collapse, the rate of increase has been lower, which may indicate the population
 approaching carrying capacity. The counted number of harbour seals along the eastern coast of
 Skagerrak (starting from the eastern half of the Oslo Fjord in the north) was at the level of 7300
 in 2019 (not corrected for seals at sea during the surveys; Figure 6).
 Along the northern coast of Skagerrak (west of the Oslo Fjord), the harbour seal abundance (an-
 imals counted during moult) has decreased from 680 in 2008–2015 to 543 in 2016–2018. South of
 62° N the harbour seal abundance has increased from 860 in 2011–2015 to 1054 in 2018 (Nilssen,
 and Bjørge, 2019). Counts in the northern Norwegian areas will be finished in 2021.
ICES | WGMME 2020 | 11

Figure 6. Trends of moult counts of harbour seals in the Skagerrak and Norwegian coast.

Grey seals
Since the early 1960s to 2010, the numbers of grey seals have increased in Norway and, based on
pup production estimates from 2006 to 2008, a total population (including pups) of 8740 (95%
CI: 7320–10 170) animals in 2011 was estimated by modelling (Øigård et al., 2012). However, a
significant reduction in pup production has been observed between 62°N and 68°N in Trøndelag
and Nordland counties (mid-Norway) in 2014–2018 (Nilssen and Bjørge, 2017), while in other
areas along the coast pup production has been stable (Figure 7). A new survey was carried out
in mid-Norway in 2018, which confirmed that pup production was low. The significant reduc-
tion in pup production in mid-Norway suggests a dramatic decline in the Norwegian grey seal
abundance to a total population of 3850 (95% CI: 3504–4196) individuals, when scaling pup pro-
duction using a multiplier of 5.7 (Nilssen et al., 2019). The most probable reason behind the re-
duced pup production is high bycatches of grey seals in gillnet fisheries for mainly monkfish,
but also in cod gillnets.
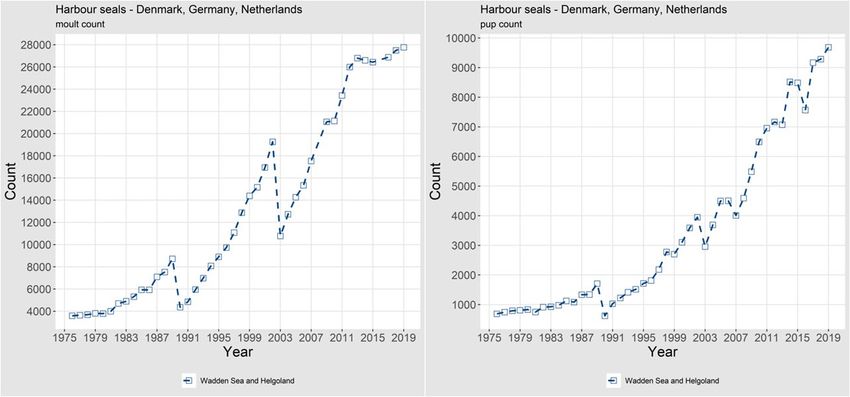
12 | ICES SCIENTIFIC REPORTS 2:39 | ICES

 Figure 7. Trends of counts of grey seal pups in Norway.

 1.1.1.4 Abundance, Continental coast, Wadden Sea to France

 Harbour seals
 WADDEN SEA (Denmark, Germany, the Netherlands): Harbour seal surveys in the Wadden Sea
 are coordinated among Danish, German and Dutch scientists. Brasseur et al. (2018) investigated
 a 40-year time-series (1974–2014) of counts of harbour seals in the Wadden Sea to study under-
 lying processes of recovery and demonstrated the influence of historical regional differences in
 management regimes on the recovery of this population. Mortality rates were close to 50% dur-
 ing both PDV epidemics in 1988 and 2002, and between and after the epidemics, population
 growth rate has been close to the maximum intrinsic exponential growth rate of harbour seals at
 12–13%. In 2019, a hauled-out population of almost 27 800 harbour seals was counted (Galatius
 et al., 2019).
 Since 2013, the trend has abruptly changed and growth in moult counts has levelled off, although
 pup counts continue to increase (Figure 8). Compared to the total counts, pup production based
 on counts represents almost 40% of the moult counts, almost 10 000 pups. The absence of subse-
 quent growth in moult counts is still to be explained. Either mortality in this population is equiv-
 alent to the pup production or a substantial change in haul out behaviour has occurred which
 could affect the survey results. Either way, there is a clear indication of a recent change in the
 population.
ICES | WGMME 2020 | 13

Figure 8. Trends of counts of moulting harbour seals (left) and harbour seal pups (right) in the Wadden Sea.

Results from Brasseur et al. (2018) indicate interesting exchanges between the different regions
of the Wadden Sea with most important pup production in the German states, while after the
breeding period seals redistribute throughout the area. As the entire Wadden Sea area is moni-
tored synchronously, lack of growth is unlikely to be due to a redistribution of the animals.
SOUTHERN NETHERLANDS, BELGIUM and FRANCE. The growing harbour seal colony in
the Dutch Delta area in the southern Netherlands is thought to be a colony of the Wadden Sea
population as there are not enough local births (119 pups in 2018) to explain its growth (Figure
9). Moreover, although systematic stranding data lack, an average of 80 dead harbour seals are
reported annually in the area. Telemetry data show regular exchange between this area and the
Wadden Sea. Over 950 animals were counted in the Dutch Delta area in 2017 (Arts et al., 2019),
and numbers have been growing at almost 15% annually since 2002. A similar exchange might
occur with the French colonies, although in France local births and exchange with southern Eng-
lish colonies might also play a role in the growth. In 2019, seal counts amounted to 1124 harbour
seals in the colonies on the French coast from Normandy to the Belgian border (data compiled
by Poncet S.; data owners: Office Français de la Biodiversité, SYMEL CDL, ADN, GDEAM-62,
GMN, Bretagne Vivante, Picardie Nature, Réserve naturelle nationale du Domaine de Beauguil-
lot (PNRMCB), Syndicat Mixte Baie du Mont-Saint-Michel, Maison de l'estuaire, CMNF, RNN
des Sept-Iles / LPO).
In Belgium, there are no true seal colonies, however tens of animals strand annually along the
coasts (48 in 2019, dead and dying, and excluding seals that were taken to a rehabilitation facil-
ity). The number of harbour seals observed hauling out in Belgium, especially in the port of
Nieuwpoort, is rising and seals are seen daily. In 2018, 15 harbour seals were observed hauled
out (exceeding previously recorded numbers). These are frequently joined by one or two juvenile
grey seals. As in previous years, multiple animals were injured by fishing gear including hooks
and rope (RBINS unpubl.; Haelters et al., 2019).
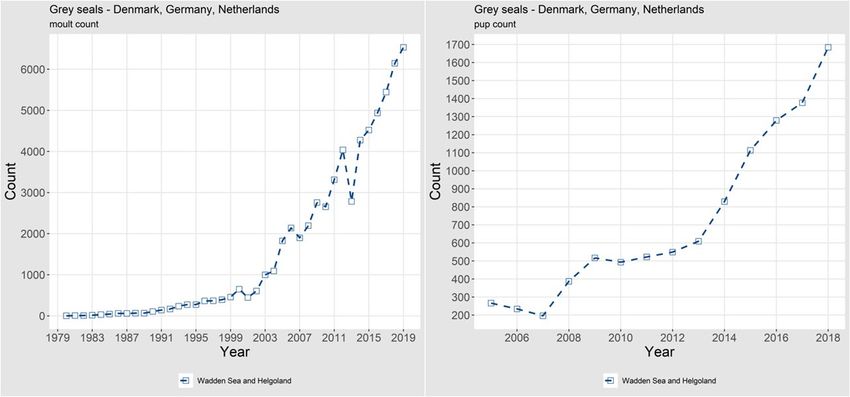
14 | ICES SCIENTIFIC REPORTS 2:39 | ICES

 Figure 9. Trends of counts of moulting harbour seals and harbour seal pups in the Dutch Delta and French Coast.

 Grey seals
 After centuries of practical absence, grey seals have shown a remarkable recovery in the Wadden
 Sea area, where more than 6500 were counted during the moult in 2019. In the same area, 1684
 pups were counted in the winter of 2018/2019 (Cremer et al., 2019; Figure 10). Partially fuelled by
 immigration from the UK (Brasseur et al., 2015), colonies started in Germany and the Netherlands
 in the 1970s and have since expanded to Denmark. Up until now the majority of the grey seals
 are counted in the Netherlands (>70%), while recently counts in the German Wadden Sea (espe-
 cially Helgoland and the Kachelotplate) have grown in importance (>20%), as have the numbers
 in Denmark (>5%). During the breeding season, the proportion of pups born in Germany is pro-
 portionally more important (almost 40%) compared to the moult counts.

 Figure 10. Trends of moulting grey seals and grey seal pups in the Wadden Sea.

 The difference in relative distribution might be indicative of the importance of the exchange with
 the UK population. Possibly seals from the UK use the Dutch area more than other parts of the
 Wadden Sea.
 As with harbour seals, grey seal numbers have been growing in the Dutch Delta area, despite
 the complete lack of births, reported dead grey seals amounted to ~40 animals per year. This
 suggests a continuous exchange between this area, the Wadden Sea and the UK, where numbers
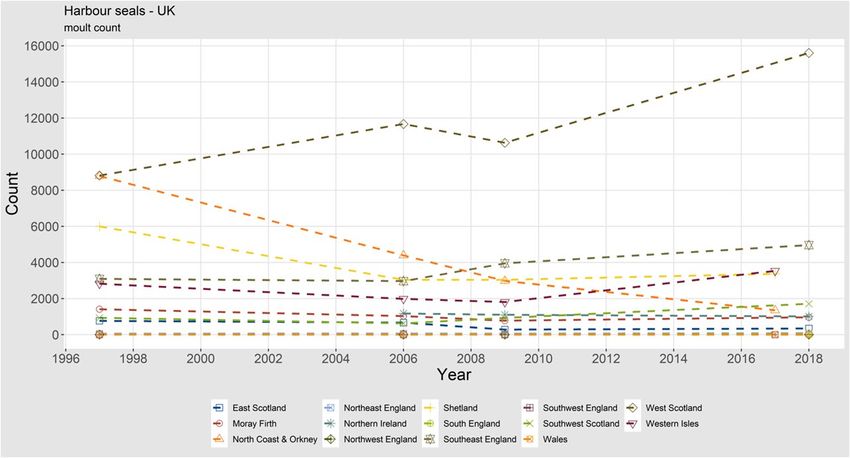
ICES | WGMME 2020 | 15

are growing. In 2018, a maximum count of 1269 grey seals in the Delta area was reported (Arts
et al., 2019, Figure 11). In France, there are also breeding colonies, and numerous exchanges with
the UK and the Wadden Sea have also been recorded using telemetry. Occasionally few grey
seals (2) are seen to haul out on the Belgian coasts. The maximum count along the French coasts
amounted to 750 in 2019, and on the breeding sites, 72 pups were observed (Figure 11). (data
compiled by Poncet S.; data owners: Office Français de la Biodiversité, SYMEL CDL, ADN,
GDEAM-62, GMN, Bretagne Vivante, Picardie Nature, Réserve naturelle nationale du Domaine
de Beauguillot (PNRMCB), Syndicat Mixte Baie du Mont-Saint-Michel, Maison de l'estuaire,
CMNF, RNN des Sept-Iles / LPO).

Harbour seal
Harbour seals in the UK are counted annually during the moult period, although not all haul
outs are surveyed annually. Therefore, data are collated for multiyear survey periods during
which all large haul outs are surveyed, with only the most recent count for each haul out in-
cluded.

Figure 11. Trends of moult counts of grey seals (left) and grey seal pups (right) in the Dutch Delta Area and France.

1.1.1.5 Abundance, UK
The most recent August (moult) counts of harbour seals at haul out sites in the UK are presented
for each country in Table 4. These data show an increasing trend for harbour seal counts within
England and Wales, and a stable trend for Northern Ireland. There has been a generally decreas-
ing trend for Scotland until the most recent survey period, where the data show a marked in-
crease in harbour seal counts in 2014–2018. Overall, the UK total counts have increased since the
last survey period.
Thompson et al. (2019) reviewed trends of harbour seal abundance in the UK and found that total
current abundance was similar to estimates from the late 1990s at slightly more than 30 000 seals
counted. Behind this overall result, there were large declines in some seal management units
(SMUs) and increases in others. Populations in the southeast (southeast and northeast England
SMUs) have shown continuous growth (except for the phocine distemper virus epidemics of
1988 and 2002), populations in the northwest (west Scotland, Western Isles and southwest Scot-
land SMUs) have been stable or increased, while populations in the northeast (East Scotland,
Moray Firth, North Coast and Orkney, and Shetland SMUs) have seen large declines. Notably
populations in the North Coast and Orkney and in East Scotland SMUs are continuing to decline
and there is research underway in the UK to determine the cause(s). Continued declines are no
longer evident in Shetland or the Moray Firth, however there is no indication of recovery. These
regional trends are more visible in Figure 12.
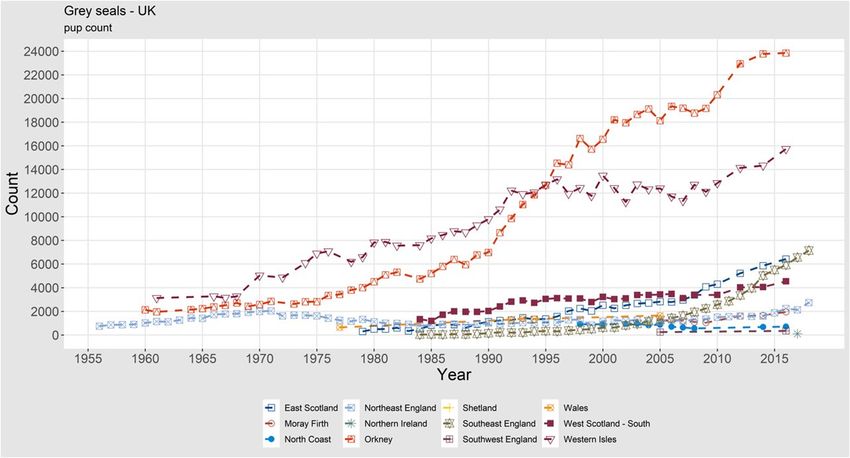
16 | ICES SCIENTIFIC REPORTS 2:39 | ICES

 Table 4. The most recent August counts of harbour seals at haul out sites in the UK by seal management unit, compared
 with three previous survey periods: 1996–1997, 2000–2006 and 2007–2009. Details of sources and dates of surveys used
 in each compiled regional total are given in SCOS (2019).

 REGION / COUNTRY HARBOUR SEAL COUNTS FOR EACH SURVEY PERIOD

 2014–2018 2007–2009 2000–2006 1996–1997

 Scotland Total 26 864 20 430 23 391 29 514

 England and Wales Total 5095 4035 3051 3160

 Northern Ireland Total 1012 1101 1176 *

 UK Total 32 971 25 566 27 618 32 674*

 * No data available for Northern Ireland for 1996–1997.

 Figure 12. Trends of moulting harbour seals in the subareas of the UK.

 Grey seal
 In the UK, grey seal population trends are assessed from the counts of pups born during the
 autumn breeding season, when females congregate on land to give birth. The most recent aerial
 surveys of the principal Scottish grey seal breeding sites were conducted in 2016. Results from
 the most recent surveys from each subarea are presented in Table 2. A new pup production esti-
 mate including the latest counts from eastern England is not currently available. However, the
 results from the 2016 surveys together with the 2016 estimates from the annually ground counted
 sites in eastern England, and adding in an additional 6700 pups estimated to have been born at
 less frequently surveyed colonies in Shetland and Wales as well as other scattered locations
 throughout Scotland, Northern Ireland and South-west England, resulted in an estimate of
 65 400 (95% CI 57 800–71 800) pups (SCOS, 2019). Trends of grey seal pup counts from subareas
 of the UK are shown in Figure 13. This figure highlights the continued increase in pup counts in
 most areas, most notably in the Western Isles and Southeast England. Note that this figure in-
 cludes estimates for Southwest England, Northern Ireland and Wales.
 Thomas et al. (2019) used a Bayesian state–space model to estimate UK grey seal abundance from
 1984 to 2010, using pup production estimates and an independent count of hauled-out seals from
ICES | WGMME 2020 | 17

2008. Growth in the Inner and Outer Hebrides and Orkney began to slow in the 1990s and
seemed to have reached carrying capacity in 2010, while the colonies in the North Sea were still
growing exponentially in 2010. A total abundance of 116 100 (95% CI 98 400–138 600) seals aged
one year or more was estimated for 2010. SCOS (2019) reported that the population model pro-
vided an estimate of 152 800 (95% CI 135 300–173 800) UK grey seals (1+ aged population) in
2017.

1.1.1.6 Abundance, North America

Harbour seals
In 2001, the harbour seal abundance in Maine was estimated at almost 100 000 individuals (Gil-
bert et al., 2005). The growth of the harbour seal population along the US east coast is currently
being reviewed, the results of this analysis should be available for the WGMME 2021 report.

Grey seals
Along the North American east coast, grey seal population trends are assessed from the counts
of pups born during the breeding season. In 2016, the pup production on Sable Island accounted
for 85% of the estimated total number of pups born in Canadian waters, with 11% in the Gulf of
St Lawrence and 4% along the coast of Nova Scotia. The total population estimate in 2016 was
lower than in 2014, after adjustment for the sex ratio in the population and other changes to the
population model (Hammill et al., 2014; 2017). The total estimated Canadian grey seal population
in 2016 was 424 300 (95% CI=263 600–578 300), with a Sable Island and coastal Nova Scotia herd
of 380 300 (95% CI=234 000–517 200), and 44 100 (95% CI=29 600–61 100) for Gulf of St Lawrence
herd.

Figure 13. Trends of pup counts of grey seals in subareas of the UK.

A smaller, but growing number of grey seal pups are born along the US east coast in Maine and
Massachusetts. The number of pups born at US breeding colonies can be used to approximate
the total size (pups and adults) of the grey seal population in US waters, based on the ratio of
total best population size to pups in Canadian waters (4.3:1). Using this approach, the population
estimate in US waters is 27 131 (CV=0.19, 95% CI: 18 768–39 221) animals in 2016 (Hayes et al.,
18 | ICES SCIENTIFIC REPORTS 2:39 | ICES

 2017). There is uncertainty regarding this abundance level in the US because life-history param-
 eters that influence the ratio of pups to total abundance in this portion of the population are
 unknown. It also does not reflect seasonal changes in stock abundance in the northeast region
 for a transboundary stock. For example, roughly 24 000 seals were observed in southeastern Mas-
 sachusetts alone in 2015 (Pace et al., 2019), and 28 000–40 000 grey seals were estimated in south-
 eastern Massachusetts in 2015, using correction factors applied to seal counts visible in Google
 Earth imagery (Moxley et al., 2017). Observed counts of grey seal pups from the North American
 east coast are shown in Figure 14. The grey seal pup counts from the US coast in 2008–2014 do
 not include Seal Island, which is the 2nd largest breeding site, in theory a few hundred pups
 would have been missed. The most recent grey seal pup count for the US East Coast reported
 6253 pups in 2018-2019 across Muskeget Island, Nomans Island, Green Island, Great Point, Mon-
 omoy Island, Matinicus Rock, Seal Island, Wooden Ball and Mt. Desert Rock (Wood et al., 2019).

 Figure 14. Trends of pup counts of grey seals along the east coast of North America.

 1.1.1.7 New information on seal distribution
 Russell et al. (2019) analysed time trends of grey seal pup production in UK colonies. Pup pro-
 duction has levelled off since around 2000 and was approaching an asymptote of around 40 000
 born annually in 2010. However, behind this overall trend, colonies in the North Sea were still
 growing exponentially. Even in areas with stagnating growth, some colonies (often newer colo-
 nies) continued growing while other (often older colonies designated as Special Areas of Con-
 servation; SACs) showed declines. Colonies on islands that have become available to the seals
 more recently may be more conducive to higher pup survival, resulting in higher site-specific
 growth in this philopatric species. This highlights the importance of monitoring extensively in
 contrast to limited monitoring of key sites (particularly SACs). Moreover, results demonstrate
 that newer colonies may be very important for the population dynamics of pinnipeds.
 In the southern Baltic, grey seals were more likely to forage in deeper, colder and more saline
 waters, while active fishing gear also had a pronounced positive effect on foraging activity. This
 was demonstrated by Van Beest et al. (2019) using a hidden Markov model on dive data and GPS
 positions of tagged grey seals to investigate movement in relation to behaviour states.
 Planque et al. (2020) compared horizontal and vertical approaches of identifying seal foraging
 areas in the Channel from GPS locations and dive data of eight grey seals and nine harbour seals.
ICES | WGMME 2020 | 19

The two approaches evidenced similar foraging hotspots at the population level when pooling
all individuals of the same species, but there was also substantial variation between the two ap-
proaches at the individual level. Planque et al. (2020) highlighted how the comparison of foraging
areas detected from horizontal and vertical approaches can reveal inter-individual differences in
foraging strategies.

1.2 Cetacean abundance and distribution
1.2.1 Passive acoustic monitoring (PAM) of harbour porpoises in the
 Baltic Sea
WGMME has reported on passive acoustic monitoring (PAM) of harbour porpoises (Phocoena
phocoena) using C-PODs in Denmark, Finland, Germany, Poland and Sweden in 2018–2019 (ICES,
2018; 2019). The following new information can be added:
DENMARK: The Ministry of Environment and Food are funding the national monitoring of har-
bour porpoises in Denmark and they have initiated a monitoring program for the Baltic harbour
porpoises in the waters around Bornholm. The monitoring is carried out by Aarhus University.
Ten C-POD stations, positioned on the original SAMBAH locations, were deployed for one year
from June 2018. The plan is to repeat this monitoring again in 2022–2023 or during SAMBAH II.
The waters around Bornholm are believed to be inhabited by a mix of the Belt Sea population
and the Baltic Proper population. The results show that 1) all stations did at some point detect
porpoises, 2) the stations further west had more detections, 3) the annual average of porpoise
positive minutes for all stations combined were higher in 2018–2019 (0.07) compared to during
SAMBAH (2011–2013) (0.03), and 4) we found more detections during summer in 2018–2019
compared to SAMBAH (Sveegaard et al., 2019; Sveegaard, 2020).
In the Belt Sea population area, harbour porpoise SACs are in turn monitored for one year using
PAM. In 2017–2018, Kalundborg Fjord and the Great Belt were monitored. In comparison to pre-
vious monitoring periods (2012, 2014 and 2017–2018) a higher variation was found in porpoise
detections between stations and seasons, but overall the seasonal variation was similar between
the three monitoring periods. Furthermore, an overall increase in porpoise detections was found
in the Great Belt from 2012 to 2018, whereas in Kalundborg Fjord the highest levels were found
in 2014 compared to 2012 and 2017–2018 (Sveegaard et al., 2019).
FINLAND: The Ministry of Environment and the Åland Government has granted funding to
Turku University of Applied Sciences to continue the monitoring at least until autumn 2020.
New data show similar detection rates as in previous years, indicating that harbour porpoises
are present on a regular and predictable basis in the monitored area, however in small numbers.
An update on the status of harbour porpoise in the northern and eastern Baltic Sea is planned to
be published in near future.
GERMANY: The long-term monitoring project TopMarine, where PAM in the Baltic Sea is con-
ducted by the German Oceanographic Museum, was continued in 2019 and will end in May 2021.
In 2020, C-PODs will be deployed at an additional ten stations (same positions as in 2018). At a
subset of these, SoundTraps will also be deployed. The acoustic data will be compared to visual
data collected by aerial surveys using digital systems and observers, collected in the same area
and during the same period. In 2018, only one sighting during aerial survey was made, therefore
it was not possible to compare visual and acoustic data. The project is funded by the Federal
Agency for Nature Conservation.
POLAND: No PAM for porpoises was carried out in 2019.
20 | ICES SCIENTIFIC REPORTS 2:39 | ICES

 SWEDEN: The monitoring carried out by the Swedish Museum of Natural History (SMNH),
 funded by the Swedish Agency for Marine and Water Management, will continue at least until
 autumn 2020. In the Baltic Sea, 11 previous SAMBAH stations and one previous BIAS station
 (www.bias-project.eu) are monitored. In 2019, the national monitoring programme was ex-
 tended to also include 14 stations in five Natura 2000 sites in the Kattegat Sea. In addition to this,
 SMNH are also processing data collected by Blekinge County Administrative Board at up to 15
 stations located in coastal waters in southeast Sweden since 2016. Data on detection rates are
 uploaded on an annual basis to a publicly accessible database, Sharkweb, hosted by the Swedish
 Meteorological and Hydrological Institute (https://sharkweb.smhi.se/). In 2020, an analysis of the
 detection rates at the previous SAMBAH stations will be carried out to investigate a possible
 change from 2011–2013 (SAMBAH data) to 2017–2019.
 In June 2019, a concept note for a SAMBAH II project was submitted to the EU LIFE programme.
 The application included partners in all EU Member States around the Baltic Sea and HELCOM
 as project coordinator, and the application process was led by the SMNH. The concept note was
 approved by the Commission in October 2019, and the project consortium was invited to submit
 a full application in February 2020. However, due to problems with securing the national co-
 financing in some countries, the application had to be withdrawn. The countries are currently
 investigating the options for the national co-financing, which need to be secured before a new
 concept note may be submitted in June 2020.

 1.2.1.1 Visual monitoring and strandings
 BELGIUM: Royal Belgian Institute for Natural Sciences (RBINS) completed two aerial surveys
 in 2019. Observed harbour porpoise densities in June and August were normal, with on average
 0.7 and 0.6 animals/km² respectively.
 As in 2018, bottlenose dolphins (Tursiops truncatus) were regularly observed in Belgian waters.
 In October, a group comprising 20+ animals, including several calves, was observed. Most other
 observations concerned solitary animals, often very sociable towards humans, and staying in
 small areas for months. On November 10th, a minke whale (Balaenoptera acutorostrata) was filmed
 in the Norther wind farm.
 The number of stranded harbour porpoises in 2019 (n = 53) was quite low (Figure 15) with most
 of the stranded animals in an advanced state of decomposition (63%). Porpoise strandings were
 lower than average throughout the year, except for September, which showed a marked peak in
 strandings.
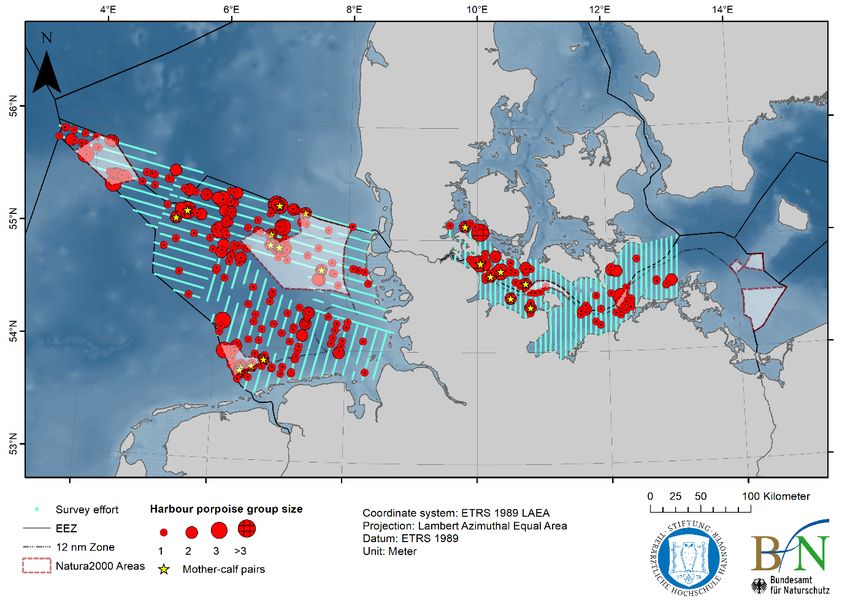
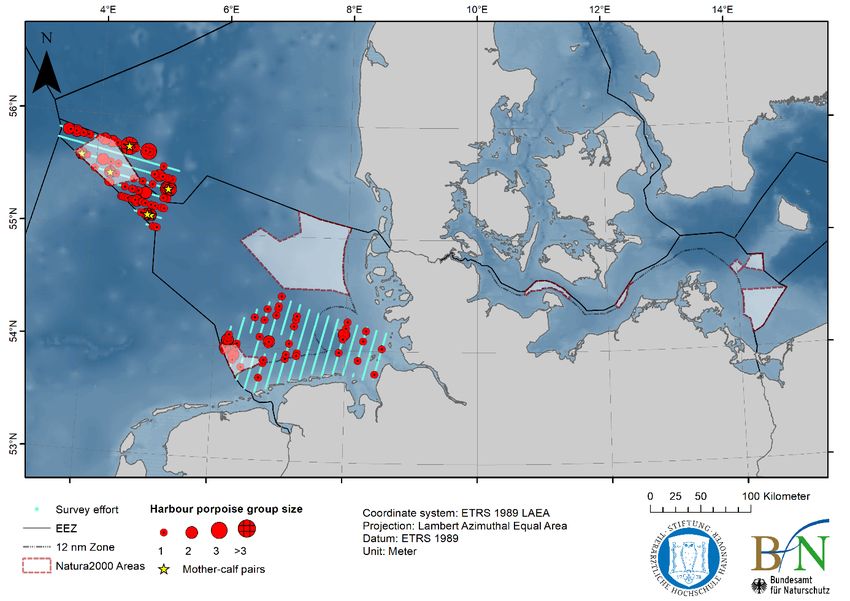
ICES | WGMME 2020 | 21

 150
 Number of stranded porpoises

 125

 100

 75

 50

 25

 0
 1990
 1991
 1992
 1993
 1994
 1995
 1996
 1997
 1998
 1999
 2000
 2001
 2002
 2003
 2004
 2005
 2006
 2007
 2008
 2009
 2010
 2011
 2012
 2013
 2014
 2015
 2016
 2017
 2018
 2019
 1970 to 1989

Figure 15. Strandings of harbour porpoises in Belgium recorded annually from 1990 to 2019 (plus total for 1970–1989).
Data from Haelters et al., (2019) and RBINS (unpubl.).

DENMARK: A new population abundance survey (MiniSCANS-II, aerial survey only) for the
Belt Sea porpoise population will be conducted in June–July 2020, in collaboration with Germany
and Sweden. Results from monitored SACs in 2018 show that for the North Sea, the number of
porpoises within the southern North Sea (abundance: 2013 animals (95% CI: 954–3186), density:
0.38 animals /km2 (95% CI: 0.18–0.60) were similar to 2017 (abundance: 1918 (95% CI: 976–2947)),
but overall from 2011 until today, a decreasing trend was found. In Skagerrak, the abundance
estimate was 5323 porpoises (95% CI: 2415–9232), density: 0.44 animals /km2 (95% CI: 0.20–0.76)
which is approximately half the abundance estimated in 2017 (the only year with comparable
data).
Denmark is not collecting a sufficient amount of stranded and bycaught animals to monitor blub-
ber thickness (as an indicator of health) or to determine thresholds for blubber thickness per
species, sex, age and regions.
GERMANY: In spring 2019, a total of 145 harbour porpoise groups (172 animals, seven calves)
were recorded along 1516 km of effort in three aerial survey strata in the North Sea (Figure 16).
In summer 2019, a total of 245 harbour porpoise groups (318 animals, including 12 calves) were
observed along 3694 km of effort in all eight study areas in the North Sea (Figure 16). Two single
minke whales were observed in May near the Dogger Bank.
The Baltic Sea was surveyed in four aerial survey strata (Mecklenburg Bay West and East, Kiel
Bight, and Fehmarn) in summer 2019 and a total of 79 harbour porpoise groups (102 animals,
whereof seven calves) were sighted along 2476 km of effort (Figure 16).
22 | ICES SCIENTIFIC REPORTS 2:39 | ICES

 a

 b

 Figure 16. Survey effort and harbour porpoise sightings during aerial surveys in the German North and Baltic Sea during
 a) spring 2019 and b) summer 2019. Harbour porpoise group sizes are indicated using group size dependent red circles;
 yellow stars mark mother-calf pairs; blue lines indicate covered transect lines (i.e. survey effort).
ICES | WGMME 2020 | 23

Effort corrected density and abundance estimates were generated using a bootstrapping ap-
proach, also correcting for availability and perception bias. In spring 2019, the German North
Sea was not entirely covered, allowing abundance and density estimates for individual areas
only; survey block ‘Dogger Bank (A)’ with 7707 (95% CI: 4005–12 405), at 1.36 (0.71–2.20) ani-
mals/km²; ‘Borkum Reef Ground (F)’ with 3315 (95% CI: 1605–6150) animals, at 0.54 (0.26–1.01)
animals/km² and ‘Weser-Elbe estuary (E)’ with 887 (95% CI: 296–1981) animals, at 0.20 (0.05–
0.45) animals/km².
In summer 2019, the German North Sea was entirely covered, the total abundance was estimated
at 27 752 (95% CI: 20 151–39 690; CV=0.17) harbour porpoises and an average density of 0.68 (95%
CI: 0.50–0.98) animals/km² (Table 5). The Baltic Sea study area (areas I-L), was largely covered,
leading to a total abundance estimate of 3749 (95% CI: 2549–5225; CV=0.18) harbour porpoises
and an average density of 0.29 (95% CI: 0.2–0.4) animals/km² for summer 2019 (Table 5).

Table 5. Summary of effort corrected, bootstrapped density and abundance estimates for summer 2019 in the German
North and Baltic Sea. N = estimated abundance of harbour porpoises; N95%CI = 95% confidence interval around N; D =
density estimate of harbour porpoises in ind./km²; D95%CI=95% CI around D; s = average group size.

 area season N N95% CI D D95% CI ŝ

 Dogger Bank (A) summer 2019 4597 2219 – 7439 0.81 0.39 - 1.32 1.26

 Offshore I (B) summer 2019 4809 2807 – 7974 1.22 0.71 - 1.79 1.44

 Sylt Outer Reef West (C) summer 2019 5879 3002 – 11594 0.98 0.50 - 1.93 1.54

 Sylt Outer Reef East (D) summer 2019 2465 926 – 4707 0.36 0.13 - 0.68 1.20

 Weser-Elbe estuary (E) summer 2019 1122 191 – 2473 0.26 0.04 - 0.57 1.08

 Borkum Reef Ground (F) summer 2019 5992 3432 – 9953 0.98 0.56 - 1.63 1.23

 OWF (G) summer 2019 2337 1098 – 3653 0.57 0.27 – 0.90 1.19

 Offshore II (H) summer 2019 551 203 – 1068 0.16 0.06 – 0.31 1.00

 All North Sea areas summer 2019 27752 20151 - 39690 0.69 0.50 – 0.98 1.30

 Kiel Bight (I) summer 2019 1649 1043 - 2471 0.53 0.33 – 0.79 1.41

 Fehmarn (J) summer 2019 564 84 – 1232 0.16 0.02 - 0.34 1.21

 Mecklenburger Bay West (K) summer 2019 1164 660 – 1778 0.37 0.21 – 0.57 1.26

 Mecklenburger Bay East (L) summer 2019 372 134 – 687 0.12 0.04 - 0.23 1.10

 All Baltic Sea areas: summer 2019 3749 2549 - 5225 0.29 0.20 – 0.41 1.29

FRANCE: Two small-scale aerial surveys are currently being carried out in France: CAPECET
and SPEE. Both surveys cover the Bay of Biscay (Figure 17). CAPECET aims to investigate pat-
terns of distribution of small delphinids during the winter months. In particular, CAPECET sur-
veys are carried out when large numbers of strandings are occurring on the Atlantic seaboard.
SPEE is a smaller survey that aims to document seasonal patterns of marine mammal abundance
and distribution within a recently designated MPA, the ‘Parc Natural Marin de l’Estuaire de la
Gironde et de la mer des Pertuis’. Since 2019, four SPEE surveys have been carried out, with one
survey per season.
24 | ICES SCIENTIFIC REPORTS 2:39 | ICES

 Figure 17. Design of the SPEE and CAPECET surveys.

 Lambert et al. (2019) reported on the impact of recording seabird sightings during aerial surveys
 on the estimation of cetacean abundance in the Bay of Biscay and the Channel. A double-platform
 experiment was carried out in the Bay of Biscay and English Channel during the SCANS-III sur-
 vey in 2016. Two observation platforms using different protocols were operating on board a sin-
 gle aircraft: the reference platform (SCANS), targeting cetaceans, and the ‘Megafauna’ platform,
 recording all the marine fauna visible at the sea surface. The data collected were analysed to
 assess whether observers who were instructed to record seabirds (using strip-transect method-
 ology) would collect data of lower quality on cetaceans. A decreased perception of cetaceans
 after seabird observation within 30 sec prior to a cetacean sighting was found. This small-scale
 effect had no effect on the density estimates, which were similar for the two protocols. There was
 no evidence of lower performance regarding small cetacean population monitoring for the multi-
 target protocol in the study area, characterized by moderate cetacean densities and small spatial
 overlap of cetaceans and seabirds, any extrapolation to other areas or time period requires cau-
 tion.
 Peltier et al. (2019) examined stranding data, including photography and necropsy reports, col-
 lected between 1972 and 2017 in mainland France to provide a comprehensive review of con-
 firmed collision records of large whales. A total of 51 ship-strike incidents were identified: with
 an increase from seven between 1972 and 1982, to 22 between 2005 and 2017.
 Between 1 February and 31 March 2017, 793 stranded cetaceans (84% of which were common
 dolphins) were found along the French Atlantic seaboard. Most common dolphins showed evi-
 dence of entanglement in fishing gear. See ToR C for further information.
 NETHERLANDS: In July 2019, aerial surveys to estimate the abundance of harbour porpoises
 on the Dutch Continental Shelf were conducted (Geelhoed et al., 2020). These surveys followed
You can also read