2018 Water quality prediction of mining waste facilities based on predictive models
←
→
Page content transcription
If your browser does not render page correctly, please read the page content below
Geological Survey of Finland                                  2018
Water quality prediction of mining waste facilities
based on predictive models

Muhammad Muniruzzaman, Päivi M. Kauppila and Teemu Karlsson

GTK Open File Research Report 16/2018
GEOLOGICAL SURVEY OF FINLAND

                            Open File Research Report 16/2018

            Muhammad Muniruzzaman, Päivi M. Kauppila and Teemu Karlsson

           Water quality prediction of mining waste facilities
                           based on predictive models

Unless otherwise indicated, the figures have been prepared by the author of the publication.

        Front cover: Waste rock pile at the closed Hannukainen mine site in 2009.
                               Photo: Päivi Kauppila, GTK.

                                Layout: Elvi Turtiainen Oy

                                        Espoo 2018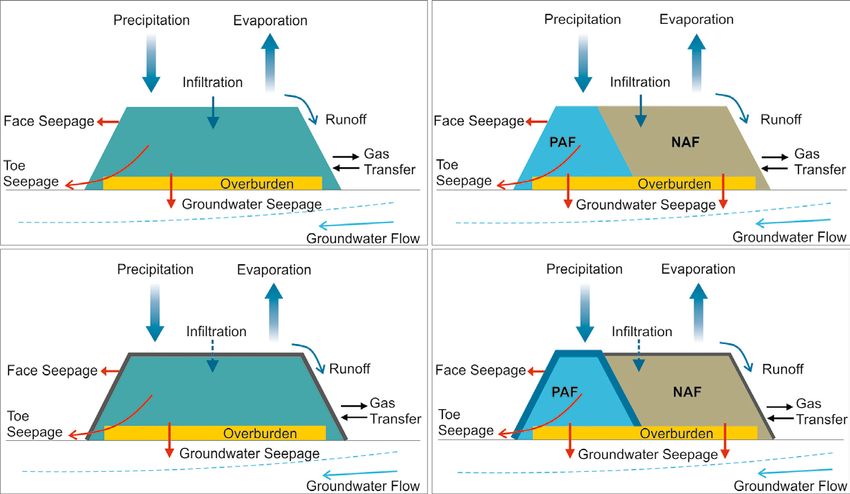
Muniruzzaman, M., Kauppila, P. M. & Karlsson, T. 2018. Water quality prediction of
    mining waste facilities based on predictive models. Geological Survey of Finland, Open File
    Research Report, 65 pages, 12 figures and 13 tables.

    In mining activities, management of mine wastes is a critical issue as improper waste
    disposal often results in liability for mining operators with the risk of financial conse-
    quences. Of primary concern is the low quality drainage from mine waste that leads to
    adverse effects on the surrounding environments and ecosystem. This drainage usu-
    ally results from the weathering of mine wastes, and in particular sulphide-rich waste
    deposits that are disposed after extracting the valuable metals, upon their exposure to
    the atmosphere. In the last decades, extensive research efforts have been dedicated to
    understand the acid generation processes as well as to accurately quantify and predict
    acid mine drainage, which has led to the development of various prediction techniques.
    This report reviews all the major processes that influence drainage quality in mine waste
    dumps. In particular, this review includes geochemical processes concerning acid genera-
    tion and neutralization mechanisms, microbiological activity and its relevance on mineral
    weathering reactions, electrochemical processes, heat transport mechanisms, water flow
    and solute transport, and gas transport processes. Additionally, existing water quality
    prediction methods based on laboratory and field scale tests, including mineralogical,
    physical, and geochemical characterisation, static tests, chemical extractions, leaching
    tests, and kinetic tests, are reviewed. Moreover, this report also includes a comprehen-
    sive review of all the available predictive modelling tools, including general modelling
    principles, different model types based on their formulation, and available computer
    codes, in mining environmental simulations. The scope and capability of predictive
    models are demonstrated by presenting three different published case studies from the
    literature focusing on waste rock pile and tailings systems. Additionally, this document
    also presents the important aspects that are relevant to predictive modelling, such as
    major sources of uncertainties and challenges in numerical modelling, limitations in
    model calculations, scaling factors for model input parameters, data requirements, ba-
    sis for a code selection, and applicability of the presented modelling approaches under
    Nordic climate conditions. Besides the review of the literature methods, this review
    also focuses on the potential approaches to enhance the prediction accuracy by using
    integrated methodologies to properly describe the multifaceted processes occurring in
    mine wastes. Furthermore, this work specifically highlights the importance of conducting
    predictive calculations at the early phase of a mine even before the initiation of actual
    waste disposal.

    Keywords: Mine waste, drainage quality, predictive modelling, reactive transport
    modelling

    Muhammad Muniruzzaman, Päivi Kauppila, Teemu Karlsson
    Geological Survey of Finland
    P.O. Box 1237
    FI-70211 Kuopio, Finland

    E-mail: md.muniruzzaman@gtk.fi, paivi.kauppila@gtk.fi, teemu.karlsson@gtk.fi

2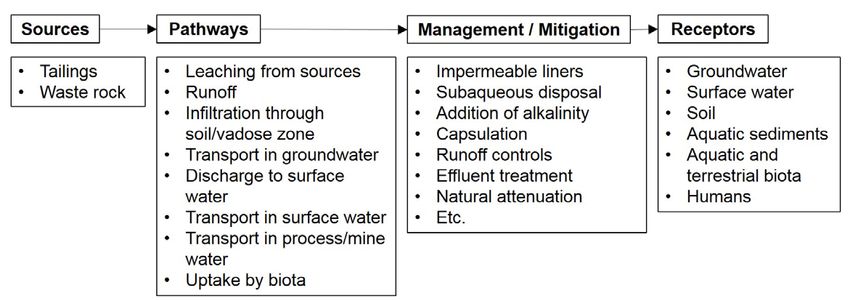
CONTENTS

1    INTRODUCTION............................................................................................................................................. 5
     1.1 Background.................................................................................................................................................5
     1.2 Objectives and content of the literature review.....................................................................................6

2    KEY PROCESSES INFLUENCING DRAINAGE QUALITY IN MINING WASTES............................................7
     2.1     Acid generation and neutralisation processes..................................................................................... 7
     2.2     Microbiological processes.................................................................................................................... 10
     2.3     Physical processes.................................................................................................................................11
             2.3.1 Water flow and solute transport.............................................................................................. 11
             2.3.2 Gas and heat transport.............................................................................................................. 12
     2.4 Electrochemical processes................................................................................................................... 13

3    LABORATORY AND FIELD TESTS IN WATER QUALITY PREDICTION..................................................... 13
     3.1     Mineralogical and physical characterisation..................................................................................... 16
     3.2     Geochemical characterisation............................................................................................................. 17
     3.3     Static tests............................................................................................................................................. 18
     3.4     Kinetic tests.......................................................................................................................................... 19
             3.4.1 Humidity cell test..................................................................................................................... 20
             3.4.2 Field-scale kinetic tests............................................................................................................ 21
     3.5     Summary of the characterisation methods and their use in water quality prediction.................22

4    MODELLING APPROACHES FOR THE PREDICTION OF EFFLUENTS FROM MINE WASTES.................23
     4.1     General principles................................................................................................................................23
     4.2 From lab scale to field scale – scaling factors..................................................................................27
             4.2.1 Introduction ............................................................................................................................... 27
             4.2.2 A scaling factor concept for waste rock facilities................................................................... 30
     4.3     Model types and codes for modelling mine wastes.......................................................................... 32
             4.3.1 Empirical and engineering models..........................................................................................32
             4.3.2 Geochemical models..................................................................................................................33
             4.3.3 Reactive transport models........................................................................................................33
     4.4 Basis for the selection of a code.........................................................................................................36
     4.5 Modelling scenarios: Example case studies......................................................................................38
             4.5.1 Modelling in a proposed waste rock pile................................................................................ 38
             4.5.2 Modelling in an existing tailings impoundment................................................................... 43
             4.5.3 Modelling in an existing waste-rock pile.............................................................................. 45
     4.6 Uncertainties in modelling approaches.............................................................................................47

5    DATA REQUIREMENTS................................................................................................................................ 50

6    APPLICABILITY OF EXISTING MODELLING APPROACHES TO NORDIC CONDITIONS......................... 52

7    SUMMARY AND RECOMMENDATIONS ..................................................................................................... 52

REFERENCES....................................................................................................................................................... 54

                                                                                                                                                                       3
4
Geological Survey of Finland, Open File Research Report 16/2018
                                              Water quality prediction of mining waste facilities based on predictive models

                                           1 INTRODUCTION

                                              1.1 Background

Management methods for mining wastes (KaiHaMe)            tions, the biological content of the mine waste, the
is a 3-year project funded by the European Regional       availability of oxidizing agents, as well as mining
Development Fund (ERDF) that aims at develop-             and mineral processing methods. Mine drainage
ing methods to increase the raw material value of         may be acidic or neutral and contain elevated con-
gold and base metal ore deposits and to reduce the        centrations of harmful elements and compounds,
environmental impact of mining waste, as well as          such as trace metals, metalloids, sulphate and iron
the amount of disposed hazardous waste. This will         (e.g. Younger 1995, Pettit et al. 1999, Cravotta et al.
be done by modifying gold ore tailings with mineral       1999). The acidity of the drainage depends on the
processing techniques and by seeking new options          ratio of acid-producing and -neutralising minerals
for the use of waste rocks from base metal mining.        in the waste. Sulphide minerals, especially iron sul-
In addition to ERDF, the project has been co-funded       phides such as pyrrhotite and pyrite, are acid-pro-
by the Geological Survey of Finland (GTK), Boliden        ducing minerals, whereas carbonates are the most
Kevitsa Mining Oy, FQM Kevitsa Mining Oy, Kemira          effective neutralizing or acid-buffering minerals
Oyj and Endomines Oy.                                     (e.g. Blowes & Ptacek 1994, Ptacek & Blowes 1994).
  One of the main objectives of the project is to            In order to assess the potential environmental
provide tools for predicting the effluent qual-           impact of mine wastes and to design relevant man-
ity of mine wastes to reduce their environmental          agement methods for the waste facilities and their
impacts. This is because low-quality mine drainage        water treatment, the drainage chemistry should
from wastes is one of the biggest concerns related        already be predicted in the planning phase of a
to the management of mining wastes (e.g. MEND             mine. Estimates of the drainage quality are needed
1991, Price 2003, Heikkinen 2009). This particularly      especially in the environmental impact assessment
applies to base metal, precious metal, uranium and        procedure and in the environmental permit appli-
coal mining, in which the mine wastes usually con-        cation to facilitate mine planning, i.e. planning of
tain easily oxidizing sulphide minerals. Sulphide         waste facilities and water treatment systems in
minerals are prone to oxidation once the waste is         particular, and to prevent negative impacts on the
disposed on the ground surface under the influ-           watersheds. Data on the expected water chemis-
ence of atmospheric oxygen and water (e.g. Singer         try is also required when planning the monitoring
& Stumm 1970, Blowes & Ptacek 1994). Sulphide             programme to identify the key substances that need
oxidation produces acidity, which results in the dis-     to be observed. In operating mines, water quality
solution of minerals in the waste and mobilisation        prediction is needed to adjust the existing efflu-
of elements and compounds harmful to the envi-            ent control measures and to plan for the closure of
ronment (e.g. Blowes & Jambor 1990, Lottermoser           waste facilities. At closed or abandoned mine sites,
et al. 1999). The transport of mining-influenced          water quality prediction is also important to assess
waters into the receiving water body may deterio-         the long-term impact of the wastes and necessary
rate water quality and cause harm to the biota (e.g.      water treatment methods. (e.g. Kauppila et al. 2013)
Kihlman & Kauppila 2010, 2012).                              The prediction of effluent quality is, however,
  The effluent quality of mine wastes largely             a challenging task due to several reasons. For
depends on the mineralogical and chemical com-            example, mineral weathering processes resulting
position of the wastes (e.g. Blowes & Ptacek 1994).       in low-quality drainage from mining wastes are
Other influencing factors include the disposal type       very complex and long term (e.g. Blowes & Jambor
and structure of the waste facility, climatic condi-      1990, Blowes & Ptacek 1994). The evolution of poor-

                                                                                                                          5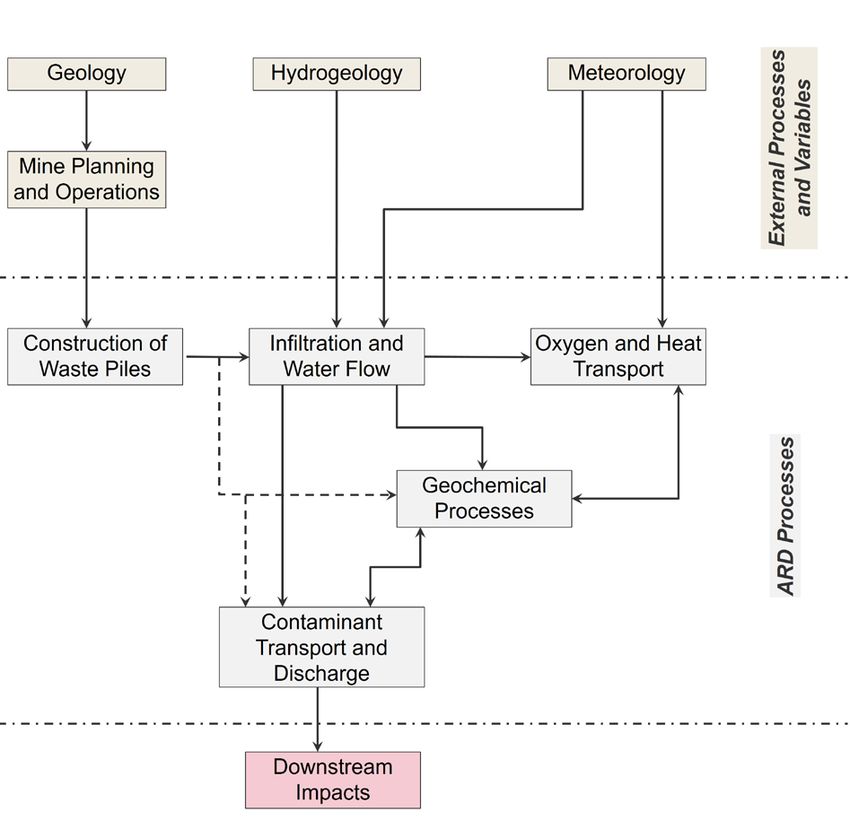
Geological Survey of Finland, Open File Research Report 16/2018
Muhammad Muniruzzaman, Päivi M. Kauppila and Teemu Karlsson

quality drainage may take years or decades from                   (Mitigation of the environmental impact from min-
the start of the operations, and may continue over                ing waste) programme in Sweden (cf. Höglund et
decades or even hundreds of years unless man-                     al. 2004, MEND 2017). In addition, the International
aged properly. However, the mineral weathering                    Network for Acid Prevention (INAP) has compiled an
processes are site-specific, as each mining site is               internet-based global guide on acid and neutral rock
unique with respect to the deposit geology, and thus              drainage and its prediction, prevention and miti-
waste composition, and local environmental and                    gation (INAP 2009). Currently, a variety of forms
climatic conditions, even if the overall chemical                 of guidance and tools are available, ranging from
processes are the same. Basically, the excavated and              simple laboratory tests and analyses to field-scale
generated wastes also show a heterogeneous com-                   tests and simple geochemical or more sophisticated
position within a site. Additional challenges arise               reactive-transport modelling (e.g. Lawrence & Day
because the drainage chemistry may change during                  1997, Maest et al. 2005, INAP 2009, Price 2009,
the operation period of a mine once mineral weath-                Parbhakar-Fox & Lottermoser 2015). A comprehen-
ering evolves (e.g. Dold 2014). Therefore, effluent               sive prediction usually combines data from all these
quality prediction should also include an estimate                sources (Lawrence & Day 1997).
of the type and timing of the changes to properly                   However, during the planning of a mine, the data
dimension the management methods. However,                        available for the prediction are typically quite lim-
since modelling should be performed in a phase                    ited. Therefore, it is not sensible to develop models
for which no data on the modelling conditions yet                 for the prediction that are too complex. Instead, the
exist, model calibration for proposed waste piles                 predictive model should be in accordance with the
is not possible (Tremblay & Hogan 2000, Maest et                  complexity of the available data, the scale of the
al. 2005).                                                        addressed problem and the requirements set by the
    As a result of these challenges, considerable                 regulatory decisions made at that point (e.g. Maest
research effort during recent decades has been                    et al. 2005). As information on the operations, waste
put into improving understanding of the long-                     materials and their effluents increases and becomes
term behaviour of mining wastes and the devel-                    more reliable during mining operations, the predic-
opment of prediction tools for their effluents (e.g.              tive model should be re-evaluated and updated in
Morin & Hutt 1994, White et al. 1994, White et al.                later phases. It should be noted that no matter how
1999, Blowes et al. 2007, Sapsford et al. 2009). For              complex and detailed a model is, some uncertainty
instance, a series of investigations and reports                  will remain in the prediction, even at its best, due
on the long-term behaviour and effluent predic-                   to the heterogeneity of the excavated materials and
tion tools to improve the management of min-                      sites. Therefore, the predicted water quality is typi-
ing wastes have been documented by the MEND                       cally a range of concentrations rather than precise
(Mine Environment Neutral Drainage) programme                     single values (Price 2009).
for the Natural Resources of Canada and the MiMi

                                1.2 Objectives and content of the literature review

The purpose of this report is to review the existing              ning phase of a mine, where waste disposal has
modelling approaches applied to predict drainage                  not yet occurred.
quality from mine wastes. Following the exam-                       The review first provides a short description of
ples by Maest et al. (2005) and Nordstrom (2017),                 the key processes in mine wastes influencing drain-
the terms code and model are separated in this                    age quality (Chapter 2) and of typical laboratory
review. By code, we refer to a computer program                   and field methods (Chapter 3) used to predict the
applied to solve mathematical equations describ-                  water quality and to provide background informa-
ing natural processes in mine waste, whereas by                   tion. Chapter 4 includes the modelling approaches
model, we refer to “a simplified representation                   by presenting insights into the general aspects of
of the site-specific conditions at a particular site,             predictive modelling, common codes and models
which may be a conceptual model or one created                    used to evaluate mine drainage, and the princi-
using a computer code” (Maest et al. 2005). The                   ples of selecting a code to be applied, as well as
focus of the report is especially on the early-stage              by describing case studies using reactive transport
prediction of drainage chemistry, i.e. on the plan-               modelling to predict the evolution of drainage from

6
Geological Survey of Finland, Open File Research Report 16/2018
                                               Water quality prediction of mining waste facilities based on predictive models

mine wastes. The last section of Chapter 4 further         conclusion of the review, recommendations are
discusses the uncertainties involved in modelling.         made on the effluent prediction modelling of min-
In addition, Chapter 5 presents an overview of the         ing waste facilities.
data requirements for predictive modelling. As a

       2 KEY PROCESSES INFLUENCING DRAINAGE QUALITY IN MINING WASTES

Drainage quality in mining environments is col-               The most dominant processes affecting the ulti-
lectively affected by different physical, geochemi-        mate drainage quality are completely site-specific
cal, microbiological and electrochemical processes         and usually determined by the characteristics of
(e.g. Nordstrom et al. 2015). Of primary concern is        waste materials and the prevailing environmental
the effect of geochemistry, as it is typically the key     conditions in a particular mining site. Table 1 pre-
source of poor quality drainage containing a high          sents a list of typical processes, which are further
specific conductivity and elevated concentrations          illustrated in the following sections. In addition to
of major ions, toxic trace metals and/or metal-            these processes, the drainage quality is also influ-
loids. Depending on the major processes, such mine         enced by chemicals and reactants used in ore exca-
drainage waters can be acidic, circumneutral, basic        vation and mineral processing. For example, notable
or saline in terms of pH and salinity, and are usu-        SO4 in the drainage may also originate from the use
ally termed as acid mine drainage (AMD), neutral           of sulphuric acid in ore processing (e.g. Heikkinen
mine drainage (NMD), basic mine drainage (BMD),            et al. 2002, 2009).
or saline drainage, respectively.

Table 1. Physical, biogeochemical and electrochemical processes affecting the drainage quality of mining wastes
(modified after Tremblay & Hogan 2000).

Physical and thermal processes                           Biogeochemical and electrochemical processes
Hydrology/Meteorology (precipitation, evapotranspi-      Oxidation of sulphide minerals
ration, wind, barometric effects)                        Dissolution of buffering minerals
Unsaturated/saturated water flow                         Redox reactions
Aqueous phase transport of dissolved O2 and other        Secondary mineral precipitation and passivation
oxidation products (advection, diffusion/dispersion,
                                                         Ion exchange
sorption)
                                                         Surface complexation
Gas phase transport of O2 and other reaction product
gases (advection, diffusion/dispersion)                  Catalysis by microorganisms
Gas–pore water partitioning                              Radioactive decay
Heat transport (conduction, convection, spontaneous      Galvanic effects
exothermic reactions)                                    Coulombic interactions

                            2.1 Acid generation and neutralisation processes

The generation of acid mine drainage is best illus-        of dissolved ferrous iron, sulphate and protons
trated as a result of the oxidation of reactive sul-       (Table 2). This ferrous iron can be further oxidized
phide minerals when they are exposed to an oxidant         to ferric iron if the oxidizing conditions persist (e.g.
          3+
(e.g. O2, Fe or MnO2) and water under oxic or anoxic       Nordstrom 1982). The iron oxidation mechanism is
conditions, depending on the oxidant. The oxidation        usually sustained by microbial activity. Ferric iron
of pyrite, the most abundant sulphide mineral in the       forms hydrated iron oxyhydroxides (e.g. goethite,
Earth’s crust, is considered to be the most common         ferrihydrite), which may precipitate. This secondary
mechanism responsible for acid generation in min-          mineral precipitation may form coatings on sul-
ing wastes (e.g. Blowes et al. 2014). Upon exposure        phide mineral surfaces and can potentially reduce
of the pyrite-bearing mine waste to atmospheric            the mineral oxidation rates by limiting the exposure
oxygen, pyrite is oxidized, leading to the release         to the reactants. Pyrite can also be oxidized by the

                                                                                                                           7
Geological Survey of Finland, Open File Research Report 16/2018
Muhammad Muniruzzaman, Päivi M. Kauppila and Teemu Karlsson
dissolved ferric iron species, especially under low ferrous iron, constitute a cycle of pyrite dissolution
pH conditions. The rate of such pyrite oxidation by (e.g. Singer & Stumm 1970). The net consequence
3+
Fe has been shown to be significantly higher than is an increase in the total dissolved solutes (e.g.
by O2 (e.g. Williamson & Rimstidt 1994, Mylona et Fe2+, SO42-) and the release of acidity in the drainage
al. 2000). These simultaneous reactions, i.e. the dis- water associated with mining wastes.
solution of pyrite by ferric iron and the oxidation of
Table 2. Reactions of sulphide7oxidation and (oxy-)hydroxide
2+ 2− +
precipitation in mine wastes (e.g. Seal et al. 2003,
FeS 2 ( s ) + O 2 + H 2 O → Fe + 2 SO 4 + 2 H
Dold 2010). 27 2+ 2− +
FeS 2 ( s ) + O 2 + H 2 O → Fe + 2 SO 4 + 2 H
Minerals Reactions
2+ 1 2 + 3+ 1
Fe + O 2 + H → Fe + H 2 O
2 + 41 7 + 3+ 21
Fe ( s+) + OO
FeS 2 2+ +HH 2→ O→ Fe Fe 2++ +H2 SOO2 − +
32+ 4 2 +2 4 + 2 H
Fe + 3H22 O → Fe(OH ) 3 ( s ) + 3H
3+ +
Fe2 + +13H 2 O → 3++Fe(OH 3) 3+( s ) 1+ 3H2 + 2− +
FeS
Fe 2 (
+ s ) +O14 Fe
+ H + 8
→ HFe2 O →+ 15 Fe
H O + 2 SO 4 + 16 H
2 3 + 22 + 2 − +
FeS 2 ( s4) + 14 Fe + 8 H 2 O → 215 Fe + 2 SO 4 + 16 H
15 7
3+ + O + H O → Fe(OH ) + + 2 SO 2 − +
Pyrite FeS
Fe 2 + 315 H O 2 → 7Fe(2OH ) 3 ( s ) + 3H 3 4 + 4H
4 2 2 2− +
FeS 2 + O 2 3++ H 2 O → Fe(OH )23+ + 2 SO 42 − + 4 H +
FeS 2 ( s )15+414 Fe 13 2+ 8 H O
2 +2 17→ 15 Fe + 2 SO
13 42 + + 16 H 2 − 17 +
FeS 2 + O 2 + Fe + H 2O → Fe + 2 SO 4 + H
15 13 17
72 Fe 2 + + 4 H O → 2 Fe 13 17
FeS + 158
O + 2 −2 + + 2+SO 2 − + 2 H +
FeS 22+ O 22+ H 2 O → Fe(OH2) 3 + 2 SO 4 + 4 H 4
48 22 4 2 2
15 13 2+ 17 13 2+ 2 − 17 +
FeS 2 + O2 + Fe + H 2O → Fe
+ 2 SO 4 + H
8 2 4 2 2
⎛ x⎞ 2+ 2− +
Fe1− x S ( s ) + ⎜ 2 − ⎟O2 + xH 2O → (1 − x ) Fe + SO4 + 2 xH
⎝⎛ 2x⎠⎞ 2+ 2− +
Fe1− x S ( s ) + ⎜ 2 − ⎟O2 + xH 2O → (1 − x ) Fe + SO4 + 2 xH
Fe1− x S ( s ) + ⎝8 − 2 x ⎠Fe + 4 H 2O → ( 9 − 3 x ) Fe
( )
2 3+ 2+ 2− +
+ SO4 + 8 H
( ) 3+
Fe1− x S ( s ) +⎛ 8 − x2 x⎞ Fe + 4 H 2O → ( 9 − 3 x2)+Fe
⎛ 1 ⎞
2+ 2−
+2−SO4 + 8 +H
+
2 Fe1x− x S ( s ) +⎜ ⎜ − ⎟x ⎟2
Fe1− S ( s ) + 2 − O + xH 2 O → (1 +
− x ) Fe + SO 4 + 2 xH2 +
Pyrrhotite ⎝ ⎝⎛21 2 ⎠ ⎠⎞O2 + ( 2 − 4 x ) H + → FeS 2 + (1 − 2 x ) Fe 2+ + (1 − 2 x ) H 2O
2 Fe1− x S ( s ) + ⎜ − x ⎟3O+2 + ( 2 − 4 x ) H → FeS 22++ (1 − 22x−) Fe + + (1 − 2 x ) H 2O
Fe1− x SZnS
(
( s )++2(O2 −→
)
Fe1− x S ( s ) + 8 ⎝− 22 x Fe2⎠+ + 4 H
2 xZn
) H + SO
2 − O → ( 9 − 3 x2)+Fe + SO4 + 8 H
xH 2 2→ (1 − x ) Fe + H 2S
2 + 4 2+
Fe1− x S ( s ) + (⎛213−+ 2 x )⎞H + xH 22→ (1+− x2)+Fe 2+−H 2 S + 2+
2 Fe1− xZnS ⎜ −+x4⎟HO22O+→( 2Zn
S ( s )+ +8 Fe − 4+x )+H8 Fe→ FeS
+ SO24+ (1+ −8 H2 x ) Fe + (1 − 2 x ) H 2O
⎝2 ⎠
(where x can vary from 0 to 0.125)
+ 2+
+ H 2 S → (1 − x ) Fe2+ + H S
Fe1− x SZnS
( s ) ++ 2( 2H − 2→
x )Zn
H ++xH 22 + 2
2+ 2−
CuFeS 2 + 4O 2 → 2 + Cu 2 −+ Fe + 2 SO 4
ZnS + 2O2 → Zn + SO24+ 2+ 2−
Chalcopyrite CuFeS 2 + 4O 2 → Cu + Fe + 2 SO 4
3+17 + 2Cu 22++ + 2 Fe2(−OH ) ++ 4 SO 2 − + 4 H +
CuFeS
ZnS + 82Fe+ 17+O42H 2+O5 H→2ZnO 2→ + 8 Fe + SO4 + 83H 42 −
2 2+ +
CuFeS 2 ++ O 22 ++ 5 H 2 +2 O → 22+Cu + 2 −Fe(OH ) 3 + 4 SO 4 + 4 H
CuFeS
ZnS +
H →4 O → Cu
22Zn2 + ++SO +
H 22S−+ Fe + 2 SO
ZnS ++ PbS
222O →
2 + 2ZnO2 → Pb24 + SO4
2− 4
CuFeS 317
+ 2+ 2 +2 + − ) ++ 4 SO 2 − + 4 H +
Fe(2OH
Sphalerite ZnS + 82Fe+ +O42H3+2+O5 H→2 OZn→ 2+Cu 8 Fe 2 ++2SO 2++8 H 2 − +
PbS +2 8 Fe + 4 H 2O → Pb + 8 Fe 3+ SO4 4+ 8 H
4
+ 2+
ZnS + 2 H → Zn + H 2 S
2+ 2−
PbS + 2O2 → Pb + SO4
Galena
3+ 2+ 2+ 2− +
PbS + 8 Fe + 4 H 2O → Pb + 8 Fe + SO4 + 8 H
2+ 2− 2+ 2− − +
4 FeAsS
PbS + 2O( s2) → PbO 2 + SO
+ 13 6 H42 O → 4 Fe + 4 SO 4 + 4 H 2 AsO4 + 4 H
Arsenopyrite 3+ 2+ 2+ 2− +
PbS + 8 Fe7 + 4 H 2O → Pb + 8 Fe + SO42− + 8 H − +
FeAsS + O 2 + 6 H 2 O → Fe(OH ) 3 + SO 4 + 4 H 2 AsO4 + 3 H
2
2+ 2− − +
4 FeAsS ( s ) + 13O 2 + 6 H 2 O → 4 Fe + 4 SO 4 + 4 H 2 AsO4 + 4 H
8 7 2− − +
FeAsS + O 2 + 6 H 2 O → Fe(OH ) 3 + SO 4 + 4 H 2 AsO4 + 3 H
2 2+ 2− − +
4 FeAsS ( s ) + 13O 2 + 6 H 2 O → 4 Fe + 4 SO 4 + 4 H 2 AsO4 + 4 HGeological Survey of Finland, Open File Research Report 16/2018
Water quality prediction of mining waste facilities based on predictive models
In addition to pyrite, another common acid-gen- ides and oxyhydroxide sulphates, facilitating the
erating iron sulphide mineral in the mining wastes removal of dissolved metals from the migrating
is pyrrhotite (e.g. Thomas et al. 1998, Janzen et al. pore water (e.g. Dold 2010). The most common pH-
2000). Weathering of pyrrhotite by oxygen leads buffering minerals in mine settings are carbonates,
to a similar acidifying process as pyrite, but the aluminium and ferric hydroxides, and aluminosili-
dissolution rate of pyrrhotite is usually found to cates. The pH of the drainage ultimately depends
be much higher (approximately 20 to 100 times) on the balance of acid and neutralizing minerals,
compared to that of pyrite in atmospheric condi- their spatial variability, and their reaction kinetics
tions (e.g. Nicholson & Scharer 1994). Pyrrhotite in the waste.
dissolution can follow oxidative or non-oxidative Calcite, dolomite, ankerite and siderite, or their
pathways, depending on the pH conditions (Table mixtures, are the most common carbonate minerals
2). The non-oxidative mechanism is found to be in mine wastes. The dissolution of these miner-
orders of magnitude faster than the oxidative path- als leads to the release of alkaline earth and metal
way (Thomas et al. 1998). cations, such as Ca, Mg, Fe and Mn (e.g. Blowes et
Besides iron sulphides, the oxidation of other al. 2014). Among these carbonate minerals, calcite
metallic sulphides (e.g. chalcopyrite, sphalerite, is found to be not only the most common, but also
pentlandite, galena or arsenopyrite) can also be the fastest reacting carbonate mineral in the min-
an important mechanism controlling the quality ing environment context. The dissolution of calcite
of mine waste drainage. The dissolution of these neutralizes acidity as a result of hydrogen ion com-
sulphide minerals may or may not lead to acid gen- plexation with the released carbonate ion (CO32-) to
eration, depending on the chemical conditions as form bicarbonate (HCO3-) or carbonic acid (H2CO3)
well as the oxidant. For instance, the oxidation of (e.g. Blowes & Ptacek 1994). The rapid dissolution
chalcopyrite, sphalerite or galena by oxygen gen- of calcite has the potential to buffer pH in a near-
erally does not produce acids, but coupling with neutral range (6.5–7.0). However, the dissolution
ferrous iron oxidation, ferrihydrite hydrolysis or capacity of calcite has been shown to be pH depend-
the presence of dissolved ferric iron may initiate ent and generally increases under low pH conditions
acid-generating processes (e.g. Dold 2010, Blowes (e.g. Dold 2010) (Table 3). As the pH increases due
et al. 2014). Nevertheless, the oxidation of these to neutralization processes, calcite may also pre-
minerals has severe implications for mine waste cipitate as a secondary mineral.
weathering, as they may release hazardous toxic Besides calcite, another carbonate mineral
elements such as Zn, Ni, Pb, Cd, Ti, Cu or As, which observed in mine wastes is siderite, which can
can impact on the surrounding natural systems, as act as both an acid neutralizer and acid producer,
well as human health (Table 2). Arsenopyrite dis- depending on the chemical conditions (e.g. Dold
solution releases both sulphur and arsenic species. 2010). Siderite may follow different reaction path-
In this dissolution the oxidation of As(V) to As(III) ways, especially with the combination of ferrous
is found to be more rapid compared to iron oxi- iron oxidation and ferrihydrate precipitation. The
dation (e.g. Buckley & Walker 1988, Nesbitt et al. dissolution of siderite buffers the pH of the system
1995). Table 2 summarizes the reactions involving at around 5. The depletion of carbonate minerals
the oxidation of sulphides particularly relevant in typically leads to a drop in pH, which facilitates
mining environments. equilibrium with the next soluble phases, hydroxide
The acid generated in the sulphide mineral oxi- minerals (Table 3). The dissolution of aluminium
dation processes mentioned above can result in an hydroxides (i.e. amorphous Al(OH)3 or crystalline
extremely low range of pH (1.5–4), and such pH form, gibbsite) maintains the pH in the region of
can even reach negative values under exceptional 4.0–4.5, whereas the following soluble Fe hydrox-
conditions within mining waste environments (e.g. ide phases (such as ferrihydrite or goethite) buffer
Nordstrom et al. 2000). The increased acidity in the the pH values in the range of 2.5–3.5 (e.g. Blowes
aqueous phase promotes the dissolution of acid- et al. 2014). Consequently, these mineral dissolu-
neutralizing minerals along the migration path- tion processes complement a buffering sequence
ways of pore water containing low pH solutions. starting with calcite (pH = 6.5–7.0) and followed by
Such acid-neutralization reactions usually result in siderite (pH = 5.0–5.5). Upon the consumption of all
the progressive buffering of pH, often accompanied carbonate minerals, the buffering is controlled by
by the precipitation of metal-bearing oxyhydrox- gibbsite (pH = 4.0–4.5), followed by iron hydrox-
9Geological Survey of Finland, Open File Research Report 16/2018
Muhammad Muniruzzaman, Päivi M. Kauppila and Teemu Karlsson
ides (pH = 2.5–3.5) (Ptacek & Blowes 1992, Blowes dissolution with carbonates and oxyhydroxides, but
& Ptacek 1994). The dissolution of aluminosilicate their reaction rate is usually kinetically controlled
minerals (e.g. chlorite, smectite, biotite, muscovite, (except at a very low pH, it is generally much slower
plagioclase and amphibole) + the potential
2+ −
CaCO also
+ Hhas→ Ca + HCO than that of carbonates) and their pH buffering is
3 3 not constrained to a specific pH range (e.g. Amos
to neutralize acidity and to mobilize a range of ele-
ments in pore water, including + 2+ 0
CaCO3 + 2Al, H K,→Na, Ca Ca, +Mg H 2COet3 al. 2015).
and Mn. These silicates can undergo simultaneous
+ 2+ −
FeCO3 + H → Fe + HCO3
Table 3. Acid neutralization reactions + in mine2+wastes (Seal− et al. 2003, Dold 2010).
CaCO3 + H → Ca + HCO3
1 5 + −
Minerals Reactions
FeCO3 + O+2 + H22+O → Fe(OH 0 ) 3 + H + HCO3
CaCO3 + 24H+ → 2Ca2+ + H 2CO −3
CaCO3 + H → Ca + HCO3
+ 2+ −
FeCO3 + H +→ Fe 2++ HCO3 0
CaCO3 + 2 H → Ca + H 2CO3
1 5 + −
Carbonates FeCO O+2 →++ FeH22+O3++→ Fe(−OH ) 3 + H + HCO3
FeCO 33+)+ H
Al (OH + 3 H → Al HCO
+ 3 H
32 O
34 2
1 +5 3+
Fe(OH )+3 + O
FeCO 3H + →HFeO →+ Fe O ) + H + + HCO −
3H(2OH
3 2 2 3 3
4 2
+ 3+
FeO (OH ) + 3H+ → Fe3+ + 3H 2O
Al (OH ) 3 + 3H → Al + 3H 2O
Hydroxides + 3+
Fe(OH ) 3 + 3H + → Fe 3+ + 3H 2O
Al (OH ) 3 + 3H → Al + 3H 2O
+ 3+
FeO (OH ) + 3H + → Fe 3+ + 3H 2O
Fe(OH ) 3 + 3H → Fe + 3H 2O
+ +
KAlSi3O8 + H + + 7 H 23O + → K + 3H 4 SiO4 + Al (OH ) 3
FeO (OH ) + 3H → Fe + 3H 2O
+ 2+
Silicates CaAl 2 Si 2O8 + 2 H + H 2O → Ca + Al2 Si 2O5 (OH ) 4
+ 2+ 3+
CaAl 2 Si 2O8 + 8 H + H 2O → Ca + 2 Al + 2 H 4 SiO4
+ +
KAlSi3O8 + H + 7 H 2O → K + 3H 4 SiO4 + Al (OH ) 3
+ 2+
CaAl 2 Si 2O8 +2.22+HMicrobiological
+ H 2O → Ca
+
processes
+ Al2 Si 2O5 (OH ) 4
KAlSi3O8 + H + 7 H 2O → K + 3H 4 SiO4 + Al (OH ) 3
+ 2+ 3+
CaAl 2 Si 2significantly
Microbiological processes can
O8 + 8 H ++affect
H 2O →tion
Ca 2under
++ 2 Al + 2 H 4 SiO4is reported to be several
field conditions
CaAl 2 Si 2O8 + 2 H + H 2O → Ca + Al2 Si 2O5 (OH ) 4
the acid rock drainage problem by catalysing sul- orders of magnitude higher compared to the abiotic
phide mineral oxidation + 2+ 3+(e.g. Kirby et al. 1999, Nordstrom
CaAl 2 Si 2O8 + 8 H + H 2O →laboratory
reactions (e.g. Nordstrom Ca + 2 Al rate + 2 H 4 SiO4
2000). In particular, bacterial species such as 2003). However, in mine environments, the spe-
Thiobacillus and Acidithiobacillus are known to accel- cific microbe species responsible for microbial oxi-
erate acid generation in waste rocks and tailings dation have also been found to change over time
impoundments (e.g. Nordstrom & Southam 1997, during the course of acidification (e.g. Leduc et al.
Blowes et al. 2014). These microorganisms obtain 1993, Southam & Beveridge 1993, Blowes et al. 1995,
energy from the oxidation of Fe(II) or reduced S Elberling et al. 2000, Moncur et al. 2005).
species and are capable of deriving cellular carbon The detailed role of microorganisms in sulphide
from the fixation of atmospheric carbon dioxide mineral oxidation, as well as in the overall geo-
through the Calvin cycle (e.g. Dold 2010). chemistry of mining environments, has been widely
Acidithiobacillus ferrooxidans is the best known described and reviewed by Colmer and Hinkle
and most extensively studied species that plays a (1947), Evangelou and Zhang (1995), Nordstrom
major role in the oxidation of Fe2+, which is the (2000), Baker and Banfield (2003), Johnson and
rate-limiting step in pyrite oxidation under acidic Hallberg (2003, 2005) and most recently by Blowes
conditions (e.g. Singer & Stumm 1970). The reac- et al. (2014), among others.
tion rate in such microbially mediated pyrite oxida-
10Geological Survey of Finland, Open File Research Report 16/2018
Water quality prediction of mining waste facilities based on predictive models
2.3 Physical processes
Although the genesis of acid mine drainage is pri- ing and extent of net infiltration, and the capillary
marily related to the geochemical reactions occur- pressure conditions in the porous matrix. The lea-
ring within the mined sediments, different physical chate quality of mine drainage and the transport of
processes also crucially control the quality and dissolved solutes (i.e. reactants and oxidized prod-
quantity of drainage. For instance, the amount of ucts) through waste materials is ultimately linked
water available for the oxidation of acid-producing to the movement of the pore water.
minerals is determined by hydrological processes Depending on the distribution of hydraulic con-
such as precipitation and evapotranspiration. The ductivity, fracture networks and/or water satura-
abundant supply of oxygen, which is a control- tion, fluid flow and solute transport in such systems
ling reactant for the sulphide mineral oxidation, can be dominated by different physical processes.
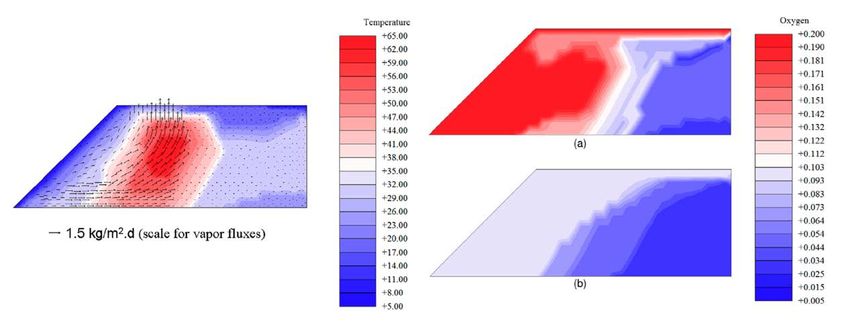
is a function of water flow, gas transport and heat For example, in waste rock piles, solute migration
transport. Figure 1 represents a schematic diagram can typically be controlled by advective matrix flow
of the processes affecting drainage quality and how or channelized preferential flow due to the presence
they are interconnected at a mine site. of a mixture of coarse- to fine-grained rocks, as
well as due to a wide distribution of void spaces with
2.3.1 Water flow and solute transport large voids intermingled with small pore spaces
(e.g. Smith & Beckie 2003, Nichol et al. 2005, Fretz
The mechanism of water flow through mining waste et al. 2011, Blackmore et al. 2012, Neuner et al. 2013).
facilities is controlled by the characteristics of the In contrast, tailings impoundments generally con-
waste material (e.g. particle-size distribution, per- tain fine-grained materials with a relatively high
meability, fractures and heterogeneity), the tim- water content, typically resulting in a relatively
Fig. 1. Processes affecting the quality of drainage from waste piles (modified from Tremblay & Hogan 2000).
11Geological Survey of Finland, Open File Research Report 16/2018
Muhammad Muniruzzaman, Päivi M. Kauppila and Teemu Karlsson
lower hydraulic conductivity than in the waste rocks et al. 2015). In waste rock piles or tailings impound-
(e.g. Blowes & Jambor 1990, Johnson et al. 2000, ments, this process can be the principal gas trans-
Moncur et al. 2005). The water migration rate in port mechanism, especially in low permeability
such settings is usually slow and can be affected by settings where advective processes are considerably
capillary forces. Therefore, in addition to advective inhibited (e.g. Pantelis & Ritchie 1992, Lefebvre et
processes, molecular diffusion and hydrodynamic al. 2001a, 2001b).
dispersion can also play an important role in solute Besides transport within the gaseous phase, the
transport in these systems. infiltrating water is also generally loaded with dis-
Furthermore, the transport of metals and metal- solved oxygen. Consequently, dissolved gases can
loids, released from the sulphide oxidation and/or undergo advective and diffusive/dispersive trans-
dissolution of other minerals, is also significantly port within the aqueous phase in porous media.
affected by sorption or sorption-like mechanisms Such solute transport processes can also be impor-
such as ion exchange and/or surface complexation tant in the supply of oxygen in sulphide oxidation
(e.g. Appelo & Postma 2005, Dzombak & Morel reactions. However, the transport mechanisms
1990). The sorption of these metal ions is mainly in the water phase are often significantly slower
induced from the surface charge, which originates (sometimes by orders of magnitude) compared to
from the ionization of surface functional groups of gas phase transport. For example, the transport of
oxides, oxyhydroxides, and silicate minerals in con- oxygen in water is almost 10,000 times slower than
tact with water (e.g. Davis & Ritchie 1986, Brown et in air (e.g. Tremblay & Hogan 2000). The net capac-
al. 1995). Such processes usually take place at the ity of oxygen (and other atmospheric gases) loading
solid–liquid interface and may form mineral–spe- in water is also generally limited by the aqueous
cies complexes, providing the potential for remov- solubility limit. The maximum concentration of dis-
ing dissolved species from the drainage water. The solved oxygen in water is known to be around 30
extent of sorption effects is dependent on the net times less than in the atmosphere (e.g. Tremblay
surface charge, pH, temperature, dissolved metal & Hogan 2000).
concentrations and residence time (e.g. Parks 1990, In unsaturated waste deposits, gas transport
Dzombak & Morel 1990, Stumm & Morgan 1996). is often found to be tightly coupled with the heat
transport process, as the movement of gases can
2.3.2 Gas and heat transport carry a considerable amount of heat (e.g. Amos et al.
2015). This flow of heat in connection with seasonal
Gas transport is another controlling factor deter- temperature variations can lead to temperature gra-
mining the quality of drainage from waste piles, as dients, which can influence sulphide oxidation rates
it brings the potential reactants (e.g. oxygen) into and limit water flow through waste piles, between
contact with reactive sulphide minerals. In mining the pile centre and the external environments. The
wastes, the transport of gases can take place by dif- main heat transport mechanisms in mine wastes
ferent mechanisms, including advective transport include convective (also termed advective) and
in the gas phase, diffusion in the gas phase, and/ conductive (also known as diffusive) transfer. The
or advective and diffusive/dispersive transport of former is usually driven by air pressure gradients
dissolved gases in infiltrating water. and it dominates in high permeability settings,
Advective gas transport can generally occur whereas the latter refers to heat transfer through
due to the wind-driven air flow, pressure gradi- the bulk matrix by temperature gradients and is
ents resulting from the consumption of O2 because usually the dominant process in low permeability
of sulphide oxidation reactions within the waste waste materials. Furthermore, sulphide oxidation
piles, thermally driven density gradients, and/or reactions are exothermic and can generate a con-
barometric pressure changes (e.g. Amos et al. 2015). siderable amount of heat during the oxidation pro-
Diffusion is typically driven by concentration gra- cess. Therefore, such mechanisms may also lead to
dients (or more accurately chemical potential gra- temperature gradients within wastes, facilitating
dients) and leads to the net movement of a solute thermally driven air flow into the waste facilities
from a region of higher concentration to a region of (Lefebvre et al. 2001a, 2001b, Pham et al. 2013).
lower concentration (e.g. Grathwohl 1998, Haberer
12Geological Survey of Finland, Open File Research Report 16/2018
Water quality prediction of mining waste facilities based on predictive models
2.4 Electrochemical processes
In addition to the processes discussed above, the electrical coupling with other sulphides such as
final drainage quality in a mining environment can chalcopyrite or sphalerite, pyrite oxidation has
also be substantially affected by electrochemical been found to be significantly delayed, leading to
processes. As such, electrochemical reaction steps supposedly long-term contamination in waste rock
or transfer of electrons, which occur at the min- drainage, due to cathodic protection (e.g. Cruz et al.
eral–water interface, can control the dissolution 2005). In contrast, the dissolution of other involved
rate of sulphide minerals (e.g. Holmes & Crundwell sulphides (chalcopyrite and sphalerite) is acceler-
1995, 2000, Crundwell 2013). Galvanic effects are ated in the presence of pyrite (e.g. Cruz et al. 2005,
other well-known phenomena that can signifi- Chopard et al. 2017). Moreover, the transport of dis-
cantly modify the reactivity of pyrite and other solved ions can also be fundamentally controlled by
sulphide minerals (e.g. Byerley & Scharer 1992, electrochemical behaviour, as the sorption of H+ and
Subrahmanyam & Forssberg 1993, Salomons 1995, other ionic species occurs through electrical double
Lin 1997, Cruz et al. 2001, 2005, and Liu et al. 2008). layers at the mineral–liquid interface (e.g. Hiemstra
Such galvanic reactions generally occur between et al. 1989, Appelo 1994, Kent et al. 2007, Prigiobbe
conductive/semi-conductive minerals in water by et al. 2014, McNeece & Hesse 2016). Furthermore,
forming a galvanic couple, which induces an electri- Coulombic interactions between different charged
cal potential between the two contacting sulphide species can extensively modify fluxes, as well as
minerals (e.g. Kwong et al. 2003, Shuey 2012). As the migration of individual ionic species, including
a result, the dissolution rate of a specific sulphide protons, in a multi-ionic environment (e.g. Lasaga
mineral is enhanced or hindered, depending on that 1979, Giambalvo et al. 2002, Appelo & Wersin 2007,
particular sulphide being the cathode or anode of Appelo et al. 2010, Rolle et al. 2013, Muniruzzaman
the developed galvanic cell (e.g. Mehta & Murr 1983, et al. 2014, Muniruzzaman & Rolle 2015).
Holmes & Crundwell 1995). For instance, through
3 LABORATORY AND FIELD TESTS IN WATER QUALITY PREDICTION
Several laboratory and field methods have been ciation tests, respectively. The waste rock samples
developed to characterise mine waste materi- should represent all different excavated waste rock
als and to predict their long-term behaviour (cf. types of the ore deposit. Block models are usually
e.g. Lawrence & Day 1997, Meast et al. 2005, Price developed to define different geological units in the
2009). Thorough mineralogical and geochemical deposit in order to quantify and characterise the ore
characterisation of wastes forms the basis for the and the waste types. In the later phases of mining,
prediction, prevention and management of their such data on characterisation are updated and com-
environmental impacts, and the collection of input plemented to enable more detailed predictive mod-
data for the predictive modelling. Assessment of the elling of the effluents and to determine appropriate
potential of mine wastes to produce harmful mine waste management actions (e.g. Maest et al. 2005).
drainage (i.e. AMD or NMD) is needed, especially in A typical waste characterisation scheme includes
the planning of waste facilities as well as effluent the determination of the mineralogical, geochemi-
treatment systems, and in selecting suitable meth- cal, acid production and leaching properties of
ods for the closure of waste facilities. waste materials (Fig. 2), including possible analysis
In order to better prevent environmental impacts, of mine waste’s physical properties, e.g. particle-
mine waste characterisation already needs to be size distribution (PSD). These are needed to predict
carried out during the exploration and planning water quality from waste piles/facilities and to assist
phase of a mine, when no waste yet exists, and such in the evaluation of quality of source term leachates
characterisation should cover all the features of the that could be used as inputs for geochemical mod-
generated waste fractions. In these phases, repre- elling. Nordstrom (2017) stressed that for back-
sentative samples of waste rocks and tailings can ground perquisites for modelling, one of the most
be collected from exploration drillings and benefi- useful aspects of geology is to identify minerals,
13Geological Survey of Finland, Open File Research Report 16/2018
Muhammad Muniruzzaman, Päivi M. Kauppila and Teemu Karlsson
Geological description
of the ore deposit
Sampling and pretreatment
Mineralogical and chemical composition Geotechnical characteristics
± chemical residues (tailings, mineral precipitates)
Non-sulphide Sulphide Fe-sulphide Assessment of the risks
mining waste mining waste mining waste of major accidents for the
waste area
S < 0.1% S > 0.1%
Determination of acid-generation potential
NP/AP < 3 NP/AP > 3
Inert waste Non-inert waste
and S < 1% and S > 1%
Assessment of the solubility
of harmful substances
Fig. 2. Typical scheme for the characterisation of mining wastes (Kauppila et al. 2013).
their chemical composition, and relative solubilities benchmarked data and verification of the modelling
and stabilities, as well as to understand rock types results. Static and kinetic test results can be cou-
or lithologies, their main minerals and their mode pled with information from the mine plan and water
of formation. Based merely on geological data (i.e. balance to develop numerical predictions of future
ore type, mineralogy) on the deposit, a prelimi- seepage and runoff water quality associated with
nary assessment of the acid generation potential, different mine waste facilities. Static and kinetic
neutralizing capacity and the occurrence of harmful test data are usually used in mine drainage pre-
elements in the waste can already be made. diction in itself, without feeding the data to any
Characterisation methods to assess the acid pro- additional computer model (e.g. White et al. 1999,
duction potential and leaching properties of waste Lapakko 2002, Maest et al. 2005, Price 2009).
can be divided into two types: static and kinetic Mine waste characterisation data can be uti-
tests. Static tests are short-term laboratory analy- lized in drainage quality prediction, e.g. by the
ses, usually good for preliminary investigation and widely used thermodynamic equilibrium model-
screening. The results of static tests together with ling approach, or the kinetic modelling approach
geochemical analyses can be used to select suitable (see e.g. Declercq et al. 2017). In thermodynamic
samples for kinetic testing, and they can also pro- equilibrium modelling, the geochemical data from
vide threshold data for modelling (e.g. whole rock static and kinetic tests is first scaled (for scaling, see
composition). The samples for kinetic tests should chapter 4.2) to field conditions using the planned
represent the different mine waste types and the physical characteristics of the mine waste facility,
range of leaching characteristics anticipated for the which include the amount of waste, surface area,
waste material (Declercq et al. 2017). Kinetic tests height, and grain size. Climate data can be coupled
are longer-term tests, which reveal information on with this information to calculate mass balance pre-
the leaching behaviour over time. These tests are dictions of leachate quality as a function of time.
usually more expensive, time consuming and with The scaled and mass balanced leachate chemistry
larger test settings. They are often used to provide can then be equilibrated using modelling tools, e.g.
14Geological Survey of Finland, Open File Research Report 16/2018
Water quality prediction of mining waste facilities based on predictive models
PHREEQC, where thermodynamically favoured, Day (1997), Maest et al. (2005) and Price (2009).
potentially existing phases are allowed to precipi- In Europe, a standard for the characterisation of
tate, to assess the drainage quality in field condi- mining wastes has been published by the European
tions (Declercq et al. 2017). In the kinetic modelling Committee for Standardization (CEN/TR 16376:2012:
approach, the dissolution and precipitation of the Characterization of waste – Overall guidance document
possible mineral phases present in the waste are for characterization of wastes from extractive industries,
allowed over a selected time period, on the basis Technical Committee 2012), and recommenda-
of mineralogy, the reactivity equations for each tions on the characterisation methods are included
mineral, temperature, particle-size distribution in the BREF document for mine wastes (Reference
and reactive surface area parameters (Declercq et Document on Best Available Techniques for Management
al. 2017). of Tailings and Waste-Rock in Mining Activities, EC
A concise summary of the most common mine 2009b; to be updated in 2018). Additional informa-
waste characterisation methods is presented in tion on the methods is also available via a Wiki page
the following sections and in Table 4. For kinetic of the Geological Survey of Finland (GTK): Mine
testing, special attention is paid to humidity cell Closure Wiki (mineclosure.gtk.fi; GTK 2017), which
testing (HCT), which is the most commonly used is an open internet resource on the technologies
and the only standardized kinetic test method and approaches used in mine closure (Kauppila et
(Lapakko 2002). For more detailed information al. 2016), including a section on mine waste char-
on the individual methods, several reviews and acterisation (Karlsson & Punkkinen 2017).
guidebooks are available, including Lawrence and
3.1 Mineralogical and physical characterisation
Mineralogical characterisation can be used to deter- Various methods are available to quantify the
mine the mineralogical composition, i.e. relative mineralogical composition of mine wastes, and
abundances of minerals in mine wastes. The main other mineralised and non-mineralised materi-
objective of the mineralogical characterisation of als. Common methods for mineralogical analysis
mine wastes is to identify the acid-generating and include optical microscopy (OM), scanning electron
neutralizing minerals, potentially harmful sub- microscopy (SEM) and X-ray diffraction (XRD). In
stances containing minerals, and easily weather- addition, microprobes can be used to identify the
ing minerals, e.g. salt minerals (e.g. Kauppila et chemical composition of individual minerals and
al. 2013). Mineralogical methods can also be used to gain information on the sorption of different
to determine the relative degree of weathering of elements, in particular toxic trace metals in mine
mineral grains. These analyses are essential in wastes.
interpreting the results of static and kinetic tests. In OM, a detailed investigation of a thin section
Thorough descriptions of the relationships between prepared from a mine waste sample is carried out
mineralogy and static and kinetic tests are pre- with a petrographic microscope, i.e. using trans-
sented, for example, by Jambor (2003) and Williams mitted light microscopy or reflected light micros-
and Diehl (2014). copy. OM is typically used to define the quantitative
The physical characterisation of mine waste is mineralogical composition of waste rocks, whereas
essential for many modelling approaches (Declercq the tailings are generally so fine-grained that their
et al. 2017), and includes the determination of the mineralogical composition is more practical, rapid
mass, moisture, particle-size distribution and reac- and reliable to measure with the SEM technique. If
tive surface area. The physical properties of mine a sample contains opaque minerals such as oxides
waste and the physical differences between labora- and/or sulphides, as mine waste samples often
tory settings and the field size mine waste facility do, polished thin sections and reflected light (ore
also affect the scaling up of laboratory test results microscopy) is used. The mineral abundances can
to the field scale (Malmström et al. 2000, Kempton be determined, for instance, by a standard point-
2012, Kirchner & Mattson 2015), which is often done counting method with 600 points, when the general
before actual modelling to provide more detailed grain size and the occurrence of opaque minerals of
information on the reaction kinetics (Nordstrom the sample make this possible. After the calculation
2017). of mineral abundances, the rock type is classified
15Geological Survey of Finland, Open File Research Report 16/2018
Muhammad Muniruzzaman, Päivi M. Kauppila and Teemu Karlsson
Table 4. Examples of common characterisation methods for mine wastes. (PSD = particle-size distribution).
Method Description Reference / Standard / Guide
Mineralogical methods
Transmitted/reflected light microscopy, EN 932-3:1996 and amendment
Optical microscopy (OM)
point-counting of minerals A1:2003
Information on e.g. mineral abundanc-
Scanning electron microscopy
es, chemical composition, grain size e.g. Swapp 2014
(SEM)
and microstructures
Quantitative and qualitative mineralogy
X-ray diffraction (XRD) for crystalline samples, especially clay e.g. Reynolds 1989
minerals
Particle size measurements
Sieving PSD for particles >0.063 mm SFS-EN 933-1
PSD for particlesGeological Survey of Finland, Open File Research Report 16/2018
Water quality prediction of mining waste facilities based on predictive models
according to the recommended nomenclature. A for crystalline samples, and especially useful for
simplified petrographic description, of which OM is clay mineral determination. For mine wastes, this
a part, can be made in accordance with the European method is typically used to define their preliminary
Standard EN 932-3:1996 with the incorporation of modal mineralogy or to identify the mineralogical
its amendment A1:2003. composition of secondary precipitates or sludges.
SEM produces superficial images of a sample by XRD studies are commonly complemented with SEM
scanning it with an accelerated and focused beam studies, and occasionally also with other methods,
of electrons. The electrons interact with the sam- e.g. thermal analysis or infrared spectrophotometry
ple, revealing information concerning the texture, (Reynolds 1989, Karlsson 2017).
chemical composition, and crystalline structure The particle-size distribution of a mine waste
and orientation of the sample material. The geo- sample can be obtained, for example, by sieving
logical applications of SEM are widely used, e.g. in according to the standard SFS-EN 933-1. The stand-
determining mineral abundances, grain sizes and ard sieving method is suitable for particle sizes
microstructures. The SEM method is rapid and ranging from a few hundred millimetres to 0.063
accurate in identifying environmentally hazardous mm. Estimation of the particle-size distribution in
minerals, i.e. typically sulphide minerals, as well a waste rock pile is challenging, as very large-scale
as those minerals providing neutralizing capacity sieve analyses, which are needed for boulders with
in mine wastes. It is also optimal in studying the diameters up to thousands of millimetres, are dif-
weathering state of minerals, particularly sulphide ficult to perform. Some widely varying waste rock
minerals, and their weathering products. In addi- PSD estimations from previous studies have been
tion, SEM can provide information on the mineral presented by Kempton (2012). Particle sizes below
associations of various minerals and element dis- 0.063 mm can be analysed by several methods, for
tributions within the minerals. In preliminary mine example with wet method laser diffraction or with
waste characterisation, SEM can provide informa- X-ray sedimentation. The former is based on the
tion concerning overall mineralogy, the grain- scattering of a laser beam passing through a dis-
size distribution and elemental deportments, to persed particulate sample, while the latter is based
make an initial assessment of the environmental on the particle sedimentation speed and equivalent
properties of mine waste and to produce essential Stokes diameter (Cepuritis et al. 2017). According
information for modelling purposes. Several types to Cepuritis et al. (2017), these two methods are
of SEM setups and variations exist, with the dif- recommendable, since a large amount of surface
ferences being mainly in the amount and charac- area is concentrated among the very small particles
teristics of the attached detectors (BSE, SEI, CL), (even below 5 µm). However, in many cases, sieving
spectrometers (EDS, EDX) and software (e.g. MLA, may need to be combined with one of these meas-
QEMSCAN, AMICS, INCA, Aztec). (e.g. Swapp 2014, urements to cover the whole range of particle sizes
Karlsson & Kauppila 2017) in the waste material. The surface area of a sample
XRD can be used for the reliable, swift quan- can be calculated, for example, based on the PSD
titative and qualitative identification of miner- and by using MDAG Grain 3.0 software, which can
als, mineral abundances and the most technical be accessed from http://www.mdag.com/grain30.
products. However, this method is most suitable html (Declercq et al. 2017).
3.2 Geochemical characterisation
The geochemical characterisation of mine wastes cence spectrometry (XRF), which is used to analyse
is carried out to identify the primary contaminants the total chemical composition of wastes. In this
and other elements of concern in the wastes and method, a sample is subjected to short wavelength
to assess the leachability of substances from the X-rays, which in turn induce the emission of longer
wastes. Analytical methods for determining the ele- wavelength X-rays from the sample. In some XRF
ment concentrations in rock samples can generally methods, the sample is fused into lithium borate
be categorized as destructive or non-destructive. glass and would therefore be considered as destruc-
Non-destructive methods leave the sample intact, tive (Crock et al. 1999, Lapakko 2002).
whereas destructive methods dissolve the sample. A Destructive methods for total element concen-
common non-destructive method is X-ray fluores- trations include the use of multiple strong acids,
17You can also read