Assessing Impacts of Wind-Energy Development on Nocturnally Active Birds and Bats: A Guidance Document
←
→
Page content transcription
If your browser does not render page correctly, please read the page content below
Assessing Impacts of Wind-Energy Development
     on Nocturnally Active Birds and Bats:
            A Guidance Document

Thomas H. Kunz, Edward B. Arnett, Brian M. Cooper, Wallace P.
 Erickson, Ronald P. Larkin, Todd Mabee, Michael L. Morrison,
          M. Dale Strickland, and Joseph M. Szewczak

    Journal of Wildlife Management 71(8): 2449–2486; 2007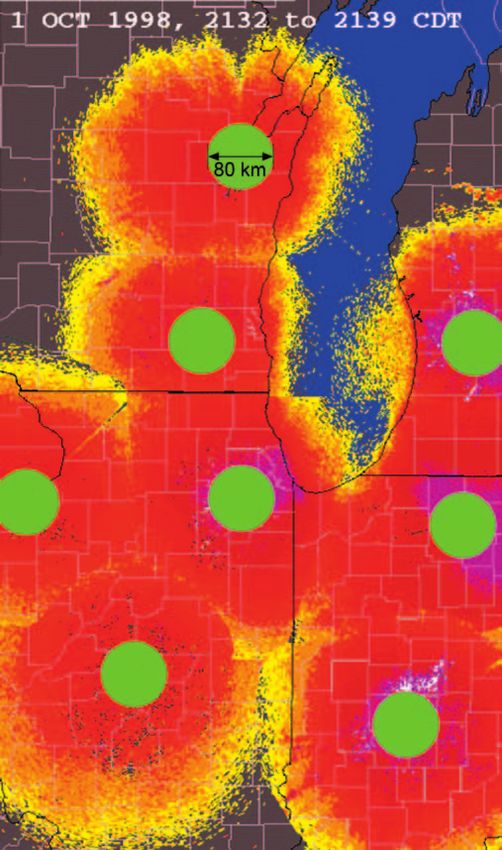
Front Cover--Three species of migratory tree bats most often killed by utility-scale wind
turbines in North America--silver-haired bat, Lasionycteris noctivagans (upper left),
eastern red bat, Lasiurus borealis (lower left), and hoary bat, Lasiurus cinereus (upper
right)--flying in the vicinity of the Mountaineer Wind Energy Center, Tucker County,
West Virginia. Images of bats by Merlin D. Tuttle, wind turbines by Edward B. Arnett,
and cover design by Jason Huerta, Bat Conservation International.
Invited Paper

Assessing Impacts of Wind-Energy Development on
Nocturnally Active Birds and Bats: A Guidance Document
        THOMAS H. KUNZ,1 Department of Biology, Boston University, Boston, MA 02215, USA
        EDWARD B. ARNETT, Bat Conservation International, Austin, TX 78716, USA
        BRIAN M. COOPER, Alaska Biological Research, Inc., Forest Grove, OR 97116, USA
        WALLACE P. ERICKSON, Western EcoSystems Technology, Inc., Cheyenne, WY 82070, USA
        RONALD P. LARKIN, Illinois Natural History Survey, Champaign, IL 61820, USA
        TODD MABEE, Alaska Biological Research, Inc., Forest Grove, OR 97116, USA
        MICHAEL L. MORRISON, Department of Wildlife and Fisheries Sciences, Texas A&M University, College Station, TX 77843, USA
        M. DALE STRICKLAND, Western EcoSystems Technology, Inc., Cheyenne, WY 82070, USA
        JOSEPH M. SZEWCZAK, Department of Biological Sciences, Humboldt State University, Arcata, CA 95521, USA

           ABSTRACT Our purpose is to provide researchers, consultants, decision-makers, and other stakeholders with guidance to methods and metrics
           for investigating nocturnally active birds and bats in relation to utility-scale wind-energy development. The primary objectives of such studies are to
           1) assess potential impacts on resident and migratory species, 2) quantify fatality rates on resident and migratory populations, 3) determine the causes
           of bird and bat fatalities, and 4) develop, assess, and implement methods for reducing risks to bird and bat populations and their habitats. We describe
           methods and tools and their uses, discuss limitations, assumptions, and data interpretation, present case studies and examples, and offer suggestions
           for improving studies on nocturnally active birds and bats in relation to wind-energy development. We suggest best practices for research and
           monitoring studies using selected methods and metrics, but this is not intended as cookbook. We caution that each proposed and executed study will
           be different, and that decisions about which methods and metrics to use will depend upon several considerations, including study objectives, expected
           and realized risks to bird and bat populations, as well as budgetary and logistical considerations. Developed to complement and extend the existing
           National Wind Coordinating Committee document ‘‘Methods and Metrics for Assessing Impacts of Wind Energy Facilities on Wildlife’’
           (Anderson et al. 1999), we provide information that stakeholders can use to aid in evaluating potential and actual impacts of wind power
           development on nocturnally active birds and bats. We hope that decision-makers will find these guidelines helpful as they assemble information
           needed to support the permitting process, and that the public will use this guidance document as they participate in the permitting processes. We
           further hope that the wind industry will find valuable guidance from this document when 1) complying with data requirements as a part of the
           permitting process, 2) evaluating sites for potential development, 3) assessing impacts of operational wind-energy facilities, and 4) mitigating local
           and cumulative impacts on nocturnally active birds and bats. (JOURNAL OF WILDLIFE MANAGEMENT 71(8):2449–2486; 2007)

                                                                                                                                  DOI: 10.2193/2007-270

           KEY WORDS bats, birds, methods, metrics, migration, wind energy.

Wind energy is one of the fastest growing sectors of the                                  2007, Arnett et al. 2008), we developed this document to
energy industry (Pasqualetti et al. 2004, National Research                               supplement the earlier methods and metrics document.
Council [NRC] 2007), a relatively recent development that                                   The methods and metrics we consider herein include those
has led to unexpected environmental consequences (Morri-                                  suitable for assessing both direct and indirect impacts of
son and Sinclair 2004, Manville 2005, Kunz et al. 2007).                                  wind energy. Direct impacts of wind-energy facilities refer
The large number of raptor fatalities discovered at Altamont                              to fatalities resulting from night-flying birds and bats being
Pass in California in the early 1980s triggered widespread                                killed directly by collisions with wind turbine rotors and
                                                                                          monopoles. Indirect impacts of wind-energy development
concern from environmental groups and wildlife agencies
                                                                                          refer to disruptions of foraging behavior, breeding activities,
about possible impacts to bird populations (Anderson and
                                                                                          and migratory patterns resulting from alterations in land-
Estep 1988; Estep 1989; Orloff and Flannery 1992, 1996).
                                                                                          scapes used by nocturnally active birds and bats. Direct and
Anderson et al.’s (1999) comprehensive review and analysis                                indirect impacts on birds and bats can contribute to
of methods and metrics for the study of impacts of wind-                                  increased mortality, alterations in the availability of food,
energy facilities on birds provided valuable guidelines for                               roost and nest resources, increased risk of predation, and
assessing diurnally active wildlife but offered limited                                   potentially altered demographics, genetic structure, and
guidance on methods for assessing impacts on nocturnally                                  population viability (NRC 2007).
active birds and bats. Given the projected growth of the
wind-energy industry in the United States and emerging                                    LIMITS OF CURRENT KNOWLEDGE
concerns over possible cumulative impacts of wind-energy
                                                                                          ABOUT IMPACTS ON NOCTURNALLY
                                                                                          ACTIVE BIRDS AND BATS
facilities on nocturnally active birds and bats (Government
Accountability Office [GAO] 2005, Manville 2005, NRC                                      Songbirds
                                                                                          Songbirds are by far the most abundant flying vertebrates in
1
    E-mail: kunz@bu.edu                                                                   most terrestrial ecosystems, and until recently have been

Kunz et al.   !   Wind-Energy Development on Birds and Bats                                                                                                           2449
among the most frequently reported fatalities at utility-scale    however, about potential risks and fatalities in other regions
wind facilities in the United States. In a review of bird         in North America where wind-energy facilities are being
collisions reported from 31 studies at utility-scale wind-        developed at an unprecedented rate.
energy facilities in the United States, Erickson et al. (2001)
showed that 78% of carcasses found at wind-energy                 Challenges to Impact Assessment and Prediction
facilities outside of California were songbirds protected by      Predicting impacts on bird and bat populations based on
the Migratory Bird Treaty Act (16 United States Code 703–         fatalities reported from existing wind facilities presents
712); among these, approximately half were nocturnal,             several challenges. Lack of reliable correction factors for
migrating passerines. The number of passerine fatalities          biases associated with searcher efficiency and scavenging
reported in other studies has ranged from no birds during a       make it difficult to derive reliable estimates of fatalities for a
5-month survey at the Searsburg Vermont Wind Energy               given site or season, let alone to compare results from
Facility, Searsburg, Vermont, USA (Kerlinger 1997) to 11.7        different regions and years to confidently predict cumulative
birds per megawatt (MW) per year during a 1-year study at         impacts (Kunz et al. 2007, NRC 2007, Arnett et al. 2008).
Buffalo Mountain Wind Energy Center, Anderson County,             Several studies using radar have been conducted during
Tennessee, USA (Nicholson 2003). Given the increasing             preconstruction periods in efforts to estimate potential risks
number of installed and proposed wind-energy facilities, the      to nocturnal migrants. However, to date, none have
relatively large number of passerine fatalities at wind-energy    provided sufficient evidence to reliably predict actual risk.
facilities on forested ridge tops in the eastern United States,   In part, this may reflect the fact that existing sites typically
such as Buffalo Mountain Wind Energy Center, Anderson             have different ecological characteristics both before and after
County, Tennessee, and the Mountaineer Wind Energy                development (e.g., undisturbed forested ridge top vs. cleared
Center, Tucker County, West Virginia has raised concern           ridge top with installed wind turbines).
regarding the potential risk to nocturnally active songbirds            Bias correction factors.—Scavengers are known to
(Kerns and Kerlinger 2004, GAO 2005, Fiedler et al. 2007,         remove bird and bat carcasses before researchers are able
NRC 2007, Arnett et al. 2008).                                    to discover them and, thus, fatality rates will most likely be
                                                                  underestimated unless reliable estimates of scavenging rates
Bats                                                              are developed and applied to observed fatalities (Morrison
Recent monitoring studies indicate that utility-scale wind-       2002). Bias correction factors also are needed to adjust
energy facilities in the continental United States have killed    fatality estimates for searcher efficiency. For example, a
considerably more bats than were expected based on early          study in West Virginia used test subjects (fresh and frozen
monitoring studies where birds have been the primary focus        bats or birds) to evaluate searcher efficiency and found that,
of attention (NRC 2007). Large numbers of bats have been          on average, only about half of the animals were found by
killed at wind-energy facilities constructed along forested       human observers (Arnett 2005, Arnett et al. 2008). More-
ridge tops in the eastern United States (GAO 2005, Kunz et        over, bats killed by wind turbines were twice as likely to be
al. 2007, NRC 2007, Arnett et al. 2008). The highest              found by human observers in grassland areas compared to
fatality rates at these facilities have ranged from 15.3 bats/    those in agricultural landscapes and along cleared forested
MW/year at the Meyersdale Wind Energy Center,                     ridge tops. In a recent study, trained dogs were able to find
Somerset County, Pennsylvania to 41.1 bats/MW/year at             71% of the bat carcasses during searcher-efficiency trials at
the Buffalo Mountain Wind Energy Center (Fiedler 2004,            the Mountaineer site in West Virginia and 81% at the
Kunz et al. 2007, NRC 2007, Arnett et al. 2008). A recent         Meyersdale site in Pennsylvania, compared to 42% versus
follow-up study conducted at the Buffalo Mountain site            14%, respectively, for human searchers (Arnett 2006).
reported fatality rates of 53.3 bats/MW/year at 3 small                 Causal mechanisms of impact.—Cooperation of the
(0.66-MW) Vestas V47 wind turbines (Vestas Wind                   wind-energy industry is needed to help researchers develop
Systems A/S, Ringkøbing, Denmark) and 38.7 bats/MW/               a better understanding of how birds and bats interact with
year at 15 larger (1.8-MW) Vestas V80 turbines (Fiedler et        wind-energy facilities and to help identify the causal
al. 2007). Another recent study, conducted at the Maple           mechanisms of impact (Kunz et al. 2007, NRC 2007).
Ridge Wind Power Project, Lewis County, New York, USA             Research and monitoring studies are needed to assess
estimated bat fatalities ranging from 12.3 bats to 17.8 bats/     activities and abundance of birds and bats 1) before
MW/year (depending on carcass search frequency) at 1.65-          construction (e.g., before forests have been cleared and
MW Vestas wind turbines (Jain et al. 2007). Bat fatalities        linear landscapes have been created); 2) after turbines have
reported from most other regions of the United States have        been installed (but before they become operational); and 3)
ranged from 0.8 bats to 8.6 bats/MW/year, although these          after they have become operational, to test hypotheses
estimates were largely based on studies designed to estimate      needed to assess impacts of wind-energy facilities on birds
bird fatalities (but see Johnson et al. 2003, 2004, 2005). In     and bats (Kunz et al. 2007, NRC 2007).
addition to these fatalities, bats have been killed at wind-        Results of such research could help researchers identify
energy facilities located in agricultural areas of southwestern   and the wind industry implement mitigation measures to
Alberta, Canada (Barclay et al. 2007), and in a mixed             avoid or minimize impacts on nocturnally active wildlife at
woodland–shrub–grassland landscape in north-central               existing facilities. For example, studies using thermal
Oklahoma, USA (Piorkowski 2006). Little is known,                 infrared imaging (Horn et al. 2008) and evidence from bat

2450                                                                                       The Journal of Wildlife Management   !   71(8)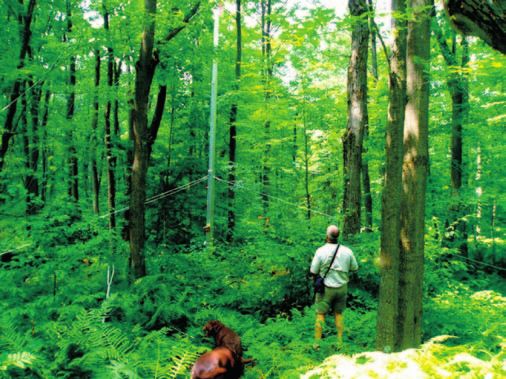
carcasses recovered at the Mountaineer and Meyersdale              2000, Gannon et al. 2003). Moreover, individuals charged
Wind Energy Centers in 2004 (Arnett 2005, Arnett et al.            with monitoring the activities of birds and bats must be
2008) indicate that most fatalities occurred at times of low       thoroughly familiar with the operation and limitations of
wind speeds (typically ,6 m/sec), conditions under which           each method or device before initiating field studies.
rotor blades are moving but the amount of electricity
generated is minimal (NRC 2007). These data suggest that           Visual Methods for Monitoring Nocturnal Activity
a first-order priority should be to test the hypothesis that bat   Making meaningful visual observations requires not only
fatalities could be markedly reduced by mechanically               selecting the appropriate methods and equipment (Allison
feathering turbine blades (i.e., electronically pitching the       and De Stefano 2006), but it is essential that temporal and
blades parallel to the wind, effectively making them               spatial scales of observations also be included to answer
stationary) at low wind speeds (Kunz et al. 2007, Arnett           relevant questions.
et al. 2008).                                                            Moon watching.—Early investigators used a moon-
  Well-designed before-after-control impact (BACI) and             watching technique during full-moon periods with clear
comparative studies, and those that test responses of birds        skies to observe migratory birds (Lowery 1951, Lowery and
and bats to different operational conditions, are needed to        Newman 1955). By directing a telescope of sufficient power
fully evaluate options for mitigating fatalities to birds and      (20–303) toward the full moon during periods of migration,
bats at wind-energy projects (Kunz et al. 2007, NRC 2007).         it is possible to observe silhouettes of birds and bats as they
In this context, some success has been achieved with the           pass before the illuminated disc of the moon. The primary
installation of new turbine designs (e.g., lattice towers          limitation of this method is that sampling conditions are
replaced with monopoles and fewer and taller turbines), and        limited to cloudless nights with a full moon.
by testing visual deterrent by using different colors on                 Ceilometry.—Given the limitations of moon watching,
turbine blades (Hodos 2003). A current study is underway to        Gauthreaux (1969) developed a portable ceilometer to
test the efficacy of acoustic deterrents (E. B. Arnett, Bat        observe low-altitude nocturnal migrations on nights when
Conservation International, unpublished data).                     the moon was not visible. This method employed an
  We summarize methods for assessing risks to birds and            auxiliary light source (e.g., 100-W lamp) to illuminate a
bats associated with proposed and operational wind-energy          portion of the night sky that could then be sampled using
facilities. A number of methods are available to observe           binoculars or a spotting scope. This method has been used
nocturnal activities of birds and bats, including: night-vision    to detect large numbers of bird species flying !305 m above
observations, thermal infrared imaging, radar monitoring,          ground level (agl) with 73 binoculars, several bird species
acoustic recordings, and radiotracking (telemetry). Other          !457 m agl with a 203 telescope, and at detecting larger
research methods, including direct capture, collection of          passerines (e.g., thrushes) !640 m agl with a 203 telescope
tissue for stable isotopes and DNA analysis, estimates of          (Gauthreaux 1969).
population size and genetic structure, and fatality assess-          Able and Gauthreaux (1975) used a ceilometer to quantify
ments, provide critical information needed to assess direct,       the nocturnal migration of passerines, and expressed the
indirect, and cumulative impacts.                                  magnitude of migration as the number of birds per 1.6 km
                                                                   of migratory front per hour, a metric derived from moon
METHODS AND METRICS FOR                                            watching that also is currently used in some radar studies.
OBSERVING NOCTURNAL BEHAVIOR                                       Williams et al. (2001) used 300,000 candle power (Cp)
OF BIRDS AND BATS                                                  spotlights instead of portable ceilometers for observing
Current understanding of where, when, how, and why bats            activity of thrush-sized passerines !500 m agl. The ability
and nocturnally active birds come into contact with wind           to detect airborne targets at night using artificial illumina-
turbines is limited by our ability to observe how they behave      tion diminishes with the square of distance from the
near these structures. Answering some of the most basic            observer and, thus, will depend on the intensity and effective
questions requires careful observations with appropriate           range of the source of illumination.
methods to assess the nocturnal and seasonal timing of               Although ceilometers can provide information about
flight behavior of birds and bats in the vicinity of proposed      relative traffic rates of nocturnal migrants, the beam of
and operating wind turbines. No single method or protocol          light samples a very small area relative to the available area
can be used to unambiguously assess temporal and spatial           potentially occupied by nocturnal migrants. Additionally,
variation in natural populations or the impacts of wind            visible light from the ceilometer tends to attract birds and
turbines on nocturnally active birds and bats. Each device or      insects and, thus, can lead to biased results. This problem
method has its own strengths, limitations, and biases, and         was recognized by Williams et al. (2001), where birds were
the selection and application of one or multiple methods will      observed around dim light scattered from the ceilometer.
depend on the specific objectives to be addressed. Sufficient      Estimates of flight altitude derived from this method also
information should be acquired to enable researchers to meet       might be biased due to the greater probability of visually
the stated goals of a proposed study. To avoid misinter-           detecting lower flying birds and the general difficulty of
preting results, assumptions and limitations of each method        visually estimating flight altitude. Detection biases associ-
must be explicitly acknowledged and evaluated (e.g., Hayes         ated with this method have not been objectively quantified.

Kunz et al.   "   Wind-Energy Development on Birds and Bats                                                                  2451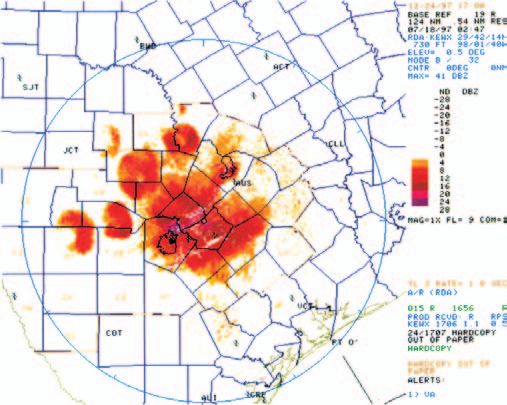
Figure 1. Method for observing and recording activity of bats and birds at   Figure 2. Thermal infrared image of foraging Brazilian free-tailed bats
wind-energy projects using night-vision goggles and 2 supplementary light    (Tadarida brasiliensis) in south-central Texas, USA. Warm bats are
sources equipped with infrared filters (B. A. Cooper, Alaska Biological      distinguished from the cooler background of clear sky and clouds (T. H.
Research, Inc., unpublished data).                                           Kunz and M. Betke, Boston University, unpublished data).

      Night-vision imaging.—Visual observations that em-                     ability of animals because of cloud cover, atmospheric
ploy night-vision goggles (NVG) and scopes, powerful (3-                     moisture, and the effect of distance on detection. Night-
million Cp) spotlights, and reflective infrared cameras have                 vision devices, each of which contain photo-multiplier cells,
greatly improved in recent years. Improvements of the NVG                    also produce inherent visual noise, often making it difficult
method over earlier visual methods include 1) greater                        for observers to distinguish small birds from bats at night,
freedom to follow and identify birds, bats, and insects; 2)                  even within the height of the rotor-swept zone of utility-
use of both fixed and mobile spotlights that increase the                    scale wind turbines.
ability to detect and identify animals correctly; and 3)                           Thermal infrared imaging.—In contrast to night-vision
infrared filters that eliminate the attraction of insects, birds,            technology, thermal infrared imaging cameras are designed
and bats to supplemental sources of visible light.                           to detect heat emitted from objects in a field of view without
  These improvements have made it possible to identify                       the need for artificial illumination. The metabolic heat
small birds and bats aloft at distances !150 m. Mabee et al.                 produced by birds and bats (and some insects) produces a
(2006a) used third-generation NVG with a 13 eyepiece                         distinct image against a cooler background (Fig. 2).
(Model ATN-PVS7; American Technologies Network                               Typically, images can be captured at rates ranging from 30
Corporation, San Francisco, CA), along with 2 3-million–                     frames to 100 frames per second (fps), depending on the
Cp spotlights fitted with infrared filters to illuminate flying              camera, and digitally recorded to computer hard drives.
targets aloft at a planned wind-energy facility in New York                  Automated detection and tracking algorithms have been
state. Using this method, Mabee et al. (2006a) viewed the                    developed that may prove useful for assessing the behavior
night sky through NVG and were able to track and identify                    of birds and bats flying in the vicinity of wind turbines
moving targets using one stationary spotlight (mounted on a                  (Descholm et al. 2006, Betke et al. 2008).
tripod with the beam oriented vertically) and a mobile                         Several studies have employed thermal infrared imaging
spotlight (handheld with the beam parallel to the fixed                      cameras to observe movements of birds and bats flying near
spotlight’s beam; Fig. 1).                                                   wind-energy facilities. Desholm (2003) and Desholm et al.
  For each bird or bat detected, flight direction, flight                    (2004, 2006) used a long-wave (7–15 lm) thermal infrared
altitude, and flight behavior (e.g., straight-line, zig-zag,                 camera (Thermovision IRMV 320V; Forward Looking
circling, hovering) often can be detected. Species identi-                   Infrared [FLIR], Boston, MA), deployed as part of the
fication, however, is rarely possible using this method. Video               Thermal Animal Detection System for automatic detection
recordings of flight behavior can be recorded and analyzed                   of avian collisions at an offshore wind-energy facility in
repeatedly to determine how birds or bats respond to                         Denmark. This system is triggered automatically when a
moving wind turbines. Metrics produced from NVG images                       target is detected and can be controlled remotely. In
include proportions of birds and bats observed flying at low                 southwest Germany, Brinkmann et al. (2006) used a
altitudes (!150 m agl, the max. distance that passerines and                 Mitsubishi Thermal Imager (IR-5120AII; Mitsubichi
bats can be discerned using this method), flight direction,                  Electric Corporation, Kamakura, Japan) to observe bats in
and relative number of birds and bats observed per hour                      the vicinity of 2 wind turbines. This thermal camera
(standardized by estimating distance to targets if and when                  operated at short wave lengths (3–5 lm) at 60 fps, and
comparisons among studies are made).                                         had a detector array consisting of 512 3 512 pixels, and with
  Limitations of the NVG method include variable detect-                     a 50-mm, F 1.2 infrared lens, provided a 148 3 118 field of

2452                                                                                                    The Journal of Wildlife Management   "   71(8)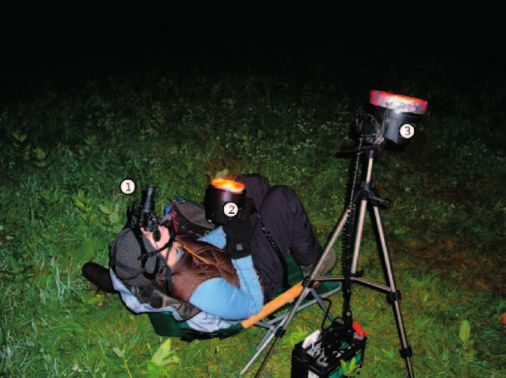
Figure 4. The distribution of activity during the night for bats, birds,
                                                                              insects, and unknown objects recorded with thermal infrared cameras from
                                                                              2030 hours to 0530 hours at the Mountaineer Wind Energy Center, Tucker
Figure 3. Configuration of 3 thermal infrared cameras for recording nightly
                                                                              County, West Virginia, USA, August 2005 (from Horn et al. 2008).
observations of airborne targets (i.e., bats, birds, and insects) at the
Mountaineer Wind Energy Center in Tucker County, West Virginia, USA.
Cameras are positioned 30 m from the turbine base and pointed directly
upwind and perpendicular to the plane of blade rotation. Observed bats,
                                                                                Horn et al. (2008) deployed 3 FLIR Systems S-60,
birds, and insects were classified into high, low, and medium categories      uncooled, microbolometer thermal infrared cameras (FLIR,
corresponding to flight elevation above ground level (from Horn et al.        North Billerica, MA), with matched and calibrated 258
2008).                                                                        lenses to observe the behavior of bats in the vicinity of
                                                                              operating wind turbines at the Mountaineer Wind Energy
view. With this system, flight patterns of bats could be                      Center in the Mid-Atlantic Highlands, West Virginia (Fig.
distinguished at a distance of 100 m.                                         3). Data were captured at a rate of 30 fps and recorded
  Liechti et al. (1995) used a long-range thermal imaging                     directly to external 250-gigabyte hard drives that were
unit (Long Range Infrared System, IRTV-445L; Inframet-                        connected to laptop computers. Horn et al. (2008) showed
rics, Nashua, NH) with a 1.458 telephoto lens and were able                   that bat activity near wind turbines during August was
to detect nearly 100% of all small passerines within the field                highly variable on a nightly basis, with most of the activity
of view at a distance of 3,000 m. The same unit was used in                   of bats occurring during the first 2–3 hours after sunset (Fig.
Sweden to monitor autumn bird migration (Zehnder and                          4). Although airborne insects were most active in the first
Karlsson 2001, Zehnder et al. 2001) and in Africa, on the                     several hours after sunset, their activity was highly variable.
edge of the Sahara desert, to study nocturnal bird migration
(Liechti et al. 2003). Gauthreaux and Livingston (2006)
used a thermal imager (Radiance 1; Amber Raytheon,
Goleta, CA) to study nocturnal migration at Pendleton,
South Carolina, and Wallops Island, Virginia, USA, when
weather conditions (no rain and relatively clear skies)
allowed data collection. Daylight observations were made
at McFaddin National Wildlife Refuge, Texas, USA. This
thermal imaging camera, with a 100-mm lens, and a field of
view of 5.578 (horizontal screen dimension) and 4.198
(vertical screen dimension), recorded data at 60 fps, and
yielded an image of 482 3 640 pixels at full-screen
resolution. A vertically directed thermal imaging camera
and a fixed-beam vertical pointing Pathfinder radar, Model
3400 (Raytheon Inc., Manchester, NH) was used with a
parabolic antenna (61-cm diam) that produced a beam
width of 48 to monitor bird, bat, and insect movements
based on the characteristics of tracks in the video images and
the altitude of the target derived from the radar unit. Data
                                                                              Figure 5. A time-lapse series of 21 sequential frames of thermal infrared
from the thermal imaging camera and radar were combined                       video of a medium-height bat immediately before and after collision with
into a single video image and stored on digital videotape.                    an operational wind turbine recorded on 14 August 2004 at the
This approach produced quantitative data on migration                         Mountaineer Wind Energy Center, Tucker County, West Virginia,
                                                                              USA. The bat approached the moving blade on a curving trajectory before
traffic at several altitudinal bands and made it possible for                 contact, but its heading and speed changed rapidly as the bat accelerated
the investigators to distinguish birds from insects and                       toward the ground. Only the single frame of video in which contact
foraging bats.                                                                occurred is shown for clarity (from Horn et al. 2008).

Kunz et al.   !   Wind-Energy Development on Birds and Bats                                                                                       2453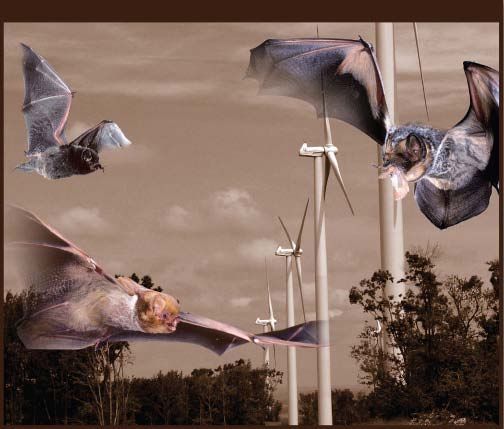
Horn et al. (2008) suggested that the probability of being       (Eptesicus fuscus) and found that individuals navigated to
struck by moving turbine blades (Fig. 5) could be predicted      feeding grounds by following acoustic cues produced by
by a combination of insect activity aloft and nightly weather    calling frogs and stridulating insects. Light tags also can be
conditions. In addition to bats struck directly by moving        used to follow individuals while their echolocation calls are
turbine blades, Horn et al. (2008) also observed flying bats     monitored with ultrasonic detectors and, thus, can be used
investigating moving rotors and the monopole. Bats some-         to validate species-specific calls (J. Swewczak, Humboldt
times alighted upon and appeared to explore the monopole         State University, personal communication).
and rotor blades, suggesting that they may be attracted to         The primary limitation of chemiluminescent tags is that
these structures.                                                they remain illuminated only for a few hours. By contrast,
  Results from thermal infrared imaging cameras ideally          LED tags can last upwards of 2 weeks. Another limitation is
should be compared with other methods including radar and        that bats often fly rapidly beyond the field of view, and
acoustic detection for monitoring bird and bat movements         generally cannot be followed in heavily forested areas.
in the lower atmosphere at the height of wind turbines           Moreover, in some instances light-tagged bats may be
(Liechti et al. 1995, Gauthreaux and Livingston 2006).           difficult to distinguish from flashing fireflies. More recent
Many of the limitations of other visual methods are              evidence suggests that bats carrying light tags may interfere
common to thermal infrared imaging, but the latter method        with the social interactions of roosting bats (Kunz and
also incurs a relatively high cost with large data-processing    Weisse 2008).
requirements. Current costs for the purchase of suitable               Analysis of visual data.—With the exception of data
thermal infrared cameras ($60,000–200,000) are expected to       derived from light tags, visual-based surveys of bat activity
decrease in the near future.                                     using ceilometers, night vision, and thermal imaging
     Light tagging.—Small chemiluminescent light tags or         cameras should report number of passes per recording hour
mini glow sticks offer the potential for observing the flight    or mean number of passes per recording hour. For
behavior of individual bats in the vicinity of proposed and      consistency and comparison, recording time should be
operational wind-energy facilities. Light tags have been used    normalized to minutes past sunset. This protocol facilitates
to mark bats for investigations of roosting and foraging         pooling and comparing data throughout a season or across
behavior (Barclay and Bell 1988, Kunz and Weisse 2008).          multiple seasons (Horn et al. 2008). In addition to assessing
Small, chemiluminescent capsules (2 3 11 mm), manufac-           overall activity, data should be documented by date, camera
tured as fishing lures, make excellent temporary light tags      type, and lenses used to characterize temporal or spatial
for marking and observing bats at night. Battery-powered         peaks in activity. Data on bat, bird, and insect activity
light-emitting diodes (LEDs) also can be used for marking        derived from thermal infrared imaging or other visual
and observing bats flying at night (Barclay and Bell 1988,       methods should be compared with meteorological data to
Kunz and Weisse 2008). Depending upon the size of the            establish potential effects of these variables on relative
battery and the oscillation frequency of LEDs, such tags can     abundance and nightly and seasonal activity.
last up to 14 days. Commercially produced LED tags are
available in green and red light and are relatively small (3 3   Radio Detection and Ranging (Radar)
12 mm and 1.0 g), with the battery and circuitry                 Radio detection and ranging (radar) has been used for over
encapsulated in inert waterproof epoxy (Holohil Systems          half a century to investigate nocturnal flight activity of birds,
Ltd., Carp, ON, Canada).                                         insects, and bats (Eastwood 1967, Vaughn 1985, Gau-
  Chemiluminescent tags and LEDs should be attached to           threaux and Belser 2003, Larkin 2005, NRC 2007).
the mid-dorsal region of bats with SkinBonde surgical            However, only recently has this technology been used to
adhesive (Smith & Nephew, Largo, FL). Attaching light            evaluate the activity of airborne targets in the vicinity of
tags to the ventral surface of bats should be avoided, because   wind-energy facilities (Mabee and Cooper 2004, Desholm
a tag in this position may interfere with females if they have   et al. 2006, Gauthreaux and Livingston 2006, Mabee et al.
dependent young. Buchler (1976) and Buchler and Childs           2006a, b). Radar operates by transmitting pulses of electro-
(1981) used chemiluminescent light tags to assess the            magnetic radiation (radio waves) and then receives the waves
dispersal, commuting, and foraging behavior of insectivo-        that reflect back from an object (e.g., insect, bird, bat, plane,
rous bat species. Other investigators (e.g., LaVal and LaVal     or ship). Radio waves travel close to the speed of light and
1980, Aldridge and Rautenbach 1987) have used chem-              the distance to the object is, thus, related to the time lapse
iluminescent and LED tags with the greatest success when         between transmission and reception of the echo. Detection
observations were made in open areas, in flyways, and along      of objects at a distance depends upon many factors,
forest edges and, thus, such tags may be particularly valuable   including area of the radar cross-section of the object, and
for observing bats in the vicinity of wind turbines.             the wavelength and power output of the radar. For birds,
  Use of chemiluminescent light tags may offer opportu-          this distance may vary from a few hundred meters when
nities to observe the behavior of bats in response to sounds     using the smallest marine radars to .200 km in the case of
produced by moving wind-turbine blades or to insects that        long-range weather surveillance radars. For more details on
may attract bats to these structures (NRC 2007). Buchler         theory and operation of radar, see Skolnik (1990) and
and Childs (1981) attached light tags to big brown bats          Larkin (2005).

2454                                                                                      The Journal of Wildlife Management   !   71(8)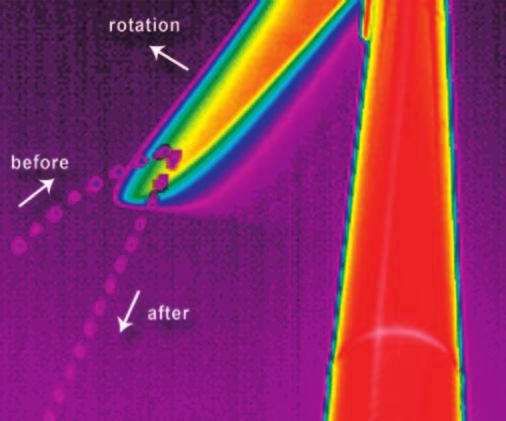
Weather surveillance radar.—Weather Surveillance Ra- surveillance mode), the radar scans the surrounding area and
dar-1988 Doppler, also known as Next Generation Radar can be used to collect information on flight direction, flight
(NEXRAD) provides a network of weather stations in the behavior, passage rates, and ground speeds of targets (Table
United States operated by the National Weather Service 1). When the antenna (or a second antenna, if unit is
(NWS), making it possible to monitor movements of equipped with 2 radars) is placed in the vertical position
insects, birds, and bats that move over large areas (i.e., (i.e., in vertical mode), it can be used to measure flight
within approx. 200 km). The United States military, local altitudes (Table 1). Configurations of marine radar antenna
television stations, and municipal airports use similar also can be modified to measure flight altitudes with a
weather radar systems, but data generated by these parabolic dish (Cooper et al. 1991, Gauthreaux 1996) or by
installations generally are not available to researchers. Data a horizontal antenna configured in a vertical position
generated by the NWS-operated NEXRAD facilities can be (Harmata et al. 1999).
downloaded free of charge via the Internet. Data generated Marine radars have been used at several proposed and
from these weather surveillance radars can be used to operational wind-energy facilities in the United States. The
determine general migratory patterns, migratory stopover principal advantage of these systems over Doppler and
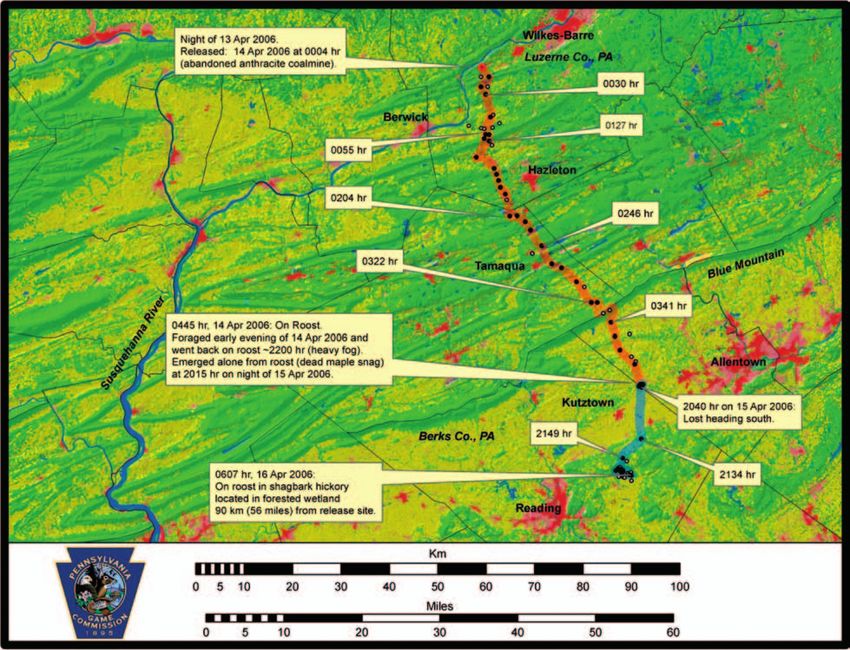
habitats, roost sites, and nightly dispersal patterns (Fig. 6), tracking radars is that they are relatively inexpensive, are
and to assess the effects of weather conditions on these available off-the-shelf, require little modification or main-
behaviors (Diehl et al. 2003, Gauthreaux and Belser 2003, tenance, have repair personnel readily available worldwide,
Diehl and Larkin 2004, Horn 2007, NRC 2007). are dependable and easy to operate, are highly portable (can
However, NEXRAD cannot be used to characterize high- mount on vehicles, boats, or small platforms on land), have
resolution passage rates or altitudinal data over small spatial high resolution, and can be modified to collect altitudinal
scales (the min. resolution is 18 3 250 m, which is about 0.2 information by changing their broadcast to a vertical mode.
km2 at 40-km range). The high resolution of NEXRAD Largely because of these factors, most research and
often makes it difficult to filter out insect noise from data on monitoring studies conducted on birds and bats have been
birds and bats because it does not provide information on accomplished using marine radar systems (Harmata et al.
individual targets. Owing to the curvature of the earth and 1999, Cooper and Day 2004, Mabee and Cooper 2004,
resultant shadows (e.g., areas behind hills or other objects Desholm et al. 2006, Mabee et al. 2006a). However, like
that shield targets from radar), NEXRAD radar cannot NEXRAD, marine radar generally is not capable of
provide spatial coverage at or below wind turbine height. differentiating bird and bat targets. Although it has long
Notwithstanding, NEXRAD can be a valuable tool for been assumed that marine radar can be used to document
assessing spatial and temporal patterns of daily and nightly the presence and flight activity of bird targets (Cooper and
dispersal of birds and bats (Russell and Gauthreaux 1998, Day 2003, Mabee and Cooper 2004, Raphael et al. 2002,
Diehl et al. 2003, Kunz 2004, Horn 2007; Fig. 7). Day et al. 2005), researchers have recently acknowledged
Tracking radar.—Tracking radar systems, originally that images derived from marine radar targets also include
designed to lock onto and follow targets such as aircraft or bats (Gauthreaux and Livingston 2006, Larkin 2006).
missiles, can provide information on flight paths of Numerous preconstruction studies have used marine radar
individual insects, birds, and bats (including altitude, speed, to estimate passage rates and altitudinal distributions of
and direction) including wing-beat signatures to discrim- migrating targets (Mabee and Cooper 2004, Mabee et al.
inate these taxa while in flight (Fig. 8). Several applications 2006b). Typically, a single radar unit is deployed at a central
using tracking radar have been described for birds (Able location on a wind-energy project area to maximize
1977, Kerlinger 1980, Larkin 1991, Bruderer 1994, Liechti observable airspace for 30–45 days during spring (approx.
et al. 1995), bats (Bruderer and Popa-Lisseanu 2005), and 1 Apr through late May) and autumn (approx. early Aug
insects (Drake 1985, Drake and Farrow 1989, Wolf et al. through early Oct) migration periods. Rarely have portable
1995, Chapman et al. 2004, Geerts and Miao 2005). To radar units been deployed for a full annual cycle associated
date, tracking radar has not been commonly used to assess with wind-energy projects, and rarely have radar-sampling
movements of birds and bats at wind-energy facilities protocols been designed to address specific research
because 1) this instrument does not provide a broad view of hypotheses. Most monitoring studies of airborne targets
migration over a given site, 2) it is not widely available, and near proposed or operational wind-energy facilities have
3) it is difficult and expensive to maintain and repair. deployed marine radar between civil sunset and 0230 hours,
Marine radar.—Marine (X-band) radar systems were assuming this to be the peak period of nocturnal migration
originally designed for use on moving boats, but they also for birds on a given night (Gauthreaux 1972, Kerlinger
have been used as mobile units on land for research and 1995, Mabee et al. 2006b).
monitoring of airborne targets, including passage rates, Objectivity and accuracy in identifying flying animals at
flight paths, flight directions, and flight altitudes of night is a major challenge when using radar (Larkin 1991).
nocturnal migrating targets. Mobile marine radar laborato- Differentiating among various targets (e.g., birds, bats, and
ries often consist of units that are mounted on top of a insects) is central to any biological radar study. However,
vehicle, trailer, or on a ground-based platform (Fig. 9). because flight speeds of bats overlap with flight speeds of
When the antenna is in the horizontal position (i.e., in passerines (i.e., .6 m/sec; Larkin 1991; Bruderer and Boldt
Kunz et al. ! Wind-Energy Development on Birds and Bats 2455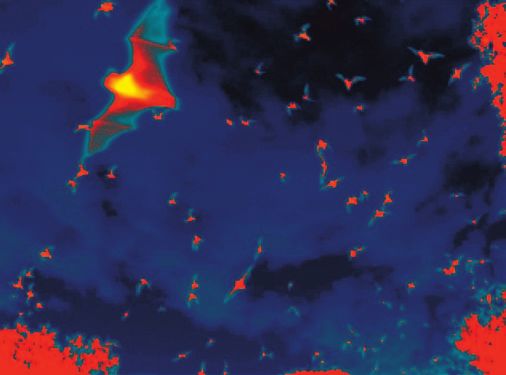
Figure 7. Next Generation Radar (Weather Surveillance Radar-1988
                                                                                Doppler) images of Brazilian free-tailed bats (Tadarida brasiliensis)
                                                                                dispersing nightly from selected cave and bridge roosts in south-central
                                                                                Texas, USA, 18 July 1997. Similar images can be observed when colonial
                                                                                birds disperse from roosting sites early in the morning. Such images make it
                                                                                possible to identify major roosts but also show directions and relative
                                                                                densities of dispersing bats or birds. Data were recorded at an elevation
                                                                                angle of 0.58 (from Kunz 2004).

                                                                                radar coverage can be related to the radar targets
                                                                                (Gauthreaux 1996; Gauthreaux and Livingston 2006; B.
                                                                                A. Cooper and T. Mabee, ABR, Inc., unpublished data).
                                                                                Use of double-sampling or other quantitative methods for
                                                                                estimating detection probabilities (e.g., Program DIS-
                                                                                TANCE [Anderson et al. 1999]) should be used in such
                                                                                studies to characterize detection biases.
                                                                                  Because insects also are detected with marine radar, it may
                                                                                be necessary to reduce or eliminate the radar signals from
                                                                                insects if both birds and bats are the targets of interest.
Figure 6. Composite of 8 Next Generation Radar (Weather Surveillance            Reflectivity from insects in radar surveillance can be reduced
Radar-1988 Doppler) images taken at the lowest elevation angle (0.58) on a      by filtering out all small targets (grain size) that only appear
typical night of widespread migratory activity in the mid-western USA, 1        within approximately 500 m of the radar and targets with
October 1998. All pixels that are not background color (gray) are radar         poor reflectivity (i.e., targets that move erratically or
echoes from a mixture of flying birds, bats, and insects. Because of Earth’s
curvature, the radar beam is so high at a certain distance (range) that it no   inconsistently at locations with good radar coverage) and
longer detects flying animals, thus producing a roughly circular echo around    by editing data prior to analysis by omitting flying animals
each radar installation. Green circles show the approximate maximum radar       with corrected airspeeds ,6 m per second (Diehl et al.
range at which flying animals can be detected at or below the height of the
                                                                                2003). Application of a 6-m/second–airspeed threshold is
top of the rotor sweep of a modern wind turbine. Radar echoes outside
those circles are higher than a wind turbine. Typical of such images from       based on radar studies that have determined most insects
large radars, no flyways or migratory corridors are visible (R. H. Diehl,       have airspeeds of ,6 m per second, whereas flight speeds of
University of Southern Mississippi, unpublished data).                          birds and bats usually are !6 m per second (Larkin 1991;
                                                                                Bruderer and Boldt 2001; B. A. Cooper and R. H. Day,
2001; B. A. Cooper and R. H. Day, Alaska Biological                             unpublished data).
Research [ABR, Inc.]), unpublished data), generally it is not                     Energy reflected from the ground, surrounding vegetation,
possible to separate bird targets from bat targets based solely                 and other solid objects that surround the radar unit typically
on flight speeds. Foraging bats sometimes can be separated                      creates ground-clutter echoes that appear on display screens.
based on their erratic flight patterns. However, migratory                      Ground clutter can obscure targets, although it can be
bat species and those that do not engage in erratic flight                      minimized by elevating the forward edge of the antenna and
behavior while foraging may be indistinguishable from                           by siting the radar unit in locations that are surrounded
migratory songbirds on radar. Visual verification of a sample                   closely by low vegetation, hills, and anthropogenic struc-
of radar targets can be accomplished using night-vision                         tures. These objects act as radar barriers by shielding the
devices or thermal imaging cameras and information on the                       radar from low-lying objects further away from the radar,
proportion of birds versus bats from a site within the zone of                  while producing only a small amount of ground clutter in

2456                                                                                                         The Journal of Wildlife Management     "   71(8)
Figure 9. Mobile marine (X-band) laboratory equipped with capacity for
vertical and horizontal antenna positions (B. A. Cooper, Alaska Biological
Research, Inc., unpublished data). Depending upon specific applications,
the antenna can be aligned in a horizontal (for assessing direction and
passage rate) and vertical mode (for assessing altitude).
Figure 8. A composite of 10 paths of flocks of waterfowl in late autumn
improve our ability to distinguish birds from bats during
recorded with an instrumentation tracking radar (WF-100) at the Illinois
Natural History Survey, USA, recorded 6 December 2006. North is at the monitoring efforts. Species composition and size of bio-
top and tic marks are at 1-km intervals. The start of each path is marked logical targets observed with marine radar is usually
with a square. The average error (SE of a linear fit) is ,0.4 m for the unknown. Thus, the term target, rather than flock or
straight paths; irregularities are largely due to flocks that were partly
obstructed by intervening buildings. The northwestern-most track, which is
individual, is currently used to describe animals detected
nonlinear, is a flock descending through a dry, micro-weather front. Echo with marine radar. Occasionally, there are situations where a
size and modulations (not shown), verification from Doppler radar KILX particular species has unique flight patterns that make it
(Lincoln, Illinois), and time of day and year helped establish the identity of possible to identify species-specific targets. For example,
these targets (R. P. Larkin, Illinois Natural History Survey, unpublished
data). marbled murrelets (Brachyramphus marmoratus) can be
identified on radar with a high degree of accuracy at inland
nesting locations (Hamer et al. 1995; Burger 1997, 2001;
the center of the display screen (Eastwood 1967, Williams et Cooper et al. 2001, 2006), and Hawaiian petrels (Pterodroma
al. 1972, Skolnik 1990, Cooper et al. 1991, Larkin 2005). sandwichensis) and Newell’s shearwaters (Puffinus auricularis
Simultaneous deployment of marine radar with other newelli) were identified as they dispersed to and from
methods (e.g., night-vision devices, thermal infrared imag- colonies in Hawaii (Day and Cooper 1995, Cooper and Day
ing, and acoustic detectors) should improve our knowledge 2003, Day et al. 2003). However, such results should be
of nocturnal species activity and our ability to estimate verified with simultaneous acoustic and visual observations.
exposure (i.e., use and risk) at proposed sites, and is likely to For studies using marine radar, independent confirmation of
Table 1. Comparison of flight directions, overall passage rates, and flight altitudes of radar targets at central and other sites near Mt. Storm, West Virginia,
USA, during autumn 2003 (n ¼ no. of nights surveyed).
Comparison site Central site Test statisticsb
Variable Site n x̄ Dispersiona x̄ Dispersiona Z W P
Flight direction Northern 18 1978 0.58 1778 0.56 1.40 0.496
(degrees) Southern 22 1918 0.53 2078 0.42 1.06 0.588
Eastern 19 1938 0.91 1788 0.31 19.25 ,"0.001
Western 17 2198 0.70 1918 0.36 3.23 0.199
Passage rate Northern 17 225 57 292 66 "1.49 0.136
(targets/km/hr) Southern 21 168 31 239 37 "1.96 0.050
Eastern 21 54 10 220 52 "3.77 ,"0.001
Western 20 127 22 230 47 "2.70 0.007
Flight altitude Northern 16 448 29 439 37 "0.52 0.605
(m above ground level) Southern 21 447 31 467 33 "0.57 0.566
Eastern 16 509 23 427 41 "2.02 0.044
Western 17 436 20 472 30 "0.97 0.332
a
x̄ vector length (r) for directional data; SE of the x̄ for passage rates and flight altitudes.
b
Test statistics are for Wilcoxon paired-sample test (Z) and Mardia–Watson–Wheeler (Uniform Scores) test (W).
Kunz et al. # Wind-Energy Development on Birds and Bats 2457sampled approximately 2.5–3 hours per site per night. All
paired comparisons were made with concurrent data from
the central site. Observer assignments and starting locations
of the second mobile radar laboratory were varied system-
atically to minimize bias among sites and observers. Flight
directions and altitudes at sites along or near the ridgeline
were not different from each other, but significant differ-
ences in passage rates were observed among some of these
sampling sites (Table 1). These data demonstrated that
nocturnal migrants crossed rather than followed the
Allegheny Front ridgeline (Mabee et al. 2006b).
Case study II: nocturnal bird migration at the Stateline
wind project.—Situated on privately owned dryland agricul-
Figure 10. Vertical distribution of airborne fauna, recorded using vertically
pointing profiler radar on 15 April 1994. Note that targets identified as tural and grazing land, the Stateline wind-energy facility
insects drop markedly in altitude in the period before sunset until 2400 consisted of 454 Vestas V-47 wind turbine (Danish Wind
hours. Most of the larger targets (assumed to be migrating birds and bats) Technology, Ringkøbing, Denmark) rated at 660 kW each,
are active at a wide range of altitudes (McGill University, Montreal, Canada
2000).
with 273 turbines located in Walla Walla County,
Washington, USA, and 181 turbines located in Umatilla
County, Oregon, USA. Several studies were conducted by
species identity is needed if species-specific information is Mabee and Cooper (2004) to meet the permit requirements
being reported. in Oregon (state permitting process) and in Washington
A concern common to all marine radar studies is that there (county permitting process). After the original permits were
are locations where even a skilled and experienced radar granted, the developer (Florida Power and Light Energy
operator cannot find a suitable sampling site because the [FPLE]) sought an amendment of its county permit in
zone of primary interest (i.e., at or below turbine ht) is Washington to build strings farther to the north and closer
obscured by shadow zones of radar or areas of ground to the Columbia River. Based on negotiations with the Blue
clutter. One of the most important and difficult-to-learn Mountain Audubon Society, a condition of permit approval
aspects of using marine radar is the selection of sampling was granted that required FPLE to support these nocturnal
locations. The site chosen has important implications for studies. The results of this research were evaluated by a
data quality and comparability among sites. Sites must be technical advisory committee to determine whether the risk
chosen where ground clutter and shadow zones do not associated with siting turbines in this area was tolerable.
obscure or omit important portions of the study area. One The specific hypotheses tested were that the mean flight
additional technique that allows greater flexibility in siting is altitudes and mean target rates were the same near the area
to mount the radar on a lift that can be elevated to a desired where the new turbines were proposed compared to the
height above surrounding vegetation (Cooper and Blaha altitudes and passage rates observed at a control area to the
2002). This technique is particularly useful in relatively flat, south, away from the Columbia River. To test this
heavily wooded areas. To ensure reliable data acquisition, all hypothesis, 2 marine radar units were used concurrently
radar devices must be calibrated before being deployed in the during 2 autumn and one spring period for 6 hours per night
field and users must be fully trained in field-sampling per radar (Mabee and Cooper 2004). Mean passage rates
techniques to ensure reliable data collection. and flight altitudes were compared between the 2 locations
Case study I: nocturnal migration at the Mount Storm using the nonparametric Wilcoxon signed-rank test (Tables
wind project.—Mabee et al. (2006b) used a portable marine 2, 3). No significant differences between mean passage rates
radar system in 2003 to collect information on the migration and flight altitudes were determined between the 2 locations
characteristics of nocturnal birds (particularly passerines) (Tables 2, 3).
during the autumn migration period in the vicinity of the Emerging radar technologies and applications.—The
Mt. Storm Wind Power Project in West Virginia. The National Aeronautics and Space Administration recently
objectives were to 1) collect and compare information on developed high-resolution polarimetric weather radar
flight directions, migration passage rates, and flight altitudes (NPOL) that promises to be more useful for studying
of nocturnal migrants at multiple sites near or within this movements of birds and bats than NEXRAD. Because of its
proposed development; 2) determine if nocturnal bird high resolution, NPOL can be used to collect data on
migration occurred in a broad front; and 3) determine if individual targets and potentially discriminate between
nocturnal migrants follow the Allegheny Front ridgeline insects, birds, and bats. More recent developments of
within the proposed project area. Collaborative Adaptive Sensing of the Atmosphere (Uni-
The study design involved using one marine radar at a versity of Massachusetts, Amherst, MA) have designed a
central site (sampling approx. 6 hr/night) and a second radar series of Distributed Collaborative Adaptive Sensing net-
unit that could be moved between 4 secondary sites (i.e., works that will sample the atmosphere at altitudes below
northern, southern, eastern, or western locations) and those typically detected with NEXRAD. Use of data
2458 The Journal of Wildlife Management ! 71(8)Table 2. Mean nocturnal rates of movement (targets/hr 6 1 SE) of all targets observed during short-range radar sampling (1.5 km) at Hatch Grade,
Washington, USA, and Vansycle Ridge sites, Oregon, USA, during autumn 2000, spring 2001, and autumn 2001. (n ¼ no. of concurrent sampling nights).
Movement rate Wilcoxon signed-ranks test
Season Location x̄ SE N Z N P
Autumn 2000 Hatch Grade 58.1 6.3 23
Vansycle Ridge 53.1 5.7 23 "0.08 23 0.94
Spring 2001 Hatch Grade 135.3 19.9 43
Vansycle Ridge 144.8 18.6 43 "1.2 43 0.23
Autumn 2001 Hatch Grade 64.8 7.6 23
Vansycle Ridge 78.8 7.5 23 "2.18 23 0.03
generated using Multiple Antenna Profiler Radar (MAPR) Equipment requirements.—Any outdoor acoustic study
also holds considerable promise for characterizing temporal poses challenges for sensors and cables, including moisture,
and elevational profiles of insects, birds, and bats during vandalism, lightning, and physical abuse. Exclusive of
clear air periods. A MAPR is an advanced radar system supports such as masts, towers, and kites required to elevate,
being developed at the National Center for Atmospheric stabilize, and shelter a multi-microphone array, equipment
Research and Earth Observing Laboratory to make rapid for an acoustic study of birds involves the following:
wind measurements of targets within the Earth’s boundary More than one microphone is necessary to obtain
layer (Fig. 10). These and other recent radar developments information on location and flight altitude. An ideal
(NRC 2002, Larkin 2005) promise to advance future microphone offers good sensitivity (current generated by
research on the behavior and activity of airborne organisms, slight changes in pressure), low internal noise level (e.g., low
including those in the vicinity of wind-energy facilities (A. hum, shot noise, and crackle inside the electronic equip-
Kelly, DeTect, Inc., personal communication). ment), resistance to extremes of moisture and temperature,
and affordable cost. Sensitivity usually is desired more in one
Acoustic Monitoring of Birds direction than others. A good directional microphone
Ornithologists have long used acoustic monitoring of (which varies by cost and portability) will greatly amplify
nocturnal migrants to better understand bird migration sounds arriving on its axis and be less sensitive to sounds
(Libby 1899, Ball 1952, Graber and Cochran 1959, from other directions. Any microphone used for bird flight
Balcomb 1977, Thake 1981). With the publication of calls should be sensitive to sounds ranging from about 10
type-specimen (archived) flight calls annotated by experts kilohertz (kHz) to 1.5 kHz, preferably lower. Preamplifiers
(Evans and O’Brien 2002), the practice of listening to flight are placed close to microphones to amplify weak electrical
calls of birds at night has broadened from being an academic signals from the microphone to a level that can be
to a practical method of monitoring bird migration transmitted to a recording device without distortion.
(reviewed in Farnsworth 2005). Preamplifiers require power to operate, and most will
Because nocturnal calls of passerines (songbirds) are heard function for an entire night or longer on a set of small
most frequently, research has centered on this group batteries.
(Palmgren 1949, Svazas 1990, Farnsworth 2005). However, Unless all equipment is bundled, good weatherproof cables
birds such as upland sandpiper (Bartramia longicauda) and are necessary, not optional, for outdoor work. A complete
woodcock (Scolopax minor) also produce calls at night. set of replacement cables will eventually save a night’s worth
Table 3. A comparison of mean nocturnal flight altitudes (m above ground level 6 1 SE) of targets observed during vertical radar sampling (1.5-km range) at
Hatch Grade, Washington, USA, and Vansycle Ridge, Oregon, USA, during spring and autumn, 2001. Mean altitudes are calculated from total number of
targets (ntotal), whereas tests are based on the number of sampling nights (nnights). Test statistics are Mann–Whitney (U) and Wilcoxon signed-rank (Z)
values.
Flight altitudes Test results
Season Location x̄ SE ntotal U Z nnights P
a
Intraseasonal
Spring 2001 Hatch Grade 505.6 4.7 6,296
Vansycle Ridge 578.5 4.8 6,521 181.0 40 0.64
Autumn 2001 Hatch Grade 647.4 7.0 2,172
Vansycle Ridge 605.6 7.5 2,553 "1.60 14 0.11
Interseasonal
Spring 2001 Hatch Grade 454.8 33.9
Autumn 2001 Hatch Grade 649.4 21.9 45.0 36 ,0.01
Spring 2001 Vansycle Ridge 481.1 36.3
Autumn 2001 Vansycle Ridge 610.8 27.9 69.0 32 0.03
a
One FR-1510 vertical radar alternated between sites (spring 2001), whereas 2 radars sampled concurrently during autumn 2001.
Kunz et al. # Wind-Energy Development on Birds and Bats 2459You can also read