GLOBAL GOALS, LOCAL ACTION: Kelowna's Voluntary Local Review
←
→
Page content transcription
If your browser does not render page correctly, please read the page content below

GLOBAL GOALS, LOCAL ACTION:
   Kelowna’s Voluntary Local Review

GLOBAL GOALS, LOCAL ACTION: KELOWNA’S VOLUNTARY LOCAL REVIEW   1
GLOBAL GOALS, LOCAL ACTION:
                                                    KELOWNA’S VOLUNTARY LOCAL REVIEW
                                                                                                            MARCH 2021

The British Columbia Council for International Cooperation (BCCIC) is a network of civil society organizations and individuals
moving toward a better world based in British Columbia, Canada. By compiling this report, BCCIC hopes to contribute to the
critical debate on Canada’s role in developing and achieving the Sustainable Development Goals (SDGs).

The Global Empowerment Coalition of the Central Okanagan (GECCO) is a Chapter of the BCCIC, working in partnership and
participating in initiatives, programming and services.

For more information on BCCIC or this publication, go to: bccic.ca or contact us:
322-268 Keefer St., Vancouver, BC, V6A 1X5
Phone: 604.899.4475

The vast majority of this project was conducted through the dedication of passionate volunteers. Some of the research was
funded through a few programs. BCCIC receives support from the Government of Canada, provided through Global Affairs. This
project also received support from Economic and Social Development Canada’s Career Launch SDG Impact Funding, and the
Sustainability Scholars Program at the University of British Columbia.

All intellectual content including omissions and errors remains the responsibility and property of the BC Council for Internation-
al Cooperation and Global Empowerment Coalition of the Central Okanagan.

Cover page Photo Credits: Kolby Milton (Unsplash)

GLOBAL GOALS, LOCAL ACTION: KELOWNA’S VOLUNTARY LOCAL REVIEW                                                                     2
ACKNOWLEDGMENTS

This report was prepared in partnership with the British Columbia Council for International Cooperation (BCCIC) and Global
Empowerment Coalition of the Central Okanagan (GECCO). We would like to extend a personal thanks to all the contributors
who spent countless hours researching, writing, and editing various parts of this report and without whom this report would
not have been made possible.

PROJECT MANAGEMENT TEAM                                          CORE PROJECT TEAM

•   Wijesekera, Kusum - Author and Project Manager, GECCO        •   Anwar, Nimrah - Lead Technical Researcher, BCCIC
•   Muir-Owen, Sara - Coauthor, PICS at UBC                      •   Collis, Amy - Lead Policy Researcher, BCCIC
•   Wayne-Nixon, Laurel - Project Coordinator, BCCIC             •   Erickson, Jonah - Researcher, BCCIC
•   Harris, Dan - Project Coordinator, BCCIC                     •   Hillis, Laura - Researcher, BCCIC
                                                                 •   James, Emma - Writer, BCCIC
                                                                 •   Kwok, Alex - Researcher, BCCIC
                                                                 •   McLean, Simmone - Researcher, BCCIC
                                                                 •   Neubauer, Sarah - Lead Economics Researcher, BCCIC
                                                                 •   Schiller, Antonia - Researcher, BCCIC
                                                                 •   Tang, Ann - Researcher, BCCIC

The Global Goals cover a broad range of topics and issues, and experts in different fields were relied upon to share their
insights into the work being done throughout the province and locally in the Kelowna region, to review content, make goal
linkages, and provide constructive feedback. We are grateful for their input and wish to thank and acknowledge the following
organizations:

•   BCIT
•   BC Centre for Disease Control, Provincial Health Services Authority
•   City of Kelowna
•   Community Energy Association
•   Elizabeth Fry Society
•   First Nations Health Authority
•   Interior Health
•   International Institute for Sustainable Development
•   Kelowna CAT
•   Ki-Low-Na Friendship Society
•   Ministry of Environment and Climate Change Strategy
•   Pacific Institute for Climate Solutions
•   PROOF Food Insecurity Policy Research
•   Regional District of the Central Okanagan
•   UBC Sustainability Initiative
•   Vancouver School of Economics at UBC
•   John Ecker, Director of Research & Evaluation - Canadian Observatory on Homelessness
•   Marika Albert, Policy Director - BC Non-Profit Housing Association

These, among numerous other organizations, have been instrumental in the formation of this report.

GLOBAL GOALS, LOCAL ACTION: KELOWNA’S VOLUNTARY LOCAL REVIEW                                                                   3
NOMENCLATURE

BCCIC		       British Columbia Council for International Cooperation
BCIT		        British Columbia Institute for Technology
BI		          Basic Income
BIPOC		       Black, Indigenous, Person of Colour
BOMA		        Building Owners and Managers Association
CAAQS		       Canadian Ambient Air Quality Standards
CAD		         Canadian Dollar
CAT		         Kelowna Community Action Team
CERB		        Canadian Emergency Response Benefit
CFIB		        Canadian Federation of Independent Business
CMA		         Census Metropolitan Area
CO		          Carbon Monoxide
CO2		         Carbon Dioxide
CSD		         Census Subdivisions
CSO		         Civil Society Organization
C&D		         Construction and Demolition
DES		         District Energy System
DNU		         Do Not Use
EC3		         Embodied Carbon Construction Calculator
EPD		         Environmental Product Declaration
EV		          Electric Vehicle
FLIR		        Forward Looking Infrared
FNESC		       First Nations Education Steering Committee
FNHA		        First Nations Health Authority
GECCO		       Global Empowerment Coalition of the Central Okanagan
GHG		         Greenhouse Gas
HFI		         Household Food Insecurity
ICBC		        Insurance Corporation of British Columbia
IH		          Interior Health
iOAT		        Injectable Opioid Agonist Treatment
IPCC 		       Intergovernmental Panel on Climate Change
JHS		         Journey Home Society
kWh		         Kilowatt-hour
LCA		         Life Cycle Assessment
LEED		        Leadership in Energy and Environmental Design
LICO		        Low Income Cut Off
LIM		         Low Income Measure

GLOBAL GOALS, LOCAL ACTION: KELOWNA’S VOLUNTARY LOCAL REVIEW                 4

MBM Market Based Measure MDMA Methylenedioxymethamphetamine MMIWG Missing and Murdered Indigenous Women and Girls MOU Memorandum of Understand MURB Multi-Unit Residential Building NEET Not in Education, Employment or Training NOx Nitrogen Oxides OAT Opioid Agonist Treatment OWMO Organic Waste Management Options PACT Police and Crisis Team PICS Pacific Institute for Climate Solutions PM 2.5 Particulate Matter 2.5 RCMP Royal Canadian Mounted Police RDCO Regional District of Central Okanagan RNG Renewable Natural Gas SDG Sustainable Development Goals SHARP Synchronized Hybrid Ambient Real-time Particulate SOV Single Occupant Vehicle TEOM Tapered Element Oscillating Microbalance TRC Truth and Reconciliation Commission UN United Nations VLR Voluntary Local Review VOC Volatile Organic Compound 2SLGBTQQIA Two-Spirit, lesbian, gay, bisexual, transgender, queer, questioning, intersex and asexual GLOBAL GOALS, LOCAL ACTION: KELOWNA’S VOLUNTARY LOCAL REVIEW 5
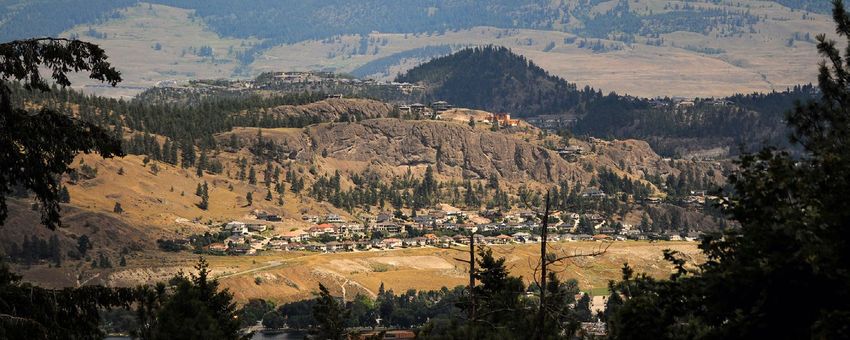
TABLE OF CONTENTS

        Executive Summary ������������������������������������������������������������������������������������������������������������������������������7
        Analysis Of The Goals ��������������������������������������������������������������������������������������������������������������������������8

        Introduction .........................................................................................................................................10
           Population & Demographics������������������������������������������������������������������������������������������������������������11
           Geography........................................................................................................................................12
           Leave No One Behind - Indigenous Approach ���������������������������������������������������������������������������������13

        Goal 1: No Poverty ������������������������������������������������������������������������������������������������������������������������������15
        Goal 2: Zero Hunger ����������������������������������������������������������������������������������������������������������������������������17
        Goal 3: Good Health And Well-Being ������������������������������������������������������������������������������������������������19
        Goal 4: Quality Education �������������������������������������������������������������������������������������������������������������������22
        Goal 5: Gender Equality ����������������������������������������������������������������������������������������������������������������������24
        Goal 6: Clean Water And Sanitation ��������������������������������������������������������������������������������������������������26
        Goal 7: Affordable And Clean Energy �������������������������������������������������������������������������������������������������28
        Goal 8: Decent Work And Economic Growth ������������������������������������������������������������������������������������30
        Goal 9: Industry, Innovation And Infrastructure �������������������������������������������������������������������������������32
        Goal 10: Reduced Inequalities������������������������������������������������������������������������������������������������������������34
        Goal 11: Sustainable Cities And Communities ���������������������������������������������������������������������������������36
        Goal 12: Responsible Consumption And Production ������������������������������������������������������������������������40
        Goal 13: Climate Action ����������������������������������������������������������������������������������������������������������������������42
        Goal 14: Life Below Water ������������������������������������������������������������������������������������������������������������������44
        Goal 15: Life On Land �������������������������������������������������������������������������������������������������������������������������45
        Goal 16: Peace, Justice And Strong Institutions ��������������������������������������������������������������������������������46
        Goal 17: Partnership For The Goals ���������������������������������������������������������������������������������������������������48

        Conclusion............................................................................................................................................50

        Appendix A - Low-Income Measure Overview (Goal 1) ��������������������������������������������������������������������52
        Appendix B - Homelessness Overview (Goal 1) ��������������������������������������������������������������������������������54
        Appendix C - Household Food Insecurity Overview (Goal 2) ���������������������������������������������������������������57
        Appendix D - Household Energy Use Overview (Goal 7) ������������������������������������������������������������������60
        Appendix E - Waste Per Capita Overview (Goal 12) ��������������������������������������������������������������������������62
        Appendix F - Climate Action Overview (Goal 13) ������������������������������������������������������������������������������64
        Appendix G - Kelowna VLR Methodology �����������������������������������������������������������������������������������������68

        Endnotes ..............................................................................................................................................69

GLOBAL GOALS, LOCAL ACTION: KELOWNA’S VOLUNTARY LOCAL REVIEW                                                                                                        6
EXECUTIVE SUMMARY

In 2015, the international communi-        strates the intersectionality of the goals
ty adopted the United Nations 2030         and indicators, while also attempting        Change takes time. Progress requires
Agenda for Sustainable Development,        to account for the multijurisdictional       understanding the problem, and then
a global strategy that outlines 17 am-     nature and complexities amongst the          measuring the solutions accordingly:
bitious, interconnected and universal      goals, and the collaborations and part-      what’s measured, matters. Quantifiable
Global Goals that, implemented togeth-     nerships necessary to achieve them.          progress is not always easy to achieve
er, can create a more liveable, equita-                                                 or even adequate in providing a true
ble world by 2030. These Sustainable       The year 2020 was marked by two key          analysis; qualitative results are also
Development Goals (SDGs) provide a         events, COVID-19 and the Black Lives         required to share insight, gain under-
framework to address environmental,        Matter movement, forcing the world to        standing and brainstorm solutions. This
social, economic and security challeng-    face the extent of inequalities experi-      report was created with shared knowl-
es faced by nations and communities        enced by marginalized groups. Canada         edge from numerous organizations
worldwide. While originally conceived      is not immune to these inequalities          throughout and beyond the community
as country-level goals, and Canada         that have been harboured in a history        of Kelowna, in an attempt to capture
pledging commitment to implemen-           of colonization, systemic racism, and        the voices of different groups that are
tation, success will largely depend on     discrimination. Many Indigenous Peo-         often left behind, and to also challenge
provinces and municipalities also work-    ples continue to live with trauma due        our preconceived ideas around viable
ing together on the ground, so to say,     to the legacies of forced displacement       solutions. However, there is still much
to implement and measure progress          from traditional territories, residential    work to be done; more quantifiable and
towards achieving the SDGs.                school experiences of abuse and ne-          qualitative measurements to be made.
                                           glect, and the disruption of traditional     We can do better. We must do better!
Voluntary Local Reviews (VLRs), are        culture and practices. Furthermore,
sub-national reviews of SDG implemen-      African, Caribbean and Black Canadians
tation and are increasingly being adopt-   live with the history of slavery, racism
ed by municipalities. This Kelowna VLR     and discrimination that still persists
has been greatly shaped through close      today. Many of the rules that govern
consultation with municipal, regional,     society and too many of our social and
provincial and federal government          economic policies reflect bias and dis-
agencies, civil society organizations      crimination (both conscious and uncon-
(CSO), academics, and Indigenous           scious), reinforcing the false premise
organizations. With 169 targets and        that some people are better or more
232 indicators, it is overwhelming and     deserving than others. Such policies
virtually impossible for municipalities    and governance structures are failing
— alone — to comprehensively imple-        marginalized people and impacting
ment the SDGs. As such, this VLR fo-       access and availability of the resources
cuses on 28 community-level indicators     and opportunities necessary to support
that are outcome based, quantifiable       well-being.1 This stark reality has
and measurable, and localized to the       been made evermore apparent during
geographical and cultural context. For     the COVID-19 pandemic. Inclusive
the selected 28 indicators, trends are     solutions require us to reflect on our
shown, and challenges and progress are     personal biases, our lack of knowledge
highlighted through examples from the      and understanding about inequality,
City of Kelowna, the Regional District     and to commit to creating an equitable
of Central Okanagan (RDCO), Province       platform where people, regardless of
of B.C., Indigenous organizations, and     their background, can share their voice
CSOs working throughout the commu-         on the issues and solutions, and be          Kelowna Waterfront
nity. The review of progress demon-        listened to.                                 Photo Credits: Adam Ruby Photography

GLOBAL GOALS, LOCAL ACTION: KELOWNA’S VOLUNTARY LOCAL REVIEW                                                                   7
ANALYSIS OF THE GOALS

This report analyzed and narrowed the      province. Included at the end of each         and complexities amongst the goals,
UN’s 169 targets and 232 indicators        subsection is an illustration on the inter-   and the intergovernmental and civil
down to 28 community-level indicators      connectedness and interdependency of          society organizations collaborations
relevant to Kelowna. The indicators as     the goals and their indicators. The goal      and partnerships necessary to achieve
related to each goal are summarized in     summaries can stand alone, each can           them.
Table 3.                                   be read and referred to independently,
                                           while taken together they form a more         Although there is much more to discuss,
Each section of the report covers one of   complete, integrated report on the            this report only touches the surface on
the 17 goals; with each section describ-   SDGs for the community of Kelowna. In         the issues and potential solutions. A se-
ing trends of selected indicators for      many cases, the SDG indicators chosen         lect few indicators have been discussed
each goal in context of the community      for this VLR are multijurisdictional,         further in Appendices A through F to
of Kelowna. Also highlighted are the       spanning municipal, regional, provincial      elaborate on programs already under-
challenges and progress currently being    and First Nations’ government bound-          way, as well as recommendations at the
made towards achieving each goal,          aries. This VLR attempts to account for       municipal, provincial and federal levels.
through work by various organizations      the multijurisdictional nature of these
throughout the community and the           indicators, as well as the interrelations

Table 3: Summary of Kelowna’s Indicators

   GOALS           LOCAL COMMUNITY INDICATORS
                   •   Low Income. Number of persons in low income measure (LIM)
                   •   Chronic Homelessness. Number of persons living in chronic homelessness conditions

                   •   Active Farmland. Percent land base actively farmed
                   •   Food Insecurity. Percent of persons in households who are food insecure (marginal, moderate and
                       severe)

                   •   Chronic Diseases. Mortality rate attributed to cardiovascular disease, diabetes, and chronic lower
                       respiratory diseases
                   •   Illicit Drugs. Illicit drug mortality rate per 100,000 population
                   •   Suicide Rates. Illicit suicide mortality rate per 100,000 population

                   •   Post Secondary Education. Highest certificate, diploma or degree obtained

                   •   Gender-based Violence. Rate of sexual assaults per 100,000 by sex of victim

GLOBAL GOALS, LOCAL ACTION: KELOWNA’S VOLUNTARY LOCAL REVIEW                                                                     8
GOALS       LOCAL COMMUNITY INDICATORS
               •   Water Advisories. Person-days on advisory

               •   Electricity Usage. Average household electricity and use
               •   Gas Consumption. Average household gas consumption

               •   Unemployment Rates. Unemployment rates
               •   Youth NEET. Population aged 15 to 29 Not in Education, Employment or Training (NEET)

               •   Sustainable Transportation. Main mode of commuting to work
               •   EV Stations. Number of electric vehicle charging (EV) stations around community locations, residential
                   areas and commercial areas

               •   Household Income. Median household income relative to average household income

               •   Vacancy Rates. Rental vacancy rate
               •   Housing Affordabiity. Percent of renters spending over 30% and 50% of income on shelter
               •   Air Quality (PM 2.5). Fine particulate matter (PM 2.5) annual, 3-year average
               •   Air Quality (O₃). Ozone levels annual 4th highest daily 8-hour maximum, 3-year average
               •   Green Space. Percent of residents that live within 400m of a park

               •   Waste Generation. Per capita waste disposal rate
               •   Burn Permits. Number of burning permits issued

               •   Community Emissions. Total annual GHG emissions from community activities

               •   Riparian Area. Total riparian area permanently protected

               •   Green Space. Percentage of green space protected from development

               •   Crime Rate. Crime rate per 100,000 population

               •   SDG-related Work. Number of non-profit organizations working on the SDGs in domestic and interna-
                   tional frameworks

GLOBAL GOALS, LOCAL ACTION: KELOWNA’S VOLUNTARY LOCAL REVIEW                                                                9
INTRODUCTION

In 2015, the international communi-           and stimulating economic growth, all         corporations should they engage in do-
ty adopted the United Nations 2030            while developing local level goals, tar-     ing so, can support the achievement of
Agenda for Sustainable Development, a         gets and policies for climate action and     the SDGs through “bottom up” action.
global strategy that outlines 17 am-          sustainable development.
bitious, interconnected and universal                                                      A Voluntary Local Review (VLR) is an
Global Goals that together can develop        The Province of British Columbia (B.C.)      emerging process by which subnational
a more liveable, equitable world by           has a long history of setting progres-       governments can evaluate and report
2030. They address five key themes re-        sive social and environmental policy         on local level progress towards achiev-
lated to people, the planet, prosperity,      including the adoption of many sustain-      ing the SDGs, enabling a community’s
peace and partnerships, adhere to five        ability and climate related action plans     accountability and transparency. A com-
key principles: inclusivity, universality,    at the local government level. When          mon framework enables cities to com-
integration, technology driven, and are       aligned with existing planning and policy    pare progress in achieving the SDGs,
locally focused.                              frameworks, the interrelatedness of the      identify areas where priorities may need
                                              goals can improve planning and help          to be realigned and/or strengthened,
Today’s world has the highest level of        align outcomes at the local, provincial,     and provide evidence to support com-
urban growth and urban migration than         national and global scale. For mayors,       munities’ partnerships and advocacies
ever before, with more than half of the       policy-makers, and planners working to       with other agencies and organizations
world’s current population living in cities   improve quality of life in local communi-    for necessary funds and resources to
and 86% of British Columbians living in       ties, this set of integrated targets, when   address gaps in achieving a common
urban and suburban areas. Urbanization        localized, can help achieve a commu-         sustainability agenda. In the process of
brings with it the risk of increased con-     nity-wide vision that can be pursued         developing this VLR for the community
centration and severity of many social,       irrespective of policy cycles. Localizing    of Kelowna, close consultation with the
economic and environmental issues. Yet        the SDGs refers to the manner in which       City of Kelowna, as well as regional, pro-
it also offers an enormous potential to       local governments and policy-makers          vincial and federal government agen-
advance sustainable development ob-           adapt, implement, and monitor the            cies, CSOs, academics, and Indigenous
jectives, with international governance       Global Goals at the local level.2 It takes   organizations was required. For details
continuing to recognize cities as central     into account local settings to develop       on the Kelowna VLR methodology, refer
drivers for sustainable development. In       suitable proxy targets, means of imple-      to Appendix G. This project can offer
recent years we have seen local govern-       mentation, and appropriate indicators,       examples to other Canadian cities and
ments and municipalities increasingly         to identify and measure how local and        regions seeking ways to participate in,
focusing on creating healthy commu-           regional governments, universities, civil    and help the world to achieve the global
nities, encouraging resource efficiency,      society organizations (CSO) and private      agenda.

Figure 1: UN Sustainable Development Goals

GLOBAL GOALS, LOCAL ACTION: KELOWNA’S VOLUNTARY LOCAL REVIEW                                                                      10
Kelowna as viewed from Knox Mountain
Photo Credits: Amanda Schauerte
POPULATION & DEMOGRAPHICS Disaggregated demographic informa- income level, and race to support evi-
tion is key to understanding the nature dence-based, equitable policy solutions.
The population and demographic of Kelowna’s population including age
patterns in Kelowna are an important ranges, income levels, and race. Those While Kelowna’s population is projected
factor when localizing and aligning the who are most vulnerable and most to grow 23% by 2030 as compared to
SDGs. Urbanization is a continuously affected by certain policies and pro- 2015 (refer to Table 1), the most sig-
increasing trend across the Province grams are largely driven by systemic nificant growth will be occurring in the
of B.C. and cities including Kelowna differences in how various age groups, 20-39 and 65+ age groups as shown in
are subject to encounter the issues class and races are treated. In order to Table 2. Age demographics are import-
associated with this trend, including effectively meet communities’ needs, ant to identify and project when eval-
restrained economic resources, higher cities must understand the makeup uating progress towards achieving the
cost of living and the varying needs of of the communities they are trying to SDGs. The growth in aging populations
a changing population. It is impera- help and prioritize equity in policy and tied with varying socioeconomic and
tive that demographic patterns of the services that reflect the needs of the racial factors highlight the importance
population are identified to set up the different groups. The Chief Public Health of collecting demographic information
community for success when handling Officer (CPHO) of Canada states “while to understand the varying needs of the
future challenges and to a leader in the COVID-19 pandemic affects us all, population and offer a myriad of solu-
sustainable development. Actual and the health impacts have been worse tions to address these specific needs.
projected population for Kelowna and for seniors, essential workers, racialized There are other marginalized and vul-
Kelowna CMA is outlined in Table 1. populations, people living with disabil- nerable groups (e.g. disabled bodies or
ities and women”.5 Yet there remain members of 2SLGBTQQIA) who may not
Table 1 - Actual and Projected Popula- large gaps in the collection of racial and be explicitly factored into data collec-
tion for Kelowna and Kelowna CMA3 4 ethnic data in Canada.6 It is impossible tion but may still face different experi-
to eliminate systematic economic, social ences from both the issue and solution
and health issues without a full picture standpoint. The data gaps must be
2015 2030 of who is impacted and how. The pan- considered to shed light on the impacts
(actual) (projected)
demic, Black Lives Matter movement, faced by all citizens and to ensure no
Kelowna 128,769 157,468 and climate crisis all point to underlying one is left behind when implementing
Kelowna 197,759 242,259 social inequalities that require, at a the SDGs in Kelowna.
CMA very minimum, the breakdown of data
at the community scale based on age,
GLOBAL GOALS, LOCAL ACTION: KELOWNA’S VOLUNTARY LOCAL REVIEW 11Table 2: Projected age distribution data comprised of nutrient and mineral-rich Country; Indian Reserve communities,
for the City of Kelowna 7 soils; the bedrock of the Okanagan including Duck Lake 7, Tsinstikeptum 10
Valley’s crucial agricultural economy. and Tsinstikeptum 9; and two regional
Age The Okanagan Valley is the second-most electoral districts within the Central
2010 2020 2030 important agricultural region in British Okanagan. Kelowna’s VLR indicators are
Bracket
Columbia, with the majority of BC’s fruit limited to the data available at the city
0-19 20% 18.2% 16.6%
trees being grown in the Valley. The first level (Kelowna, City; CSD) or regionally
20-39 25.1% 25.8% 26.3% apple trees were planted in Kelowna in (Central Okanagan, Region; Kelowna
40-64 33.9% 32.7% 31.5% 1862.8 By the 1930s, irrigation systems CMA) to ensure statistical relevance and
65+ 21% 23.3% 25.6% transformed this semi-desert into a to reflect accurate trends.
premier fruit-growing location. Today,
grapes grown in the valley support both The First Peoples of the Central Okana-
GEOGRAPHY local and coastal wineries, and the re- gan district are the Syilx/Okanagan.
gion’s thriving wine industry has been a BCCIC and GECCO, we would like to
major contributor to the area’s growing acknowledge that this VLR covers the
Kelowna is one of the largest metro- tourism sector.9 traditional, ancestral and unceded ter-
politan areas in the province of British ritories of the Syilx / Okanagan Peoples.
Columbia. The city is located in the The data to support the indicators out- The Syilx People of the Okanagan Nation
Okanagan Valley in British Columbia’s lined in Kelowna’s VLR data is gathered is made up of seven member commu-
Southern Interior. Much of this region from two key geographical data sources, nities North of the Canada/US border:
is forested with dry, open, largely pine Statistics Canada’s census subdivision the Okanagan Indian Band, the Osoyoos
forests. Dry grasslands prevail in the (CSD) and Census Metropolitan Area Indian Band, the Penticton Indian Band,
arid lower altitudes of the basin, while (CMA) data. The CSD matches the city’s the Upper Nicola Band, the Upper and
in the southern Okanagan Valley, the geographical boundaries, while the CMA Lower Similkameen Indian Bands, and
climate is dry enough to be classified as encompasses the surrounding Central the Westbank First Nation.10 Members
a semi- desert. The city itself lies rough- Okanagan region. The CMA is multi- share the same Nsyilxcən language,
ly midway along Okanagan Lake, the jurisdictional, comprised of the cities, culture, and customs, with deep con-
largest lake (roughly 120 km by 3.5km) Kelowna and West Kelowna; the district nections to the unique land, flora, and
in the Okanagan valley. The valley is municipalities of Peachland and Lake fauna of the valley.11
Figure 2: Map of Kelowna and Surrounding Regions in the Province of B.C.
GLOBAL GOALS, LOCAL ACTION: KELOWNA’S VOLUNTARY LOCAL REVIEW 12through aggressive assimilation policies.
Historical and ongoing policies of colo-
nization and assimilation as well as sys-
temic racism are the root causes for the
current situation that Indigenous Peo-
ples in Canada experience today. The
1876 Indian Act, which is still in effect
today, and the residential school sys-
tem, ending only in 1996, are examples
of some of the most damaging elements
of Canada’s colonial history. Designed
to ‘re-educate’ Indigenous children,
Canada forcibly removed children from
their families and forbade them from
acknowledging their heritage, language
and culture. In 2015, The Truth and Rec-
onciliation Commission concluded these
policies amounted to a cultural geno-
cide. The physical and mental trauma
experienced by residential school sur-
vivors continue to reverberate through
The sacred spirit of Lake Okanagan is known as N-ha-ha-itk by the Syilx Peoples Indigenous communities, having been
but was renamed as Ogopogo in the 1920s by folk singers.
Photo Credits: Amanda Schauerte passed down.
While the process of this VLR attempts
LEAVE NO ONE BEHIND - nation that results in unequal outcomes to reflect and act on what reconciliation
INDIGENOUS APPROACH for disadvantaged populations and to can look like, there is still significant
take action to help the furthest behind work to be done. This is not a one-time
This VLR covers the traditional, ances- first”. 12 commitment, but a continuous and and
tral and unceded territories of the Syilx on-going effort to learn about Indige-
/ Okanagan Peoples. We at BCCIC and In Canada, considerable disparities in nous history, challenge stereotypes, and
GECCO, recognize our obligation to social and economic conditions con- consult with Indigenous organizations.
redress the current unequal power dy- tinue to persist between Indigenous Though no formal partnerships with
namics that emanate from the historical groups (First Nations, Metis and Inuit) Indigenous-led organizations were able
and ongoing consequences of colonial- and the general population.13 In par- to be established for this VLR, the team
ism, as recorded in Truth and Reconcilia- ticular, Indigenous Peoples face worse consulted the local urban Indigenous
tion Commission of Canada’s (TRC) final health outcomes, a poorer standard of organization, Ki-Low-Na Friendship
report. We acknowledge that our efforts housing, less access to adequate food Society. This VLR also reflects the team’s
to incorporate Indigenous perspective and higher levels of incarceration than insight and learnings from the First
and TRC: Calls To Action in this VLR non-Indigenous Peoples. It is important Nations Health Authority (FNHA) and BC
process are only a starting point, and to acknowledge that this has not always First Nations Justice Council, among oth-
there is still significant work to be done been the case. Indigenous Peoples er First Nations programs and initiatives
in order to forge a new relationship have existed on Turtle Island﹘what is underway. Through this VLR process it
centred around Indigenous engagement now understood as North America﹘for was learned that access to and collec-
and perspectives, and on honour and centuries before colonial settlers arrived tion of data on Indigenous Peoples must
respect. in 1491. Existing in great numbers, be carried out in collaboration with
Indigenous groups spanned from Alaska Indigenous-led organizations and may
Underpinning the success of the SDGs down into South America and had their also require approval from the local
is the commitment to leave no one be- own economic trade routes, systems of First Nations Government. Furthermore,
hind. Essentially, if the lives of the poor- permaculture and agriculture, education interpretations of this data, including
est and most marginalized segments systems, sanitation and systems of gov- issues and impacts affecting Indige-
of society do not improve, the goals ernance. However, in the centuries after nous populations, must be made with
will not be achieved. In practice, this the arrival of European settlers, Indig- Indigenous Peoples’ and Indigenous-led
commitment translates to “a three-part enous Peoples were forcibly displaced organizations. Undoubtedly, there is still
imperative: end absolute poverty in all from their land, stripped of basic human much learning to be done.
its forms, to stop group-based discrimi- rights and dehumanized and devalued
GLOBAL GOALS, LOCAL ACTION: KELOWNA’S VOLUNTARY LOCAL REVIEW 13Kelowna originates from the word ki?lawna? from the Nsyilxcən language, spoken by the Syilx People, meaning grizzly bear.
Photo Credits: Amanda Schauerte
Partnerships take time, intention, of the physical, emotional, mental and
dedication and commitment in order to spiritual realities”.15
build trust. We recommend for future
VLRs in Canada, such partnerships serve The Journey Home Strategy (Goal 1) and
as the foundation to the report and be Kelowna Community Action Team (Goal
initiated in the early phases. 3) are examples of where the City of
Kelowna, CSOs and Indigenous groups
In Canada, to achieve the SDGs, have and continue to work collabora-
recognizing and disrupting the inter- tively to achieve the SDGs. Throughout
generational trauma experienced by this report, the team highlights ways the
Indigenous Peoples through holistic and community is working with Indigenous
multifaceted approaches and programs organizations to make progress towards
rooted in Indigenous cultures is vital to the goals, and identifies opportuni-
improving their health and well-being.14 ties for working together through the
The Ki-Low-Na Friendship Society iden- future. However, there is still much
tifies the medicine wheel (Figure 3) as a work to be done. Further relationship Figure 3: An Example of a Medicine
core framework to transforming health building and collaboration is necessary Wheel as Provided by Ki-Low-Na Friend-
among Indigenous Peoples, and central to build on essential work underway. ship Society
to tackling current social issues such This VLR recognizes the importance of
as homelessness. Medicine wheels are traditional Indigenous knowledge in
culture-specific and come in more than solving the pressing challenges faced
one form, yet they all “represent the today, and in achieving the SDGs.
alignment and continuous interaction
GLOBAL GOALS, LOCAL ACTION: KELOWNA’S VOLUNTARY LOCAL REVIEW 14NO POVERTY
Local Community Indicators:
• Low Income. Number of persons in low income measure (LIM)
• Chronic Homelessness. Number of persons living in chronic homelessness conditions
SDG 1 aims to end poverty in all its KELOWNA TRENDS 64 cohort is a broad age range, exhibit-
forms everywhere. At the local level, ing differences in lifestyles, education,
Kelowna’s progress towards achieving In 2017, nearly 30,000 people in the and work experience. Differentiating the
this global goal lies in collective local Kelowna CMA were living in LIM, as group into 0-24; 25-64; and 65+ age cat-
action, partnerships and programs shown in Figure 1.1. The LIM poverty egories would help to better determine
for all persons and families with low threshold in Canada is 50% of median important characteristics of the cohorts,
incomes, and by alleviating, and income, with the poverty rate defined such as financial needs of these unique
eventually eliminating, homelessness as the proportion of households living categories. Further recommendations
throughout the community. Poverty on less than half of the median in- for age and demographic breakdowns
is not exclusive to low income and come.16 For the Kelowna CMA, the total can be found in Appendix A.
homelessness. It is also tied to many number of people in LIM increased by
other SDGs, such as food insecurity 8% from 2013-2017, while the percent- Homelessness can be described as,
(Goal 2) and good health and well- age of the population within LIM has “the situation of an individual, family or
being (Goal 3). Successful measures remained relatively the same at 15% community without stable, permanent,
and targets for Goal 1: No poverty will, for this same period due to population appropriate housing, or the immediate
by default, ensure progress is being growth.17 The 0-17 years age group has prospect, means and ability of acquiring
made in many other SDGs. This report fallen by about 14% from 6,910 people it…”.18 “Point in Time (PiT) Counts” in
provides data on two local community in 2013 to 5,970 in 2017; while the 65+ Canada help identify a minimum num-
indicators for Goal 1: cohort saw nearly an 80% increase, ber of individuals experiencing home-
from 2,570 to 4,580. Those aged 18-64 lessness on a given night in a communi-
• Number of persons in low income comprise about 65% of the total num- ty. While this provides a snapshot of the
measure (LIM) ber of low-income individuals, at 19,040 number of people living “on the street”
• Number of persons living in chronic people. This group experienced about a and in homelessness situations on that
homelessness conditions 7% increase from 2013 to 2017. The 18- day, it often underestimates the severity
of the situation by failing to account for
the hidden homeless population (e.g.
Figure 1.1: Number of Persons in Low Income (after tax) in all Family Units, By Age people who “couch-surf” with friends,
Groups family and acquaintances), and those
cycling in and out of homelessness.
0-17 years old 18-64 years old 65+ years old
30,000 Figure 1.2 illustrates the number of
2,570 3,080 3,810 4,080 4,580 people living in chronic homelessness
25,000
conditions (both absolute and tempo-
20,000 rary situations) according to Kelowna
PiT counts, which have shown a 20%
15,000 17,840 18,520 18,800 18,970 19,040
increase from 2016 to 2018. Kelowna’s
10,000
Journey Home strategy reveals approx-
imately 2,000 people in Kelowna will
5,000
6,910
experience homelessness during the
6,690 6,570 6,170 5,970
course of a year.19 Furthermore, 26% of
0
the homeless population in 2018 were
2013 2014 2015 2016 2017
Indigenous Peoples, though they only
Data level: Kelowna CMA
SourceStatistics Canada. Table 11-10-0018-01 After-tax low income status of tax filers and dependants based on Census
comprise 4.4% of Kelowna’s popula-
Family Low Income Measure (CFLIM-AT), by family type and family type composition tion.20 21 For further information on how
GLOBAL GOALS, LOCAL ACTION: KELOWNA’S VOLUNTARY LOCAL REVIEW 15Figure 1.2: Number of persons living in chronic homelessness conditions tation; Goal 10 household income; Goal
11 affordable housing). Some programs
800 already underway or that could be con-
Absolute Homeless Count sidered to assist in reducing poverty in
Living in Temporary Housing Kelowna and beyond, include:
600
319 • Journey Home, a five-year, local
level strategic plan to address
273 homelessness throughout the
400 community.
286
• A Regional Poverty Reduction Strat-
200 233 egy informed by the Central Okana-
gan Community Wellness Analysis,
which was prepared in 2020 by the
- Central Okanagan Poverty Reduc-
2016 2018 tion Committee.
Data level: Kelowna
Source: Central Okanagan Foundation, Point In Time Counts • Basic Income province-wide study,
released in January 2021 provides
65 recommendations for reforming
B.C.’s income and social support
Canada’s colonial legacy has placed and other appropriate solutions for system. The timing of this report
Indigenous populations at a greater risk those under the LIM poverty level will prohibited analysis of the suite of
for homelessness throughout Canadian serve those most vulnerable to home- recommendations in this VLR, but
cities, as well as potential solutions to lessness. Disaggregated demographic offers opportunity for Kelowna to
address this disparity, refer to information is critical for the successful review this important study as part
Appendix B. development of programs and policies of future projects.
geared at combating poverty. Elimi-
CHALLENGES AND nating homelessness, and developing • Living Wage Canada, which calcu-
COMMUNITY PROGRESS solutions to end poverty will require lates a living wage across Canada
the support and implementation of and offers certification programs for
Those under LIM are at a higher risk of programs from various levels of gov- companies to join.
becoming homeless. When you become ernment including municipal, provincial
homeless, you lose all sense of security and federal; CSOs; and industry as it has For further details on these strategies
and privacy; your life becomes gravely many intersectional elements that are and linkages to other goals, refer to
exposed and even criminalized (Goal linked to many other SDGs (e.g. Goal 2 Appendix A and Appendix B.
16). Targeting prevention techniques Hunger; Goal 3 Health; Goal 9 Transpor-
Goal 1 Interrelations
GLOBAL GOALS, LOCAL ACTION: KELOWNA’S VOLUNTARY LOCAL REVIEW 16ZERO HUNGER
Local Community Indicators:
• Active Farmland. Percent land base actively farmed
• Food insecurity. Percent of persons in household who are food insecure (marginal,
moderate, and severe)
Addressing the goal of zero hunger is • Percent land base actively farmed reduction. Identifying Kelowna’s farmed
tied to ensuring healthy and sustainable • Percent of persons in households land by crop type can further help to
food for all, through strategies to who are food insecure (marginal, determine the degree of benefits of
increase food security, reduce hunger moderate and severe) actively farmed land as well as possible
and support sustainable and local issues or impacts, such as water
agriculture. Locally, Kelowna’s 2030 KELOWNA TRENDS contamination from livestock and/
Official Community Plan defines food or pesticide use (Goal 6). Finally, an
security as “All community residents Figure 2.1 identifies the percent of increase in locally produced food can
[having] access to sufficient, safe, Kelowna’s land base that is actively offer residents greater access to fresh
healthy and culturally acceptable foods farmed. This has remained relatively and healthy local products should they
produced in a manner that promotes consistent (33-35%) since 2012, have the means to purchase.
health, protects the environment and however there was a decline in 2018
adds economic and social value to due to crop switching (e.g. cattle to Figure 2.2 displays household food
communities”. For the community of tree farm; apples to grapes). B.C. insecurity levels in Kelowna’s census
Kelowna, part of ensuring access to Assessment does not deem land metropolitan areas from 2007 to 2018.
healthy foods means also ensuring actively farmed unless farm revenue is The trend over this time period has not
adequate farmland, and promoting being generated.22 Once these recent changed much and indicates that over
local food production and purchase. crop transitions are complete and 10% — more than 15,300 individuals
From an Indigenous perspective, the farms begin generating revenue in 2017/18 — struggle to afford a basic
access to foods means access to lands again, Kelowna’s “actively” farmed healthy diet.
to practice harvesting in traditional land indicator should rise. Benefits of
ways. These are important strategies active farmland include reducing heat CHALLENGES AND
to address zero hunger. This report island effect; flood control; and carbon COMMUNITY PROGRESS
provides data on two local community
indicators for Goal 2:
Food insecurity impacts the physical
and mental health and well-being of
Figure 2.1: Percent Land Base Actively Farmed families and individuals (Goal 3). For
40% further details on the impacts and
costs to the healthcare system as well
35% as mental health outcomes related to
food insecurity, refer to Appendix C. The
30% root cause of household food insecurity
is often an issue of inadequate
25% income, especially given rising costs of
housing, alongside limited supply of
20% affordable housing (Goal 11). Policies
and programs focused on improving
15% household incomes (Goal 10) will assist
in reducing food insecurity levels.
10% Finally, although the food insecurity
2012 2013 2014 2015 2016 2017 2018 indicator used for this report does not
Data level: Kelowna
account for Indigenous Peoples on
Source: City of Kelowna reserve communities, or reflect food
GLOBAL GOALS, LOCAL ACTION: KELOWNA’S VOLUNTARY LOCAL REVIEW 17Figure 2.2: Household Food Insecurity security from an Indigenous perspec-
tive, such data is available through
50%
FNHA’s First Nations Regional Health
40% Survey.† Obtaining this data requires
developing partnerships with local and
30%
neighbouring Nations, which can in
20% turn help provide a community-wide
approach towards evaluating and
10% monitoring food security in Kelowna.
Appendix C includes a discussion on the
0%
importance and value of Indigenous
2007-2008 2011-2012 2015-2016 2017-2018
Peoples’ traditional food and possible
Data level: Kelowna CMA solutions to overcome barriers to access
Source: PROOF (2014), PROOF (2017/2018) and Statistics Canada, Canadian Community Health Survey such foods in settler society (Canadian)
Note 1: For the years 2007-2008 and 2011-2012, use with caution (coefficient of variation 16.6% to 33.3%).
Note 2: People living in Aboriginal settlements and full-time members of the Canadian Forces are excluded from the survey. systems such as food banks.
Goal 2 Interrelations
† First Nations Health Authority About Us available at https://www.fnha.ca/Documents/FNoteNHA_AboutUS.pdf. Note: The FNHA is part of a
unique health governance structure that includes political representation and advocacy through the First Nations Health Council, and technical
support and capacity development through the First Nations Health Directors Association. The First Nations health governing structure works
in partnership with BC First Nations to achieve a shared vision.
GLOBAL GOALS, LOCAL ACTION: KELOWNA’S VOLUNTARY LOCAL REVIEW 18GOOD HEALTH AND WELL-BEING
Local Community Indicators:
• Chronic Diseases. Mortality rate attributed to cardiovascular disease, diabetes, and chronic
lower respiratory diseases
• Illicit Drugs. Illicit drug mortality rate per 100,000 population
• Suicide Rates. Illicit suicide mortality rate per 100,000 population
Goal 3 aims to ensure healthy lifestyles Mental Health CHALLENGES AND
and well-being for everyone at all COMMUNITY PROGRESS
ages through preventative measures • Illicit drug mortality rate per
to avoid illness and disease, and 100,000 population Understanding these complexities,
provide modern, efficient healthcare • Illicit suicide mortality rate per as well as lifestyles and preventative
for everyone. Maintaining good health 100,00 population measures tied to socioeconomic
and well-being must factor in both status, are important considerations
physical and mental health — and PHYSICAL HEALTH when addressing chronic disease and
from an Indigenous perspective, FNHA mortality rates, and in measuring
well-being also includes healthy spirit, health and well-being throughout
heart, mind and body. As the world KELOWNA TRENDS
the community. The BC Centre for
continues to face the COVID-19 global Disease Control will be releasing a
health crisis, the need for whole mind Of the three chronic conditions
finalized “Healthy Social Environments
and body well-being is becoming illustrated in Figure 3.1 cardiovascular
Framework” in early 2021, which
more evident. For Kelowna, progress disease yields the highest mortality
provides a health-based framework
towards achieving good health and rate in both Kelowna and B.C. All three
towards supporting socially
well-being, especially in context of an diseases exhibit lower mortality rates
connected and resilient communities.
aging population, is measured by three in Kelowna as compared to rates in the
Socioeconomic determinants influence
physical and mental health indicators: Province. Attributing mortality rates
chronic disease rates, including food
to chronic conditions is complex and
insecurity, limited access to health
Physical Health challenging. For instance, diabetes
services, reduced employment
mortality rates, although the lowest
opportunities (Goal 8), and lower
• Mortality rate attributed to of the three chronic diseases, may be
incomes (Goals 1 and 10). People who
cardiovascular disease, diabetes, underreported as the main cause of
suffer from household food insecurity
and chronic lower respiratory death as complications can lead to
have higher rates of chronic diseases,
diseases cardiovascular and kidney disease.
including heart disease, diabetes and
cancer when compared to food secure/
Figure 3.1: Mortality Rate Attributed to Diabetes, Cardiovascular Diseases and higher income earners (see Goal 2 and
Chronic Lower Respiratory Diseases Appendix C). The 2020 health crisis
from COVID-19 has further highlighted
160
the gravity of socioeconomic inequities
155.5 Kelowna Province of B.C.
140 in relation to higher rates of chronic
120
137.6 disease, including higher risks of
COVID-19 related complications
100 and mortality.23 Understanding and
80 analyzing demographic data to account
for socioeconomic determinants and
60 inequities as they relate to chronic
40 disease is essential in determining
33.41 33.18
preventative measures, supporting
20
25.52 25.99 healthy lifestyles and managing modern
0 healthcare systems to enhance physical
Diabetes Cardiovascular Diseases Chronic Lower Respiratory and mental health and well-being
Diseases for all. More information about First
Data level: Kelowna
Source: Interior Health, Data to Support Sustainability Development Indicator Report for the City of Kelowna Nations social determinants and health
Note: Due to low counts, the age standardized rates provided are for the aggregated time period of 2013-2017. can be found in the memorandum
GLOBAL GOALS, LOCAL ACTION: KELOWNA’S VOLUNTARY LOCAL REVIEW 19of understanding (MOU): Tripartite KELOWNA TRENDS in Figure 3.3, suicides in the Central
Partnership To Improve Mental Health Okanagan have remained relatively
and Wellness Services and Achieve With the sharp increases in drug related consistent from 2013 to 2017, except
Progress on the Determinants of Health overdose deaths (Figure 3.2) — most for an unexplained hike in 2016 (also
and Wellness established by the First of which are linked to fentanyl (a toxic observed in illicit drug mortality rates,
Nations Health Council, the Province of synthetic opioid) — an ongoing public Figure 3.2).
British Columbia and the Government state of emergency has been declared
of Canada, with First Nations Health by B.C.’s Provincial Health Officer since CHALLENGES AND
Authority as a supporter.24 Although 2016. Additionally, between 2017-2020, COMMUNITY PROGRESS
not analyzed in this report, it is more than 80% of illicit drug deaths in
recommended that Kelowna review B.C. had fentanyl detected.26 Even more Acting on illicit drug mortality rates
this MOU as a foundation to future concerning is the higher rate of illicit requires a greater understanding of
health and wellness projects and drug mortality in Kelowna compared mental health and substance use
programs. Finally, mortality indicators to the Province of B.C. This disparity disorders. Stigma and discrimination
aren’t necessarily the most effective should be further investigated to from the general public as well as
measure of wellness for communities in identify and improve understanding of amongst first responders, health
Canada. Future reporting may wish to contributing factors. Since the COVID-19 care professionals and government
include and evaluate other measures of pandemic began, data from BC Centre representatives create barriers, often
wellness. for Disease Control and FNHA indicate preventing people who use drugs and/
B.C. has experienced yet another surge or who have substance use disorders
MENTAL HEALTH in illicit drug deaths, due to increased from accessing the support and
drug toxicity and more people using treatment they need.29 Many people
Like chronic disease rates, poverty alone due to physical distancing and view drug use as a “choice”, believing it
(Goal 1), and food insecurity (Goal 2) stay-at-home measures.27 28 is only used among people with flawed
can also contribute to poor mental character and/or those who lack self-
health outcomes. Studies show anxiety, In B.C., suicide continues to be one control, which is not only inaccurate,
major depression and suicidal thoughts of the leading causes of death for but also extremely damaging.
increase as food insecurity increases (as young people. Since 2013, for reasons Many Canadians use some form of
shown in Figure C.1 in Appendix C). In unknown, the Central Okanagan psychoactive substances, including
Canada, over 90% of people who took has had higher rates of suicide than prescription and nonprescription
their own life were suffering from a the province. Investigation into this “drugs” and some end up suffering
mental health problem or illness.25 difference is recommended. As shown from addiction due to reliance on them
for treatment of chronic physical and/
or mental pain, loss of or uncertain
Figure 3.2: Illicit Drug Mortality Rate per 100,000 Population employment, exposure to abuse and
trauma, and other stressful events.30
50
Further, it has been found that in B.C.,
Central Okanagan Province of B.C. Indigenous Peoples suffer higher rates
of drug addiction due to multiple
40 issues such as food insecurity (Goal 2),
poverty (Goal 1), poor access to housing
(Goal 11), and systemic racism, further
30 amplifying the stigmatization of drug
use.31 32 A recent study in B.C. indicates
negative stereotypes of Indigenous
20
Peoples are pervasive in the healthcare
system; this racism negatively affects
10 an individual’s health and well-being
and limits access to proper medical
treatment: “all forms of racism
0 experienced by Indigenous Peoples
2013 2014 2015 2016 2017 leads to avoidance of care in large
Data level: Central Okanangan (Local Heath Area) part because Indigenous Peoples seek
Source: BC Coroners Service to avoid being stereotyped, profiled,
belittled and exposed to prejudice.”33
GLOBAL GOALS, LOCAL ACTION: KELOWNA’S VOLUNTARY LOCAL REVIEW 20Figure 3.3: Suicide Rate per 100,000 Population of specially trained police officer and a
25 mental health nurse to work together
Central Okanagan Province of B.C. to apply non-violent de-escalation
techniques to assist the person in
20
distress, while potentially reducing
trauma experienced by the person in
15 crisis and the person responding to the
crisis.
10
To effectively address the structural
factors that give rise to illicit drug use
5 and suicide, programs and services
aimed towards ending poverty (Goal
0 1), zero hunger (Goal 2), reducing
2013 2014 2015 2016 2017
inequalities (Goal 10); and improving
physical and mental health are a key
Data level: Central Okanangan (Local Heath Area)
Source: BC Coroners Service
priority. Alongside such programs
and services, greater attention needs
As reducing illicit drug mortality • First Nations Health Authority is to be given the complexities and
requires multifaceted solutions around implementing culturally relevant stigmatizations of illicit drug use and
harm reduction, the community has programs such as land-based suicide. Stigma, discrimination and
been creative in developing programs healing services. racism need to be addressed so those
and less stigmatizing and more that require health care services are
accessible means of dispensing harm Stigmatization also influences the provided supportive preventative
reduction kits and safe supply, such as: complexities around emergency measures, and the respect and
response to those in crisis. First treatment they deserve. The TRC
• The creation of Kelowna responders such as police and Calls to Actions 18-24 focus on closing
Community Action Team (CAT); a paramedics play a vital role in suicide the gap in health outcomes between
knowledge hub, actively developing prevention — especially when Indigenous and non-Indigenous Peoples
strategies for Kelowna and the responding to mental health calls in areas such as chronic diseases,
surrounding region, to take action — but can also be at higher risk of suicide, and mental health. Continued
on the overdose crisis. Kelowna suicide due to the exposure of trauma efforts amongst local, provincial and
CAT is made up of people with experienced in their work. Kelowna’s federal governments, working with First
lived and living experiences, Police and Crisis Team (PACT) seeks to Nations and CSOs on the collection,
and representatives from law connect those in crisis with the services use of data, information and resources
enforcement, health authorities, they need as well as reduce stigmas (including demographic information,
local governments, Indigenous associated with both those in crisis and on gender, age, race, etc. that
organizations and CSOs among those responding to the crisis. Formed respects privacy) will be critical to the
others. in 2017, this partnership between IH development of successful policy and
• Interior Health (IH) and numerous and Kelowna RCMP supports a team programs for Goal 3.
CSOs throughout Kelowna,
such as The Bridge and Urban
Health Centre, are working to Goal 3 Interrelations
distribute naloxone kits, which
can quickly reverse the effects of
an overdose from opioids (e.g.
heroin, methadone, fentanyl and
morphine).
• Providing readily accessible and
free vending machine delivery of
harm reduction supplies.
• For those with severe substance
use disorder, an effective treatment
option, injectable Opioid Agonist
Treatment (iOAT), is being
administered at an IH centre in
downtown Kelowna.
GLOBAL GOALS, LOCAL ACTION: KELOWNA’S VOLUNTARY LOCAL REVIEW 21You can also read