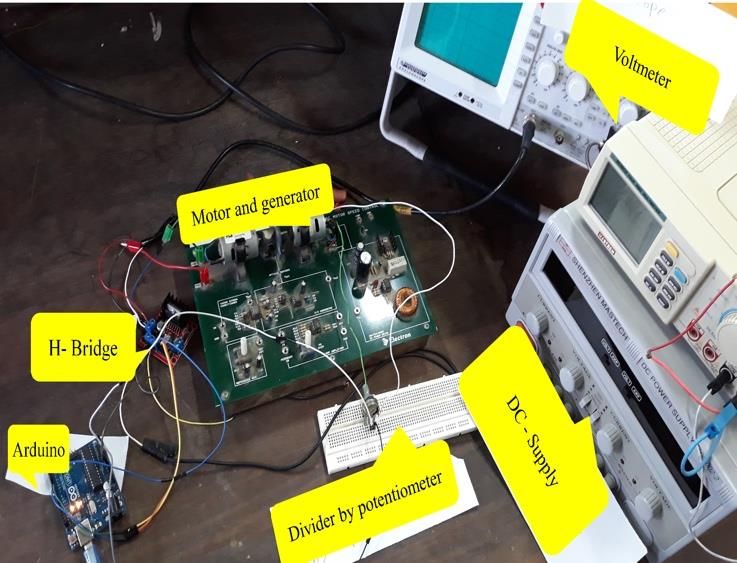
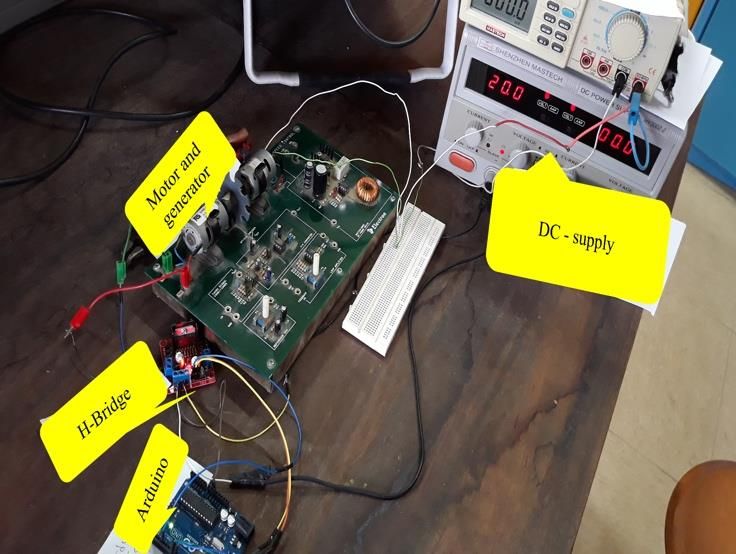
LCAR-2021 Proceeding The Libyan Conference on Automation and Robotics (LCAR-2021) No. 1, July 7-8, 2021 Tripoli/ Libya
←
→
Page content transcription
If your browser does not render page correctly, please read the page content below
The Libyan Conference on Automation and Robotics (LCAR-2021)
No. 1, July 7-8, 2021 Tripoli/ Libya

 LCAR-2021 Proceeding
 The Libyan Conference on Automation and
 Robotics (LCAR-2021)
 No. 1, July 7-8, 2021 Tripoli/ Libya

 1 LCAR 2021 – Tripoli, Libya, July. 7-8, 2021. LCAR2021.LY
The Libyan Conference on Automation and Robotics (LCAR-2021)
No. 1, July 7-8, 2021 Tripoli/ Libya

 Proceeding Contents
Conference Committees .................................................................................. 3

Organizing Committee .................................................................................... 3

e nSiinon cifttniiSS ..................................................................................... 3

Keynote Speakers ........................................................................................... 4
Evaluation of Automatic Method for the Detection and Quantification of the
Abdominal Aortic Calcification Using Dual Energy X-ray Absorptiometry ............. 5

Virtual Mouse Control through Natural User Interface ....................................... 13
R-ORT: A Robust Object Recognition Technique from 2D Images Regardless the
Viewing Angles .......................................................................................................... 19
Speed Control of DC Motor Using Simulink With Arduino ...................................... 25
Real-time Weather Station Monitoring System Through Wireless Sensor Network
(WSN) Using off-the-shelf and Open-Source Components ....................................... 31
Applying Multiple Deep Learning Models for Antipersonal Landmines
Recognition ................................................................................................................. 35
Design and Implementation of a Mini-Automated Teller Machine Replica ............ 43
Implementation of the Computer Numerical Control Milling Machine ..................... 49
Modeling of Pneumatic Air Muscles for Rehabilitation Robotic Systems ................. 55
How Crucial Is It for 6G Networks to Be Autonomous? ............................................ 63

 2 LCAR 2021 – Tripoli, Libya, July. 7-8, 2021. LCAR2021.LY
The Libyan Conference on Automation and Robotics (LCAR-2021) No. 1, July 7-8, 2021 Tripoli/ Libya Conference Committees Organizing Committee Ali Ganoun Dr. Abdusalam Moftah University of Tripoli Faculty of Electrical & Electronics Engineering, Beni Waleed Adel Korban Khaled Al-Ashouri University of Tripoli Mared for Oil & Gas Services, Tripoli Saleh Basha Azeddien Kinsheel University of Tripoli University of Tripoli Scientific Committee Mohamed Elalem Ali Ganoun Elmergib University University of Tripoli maelalem@elmergib.edu.ly a.ganoun@uot.edu.ly Mohammed Elmusrati Alkhair Albarnawi University of Vaasa College of Engineering mohammed.elmusrati@uwasa.fi Technology-Houn Alkhair_brno@yahoo.com Nuri Benbarka Abdulhamed Hwas Universitat Tubingen, Germany University of Tripoli Nuri.benbarka@uni-tuebingen.de ahamed.hawas@yahoo.com Abdelhakim Deboucha Abdalla Elmanife Ecole Supérieure des Sciences Appliquées College of Electrical & d'Alger (ESSA-Alger) Electronics Technolgy, Benghazi a.deboucha@g.essa-alger.dz a.almanfi@ceet.edu.ly Ausama Ahmed Abdullah Masrub Elmergib University Elmergib University ausama.ahmed@elmergib.edu.ly.com a.masrub@elmergib.edu.ly Abdul Majeed Elbkosh Elmergib University aalbkosh@elmergib.edu.ly 3 LCAR 2021 – Tripoli, Libya, July. 7-8, 2021. LCAR2021.LY
The Libyan Conference on Automation and Robotics (LCAR-2021) No. 1, July 7-8, 2021 Tripoli/ Libya Keynote Speakers Abdelmagid Hamouda Professor and Associate Dean for Academic Affairs College of Engineering Qatar University Lecture Title: "Moving towards fifth industrial revolution - Rise of robots and drones" Sumeet S. Aphale Associate professor in Electrical Engineering, CEng, MIET, SMIEEE School of Engineering University of Aberdeen Lecture Title: "Recent developments in control of nanopositioning systems" Othman Omran Khalifa Professor in Electrical and Electronics Engineering International Islamic University Malaysia, IIUM, Malaysia Lecture Title: "Robotic vision object recognition using Deeplearning" Ahmed Alkilani Associate Professors in Information Technoligy University of Tripoli Ali Ganoun Associate Professors in Electrical and Electronics Engineering University of Tripoli Lecture Title: "Remote control and monitoring of oil fields" منجي نويرة/السيد تونسc-ccسياcشركةcعامcمدير Lecture Title: "الرابعةcالصناعيةcالثورةcفىcالروبوتc"تقنية 4 LCAR 2021 – Tripoli, Libya, July. 7-8, 2021. LCAR2021.LY

The Libyan Conference on Automation and Robotics (LCAR-2021)
No. 1, July 7-8, 2021 Tripoli/ Libya

 Evaluation of Automatic Method for the Detection
 and Quantification of the Abdominal Aortic
 Calcification Using Dual Energy X-ray
 Absorptiometry
 Karima M Elmasri
 Nuclear Engineering Department, University of Tripoli, Tripoli, Libya
 K.Elmasri@uot.edu.ly, Elmasrikm@yahoo.com

 ABSTRACT
 The aim of this is to evaluate an automatic method
 developed previously to detect and quantify the severity of
 Keywords:
 the abdominal aortic calcification (AAC) by analysing the
 Abdominal aortic
 calcification;DXA; vertebral fracture assessment (VFA) images acquired using
 VFA, SVM dual energy X-ray absorptiometry (DXA) in single energy
 mode.
 The study Approval was obtained by Cardiff University,
 School of Engineering Ethics Committee. A set of 375
 female VFA images of average age 74.17 ± 13.32 years,
 who underwent osteoporosis examination using DXA
 scanners between 2010 and 2017 were retrospectively
 collected. AAC severity was categorized into 4 classes
 (mild, moderate, severe and no-AAC). AAC was
 significantly correlated with the patient age; Pearson
 correlation was r2 = 0.82, p
The Libyan Conference on Automation and Robotics (LCAR-2021)
No. 1, July 7-8, 2021 Tripoli/ Libya

 I. Introduction University Hospital of Wales, Cardiff, were defined from the
Atherosclerosis is a systemic disease described by the blood Hospital archive and extracted from the Hologic software in
vessels walls thickening and hardening [1], [2]. Abdominal DICOM format with sizes of (1104x402). Patient images were
aortic calcification (AAC) has become a recognised predictor of anonymised and each scan was given a specific number to avoid
cardiovascular diseases (CVD) during the last two decades and repetition.
a manifestation of atherosclerosis [4]. In addition, a strong The selected images exhibited a variety of calcification: starting
correlation between AAC and the coronary calcification has with no calcification to severe calcification. Examples of VFA
been shown in many studies [6]. AAC can be used to predict the images of patients cropped for the abdominal region and edited
myocardial infraction and stroke independently from the for contrast enhancement are shown in Fig 1. These images in
common clinical CVD risk factors [2], [7]. Fig 1 also scored by AAC-24. AAC severity was graded
Several non-invasive diagnostic modalities were employed for categorically by implementing a proposed method by Mohamed
AAC assessment, including radiography, computed tomography et al. [23].
(CT) and ultrasound. Currently, the CT is the gold-standard
technique for AAC quantification but it is limited by high
radiation exposure [8], [9]. Dual energy X-ray absorptiometry
(DXA) is the most common method generally used in medical
imaging to detect osteoporosis through the bone mineral density .
(BMD) measurement and vertebral fractures. Vertebral fracture
assessment (VFA) images acquired alongside BMD
examination using DXA technology provide an inexpensive
resource to diagnose the AAC.
VFA test has shown to be a plausible alternative for
conventional radiography to detect the AAC because of its
location just anterior to the spine site [10]–[12]. Schousboe et al.
[11] have reported good agreement between lateral spine
imaging with DXA and the conventional radiography in AAC
detection.
The most popular semi-quantitative method produced by
Framingham Heart Study [13] was used to assess AAC severity.
This established and validated visual system (AAC-24) was used
in many studies for AAC quantification in the lumbar region L1-
L4 [5], [6], [11], [13]–[19]. In addition to the manual methods,
several automatic approaches were proposed to detect AAC in Figure 1. VFA images acquired by a DXA scanner; (A) a 91- year-old
radiographs [20], [21]. patient with severe AAC (AAC-24 =19), (B) a 74-year-old-patient with
 moderate AAC(AAC-24=8), (C) an 82 year-old- patient with mild AAC (AAC-
An automatic approach was proposed by the author of this paper 24= 3), (D) a 38 year-old- patient with no AAC (AAC-24=0).
[22] for AAC detection and quantification in VFA images
obtained using two Hologic DXA scanners in single energy A set of 15 images with technical artefacts due to patient
mode. The algorithm was applied and tested on 73 VFA images movements, significant anatomical artefacts and those with
with clear evidence of calcification. Three calcification degrees inadequate space anterior to the abdominal aorta for AAC
of AAC: mild, moderate and severe were included in the scoring were excluded from this set. Fig 2 provides some
selected VFA scans. examples of the excluded images and Table 1 lists the study data
Considering that our former developed algorithm allowed characteristics.
segmentation and quantification of AAC automatically in
images with three AAC categories, the author has hypothesised TABLE I. CHARACTERISTICS OF STUDY POPULATION
that the developed method would enable to assess the AAC on
large number of VFA images including VFAs with non-calcified Study Population n= 375
aorta. Average Mean Standard deviation (SD)
 Age, (years) 74.2 13.2
 II. MATREIALS AND METHODS
 Height (cm) 155.0 7.2
 A. Study Population
This retrospective study was approved through the institutional Weight, (Kg) 61.1 11.5
review board of Cardiff, School of Engineering Ethics
Committee. VFA images of 390 female patients referred for the
investigation of osteoporosis between 2010 and 2017 at the

 6 LCAR 2021 – Tripoli, Libya, July. 7-8, 2021. LCAR2021.LY
The Libyan Conference on Automation and Robotics (LCAR-2021)
No. 1, July 7-8, 2021 Tripoli/ Libya

 The automatic process of segmenting the aorta in the rest of the
 VFA images was commenced by initialising the shape of the
 lumbar segments and aorta to their average shape learnt during
 the AAM training process and placing the average shape
 approximately in the correct place on each of the remaining VFA
 images. The AAM search algorithm was then applied to each of
 the VFA images to find the best possible AAM fit as illustrated
 in Fig. 4.
 The process of segmentation finishes by separating aorta from
 lumbar spine segments automatically as the largest segmented
 object [22]. Examples of detected aorta in the VFA images with
 Figure 1. Excluded VFA images from the dataset due to;(A) inadequate AAC of different degrees are shown in Fig. 5.
 space anterior to the abdominal aorta walls; (B) anatomical artefacts, (C)
 artefacts due the movement of the patient.
 TABLE I Characteristics of study population

 Study Population n= 375
 Average Mean Standard deviation (SD)
 Age, (years) 74.2 13.2
 Height (cm) 155.0 7.2
 Weight, (Kg) 61.1 11.5
B. Automatic Approach
The automatic approach of AAC assessment in VFA images
presented in [22] was implemented in two stages. In the first
stage, the abdominal aorta is automatically segmented using
active appearance model (AAM) (34). In the second stage,
calcification within the aortic walls is automatically quantified
within the segmented area. Figure 2. (A) VFA raw image; (B) optimising the best fit, initial position
C. Automatic Segmentation of Aorta (red dots) the best fit (blue dots); (C) segmented lumbar verterbrea (L1-L4)
 and aorta region.
A training set of 50 VFA images with clear evidence of
calcification along each aorta walls were selected to train an D. Automatic Quantification of AAC
AAM model for automatic segmentation. Creating an AAM Further image processing was required to minimize the variation
requires manual placement of a set of landmarks at the points of of the image brightness and the effects of the quantity of soft
interest in the training images. A set of 24 landmarks were tissue surrounding the aorta on the quality of the images, which
placed in the corners and in the center of the end-plates of each makes application of a single threshold not suitable for
four lumbar vertebrae (L1-L4). In addition, 32 landmarks were separating calcified pixels from non-calcified.
placed along the anterior and posterior walls of the calcified Multilevel thresholding segments a grey level image into certain
aorta adjacent to (L1-L4) as indicated in Fig 3. AAM was brightness parts separating the background and several objects
created on the basis of the landmark coordinates in the training [24] . The number of optimal thresholds was assigned by
set as well as the pixel intensities inside the shapes formed by
 calculating the PSNR for each segmented aorta.
the manually placed landmarks following the process described
 Every segmented image was split into eight levels by obtaining
in [22].
 seven thresholds from multi-threshold. Thus, a new vector based
 on the maximum values was obtained and the maximum values
 in each quantization interval was assigned to the eight levels of
 the output image. Consequently, binary image was produced for
 each segmented aorta or its region of interest after this pre-
 processing stage [24].
 Finally, connected regions within the binary image were
 automatically labelled, regions containing less than 50 pixels
 were considered as noise and removed as shown in Fig. 6.
 Afterwards, quantitative features relevant to the AAC were
 extracted from the obtained segmented aorta.
 Figure 2 VFA image of a 91- year-old patient with clear
 calcified aorta labelled with 56 landmark points.

 7 LCAR 2021 – Tripoli, Libya, July. 7-8, 2021. LCAR2021.LY
The Libyan Conference on Automation and Robotics (LCAR-2021)
No. 1, July 7-8, 2021 Tripoli/ Libya

 E. Automatic Calcification Classification
 1) Feature Selection
 Informative features with the greatest discriminatory power
 were selected by applying feature selection algorithms to the
 extracted features. Feature selection usually does not change the
 data, so it is the best choice when data interpretation is essential,
 and this is the preferred choice for studying the segmented aorta
 features. Information gain and gini index algorithms [26] were
 used to analyse the features extracted from the segmented
 images [27]. This stage was used to enhance the performance
 of classifies. The order of ranked features starting with the most
 important was as follows: the fraction of calcified pixels; pixels
 mean, entropy, energy, homogeneity, contrast, correlation, and
 variance respectively.
 2) Automatic Classification
 The performance of three popular classifiers, namely, Support
 vector machine (SVM) using linear kernel from LIBSVM, K-
 nearest neighbor (KNN) and random forest (RF) were tested. A
 K-folds cross validation method was conducted with 5 folds to
 partition the data set into two sets: training set to train the
 classifiers and test set to validate algorithm. Orange package
 software [28] was implemented in the classification stage. In
 this analysis a step of ranking of features were applied to
 evaluate the significance of the features.
 Statistical measures such as accuracy, sensitivity, and
 specificity were used to describe each classifier performance.
 Sensitivity is the percentage of the positive cases which are
 Figure 3. Various examples of segmented aorta with different
 degress of AAC. correctly diagnosed, meaning the ability of the test to identify
 the category of the calcification (0, 1, 2, and 3). Specificity is
 the percentage of negative cases that are correctly classified as
 negative. AAC categories were tested one against the others.
 The difference between three classifiers also was investigated
 by implementing 5 folds 10 times for each classifier and
 unpaired t-test was conducted with 95% confident interval (CI)
 and p
The Libyan Conference on Automation and Robotics (LCAR-2021)
No. 1, July 7-8, 2021 Tripoli/ Libya

in evaluation of AAC categories between two readers, a simple TABLE 1: INTER-OBSERVER OBTAINED FOR TWO READERS FOR AAC-24 AND
 AAC CATEGORIES WITH 95% CI.
agreement among readers was measured as a percent agreement
and cohen's Kappa (k) cross tabulations algorithm statistics
 Method Reader A vs Rearder B
were used [30], [31]. n =100
In general, a kappa coefficient of 0– 0.20 is considered poor AAC-24 AAC category
agreement, 0.21–0.4 is fair, 0.41–0.6 is moderate, 0.61–0.8 ICC 0.953,(0.9310.969) 0.934 (0.903 to 0.956)

is strong, and >0.8 is considered about complete agreement Kappa(κ) 0.634 (0.505 - 0.743)
[32].
In addition, the classification stage was conducted 10 times Agreement % Class Class Class Class
 0 1 2 3
basing on k-folds. Statistical t-test also was conducted to test 89% 73% 65% 63%
classifier’s weighted average classification accuracy achieved
by each classifier [32]. D. Classification Accuracy and Feature Selection
 1) Classification into 4-categories
 IV. Results Figures 8 shows the weighted average classification accuracy
A. Data Analysis of the 4 AAC categories depending on the number of features
The automatic segmentation method was successful in used. The accuracy of SVM increased with the number of
segmenting aorta in 369 out of 375 VFA images due to the features to reach 89% using the first 6 features. RF accuracy
presence of fracture in some vertebrae and poor spatial decreased slightly after using 8 features, while k-nn classifier’s
resolution. The distribution of grouped diagnoses in the AAC- accuracy decreased about 3% after using 8 features.
24 system as follows: no-AAC was (127) and those who had
severe AAC was the lowest number (64), the mild and moderate
 Average accuracy of 4 classes
AAC instances were 93 and 85 respectively.
 0.9
 B. Correlation Between Patient Age and AAC 0.89
There was no calcification score recorded in patients aged < 40 0.88

years, in contrast, the majority of patients aged ≥ 40 years were 0.87
 Average accuracy

given scores with some degree of calcification. The Pearson’s 0.86

correlation coefficient and 95% CIs between age and AAC-24 0.85

scores were, 0.82 (CI, 0.783 - 0.834, p
The Libyan Conference on Automation and Robotics (LCAR-2021)
No. 1, July 7-8, 2021 Tripoli/ Libya

 2) Classification into 3-Categories AAC-24 system points was strongly related to the age and the
The two sets of images, corresponding to mild and moderate most common calcified deposits are detected in L4 segment as
degree of calcification, were merged into a single set to enhance it was proven in many studies [33], [34]. The calcification was
the sensitivity and specificity of classification. Mild and greater in the posterior wall than the anterior.
moderate groups of AAC-24 = (1-12) were merged as class 2 Overall, the AAM was robust and fast, the number of iterations
calcification. Classes 1 (no calcification, AAC-24 score of 0) required by the searching algorithm to complete this stage was
and 3 (severe AAC, AAC-24 score > 12) remained the same. less than 100 iterations as overall and it took only 23 seconds.
The classification results for three classes are shown in Fig 8. To quantify AAC, features extracted from segmented
The best optimal weighted average accuracy, sensitivity, and abdominal aortic region were used to measure the degree of
specificity of every AAC category achieved by SVM, 0.92%, calcification. Feature’s selection algorithm was used in the
0.86%, 0.96%. Classification was conducted by using 6 features classification stage to check the accuracy achieved by three
for each classifier, 10 times with 5 folds. classifiers SVM, RF and KNN.
 The best accuracies obtained by the three classifiers SVM,
 Average accuracy of 3 classes KNN and RF were recorded for class 0, (91.4%, 92.2% and
 0.9 91.1%) and class 3, (94.4%, 91.8%, 91.7%) respectively.
 0.89
 Sensitivity was about 85% for no -AAC and severe AAC, and
 0.88
 this was just under 70% for mild and moderate AAC calculated
 0.87
 by SVM and less than 70% in KNN and RF. Specificity
 computed by three classifiers was >85% for all AAC classes.
 0.86

 Two classes, mild and moderate were merged and a new
 Ave rage accuracy

 classification of AAC categories were conducted; these
 0.85

 0.84

 categories were no-AAC (AAC-24=0), mild and moderate (0
 0.83

 SVM KNN RF
 >AAC-24 12). The sensitivity
 0.82
 and specificity of mild and moderate AAC were enhanced in all
 0.81 classifies.
 0.8
 2F 3F 4F 5F 6F 7F 8F
 The step of merging the mild and moderate calcification groups
 Features

 could improve the sensitivity and specificity with similar
Figure 6. Average classification accuracy achieved by three classifiers with
 the number of features used for 3 AAC categories.
 accuracies in the classifiers.
 AAC-24 manual scoring system also was successfully applied
The three classifiers were tested with t-test and they revealed based on many previous studies and the two readers have scored
non-significant difference between three used classifiers: SVM a set of 100 VFA in a consistent way, kappa correlation has
and KNN, .0043(CI,-0.0014-0.010, p=.128); SVM and shown a moderate agreement basing on four AAC categories.
0.0028(CI,-0.0046-0.0102,p=0.4403; Knn and RF,0.0015(CI,- The algorithm could deal with the VFA noisy images and it is
.005-0.0081,p=0.63). expected to be good for the images obtained by standard
 radiography as well.
 V. Discussion As it was mentioned above that the algorithm was applied on a
This study provides more evidence supporting DXA capability set of a small data set of 73 images good accuracy was achieved
in evaluation of AAC through VFA images. A set of 375 VFA on this set. The accuracies obtained in this study were as good
images obtained by using DXA scanners in single energy mode as those obtained for small set of images in our previous work
were retrieved from the Cardiff University Hospital archive. and greater than 83% for all classes.
These images were obtained using DXA for osteoporosis and Clinically, the proposed method can be introduced into the
vertebral fractures diagnosis with low exposure to radiation. medical imaging fields relevant to cardiovascular diseases and
The study presents an automatic approach for segmentation of VFA images obtained for osteoporosis can be also used to
abdominal aorta and its surrounding area as well as predict vascular calcification basing on AAC.
quantification based on statistical analysis. A set of 15 images This achieved results was good in this large set comparing with
with technical artefacts and inadequate space anterior to the our previous work where the number was about 1/5 of current
lumbar spine were excluded due to the difficulty to find the data set including images of patients with no AAC.
anterior and posterior of aorta within these images for
segmentation purpose or for manual quantifying of AAC by
 VI. Study Limitations
using AAC-24 points. This proposed algorithm is limited with the calcification on the
To quantify AAC on VFA images, Active appearance model surrounding calcified areas which represents a calcification in
(AAM) was implemented for segmentation of the abdominal some parts close to the aorta position. It is not applicable in
aortic walls and their surrounding areas. It has been proven in VFA images which contain anatomical and some technical
many previous works that AAM is a powerful algorithm for artefacts. The stages were not accurate as much as the high
automatic medical images segmentation. calcification stages where the sensitivity of low calcified aortic

 10 LCAR 2021 – Tripoli, Libya, July. 7-8, 2021. LCAR2021.LY
The Libyan Conference on Automation and Robotics (LCAR-2021)
No. 1, July 7-8, 2021 Tripoli/ Libya

walls was 60% AAC (class 1) obtained by SVM comparing Calcif. Tissue Int., vol. 92, no. 6, 2013.
with the severe AAC with sensitivity was > 80% for all [10] N. Schousboe, J.T., Vokes, T., Binkley, N., Genant, H.K.,
classifiers. Sambrook, P. and Pocock, “"Densitometric vertebral
 VII. Conclusion and Future work fracture assessment (VFA),” Int. Osteoporos. Found., vol.
 12, 1-24., 2010.
In conclusion, different degree of abdominal aortic calcification
 [11] J. T. Schousboe, K. E. Wilson, and D. P. Kiel, “Detection
can be detected by DXA modality with single energy mode. The
 of abdominal aortic calcification with lateral spine
pattern of AAC distribution was similar to previously reported
 imaging using DXA.,” J. Clin. Densitom., vol. 9, no. 3, pp.
findings in many other studies, with most high calcified
 302–8, 2006.
deposits were detected at L4 level decreasing towards L1.
 [12] P. N. John T. Schousboe, “Novel Uses of Dual Energy X
The present approach may assist to identify patients with
 ‐ ray Absorptiometry ( DXA ): More than just bone
atherosclerosis before symptoms of cardiovascular
 density measurement John T . Schousboe , MD , PhD Park
development. It provides a fast and low-cost assessment of
 Nicollet Osteoporosis Center , Park Nicollet Clinic ,
location and severity of calcification within the abdominal
 Minneapolis , MN Division of Health Policy and
aorta.
 Management , Universi,” pp. 1–8.
In future studies, to enhance the outcome of the automatic
 [13] P. W. F. W. Kauppila, Polak. Joseph F, L. Adrienne
approach, an interaction with the experts in this field can be
 Cupples, Marian T. Hannan, Douglas P. Kiel, “New indices
conducted on the stage of land marking and AAC scoring to
 to classify location, severity and progression of calcific
validate this algorithm.
 lesions in the abdominal aorta: a 25-year follow-up study.,”
 Atherosclerosis, vol. 132, no. 2, pp. 245–50, Jul. 1997.
 [14] J. C. Witteman, F. J. Kok, J. L. van Saase, and H. a
 Refrences Valkenburg, “Aortic calcification as a predictor of
 cardiovascular mortality.,” Lancet, vol. 2, no. 8516, pp.
[1] J. Sanz and Z. a Fayad, “Imaging of atherosclerotic 1120–1122, 1986.
 cardiovascular disease.,” Nature, vol. 451, no. February, [15] F. Bastos Gonçalves et al., “Calcification of the abdominal
 pp. 953–957, 2008. aorta as an independent predictor of cardiovascular events:
[2] R. Golestani et al., “Abdominal aortic calcification a meta-analysis.,” Heart, vol. 98, no. 13, pp. 988–94, Jul.
 detected by dual X-ray absorptiometry: A strong predictor 2012.
 for cardiovascular events.,” Ann. Med., vol. 42, no. 7, pp. [16] C. J. O’Donnell et al., “Evidence for heritability of
 539–45, 2010. abdominal aortic calcific deposits in the Framingham Heart
[3] L. Mosca et al., “Evidence-based guidelines for Study,” Circulation, vol. 106, no. 3, pp. 337–341, 2002.
 cardiovascular disease prevention in women,” J. Am. Coll. [17] J. T. Schousboe, B. C. Taylor, D. P. Kiel, K. E. Ensrud, K.
 Cardiol., vol. 43, no. 5, pp. 900–921, 2004. E. Wilson, and E. V Mccloskey, “Stroke in Older Women,”
[4] P. W. Wilson et al., “Abdominal aortic calcific deposits vol. 23, no. 3, 2008.
 are an important predictor of vascular morbidity and [18] B. K. E. Wilson, “Detection of Abdominal Aortic
 mortality.,” Circulation, vol. 103, no. Cvd, pp. 1529– Calcification with IVA,” 2006.
 1534, 2001. [19] T. C. Barascuk, N., Ganz, M., Nielsen, M., Register,
[5] C. R. Walsh et al., “Abdominal aortic calcific deposits are “Abdominal aortic calcification quantified by the
 associated with increased risk for congestive heart failure: Morphological Atherosclerotic Calcification Distribution
 The Framingham Heart Study,” Am. Heart J., vol. 144, no. (MACD) index is associated with features of the metabolic
 4, pp. 733–739, Oct. 2002. syndrome.,” BMC Cardiovasc. Disord., vol. 11, no. 1, p. 75,
[6] M. Ganz et al., “Distribution, Size, and Shape of 2011.
 Abdominal Aortic Calcified Deposits and Their [20] M. De Bruijne, “A Pattern Classification Approach to Aorta
 Relationship to Mortality in Postmenopausal Women,” Calcium Scoring in Radiographs,” pp. 170–177, 2005.
 Int. J. Biomed. Imaging, vol. 2012, pp. 1–8, 2012. [21] L. A. Conrad-hansen and M. De Bruijne, “Quantizing
[7] J. T. Schousboe, K. E. Wilson, and T. N. Hangartner, Calcification in the Lumbar Aorta on 2-D Lateral X-Ray
 “Detection of aortic calcification during vertebral fracture Images,” pp. 409–418, 2005.
 assessment (VFA) compared to digital radiography.,” [22] K. Elmasri, Y. Hicks, X. Yang, X. Sun, R. Pettit, and W.
 PLoS One, vol. 2, no. 8, 2007. Evans, “Automatic Detection and Quantification of
[8] R. W. Jayalath, S. H. Mangan, and J. Golledge, “Aortic Abdominal Aortic Calcification in Dual Energy X-ray
 Calcification,” vol. 488, pp. 476–488, 2005. Absorptiometry,” Procedia Comput. Sci., vol. 96, pp. 1011–
[9] M. Cecelja, M. L. Frost, T. D. Spector, P. Chowienczyk, 1021, 2016.
 and Received:, “Abdominal aortic calcification detection [23] A. Mohammad et al., “Vertebral fracture assessment-
 using dual-energy X-ray absorptiometry: validation study detected abdominal aortic calcification and cardiovascular
 in healthy women compared to computed tomography.,” disease in rheumatoid arthritis.,” Semin. Arthritis Rheum.,

 11 LCAR 2021 – Tripoli, Libya, July. 7-8, 2021. LCAR2021.LY
The Libyan Conference on Automation and Robotics (LCAR-2021)
 No. 1, July 7-8, 2021 Tripoli/ Libya

 vol. 43, no. 5, pp. 632–7, Apr. 2014. Fleiss Published by : International Biometric Society Stable
[24] M. H. Horng, “Multilevel minimum cross entropy threshold URL : http://www.jstor.org/stable/2529886 REFERENCES
 selection based on the honey bee mating optimization,” Linked references are available on JSTOR for this article :,”
 Expert Syst. Appl., vol. 37, no. 6, pp. 4580–4592, 2010. vol. 38, no. 4, pp. 1047–1051, 2016.
[25] C. E. Honeycutt and R. Plotnick, “Image analysis [31] M. Nelitz, K. P. Guenther, S. Gunkel, and W. Puhl,
 techniques and gray-level co-occurrence matrices (GLCM) “Reliability of radiological measurements in the assessment
 for calculating bioturbation indices and characterizing of hip dysplasia in adults,” Br. J. Radiol., vol. 72, no. APR.,
 biogenic sedimentary structures,” Comput. Geosci., vol. 34, pp. 331–334, 1999.
 no. 11, pp. 1461–1472, 2008. [32] V. M. Patro and M. R. Patra, “Augmenting Weighted
[26] I. Guyon, “An Introduction to Variable and Feature Average with Confusion Matrix to Enhance Classification
 Selection 1 Introduction,” vol. 3, pp. 1157–1182, 2003. Accuracy,” no. August 2014, 2014.
[27] O. D. Mining, “Orange Data Mining Library [33] E. Honkanen et al., “Abdominal aortic calcification in
 Documentation,” 2017. dialysis patients: results of the CORD study.,” Nephrol.
[28] J. Demšar et al., “Orange: Data Mining Toolbox in Python,” Dial. Transplant, vol. 23, no. 12, pp. 4009–15, Dec. 2008.
 J. Mach. Learn. Res., vol. 14, p. 23492353, 2013. [34] J. T. Chow, S. Khosla, L. J. Melton, E. J. Atkinson, J. J.
[29] S. Yamada, K. Hashimoto, H. Ogata, Y. Watanabe, M. Camp, and A. E. Kearns, “Abdominal aortic calcification,
 Oshima, and H. Miyake, “Calcification at orifices of aortic BMD, and bone microstructure: a population-based study.,”
 arch branches is a reliable and significant marker of stenosis J. Bone Miner. Res., vol. 23, no. 10, pp. 1601–12, Oct. 2008.
 at carotid bifurcation and intracranial arteries.,” Eur. J.
 Radiol., vol. 83, no. 2, pp. 384–90, Feb. 2014.
[30] M. Davies and J. L. Fleiss, “Measuring Agreement for
 Multinomial Data Author ( s ): Mark Davies and Joseph L .

 12 LCAR 2021 – Tripoli, Libya, July. 7-8, 2021. LCAR2021.LY
The Libyan Conference on Automation and Robotics (LCAR-2021)
 No. 1, July 7-8, 2021 Tripoli/ Libya

 Virtual Mouse Control through Natural User
 Interface
 Ayoub Muftah1, Amna Elhawil2, Youssef Omran Gdura3
 1,2,3
 Department of computer Engineering, Collage of Engineering, University of Tripoli,
 Tripoli, Libya
 1
 ayoubmk111@gmail.com, 2a.elhawil@uot.edu.ly, 3y.gdura@uot.edu.ly

 ABSTRACT
 Natural interaction systems have become widely adopted by
 various applications such as in human computer interaction
 Keywords: and virtual environment. In this paper, we present a vision-
 Human computer based gesture application using finger gesture recognition
 interaction, Hand to interact with devices such as computers and tablets
 gesture, Skin without any physical contact. This application was designed
 detection, Image to be used as alternative approach to standard mice and
 processing keyboards by accepting inputs in a form of hand gesture.
 The application was implemented using computer vision
 libraries and existing imaging processing algorithms. The
 application first detects or recognizes the user’s hand, and
 then performs the required image processing to classify or
 to
 distinguish the user’s fingers and finally translate all this
 information to mimic the computer mouse operations.
 Several real-time tests had been conducted on this
 application, and the results were satisfactory in terms of
 design and performance.

 I. Introduction computer vision [4]. Real-time; dynamic, hand gesture
 recognition systems can be used for applications like sign
Hand gestures have been in use for a long time in everyday life language translation, computer interaction, industrial robots,
as a sign language to interact with hear-impaired people [1-3]. and Virtual Reality (VR) such as games and music [1-3][14]
Gestures are also used nowadays in Human Computer and [15].
Interaction (HCI) for communication between people and
machines [3-8]. The main goal of HCI is to allow users to Our proposed application implemented a vision-based
control or interact with devices naturally without any technology of dynamic hand gesture recognition. The paper is
mechanical devices such as mice, keyboards, or user interfaces organized as follows: Sections 2 talks briefly about similar
[7-10]. related works, whereas Section 3 explains in details the
 research methodology. Section 3, discusses and analyzes the
The existing natural interaction technologies can be classified achieved results. Finally, Section 4 presents the conclusion.
into three basic categories: voice recognition, gesture
recognition, or vision recognition (eye-tracking). These II. Related Work
technologies are used in different aspects of life such as sign The first hand gesture recognition system was introduced in
languages translation, voice access to smartphones, voice 1977 by the Electronic Visualization Lab using a data glove
command while driving, flipping electronic books, and gazing and a number of flex sensors [12]. Since then the field of HCI
(or eye-tracking) [2] and [11-13]. However, significant has seen continuous development of vision-based hand
amount of research had been conducted on gesture gestures as a new form of natural interaction between human
recognition; in particular on hand gestures recognition and computer devices [1-8].
systems. There are two cases of hand gestures: static or
dynamic. Static hand gestures recognition requires the process In the last two decades, researchers’ attention has focused on
of a fixed-single image and can be achieved by applying vision-based dynamic hand gesture recognition techniques
standard pattern recognition techniques [6-9]. In contrast, because they can potentially provide the most natural and
dynamic hand gesture recognition relies on real-time hand convenient method for interaction in HCI [13 -15]. The vision-
motions, and it is considered a very challenging task in

 13 LCAR 2021 – Tripoli, Libya, July. 7-8, 2021. LCAR2021.LY
The Libyan Conference on Automation and Robotics (LCAR-2021) No. 1, July 7-8, 2021 Tripoli/ Libya based recognition process can be divided into four main steps: A. Capturing the frame hand gesture detection, then hand tracking and feature The capture frame step is responsible for fetching camera frames in real time such that each frame is processed extraction, and finally classification to reach the output gesture Capture image Skin detection [4][5]. Vision-based techniques were used as a computer music Image enhancement controller [2][11]. The authors in [2][11] presented similar Hand Contour )Dilation.Erosion.Gaussian) solutions to control music player using hand gestures via a computer’s webcam. They developed detection system to detect hands and recognize gestures that could trigger different Recognizing the Do mouse actions such as Windows media player. The vision-based open fingures operation approaches however raise some possible difficulties in regard to the environmental surroundings such as backgrounds and illumination variations which could affect the accuracy of recognition as addressed in [6] and [15-17]. separately. Modern Real-time hand gesture recognition systems tend to B. Skin detection highly rely on Artificial Neural Network (ANN) which gave better results. Although the neural network requires a large In this stage the hand gesture in a frame is detected. The most dataset to train the system, the Convolutional Neural Networks common techniques for skin detection are Hue Saturation (CNN) and Complex-Valued Neural Network (CVNN) Value (HSV) and YCbCr [16] and [20 – 22]. In the studies architectures provide very good average recognition [21 - 22] both techniques retain mostly same good accuracies either for static or real-time hand gesture detection performance. However, the skin detection using HSV was [7 - 10]. The purpose of these techniques is to implement successful in [20] while in [16] HSV results were not sophisticated systems for human-computer communication. satisfactory. In this work we implemented both techniques Computer mouse control via hand gesture is an example. In and evaluated them in order to choose the most appropriate this field, many studies have considered this important one for our application. application using different techniques. In [18] an external webcam captures the image of the hand put on a pad. The fixed image is processed and color detection are used for gesture a) HSV (Hue,Saturation, Value) interpretation. In [19] the gesture recognition is performed Hue is the effective color of a given area and Saturation using the background subtraction method. A valuable represents the bright whereas the “value” is the color literature survey on 10 vision-based hand gesture systems and luminance [19]. The HSV algorithm cab be summarized in their techniques and methodologies is given in [13]. the following steps [16]: III. Research Methodology 1) Convert the RGB image to HSV components. The The analysis phase is considered to be one of the most simplest way to do that is by changing the range of important stages especially in the technologies that may enter R, G and B values from [0, 255] to [0, 1] as in a constructive matter. In this work, the analysis consists of following [16]: several basic stages: a) Capturing the frame ̀ = ⁄255 b) Skin detection c) Image enhancement ̀ = ⁄255 d) Extracting hand contour e) Recognizing the open fingers ̀ = ⁄255 f) Perform the analyzed operation = max( ̀, ̀ , ̀ ) All these stages are summarized in the block diagram depicted in Fig. 1. In the next sections we explain in details each stage. = min( ̀ , ̀ , ̀ ) ∆= − Fig. 1. Block diagram of analysis steps Hue calculation: 14 LCAR 2021 – Tripoli, Libya, July. 7-8, 2021. LCAR2021.LY
The Libyan Conference on Automation and Robotics (LCAR-2021)
No. 1, July 7-8, 2021 Tripoli/ Libya
G′ −B′
60∘ ∗ ( % 6) if = ̀
Δ
B′ −R′
= 60∘ ∗ ( + 2 ) if = ̀
Δ
R′ −G′
∘
{60 ∗ ( + 4 ) if = ̀
Δ
Saturation calculation: (a) (b)
0 , = 0 Fig. 3. a) Original image. b) The result of YCrCb algorithm
={ Δ
, ≠ 0
C. Image Enhancement
Value calculation: After skin detection, it is required to filter the extracted image
and remove the noise. This process is accomplished by eroding
= and dilating the image. That helps to make the boundaries
more shapers and clear. The noise are reduced via smooth
2) The pixel is considered to be a skin pixel if the Gaussian blur effect. In this paper, we used 3 x 3 masks for
corresponding saturation values are in the range of erosion process and 5 x 5 masks for dilation. All unnecessary
(0.20, 0.75), the value exceeds 0.35 and its hue lies details in the hand image have been removed.
between (0, 25) [16]. D. Extracting Hand Contour
The extraction of the hand contour or the region of interest
Fig. 2. shows sample of the results of the HSV technique. (ROI) is performed using OpenCV's findContours function.
Unfortunately, the technique fails to detect the hand. This function is based on Moore neighborhood algorithm.
Each pixel, also called pattern, is considered as a center of
two-dimension square matrix with 8 neighbors surrounding it
as shown in Fig. 4. The idea is to scan these neighboring
pixels starting from the leftmost column to the right and from
the bottom to the top in the clockwise direction. All detected
black pixels are considered as the contour of the pattern.
p
(a) (b)
Fig. 2. a) Original image. b) The result of HSV Skin detection algorithm
Fig. 4. Moore Neighborhood algorithm, p is the pattern
b) YCbCr (Luma, Blue Chroma, Red
Chroma) [19]
YCbCr is an encoded nonlinear RGB signal. It is commonly E. Recognizing the Open Fingers
used in video and digital photography systems. Y is the luma
component, Cb is the blue component and Cr is the red- The number of open figures needs to be recognized from the
difference chroma. The conversion from RGB to YCbCr hand image extracted from the previous steps. For this
color space can be accomplished by following matrix: purpose, we applied convex hull (CH) and convex defect
operations. The first operation is used to extract defects which
will be intersect between hand contour and hand convex hull.
1 1 1 16
CH function in OpenCv is used to close the gabs (holes) in
[ ] = [0.148 −0.291 0.439 ] [ ] + [128] (10)
0.439 −0.368 −0.071 128 the shape and convert it to a closed shape. On the other hand,
convexity defects of the points that represent the outline of a
hand give clues as to the location of the finger tips.
For the skin pixel using YCbCr: red chrominance value lies
between 140 and 165, blue chrominance value lies between
140 and 195 and hue value is in the range of 0.01 to 0.1 [16].
A sample of obtained result is shown in Fig. 3. We have
applied many tests and the success of this technique was very
obvious. However, we have considered it in this work.
15 LCAR 2021 – Tripoli, Libya, July. 7-8, 2021. LCAR2021.LYThe Libyan Conference on Automation and Robotics (LCAR-2021) No. 1, July 7-8, 2021 Tripoli/ Libya 1. The y coordinate of the depth point must be greater than that of the start point ((yd > ys) . 2. The center of hand must be greater than both the depth and the start point. 3. The distance between the depth and the start point (xd Central - xs) must be greater than the relative height of point shortest finger in hand. Fig. 5 Hand convex hull and the hand center The next step is to determine the central point. This can be done by either determining the smallest rectangle area of the shape (hand), as shown in Fig 5, then calculating the central point of the rectangular [23] or alternatively by using a center X End point (xe, ye) tracking unit as suggested by [24]. In this work, the first Y approach is implemented. Start point (xs, ys) depth point (xd, yd) Fig. 7 Determining the open fingers F. Control Mouse Based On Analysis Frame Fig. 5 Getting the minimum area Based on the resulted image obtained from the previous steps, the mouse control is performed. The control includes The last step is to extract all hand defects, as previously either moving the mouse pointer to the coordination of the mentioned. detected hand or making an active click based on the number The defect is instructed between CH and contour as of open fingers. shown in Fig. 6. The defect is compound from start point, depth point and end point as depicted in Fig. 7. IV. Results The end point will be the start point of the adjacent This work is implemented using OpenCV C++ in Visual finger. Studio 2017. The basic user interface is depicted in Fig. 8. Convexity defects Fig. 6 Hand defects Fig. 8 Basic user interface After the extraction step, defects are filtered using some conditions. This process helps to determine how many fingers are open in the hand. These conditions are: The detected number of open fingers is displayed in a label placed on the top-left of the window. Figs. 9 and 10 show the RGB and gray scale images respectively. In Fig. 10, it is obvious the success of the skin recognition for both the hand and the face of the user. In addition, Fig. 10 shows the obtained results when the user opens his 4 fingers. In addition, 16 LCAR 2021 – Tripoli, Libya, July. 7-8, 2021. LCAR2021.LY
The Libyan Conference on Automation and Robotics (LCAR-2021)
No. 1, July 7-8, 2021 Tripoli/ Libya

Fig. 11 illustrates the obtained results of thumb finger
detection. Once the user closes his hand the detected open
fingers is zero as shown in Fig. 12. In this work, the mouse
pointer moves based on the hand movements. The cursor
follows the central of the hand. On the other hand, the left
and right mouse click events are done based on the one and
two open fingers respectively.

 Fig. 12 Zero open finger detection

 V. Conclusion
 The system is built to recognize gestures and trigger the
 specified events that correspond to computer-mouse
 functions. The results are very motivating and can be
 exploited to control a robot or to interact with interface parts
 Fig. 9 Captured RGB resulted image of the computer such mouse or keyboard.

 References
 [1] K. Hoshino, “Hand Gesture Interface for Entertainment Games”,
 Handbook of Digital Games and Entertainment Technologies, 2016,
 pp. 293-312
 [2] J.Jiang, J. Ma and Y. Jin, “Computer Music Controller Based on Hand
 Gestures Recognition Through Web-cam”, EE368 - Digital Image
 Processing, Stanford University, 2012.
 [3] R. Zaman and N.Abraheem, “Comparative Study of Hand Gesture
 Recognition System”, Computer Science & Information Technology,
 2012, vol. 2. pp203-213.
 [4] S.. K. Yewale and P. K. Bharne, “Hand gesture recognition using
 different algorithms based on artificial neural network”, 2011
 International Conference on Emerging Trends in Networks and
 Fig. 10 Captured black and white image of the image in Fig. 9 Computer Communications (ETNCC), April 2011.
 [5] P. Parvathy, K. Subramaniam, P. Venkatesan, P. Karthikaikumar, J.
 Varghese and T. Jayasankar, ”Development of hand gesture recognition
 system using machine learning”, Journal of Ambient Intelligence and
 Humanized Computing (2020), https://doi.org/10.1007/s12652-020-
 02314-2
 [6] A. B. Jmaa , W. Mahdi, Y. B. Jemaa and A. B. Hamado, “A New
 Approach For Hand Gestures Recognition Based on Depth Map
 Captured by RGB-D Camera”, Comp. y Sist. [online]. 2016, vol. 20,
 no.4, pp.709-721.
 [7] O. Köpüklü, A. Gunduz, N. Kose and G. Rigoll, “Real-time Hand
 Gesture Detection and Classification Using Convolutional Neural
 Networks”, IEEE International Conference on Automatic Face and
 Gesture Recognition (FG 2019), Oct 2019
 [8] G.R.S. Murthy and R.S. Jadon, “Hand Gesture Recognition using
 Neural Networks” , 2010 IEEE 2nd International Advance Computing
 Conference (IACC), Feb. 2010.
 [9] A. R. Hafiz, M. F. Amin, and K. Murase, “Real-Time Hand Gesture
 Fig. 11 One open finger detection
 Recognition Using Complex-Valued Neural Network (CVNN)”,
 International Conference on Neural Information Processing ICONIP
 2011, 2011, pp 541-549.
 [10] H. Lin, M. Hsu, W. Chen, “Human hand gesture recognition using a
 convolution neural network”, 2014 IEEE International Conference on
 Automation Science and Engineering (CASE), 2014.
 [11] WAS NO 3 A. R Parab, J. R Ghosalkar, V. Akshay, B. Medge and M.
 Meena,” Music Controller using Gesture Recognition to Control Music
 Playback”, National Conference on Technological Advancement &
 Automatization in Engineering, Jan. 2016.

 17 LCAR 2021 – Tripoli, Libya, July. 7-8, 2021. LCAR2021.LY
The Libyan Conference on Automation and Robotics (LCAR-2021)
No. 1, July 7-8, 2021 Tripoli/ Libya

[12] D. J. Sturman and D. Zeltzer, "A survey of glove-based input," in IEEE [19] Z. Chen, J. Kim, J. Liang, J. Zhang and Y.Yuan, “Real-Time Hand
 Computer Graphics and Applications, vol. 14, no. 1, pp. 30-39, Jan. Gesture Recognition Using Finger Segmentation”, The Scientific
 1994. World Journal, vol. 2014.
[13] S. Pranit, K. Pandya, S. Harsh, G. Jay, “Survey on Vision based Hand [20] V. A. Oliveira and A. Conci, “Skin Detection using HSV color space”,
 Gesture Recognition. International Journal of Computer Sciences and International Joutrnal of Computer Trends and Technology, 2009.
 Engineering, 2019, Vol. 7. 281-288. [21] K. Nikolskaia, N. Ezhova1, A. Sinkov, and Maksim Medvedev, “Skin
[14] Y. Zhu, Z. Yang and B. Yuan, "Vision Based Hand Gesture Detection Technique Based on HSV Color Model and SLIC
 Recognition," 2013 International Conference on Se(rvice Sciences Segmentation Method”, Proceedings of the 4th Ural Workshop on
 (ICSS), Shenzhen, China, 2013, pp. 260-265. Parallel, Distributed, and Cloud Computing for Young Scientists
[15] M. Yasen and S. Jusoh, “systematic review on hand gesture recognition Yekaterinburg, Russia, November 15th, 2018.
 techniques, challenges and applications”, PeerJ Computer Science [22] S. Kolkur, D. Kalbande, P. Shimpi, C. Bapat and J. Jatakia, “ Human
 5:e218 https://doi.org/10.7717/peerj-cs.218 2019. Skin Detection Using RGB, HSV and YCbCr Color Models”,
[16] G. P. Surampalli, D. J and D. M “An Analysis of Skin Pixel Detection Advances in Intelligent Systems Research, vol. 137, pp. 324-332, 2017
 using Different Skin Color Extraction Techniques”, International [23] R. Hartanto, A. Susanto and P. I. Santosa, “Real Time Hand Gesture
 Journal of Computer Applications (IJCA), vol. 54, No. 17, pp. 1-5. Movements Tracking and Recognizing System”, The 7th – Electrical
[17] M. Deswal and N. Sharma, “A Fast HSV Image Color and Texture Power, Electronics, Communications, Controls, and Informatics
 Detection and Image Conversion Algorithm”, International Journal of International Seminar 2014, Indonesia., 2014.
 Science and Research (IJSR), vol. 3 Issue 6, June 2014. [24] A. V. W. Smith, A. I. Sutherland, A. Lemoine and S. Mcgrath,” Hand
[18] H. Grif and C. C. Farcas, “ Mouse Cursor System Based on Hand gesture recognition system and method”, Patent US 6128003 A, 2000.
 Gesture”, Procedia Manufacturing 22:1038-1042, Jan. 2018.

 18 LCAR 2021 – Tripoli, Libya, July. 7-8, 2021. LCAR2021.LY
The Libyan Conference on Automation and Robotics (LCAR-2021)
No. 1, July 7-8, 2021 Tripoli/ Libya

 R-ORT: A Robust Object Recognition Technique from 2D
 Images Regardless the Viewing Angles
 Rawia O. Almontaser 1, Omar Mabrok Bouzid 2, Ayad Ali Keshlaf 3

 1,2
 Electrical and Electronic Engineering Department Faculty of Engineering, University of Gharyan, Gharyan,
 Libya
 3
 Computer Department Faculty of Engineering, Sabratha University
 Sabratha, Libya
 1
 rawia9620@gmail.com, omar.bouzid@gu.edu.ly, 3 ayad.Keshlaf@sabu.edu.ly
 2

 ABSTRACT

 Accuracy is a very important issue for a wide range of
 objects recognition and identification applications, including
 Keywords: robotics, industrial automation systems, and content-based
 image retrieval processes. In this context, this paper presents
 3D object recognition, a 3D object recognition system called R-ORT that
 corner detector, feature recognizes and identifies objects (namely: a pyramid, a
 extraction, recognition
 accuracy, bounding box cubic, and a sphere) based on their 2D images regardless of
 area. the fact that objects seen in novel viewing angles negatively
 affect the recognition accuracy. The system imports an
 object image via a webcam, and extracts an object contour
 from a Canny edge map and then it recognizes the object
 type based on the number of detected contour corners.
 Although every object has a certain number of corners and
 differs from the other, the preliminary evaluation results
 show that in some cases the pyramids and cubes can have the
 same number of corners due to variations in viewing angles
 of the objects. To make the object recognition independent
 from such effect, the system uses besides the corner features
 the ratio of the object’s area to the area of its bounding box
 as combined features. Experimental results of this study
 illustrated that the recognition accuracy is raised from 83%
 (in the case of using only the corner features) to 100% when
 the combined features are utilized under the condition of
 good lighting.

 19 LCAR 2021 – Tripoli, Libya, July. 7-8, 2021. LCAR2021.LY
The Libyan Conference on Automation and Robotics (LCAR-2021)
No. 1, July 7-8, 2021 Tripoli/ Libya

 I. Introduction They claim that this algorithm has the ability to recognize most
One of the hot research areas in the field of computer vision and of the shapes.
image processing is objects recognition and identification. This In [12], features such as color, shape and texture have been used
is because of their applications are found in various aspects of to classify objects using various image processing methods. The
computer vision tasks [1]. Object recognition can be defined as proposed automatic sorting system received frames of images
a process of recognizing each object in a given image, while the to process them and detect the specified features. However, the
identification process is the procedure of labeling these objects rotation of the object- due to the change in its angles of
with their associated names based on predefined features [2]. In inclination- affects the 2D shape recognition (i.e. decreases the
fact, it is easy for a human being to accurately do the object recognition accuracy). This leads to utilize the object area in
recognition and identification for real-world objects, however, addition to the area of its bounding box in order to find the ratio
it would be a difficult task, if a robotic or an automated system between both areas which helped in tackling such challenge.
is intended to be used, unless a certain percentage of errors is
acceptable. Reference [7] presents a system that recognized and identified
 three types of 3D objects using corner features. The
In this aspect, the variations in viewing angles of the objects is experimental results of this system showed that recognition
a real challenge, which should be considered and tackled to errors were caused due to the light effect and the angle view of
increase the accuracy rate of the object recognition and the camera, and they reached 6% as a maximum. The authors
identification processes. These processes are based on the of this study did not take into their account the “viewpoint-
choice of appropriate features that are the most closely to the dependent theories” [13], which mean the object viewpoint is
detected object. In fact, there are many types of objects (i.e. changeable based on the viewpoint at which it is seen and
geometry shapes, table, chair, car, bicycle, a person, birds, or consequently the recognition process will be prone to errors and
any real thing) and each of them can be recognized either by imprecisions. One of the suggested solutions is to store each
one feature or by a combination of various features. The viewpoint and angle of the individual objects, but this form of
features could be color [3], texture [4], shape [5], edges [6], and recognition requires a big size of memory.
corners [7]. Yet, to increase the recognition and identification
accuracy, the selection of appropriate features should depend In the context of this literature review, we found that the closest
on the object type. related study to our work is the work presented in [7]. This work
 does not provide a solution for making the object recognition
The rest of the paper is organized as follows. Section II reviews independent of its rotation. Therefore, the main aim of the
the related work to object recognition, while Section III proposed R-ORT is to introduce a simple, not costly, and easy
introduces the main steps of R-ORT. Tackling the viewing to implement solution that can tackle such a challenge so that
angle challenge will be the topic of Section IV. Section V will the recognition accuracy for sorting 3D objects using image
give the details of the R-ORT prototype. In Section VI, the processing will be improved. This will be achieved via the
results of the proposed system are presented and discussed. integration of both corner features and the area ratio between
Finally, conclusions and future work are given in Section VII. the area of the object and the area of its bounding box, as seen
 in the next sections.
 II. Related Work
Objects recognition and identification is the greatest importance III. R-ORT Steps
for various automation and robotics applications. Literary, this The R-ORT consists of five fundamental steps, namely:
is a well-known topic in computer vision and there are many image acquisition, image enhancement (pre-processing), object
researchers worked on this topic. The study in [2] reviewed the segmentation, features extraction, object recognition. These
state-of-the-art work of object recognition techniques, which steps are described as follows.
covered numerous feature extraction methods and classification
techniques that are used for this purpose. The study concluded B. Image Acquisition
that although there are tremendous of object recognition works In the first stage, images of objects are captured in a true
but, the accuracy of many recognition results are still low. color format in real-time from an incoming video stream. In the
In [8], various objects were recognized and sorted in real-time proposed system, the camera itself is assumed to be stationary
based on Bag features. However, recognition accuracy was and objects are randomly located in front of the camera. This
affected by lighting conditions and unclear backgrounds. In [9], means the object viewpoints are changeable with respect to the
an automatic sorting system based on a computer vision was camera view.
proposed, this system was tended to use for sorting parcel boxes
via calculating their volumes with an accuracy of 87.5%. In C. Image Enhancement
[10], the author proposed an object recognition system based on In order for object images to become ready for use as well as
the use of K-Nearest neighbor method. This method is for basic processing, they must be first pre-processed. This is
supported by the utilization of Eigen values extracted from the composed of two basic operations.
features of an image. Authors of reference [11] proposed a new
algorithm to detect and recognize 2D shapes from an image.

 20 LCAR 2021 – Tripoli, Libya, July. 7-8, 2021. LCAR2021.LY
You can also read