Global Warming and the Free State - Comprehensive Assessment of Climate Change Impacts in Maryland
←
→
Page content transcription
If your browser does not render page correctly, please read the page content below
Global Warming
         and the Free State
    Comprehensive Assessment of Climate
       Change Impacts in Maryland

Report of the scientific and technical Working Group
      Maryland Commission on Climate change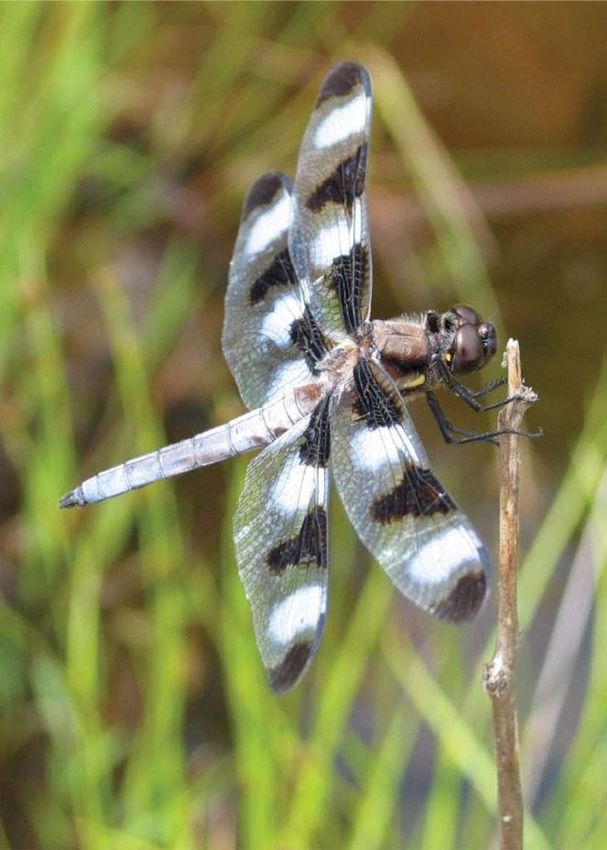
Scientific and Technical Working Group
Donald F. Boesch, Chair, University of Maryland Center for Environmental Science; Frank W. Dawson, Co-Chair,
Maryland Department of Natural Resources; Robert M. Summers, Co-Chair, Maryland Department of the Environment;
William C. Boicourt, University of Maryland Center for Environmental Science; Antonio J. Busalacchi, University of
Maryland, College Park; Donald R. Cahoon, U.S. Geological Survey; Frank J. Coale, University of Maryland, College
Park; Victoria J. Coles, University of Maryland Center for Environmental Science; Russell R. Dickerson, University of
Maryland, College Park; William M. Eichbaum, World Wildlife Fund; Brian D. Fath, Towson University; Raymond M.
Hoff, University of Maryland, Baltimore County; David G. Kimmel, University of Maryland Center for Environmental
Science; Curtis E. Larsen, Lusby, Maryland (U.S. Geological Survey, retired); Andrew J. Miller, University of Maryland,
Baltimore County; Margaret A. Palmer, University of Maryland Center for Environmental Science; Louis F. Pitelka,
University of Maryland Center for Environmental Science; Steven D. Prince, University of Maryland, College Park; Brian
S. Schwartz, The Johns Hopkins University; David H. Secor, University of Maryland Center for Environmental Science;
Timothy Warman, National Wildlife Federation; and Claire Welty, University of Maryland, Baltimore County.

   Members of the Scientific and Technical Working Group reviewing draft materials for the Comprehensive Assessment.

Acknowledgements
The Working Group appreciates the interest and vision of Governor Martin J. O’Malley in establishing the Commission
on Climate Change and charging it to develop an objective and science-based assessment of the impacts of climate
change on Maryland. It has enjoyed the encouragement and support of the Commission Chair, Secretary of the
Environment Shari T. Wilson, and the cooperation of Tad Aburn, Brian Hug, and Elizabeth Entwisle of the Maryland
Department of the Environment, and Zoe Johnson, Gwynne Schultz, and Gwen Shaughnessy of the Maryland
Department of Natural Resources. Chancellor William E. Kirwan and the presidents of the University System of
Maryland encouraged the participation of faculty experts. The preparation of the report was greatly assisted by
the generous support of the Town Creek Foundation and the Keith Campbell Foundation for the Environment.
Katherine Smith of the University of Maryland Center for Environmental Science (UMCES) assisted in developing the
climate change projections from model archives. Jane Thomas and Joanna Woerner of the Integration & Application
Network of UMCES assisted with design and report preparation. Special thanks to David L. Evans, Jay Gulledge,
Anthony C. Janetos, and Jerry M. Mellillo for their helpful reviews of the report.

Citation
Boesch, D.F. (editor). 2008. Global Warming and the Free State: Comprehensive Assessment of Climate Change Impacts in Maryland. Report of the Scientific and
Technical Working Group of the Maryland Commission on Climate Change. University of Maryland Center for Environmental Science, Cambridge, Maryland.
This report is a component of the Plan of Action of the Maryland Commission on Climate Change, submitted to the Governor and General Assembly pursuant
to Executive Order 01.10.2007.07.
Cover photos: NASA, Peggy Davis, Jane Thomas, and Andrew Bossi.

Global Warming
         and the Free State
   Comprehensive Assessment of Climate
      Change Impacts in Maryland

Report to the maryland commission on climate change
                     juLY 2008
     the scientific and technical Working Group
                   edited by Donald f. boesch
            designed and produced by jane M. hawkey

                                                      Michael Juskelis, Maryland Sierra Club
Victoria Coles
Table of contents
Executive Summary...............................................................................................................................................1
section 1: PURPOSE OF THE ASSESSMENT............................................................................................................5
section 2: WHY IS the world’S CLIMATE CHANGING?.....................................................................................7
   Climate variability & change
   Major changes documented
   Warming is unequivocal
section 3: APPROACH TO ASSESSING RECENT & FUTURE CLIMATE CHANGE...............................................11
   The process
   Observations
   Projections
   Emission scenarios
   Confidence
   Abrupt climate change
section 4: RECENT & LIKELY CLIMATE CHANGES IN MARYLAND....................................................................15
   The context
   Temperature
   Heat waves
   Chesapeake Bay temperatures
   Precipitation
   Soil moisture
   Growing season
   Drought and floods
section 5: WATER RESOURCES & AQUATIC ecosystems................................................................................25
   Freshwater supply
   Flood hazards
   Water quality & aquatic biota
section 6: Farms & forests...............................................................................................................................37
   Some basic considerations
   Agriculture
   Forests
section 7: Coastal Vulnerability from Sea-Level Rise & Storms.......................................................49
   Seas rising or land sinking?
   Global sea-level rise
   Future sea-level rise
   Coastal wetlands
   Erosion & inundation
   Stormy weather ahead?
section 8: CHESAPEAKE bAY & COASTAL ECOSYSTEMS...................................................................................59
   Nutrient pollution
   Estuarine sediments
   Living resources
   Ocean acidification
section 9: Human health...................................................................................................................................71
    Heat waves
    Air quality
    Pathogenic diseases
section 10: Implications for Mitigation & Adaptation........................................................................77
    Mitigation
    Adaptation
endnotes.................................................................................................................................................................81
executive summary •

executive summary

                                                                                                                    Wikipedia Commons
   Heritage Festival celebration, Cumberland, Maryland.

   THE ASSESSMENT

   T
             his is an assessment of                       assessment completed in 2007 by the
             the likely consequences                       Intergovernmental Panel on Climate Change
             of     the    changing                        (IPCC). Model projections were based on averages
   global climate for Maryland’s                           for multiple climate models, and selected based on
   agricultural industry, forestry                         how well they replicated both global conditions
   resources, fisheries resources,                         and those observed in Maryland during the 20th
   freshwater supply, aquatic and                          century. Mean projections for 17 selected models
   terrestrial ecosystems, and human                       produced more reliable results than individual
   health. It was undertaken by the Scientific and         models. Changes in temperature and precipitation
   Technical Working Group of the Maryland                 were projected through the 21st century.
   Commission on Climate Change as part of the                In order to estimate the degree of climate change
   Commission’s charge to develop a Plan of Action         in Maryland that could be avoided by actions to
   to address the drivers and causes of climate            reduce emissions of greenhouse gases, two emissions
   change and prepare for its likely consequences in       scenarios were employed. The higher emissions
   Maryland.                                               scenario assumes continued growth in global
      The Assessment was based on extensive literature     emissions throughout the century, while the lower
   review and model projections. In addition to the        emissions scenario assumes slower growth, a peak
   scientific literature, other international, national,   at mid-century, and thereafter, a decline to about
   and regional assessments of the impacts of              40% of present levels by the end of the century.
   climate change were consulted. The results from
   supercomputer models of the responses of climate        RECENT & LIKELY CLIMATE
   to increased greenhouse gas concentrations were         CHANGEs in Maryland
   used to project future conditions for Maryland.
   These were the same models and scenario                 Maryland’s climate warmed after the peak of the
   assumptions that were used in the acclaimed             last Ice Age 20,000 years ago, but has been relatively
 • global warming and the free state: comprehensive assessment of climate change impacts in maryland

stable for the past 6,000 years. Around these long-                        temperatures projected to increase by as much
term average conditions, there have, of course,                            9°F and heat waves extending throughout most
been variations in temperature and precipitation                           summers if greenhouse gas emissions continue to
due to ocean current cycles and solar and volcanic                         grow unchecked.
activity. However, atmospheric concentrations of                              Precipitation is projected to increase during the
greenhouse gases—gases, such as carbon dioxide,                            winter, but become more episodic, with more falling
methane, and nitrous oxide, that trap the sun’s energy                     in extreme events. Projections of precipitation are
from radiating back into space—have dramatically                           much less certain than for temperature, but the
increased since pre-industrial times. Carbon dioxide                       mean projections indicated modest increases of
concentrations exceed those experienced over at                            about 10% or so are likely in the winter and spring.
least the last 650,000 year.                                               Because of more intermittent rainfall and increased
   Largely as a result of this increase in greenhouse                      evaporation with warmer temperatures, droughts
gases, average global temperature and sea level began                      lasting several weeks are more likely to occur during
to increase rapidly during the 20th century. In its                        the summer.
2007 report, the IPCC concluded that the evidence
for the warming of the Earth is “unequivocal.” The                         WATER RESOURCES & AQUATIC
IPCC also concluded that most of the observed                              ENVIRONMENTS
temperature increase since the middle of the 20th
century is very likely due to the observed increase                        Increased precipitation in the
in greenhouse gases.                                                       winter and spring would mean
   In evaluating the changes in Maryland’s climate                         that the water supplies in the
that we are likely to experience over the 21st century,                    greater Baltimore area will
it should be remembered that climatic regimes                              probably not be diminished,
will continue to vary across the state. Western                            but the adequacy of summer
Maryland has cooler winters and summers and                                water supplies in the greater
less precipitation during the winter than the rest                         Washington region, which rely on
of the state. Changes that occur will overlay these                        Potomac River flows, is less certain. Any increases
regional differences, perhaps with some greater                            in precipitation are unlikely to replace groundwater
warming during the summer to the west than on the                          substantially enough to compensate excessive
Eastern Shore. Temperature is projected to increase                        withdrawals of some aquifers. At the same time,
substantially, especially under higher emissions.                          summer droughts may increase groundwater
The increase in average summer temperatures in                             demand for agricultural irrigation.
terms of degrees of warming is greater than that in                           More intense rainfall resulting from the combined
winter. Annual average temperature is projected to                         effects of global climate change and localized
increase by about 3°F by mid-century and is likely                         factors, for example, the influence of the urban
unavoidable. The amount of warming later in the                            canopy on rainfall, is likely to increase peak flooding
century is dependent on the degree of mitigation                           in urban environments. Continued increase in
of greenhouse gas emissions, with summer                                   impervious surfaces attendant with development
                                                                           would exacerbate this problem. Aquatic ecosystems
                                                                           will likely be degraded by more flashy runoff and
                                                                           increased temperatures. Intensified rainfall events
                                                                           and warmer surfaces (roads, roofs, etc.) would
                                                                           result in rapid increases in stream temperatures,
                                                                           limiting habitat suitability for native fishes and other
                                                                           organisms. Higher peak flows and degraded streams
                                                                           would also transmit more nutrients and sediments
                                                                           to the Chesapeake Bay and its tidal tributaries,
                                                                           contributing to water quality impairment in the
                                                                           estuaries.
                                                          Victoria Coles

Sailing club event on the Chesapeake Bay.
executive summary •

FARMS & FORESTS                                            and land. Projections that include accelerating the
                                                           melting of ice would increase the relative sea-level
Crop production may increase                               along Maryland’s shorelines by more than 1 foot by
initially, but then decline later                          mid-century and 3 feet by late century if greenhouse
in the century if emissions                                gas emissions continue to grow. If sea level rises by 3
are not reduced. The longer                                feet, most tidal wetlands would be lost—about 200
growing season and higher                                  square miles of land would be inundated. New tidal
carbon dioxide levels in the                               wetlands developed on newly flooded land would
atmosphere are likely to increase                          not offset the loss of existing wetlands and significant
crop production modestly during                            negative effects on living resources dependent on
the first half of the century. Later in the century,       these wetlands would result. Moreover, if sea level
crop production is likely to be reduced due to             were to rise by 3 or more feet, this would mean
heat stress and summer drought under the higher            that rapid and probably uncontrollable melting
emissions scenario. Milk and poultry production            of land-based ice was underway and that sea level
would be also reduced by heat stress. These changes        would rise at an even greater rate during subsequent
will require adaptation by Maryland’s agricultural         centuries.
industry, including changes in crop or animal                 Rains and winds from hurricanes are likely to
varieties, increased irrigation, and air conditioning      increase, but changes in their frequency cannot
for some livestock.                                        now be predicted. The destructive potential
   The maple-beech-birch forest of Western                 of Atlantic tropical storms and hurricanes has
Maryland is likely to fade away and pine trees to          increased since 1970 in association with warming
become more dominant in Maryland’s forests.                sea surface temperatures. This trend is likely to
Forest productivity in terms of timber produced is         continue as ocean waters warm. Whether Maryland
likely to decline late in the century under the higher     will be confronted with more frequent or powerful
emissions scenario as a result of heat stress, drought,    storms depends on storm tracks that cannot yet be
and climate-related disturbances such as fires and         predicted. However, there is a greater likelihood that
storms. The biodiversity of plants and animals             storms striking Maryland would be more powerful
associated with Maryland’s forests is likely to decline.   than those experienced during the 20th century and
Habitat alterations resulting from climate change          would be accompanied by higher storm surges—
may force out 34 or more bird species, including the       made worse because of higher mean sea level—and
emblamatic Baltimore oriole, although southern             greater rainfall amounts.
species may replace them.
                                                           CHESAPEAKE BAY & COASTAL
COASTAL VULNERABILITY                                      ECOSYSTEMS
Sea level in Maryland rose by 1                            Chesapeake and Coastal Bays
foot in the 20th century, partially                        restoration goals will likely be
because the land is sinking as a                           more difficult to achieve as
result of slow adjustments of                              the climate in Maryland and
the Earth after the last Ice Age.                          the Chesapeake watershed
Maryland coastal regions have                              changes. Increased winter-
been subsiding at about a rate of 6                        spring runoff would wash more
inches per century and should continue                     nutrients into the bays, and higher
at this rate during this century. Additionally, the        temperatures and stronger density stratification in
average level of the sea in this region rose by about      the estuaries would tend to exacerbate water quality
the same amount (6 inches) during the past century,        impairment, the alleviation of which is the prime
resulting in the observed 1 foot of rise of the mean       restoration objective. Consequently, nutrient loads
tidal level relative to the land. As a result, Maryland    would have to be reduced beyond current targets to
has experienced considerable shoreline erosion and         achieve water quality requirements. Very significant
deterioration of coastal wetlands which are a critical     changes are also likely to occur that affect sediment
component of its bays and estuaries.                       delivery and sedimentation in the estuaries, but are
   Sea-level rise is very likely to accelerate,            difficult to quantitatively predict. These include
inundating hundreds of square miles of wetlands            potential increases in sediment loads from rivers
 • global warming and the free state: comprehensive assessment of climate change impacts in maryland

as a result of increased runoff and more erosive          because of public health precautions and treatment,
extreme discharge events, including those caused by       which would likely adapt to changes in disease
hurricanes, and from shoreline and wetland erosion        risks. Climate change might affect the exposure of
as a result of accelerated sea-level rise.                Marylanders to pathogens such as the West Nile
   Living resources will very likely change in            virus, but precautions and treatment could manage
species composition and abundance with warming.           this greater risk.
A mixture of northern, cool water species and
southern, warm water species currently resides in         MITIGATION & ADAPTATION
the Chesapeake Bay. Northern species such as soft
shell clams and eelgrass are likely to be eliminated      The reduction of greenhouse
later in the century, almost certainly if greenhouse      gas emissions has substantial
gas emissions are not mitigated. Southern species         benefits for Maryland. The
are very likely to increase in abundance because          mitigation of global emissions
the milder winters would allow or enhance                 by mid-century would very
overwintering populations.                                likely result in significantly
   As ocean water becomes more acidic, shellfish          lower sea-level rise, reduced
production could be affected. Increased atmospheric       public health risks, fewer extreme
carbon dioxide concentrations in the atmosphere           weather events, and less decline in agricultural
have already lowered pH in the world’s oceans, a          and forest productivity and loss of biodiversity and
trend that is very likely to continue. Recent research    species important to the Chesapeake Bay. More
indicates that the rate at which oysters and other        serious impacts beyond this century, such as sea-
coastal shellfish build their calcium carbonate shells    level rise of 10 feet or more, would be avoided.
will likely be affected, but whether this would occur        Based on the projections made in this report,
in Maryland waters has not been evaluated.                adaptation strategies for human health, water
                                                          resources, and restoration of Maryland’s bays should
HUMAN HEALTH                                              be evaluated and, where necessary, implemented.
                                                          Adaptation measures to reduce coastal vulnerability
Health risks due to heat stress                           should plan for a 1 foot rise in sea level by mid-
are very likely to increase, if                           century and a rise of at least 2 feet by late in the
emissions are not reduced.                                century. Depending on the course of greenhouse gas
Under the higher emissions                                emissions, observations, and modeling, planning
scenario, heat waves are                                  for increases in sea level of up to 4 feet by the end
projected to greatly increase                             of the century may be required. The Commission
risks of illness and death before                         on Climate Change should evaluate additional
the end of the century, with an                           adaptation strategies related to human health, water
average of 24 days per summer exceeding 100°F. The        resources, forest management, and restoration of the
poor, the elderly, and urban populations are most         Chesapeake Bay and Maryland’s Coastal Bays. The
susceptible. Some, but not all, of these increased        projections of impacts provided in this assessment
risks can be reduced by air conditioning and other        provide a frame of reference for these evaluations.
adaptation measures.                                         Maryland should marshal and enhance its
   Respiratory illnesses are likely to increase, unless   capacity for monitoring and assessment of climate
air pollution is greatly reduced. More ground-level       impacts, as a more extensive, sustained, and
ozone, responsible for multiple respiratory illnesses,    coordinated system for monitoring the changing
is formed under prolonged, high temperatures.             climate and its impacts is required. Because of its
Releases of air pollutants (nitrogen oxides and           national laboratories, strong university programs,
volatile organic compounds) that cause ozone to be        knowledge-based economy, and proximity to the
formed have been declining, but would have to be          nation’s capital, Maryland is in a strong position
reduced much more in a warmer climate to avoid            to become a national and international leader
a reversal in progress toward achieving air quality       in regional-to-global climate change analysis
standards.                                                and its application to innovative mitigation and
   Increased risks of pathogenic diseases may be less     adaptation.
likely. The mortality due to vector-borne and non-
vector borne diseases in the United States is low
section 1: purpose of the assessment •
purpose of the assessment
Section 1
US Fish & Wildlife Service
Sunset over Maryland marshlands.
R
ecognizing the scientific consensus
about climate change, the contribution
of human activities, and the vulnerability
of Maryland’s people, property, natural resources
and public investments, Governor Martin O’Malley
issued an Executive Order on April 20, 2007, that
established Maryland’s Commission on Climate
Change in order to address the need to reduce
greenhouse gas emissions and prepare the State
for likely consequences of climate change. The
Commission was given the task of developing a
Plan of Action to address the drivers and causes of
climate change, prepare for the likely consequences
Governor Martin O’Malley signs the Executive Order creating
and impacts of climate change to Maryland, and the Maryland Commission on Climate Change, joined by Cabinet
establish firm benchmarks and timetable for members and General Assembly leaders.
implementing the Plan.
The Plan of Action includes three components: Technical Working Group comprised of Maryland-
1. a Comprehensive Climate Change Impact based scientists, engineers and other experts, who
Assessment, worked over ten months to produce this report.
2. a Comprehensive Greenhouse Gas and Specifically, the Working Group was charged to
Carbon Footprint Reduction Strategy, and investigate climate change dynamics, including
3. a Comprehensive Strategy for Reducing current and future climate models and forecasts
Maryland’s Climate Change Vulnerability. and evaluate the likely consequences of climate
change to Maryland’s agricultural industry, forestry
This report constitutes the climate change impact resources, fisheries resources, freshwater supply,
assessment and thus a key part of the Commission’s aquatic and terrestrial ecosystems, and human
Action Plan. It was prepared by a Scientific and health. In addition, the Working Group was called • global warming and the free state: comprehensive assessment of climate change impacts in maryland
on to advise the Commission and its other working assuming global action to reduce these emissions.
groups as their work proceeded. In particular, the The second scenario helps to identify the changes
Scientific and Technical Working Group provided that may be inevitable and for which Maryland
information and analysis for the development of must be prepared to adapt. In this manner, it seeks
the goals for reducing greenhouse gas emissions to provide a basis for the development of prudent
and for adaptation strategies for reducing coastal and effective public policy by the Governor and
vulnerability. General Assembly.
This Comprehensive Assessment of Climate Secondly, this Assessment is presented so as to
Change Impacts in Maryland is intended to serve a be accessible and comprehensible to the citizens of
number of purposes. First, it is one of the three legs Maryland as they develop their understanding of
of the stool for the Commission’s Plan of Action, this unprecedented challenge to humankind and
providing regional context for the importance of make personal choices and decisions regarding
reducing Maryland’s greenhouse gas emissions policy options at local, state, and national levels.
and projections of future climate change for which Finally, this Assessment is just the first installment
we should be prepared to adapt. For this reason, of what must be continuous reassessment of
projections for climate change and its impacts Maryland’s changing climate, the impacts of this
present two scenarios, one assuming continued change, and what science and engineering can do to
growth in greenhouse gas emissions and the other understand, predict, and manage these impacts.
Victoria Coles
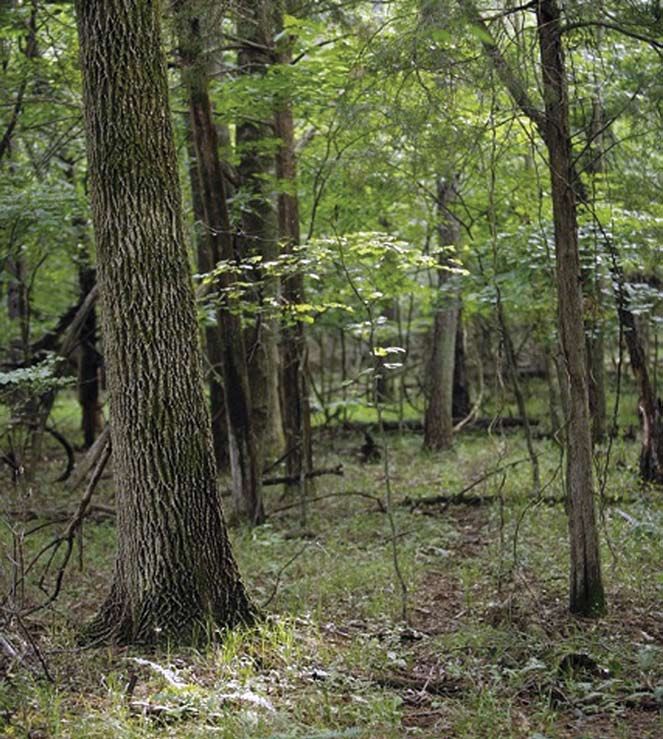
Forested mountains and grass meadows of western Maryland.section 2: why is the world’s climate changing? •
why is the world’s climate changing?
key points
Maryland’s climate has been variable but stable for several thousand years.
Section 2
Maryland’s climate warmed after the peak of the last Ice Age and has been relatively stable for the past 6,000 years.
Around these long-term average conditions there have, of course, been variations in temperature and precipitation
due to ocean current cycles, solar activity, and volcanic activity.
Atmospheric concentrations of greenhouse gases have dramatically increased.
Certain gases that trap the sun’s energy from radiating back into space have increased since pre-industrial times.
Carbon dioxide concentrations exceed those experienced over at least the last 650,000 years. Average global
temperature and sea level began to increase rapidly during the 20th century.
Global warming is unequivocal.
The Intergovernmental Panel on Climate Change found the evidence for the warming of the Earth to be
“unequivocal.” The IPCC concluded that most of the observed temperature increase since the middle of the 20th
century is very likely due to the observed increase in greenhouse gases.
Climate Variability & Change
M
aryland’s climate has changed over solar activity, and even volcanic eruptions halfway
millennia as the major planetary forces around the world. But, over the past few thousand
affecting the Earth’s climate caused years, this has caused climate to fluctuate around a
glaciers to spread and recede. However, after the rather consistent average.
peak of the last Ice Age about 20,000 years ago, the During the 20th century, however, scientists have
climate warmed, most of the glaciers melted, and concluded that the Earth’s climate was warming
sea level rose, reaching approximately the present and is very likely to warm much more dramatically
conditions about 6,000 or more years ago. The slow, as a result of human activities that have increased
continued rise in local water levels was mainly the the amount of certain gases in the atmosphere.
result of the slow sinking of the Earth’s crust beneath These gases, most notably carbon dioxide, but also
us—this itself is a delayed effect of melting glaciers. methane and nitrous oxide, trap some of the sun’s
The first Native Americans came to Maryland as its energy radiating back out into space, much as the
climate was becoming more moderate and habitable. glass panes of a garden greenhouse. The presence
For most of the time they have been here and all of of these gases warms the atmosphere sufficiently
the time of occupancy by Europeans, Africans and for life to flourish—without these greenhouse gases
other subsequent migrants, our climate has been the average surface temperature of Earth would be
relatively stable. Our society, economy, and quality 0°F rather than 57°F.1 But, as these heat-trapping
of life has developed under and adapted to this gases continue to increase the temperature of
climatic regime. Earth’s atmosphere and oceans will also continue to
Of course, our weather (see Section 4 for a increase—this is what is meant by global warming.
discussion of the differences between weather and
climate) still varies from year to year—some years Major Changes Documented
are warmer or wetter than others—and even over
cycles that extend over several years to a decade or There is no doubt that greenhouse gases in the
more. This variability is caused by shifts in large- atmosphere have been increasing. Since pre-
scale processes in the ocean and atmosphere such as industrial times (1750) carbon dioxide concentration
the El Niño cycles in the Pacific Ocean, variations in has increased by 38 percent, methane by nearly • global warming and the free state: comprehensive assessment of climate change impacts in maryland
170 percent, and nitrous oxide by 17 percent.2 The global mean surface temperature, based on
The increase in carbon dioxide has been caused both air and ocean temperatures, has increased by
primarily by burning of fossil fuels (coal, oil, and more than 1°F (0.6°C) since 1930 (Figure 2.2), with
natural gas) and the clearing of forests which held most of this due to a steady and rapid increase since
reservoirs of carbon in wood and soils and removed 1980. Twelve of the last thirteen years rank among
carbon dioxide from the atmosphere through the warmest years since 1850, when thermometer
photosynthesis. The increase in the other two major measurements became widely recorded. In the
greenhouse gases is mostly due to agricultural Northern Hemisphere, where there are numerous
activities: methane through growing rice and raising data on temperature proxies such as tree ring
cattle, and nitrous oxide from the application of thickness and ratios of stable isotopes, neither the
industrial fertilizers to crops, as well as a result of recent high global mean temperature nor the rapid
the high-temperature combustion of fossil fuels. rate of temperature increase have been experienced
Carbon dioxide concentration in the atmosphere during the last 2000 years.2
has increased from a pre-industrial value of about Global warming affects not only air and ocean
280 parts per million (ppm) to 384 ppm by 2007 temperatures but also precipitation and sea level—
(Figure 2.1), exceeding by far the natural range ocean waters expand as they warm and as melting
over at least the last 650,000 years as determined glaciers and polar ice sheets further contribute
from analyses of air bubbles trapped in glacial ice. to the ocean’s volume. Warmer conditions cause
(A) Atmospheric Carbon Dioxide (B) Concentrations of Greenhouse Gases
(measured at Mauna Loa, Hawaii) from Year 0 to 2005
390 400 2000
Carbon Dioxide Concentration (ppmV)
annual cycle carbon dioxide (CO2)
380 nitrous oxide (N2O) 1800
methane (CH4)
CO2 (ppm), N2O (ppb)
370 1600
350
360 Jan Apr Jul Oct Jan
CH4 (ppb)
1400
350
1200
340
300
1000
330
320 800
310 250 600
1960 1970 1980 1990 2000 0 500 1000 1500 2000
Year Year
Figure 2.1. (A) Concentrations of carbon dioxide measured at Mauna Loa, Hawaii have shown a continuous increase since measurements began
in 1958. Annual fluctuations represent seasonal biological cycles of photosynthesis and respiration. (B) Concentrations of the greenhouse
gases carbon dioxide, methane, and nitrous oxide dramatically increased during the 20th century, exceeding by far concentrations that
occurred over the last 2,000 years.2
Global Mean Temperature During the 20th Century
0.4
Difference (ºC) from 1961-1990
U.K. Meteorological Office sea surface temperature
Japan Meteorological Agency sea surface temperature
0.2 U.S. National Climate Data Center
0.0
-0.2
NASA Jet Propulsion Lab, CIT
-0.4
-0.6
1860 1880 1900 1920 1940 1960 1980 2000
Year
Figure 2.2. Global mean temperature has increased approximately
1.4°F (0.8°C) during the 20th century as reflected in three separate AIRS, a new spaceborne instrument, is designed specifically to
meteorological databases.2 measure the amounts of water vapor and greenhouse gases.section 2: why is the world’s climate changing? •
more moisture to go into the atmosphere through increase in globally averaged temperatures since the
evaporation and plant transpiration, and this water middle of the 20th century is very likely due to the
vapor must come down in the form of precipitation. observed increase in greenhouse gas concentrations
However, the effect is not uniform, with increased resulting from human activities. The Panel also
precipitation documented over the middle and high found decreases in snow cover and sea ice extent
latitudes of the Northern Hemisphere and over and the retreat of mountain glaciers during this
tropical land areas, while precipitation declined in period. Global average sea level rose with increasing
the already dry, lower latitude lands. ocean water temperatures. Heavy rains increased in
frequency in some regions of the world.
Warming Is Unequivocal Extensive physical and ecological changes
resulting from the changing climate are also
The conclusion that the warming of the climate described in the IPCC assessment, including
system is unequivocal and the preceding observations thawing of permafrost, lengthening of the growing
come from the most recent assessment of the season in middle and high latitudes, shifts in the
Intergovernmental Panel on Climate Change, an ranges of animals and plants toward the poles and
international scientific body established by the World up mountain elevation gradients, declines in some
Meteorological Organization plant and animal species, and earlier seasonal
Global warming is
and by the United Nations flowering of trees, emergence of insects, and egg-
unequivocal and could Environment Programme. laying in birds.5
cause irreversible The IPCC was awarded, along The same detailed appraisal of the relationship of
damage to the planet with Vice-President Al Gore, the changes in Maryland’s climate and the increase
the Nobel Peace Prize for its in greenhouse gas concentrations has not been
Fourth Assessment Report3, released in 2007. The undertaken, and indeed is not practical because of
findings of the Panel are careful and deliberate and the global scale of the climate system. However, the
enjoy the wide acceptance of the climate science trends of increased temperature, precipitation, and
community—in fact, scientific criticism that sea level rise and many of the biological changes
the IPCC was too cautious and reticent4 is more that have been observed are very consistent with the
common than criticism for overstating the case. assessment of the IPCC for North America.2,5
The IPCC concluded that most of the observed
U.S. Geological Survey
Comparison photos of McCarty Glacier in Kenai Fjords National Park, Alaska. McCarty glacier retreated ~12 miles between the period these
two photos were taken and is not visible in the 2004 photo.10 • global warming and the free state: comprehensive assessment of climate change impacts in maryland
NPS
The lakes, ponds, and streams of Maryland are a favorite habitat for the twelve-spotted dragonfly.section 3: approach to assessing recent & future climate change • 11
approach to assessing recent & future climate change
key points
The Assessment was based on extensive literature and model projections.
Section 3
In addition to the scientific literature, other international, national and regional assessments of the impacts of
climate change were consulted. The results from supercomputer models of the responses of climate to increased
greenhouse gas concentrations were used to project future conditions in Maryland.
Model projections were based on averages for multiple climate models.
Models were selected based on how well they replicated both global conditions and those observed in Maryland
during the 20th century. Mean projections for 17 models produced more reliable results than individual models.
Changes in temperature and precipitation were projected through the 21st century.
Higher and lower emissions scenarios were employed.
In order to estimate the degree of climate change in Maryland that could be avoided by actions to reduce emissions
or greenhouse gases, two emissions scenarios were employed. The higher emissions scenario assumes continued
growth in emissions throughout the century, while the lower emissions scenario assumes a slower growth peak at
mid-century and declines thereafter to about 40% of present emissions levels by the end of the century.
The Process
T
he Scientific and Technical Working scale for the IPCC assessment. Such models are run
Group (STWG) developed this assessment on supercomputers using common assumptions
using published scientific information on about future emissions of greenhouse gases and
Maryland’s climate and environments, the recent have become increasingly skillful in reproducing
IPCC reports, even more recent scientific literature, the climatic conditions experienced during the
and several new assessments of specific issues or 20th century looking backward in hindcast mode.
region impacts. Particularly important among these This gives some level of confidence in their ability
assessments were various Synthesis and Assessment to project conditions with future increases in
Products being produced by the U.S. Climate Change greenhouse gases for at least the near future. The
Science Program (some drafts still in preparation or models were used by the IPCC in demonstrating
review)6 and regional assessments, especially the that the warming observed over the past 100 years is
Northeast Climate Impacts Assessment (NECIA). unlikely to be due to natural causes, such as the sun
The NECIA, led by the Union of Concerned and volcanoes, alone. Model results that take into
Scientists, produced two very readable reports7 on account greenhouse gas emissions and the cooling
climate change, its impacts and solutions in the effects of sulfate aerosols, also emitted by burning
northeastern United States, defined as the nine- fossil fuels, are able to reproduce the observed 20th
state region including Pennsylvania and New Jersey century warming, while those that only account for
northward. Because of its proximity, the findings the natural climate forces do not (Figure 3.1).
of the NECIA are highly relevant and have been While our understanding of the forces that
reflected in the Maryland assessment. affect the Earth’s climate will improve, the scientific
The STWG did not have the time or resources to community believes that the current generation of
collect or analyze extensive data or to develop new models produces reasonable projections of future
models of Maryland’s climate, relying instead on the climatic conditions. They cannot, of course, predict
primary or summary literature as described above. the weather on a specific place or day, but can
It did, however, use the results of the extensive represent best estimates of future climatic conditions
general circulation models that were run on a global within a broad region averaged over a decade.12 • global warming and the free state: comprehensive assessment of climate change impacts in maryland
plausible tracks. A similar approach was used in the
IPCC Fourth Assessment by employing a group of
Temperature Anomaly (ºC)
1 .0 satisfactorily performing general circulation models
with human effects all run with the same assumptions for greenhouse
gas emissions. The archived files of output from
observed
0 .5 these supercomputer model runs were accessed for
this assessment.9 The average of the model outputs
0 .0 yields a better representation of present climate than
any single model10 or the small number of models
natural forces only used in the Northeast Assessment.7 This ensemble
mean gives the best projections because some model
1950 2000 inaccuracies are unrelated to the shortcomings of
Figure 3.1. Climate models run with just natural forces due to other models, so they cancel out on average.
solar activity and volcanoes (blue band) suggest slight declines This assessment used a similar strategy, beginning
in global mean temperature during the latter 20th century, while with the 24 models used for the IPCC Fourth
the same models including greenhouse gases and aerosol sulfates
from human activities (pink band) show warming very consistent
Assessment model intercomparison. The 17 best
with what was actually observed (solid black line).2 performing models were selected based on how well
the models reproduce the climate in Maryland over
the past century.11 Net error
Observations scores were computed for
Projections of the
temperature and precipitation
The focus of this assessment is the impacts of future based on means, trends over 17 best performing
climate change, rather than how much of past the century, seasonal and models were averaged
climate variability is due to human effects, so the ten-year filtered correlations,
emphasis is on model projections. However, data the standard deviation, and the skill with which
from stations from the United States Historical the models represent global climate. The subset of
Climate Network, corrected for the warming effects better performing models was then averaged over
of urbanization and the local effects of topography, the state of Maryland to estimate changes in future
were used to determine how well models reproduce climate in this region.
recent climate in Maryland. These individual Because the global models require so many hours
weather station records also yield information on of supercomputer time to run, they cannot represent
the trends in temperature and precipitation that regions as small as Maryland with more than a few
have been experienced. grid points (Figure 3.2). Thus, the projected changes
Beyond temperature and precipitation, over the state need to be considered in the context
sufficiently long records of other climate-sensitive of the large differences in local state climate. For
variables are scarce, thus attribution of past changes example, one would expect the climate in high
to climate is difficult. One example of the value of elevation regions of western Maryland to remain
such secondary indicators is the recorded trend cooler than the climate on the coastal plain despite
toward earlier start of honey production in the similar temperature increases in both regions (see
Piedmont region.8 Honey production requires both Table 4.1 in the next chapter). The average seasonal
temperatures high enough to maintain larval bees cycle for 1979-1999 is removed from each model
and an ample source of nectar from flowering trees, output prior to determining future changes. This
thus integrating two measures of climate change. reduces the effect of individual model biases on the
Other examples of observed changes in forestry and projection of future changes and projects future
agriculture, Chesapeake Bay processes, sea level, climate relative to the average conditions around
and hydrology are highlighted later in the report. 1990.
Projections
In forecasting the storm tracks of active or developing
hurricanes, for example, an ensemble of models is
used rather than just relying on one. This allows
for a ‘best estimate’ prediction within a range ofsection 3: approach to assessing recent & future climate change • 13
Model Regions although the lower emissions scenario was not
developed with that specific assumption in mind.
45
However, the scenarios should not be seen as either
a floor or ceiling of possible outcomes. Recent
growth in carbon dioxide emissions exceed the
higher emissions scenario.12 On the other hand, the
emission reduction goals being actively discussed
42
internationally, i.e. reductions of 60-80% by 2050,
would, if implemented, reduce emissions more and
result in less warming than the lower emissions
Latitude
scenario. Although the IPCC intends to use several
39
specific emissions mitigation scenarios in its next
assessment, projections do not yet exist for such
scenarios.
While carbon dioxide emissions for the two
36
scenarios begin to diverge significantly around
2025 and decline in the low emissions scenario after
2050 (Figure 3.3), the cumulative emissions begin to
Chesapeake Watershed region diverge only after 2040. Because carbon dioxide is
33 Maryland region
Chesapeake Bay (sea level) region retained in the atmosphere for a long time, the full
effects of this divergence are not fully manifest until
-84 -81 -78 -75 -72 late in the century. Thus, in the model projections,
Longitude
Figure 3.2. Surface air temperature for one of the climate models,
showing the number of grid cells covering Maryland, and also the Carbon Dioxide Emissions
averaging regions employed for this assessment. 35 higher emissions scenario
lower emissions scenario
30
Emission Scenarios
Metric Tons of Carbon
25
(billions)
20
A critical objective of this assessment was to
compare future climate impacts under the situation 15
in which greenhouse gas emissions continue to grow 10
throughout the 21st century with the situation that
5
might be realized if global action was taken to reduce
greenhouse gas emissions. A similar approach was 0
1980 2000 2020 2040 2060 2080 2100
used in the Northeast Assessment. Two plausible Year
global emissions scenarios were selected from
among those used by the IPCC assessments. Cumulative Carbon Dioxide Emissions
The higher emissions (A2) scenario assumes a 2000
heterogeneous world, with locally self-reliant higher emissions scenario
lower emissions scenario
response to climate change, regional technological 1600
Metric Tons of Carbon
and economic development, and faster growing
population. The even higher emission, A1Fi, 1200
(billions)
scenario used in the Northeast Assessment was
not used because of the limited archived output 800
available for this scenario. The lower emissions
(B1) scenario assumes slower population growth, 400
clean technologies are developed and implemented
0
globally, and there is a general emphasis on global 1980 2000 2020 2040 2060 2080 2100
solutions to economic and environmental issues. Year
These scenarios can be viewed representing Figure 3.3. Top: Carbon dioxide annual emissions for the low
the ‘business as usual’ response to climate change and high emissions trajectories. Bottom: Total carbon dioxide
versus sustained emissions reduction strategy, emissions summed from 1990 to 2100.14 • global warming and the free state: comprehensive assessment of climate change impacts in maryland
Terms Used to Express Judgement of Likelihood
very about as likely very
unlikely unlikely as not likely likely
0% 50% 100%
Figure 3.4. Terms used in this assessment to communicate
judgment of likelihood.
Wikipedia Commons
ABRUPT CLIMATE CHANGE
Finally, a word of caution is offered about the use
of climate model projections in planning for future
Smog hangs over a Baltimore highway clogged with traffic.
climate conditions. There is greater confidence
regarding some variables (such as global and
there is often little difference between the higher regional temperature) than others (such as regional
and lower emissions scenarios until after 2050 and precipitation). Some variables (such as soil moisture
the differences increase thereafter. or stream flow) result from the complex interplay of
temperature, water, carbon dioxide concentrations,
Confidence and living organisms, making them difficult to model
with great reliability. Still others will be influenced
The spread in model predictions is one indication by processes that may dramatically change and thus
of how well the underlying physics and feedbacks of are inherently challenging for scientists to predict
climate processes are represented. The hydrological (such as the contribution of future polar ice sheet
cycle, for example, is less well represented than melting to sea-level rise).
temperature in all of the climate models because Because of the way they are constructed, climate
coarse spatial resolution of models precludes a good models can be used to assess gradual trends
representation of the physics involved in evaporating, averaged over decades. They are, at this point in their
transporting, and precipitating water. As a result, development, less reliable as a signal of more abrupt
we have high confidence in temperature projections climate changes. Various records of past climate
for which the physical processes represented in the changes, including deep sea sediments, ice cores, tree
model are better understood, moderate confidence rings, and other natural recorders, indicate that they
in trends in temperature extremes, moderate have often taken place within a fairly short period of
confidence in directional changes in precipitation time, within a century or even a decade. Scientists
and other hydrological variables, and relatively low are actively conducting research on the causes and
confidence in model projections of precipitation consequences of such abrupt climate changes, but
extremes at this scale. few attempts have been made to model them under
The spread of model projections for a given future global warming conditions. For the purpose
parameter is used to assess the likelihood of the of this assessment, it is simply important to keep in
projected outcome. Throughout this report, the mind that the changes that will take place during
characterization of likelihood of both trends in this century may be more ‘jerky’ than continuous,
observations and certainty of projections has with trends reversing for some years and advancing
followed with the IPCC assessments, except more dramatically over the period of just a decade.
without the discrete probabilities assigned by the This places a challenge both for our observations of
IPCC (Figure 3.4). Similar to the assessment of trends and for our ability to adapt quickly.
weather and climate extremes by the U.S. Climate
Change Science Program13, this approach allows
the communication of the level of certainty that is
consistent throughout the report.section 4: recent & likely climate changes in maryland • 15
recent & likely climate changes in maryland
key points
Climatic regimes will continue to vary across Maryland.
Section 4
Western Maryland has cooler winters and summers and less precipitation during the winter than the rest of the
state. Changes will occur on top of these regional differences, perhaps with some greater warming during the
summer to the west than on the Eastern Shore.
Temperature is projected to increase substantially, especially under higher emissions.
Average temperature is projected to increase by about 3°F by mid-century and is likely unavoidable. The amount
of warming later in the century is dependent on the mitigation of greenhouse gas emissions, with summer
temperatures projected to increase by as much 9°F, and heat waves extending throughout most summers.
Precipitation is projected to increase during the winter, but become more episodic.
Projections of precipitation are much less certain than for temperature, but modest increases are more likely in
the winter and spring. Because of more intermittent rainfall and increased evaporation with warmer temperatures,
droughts lasting several weeks are projected to be more likely during the summer.
the Context
T
he state of Maryland, although comprising increase in the mean annual temperature of 2°F. No
only 12,303 square miles, spans diverse weather stations show a temperature decrease. This is
geographic and climatic zones, from significantly more warming than the global average.2
the flat Coastal Plain, westward to the Piedmont The rainfall differences across the state are much
foothills, and the Appalachian Plateau. Well-defined smaller, with Maryland having little seasonality in
seasons divide the cool, northwesterly wind- rainfall; consequentially, most agriculture relies
dominated, dormant season for plant growth from on precipitation rather than irrigation (see Section
the warm summers with southwesterly winds and 6). Precipitation is highly variable from year to
high humidity in the coastal regions. Spring and fall year, and no clear trend emerges from the stations
are highly variable with weather changing almost in Maryland, although significant increases in
daily as warm and cool fronts push through mainly precipitation have been documented to the north.
from the west. Although Maryland lies south of the
main winter cyclone track, the influence of these
storms can affect winter climate. Storms originating
in the south or coastal regions (Nor’easters) also
play a role in destructive winter weather, as they are
accompanied by large amounts of rainfall and high
tides. Hurricanes and tropical storms, although
infrequent with only eight storms affecting Maryland
since 1954, also can have a destructive influence
on Maryland Coastal Plain regions in particular,
primarily through flooding and storm surge.
Figure 4.1 illustrates the seasonal range of
Adrian Jones
temperature across Maryland. While the higher
elevations to the west remain cooler in both winter
and summer, the rate of temperature increase from Winter wheat is sometimes planted in a mix with cool-season
1977 to 1999, is similar across the state, with an clovers or field peas to suppress weeds and prevent soil erosion.16 • global warming and the free state: comprehensive assessment of climate change impacts in maryland
Physiographic Regions of Maryland projected temperature increases. On a global scale,
F
L temperature increases are generally expected to be
Valley
greater in the Northern Hemisphere, particularly
Appalachian & Ridge Piedmont
toward the Arctic regions.2 Maryland, therefore, will
Plateau Blue
Ridge not warm by as many degrees as the New England
states.7 Nonetheless, Maryland will experience
significant warming in the coming decades and
Coastal Plain
century (Figure 4.2).
The climate model mean projects an additional 2°F
of warming by 2025, regardless of which emissions
scenario is followed. By 2050, the policy decisions
0 50 miles
applying to which emissions path is followed
N
begin to have an effect, and a difference in winter
versus summer warming also emerges. The lower
80 250 emissions scenario warms slightly less by 2050, with
summertime temperature increases of nearly 3°F.
SUMMER
Temperature under the higher emissions scenario
Daily temperature
200
60 begins to increase sharply after mid-century, with
summertime seeing somewhat greater warming
Days
(° F)
150
than winter.
40
100 By the end of the century, the difference between
WINTER
the higher and lower emissions scenario is marked.
20 50 The low emissions path has held temperature
Appalachian Piedmont Coastal Plain increase to 4.8°F in summer,
Plateau and 4°F in winter, while the Under higher
4 40
higher emissions scenario
SUMMER
emissions, summers are
leads to warming of nearly 9°F
in summer and 7°F in winter in projected to be nearly
30
(inches/month)
Precipitation
Maryland. One would expect 9°F hotter by end of
Days
3 20
these increases to be above the century
WINTER
current mean temperatures
10
for the three regions of the state as shown in Figure
2
4.1. Summertime average (over both night and day)
0
Appalachian Piedmont Coastal Plain temperatures in the Coastal Plain would increase
Plateau from 77°F to 86°F by the end of the century under
the higher emissions scenario. However, an ongoing
frost days growing days >90° days
national assessment has produced statistically
Figure 4.1. Top: The five physiogeographic regions of Maryland.
Middle: Temperatures range seasonally across Maryland, with 10
summer
the elevated, inland regions to the west remaining cooler in both winter
Temperature Anomaly (ºF)
winter and summer and experiencing a shorter growing season. 8 high
Bottom: The precipitation differences across the state are modest, emissions
except in winter, when it is lower on the Appalachian Plateau. The
average number of days with temperatures greater than 90°F is 6
much lower in the Appalachian Plateau.13 low
4 emissions
Temperature 2
0
Human-induced climate change is most directly 2000 2020 2040 2060 2080 2100
linked to global temperature rise. However, Year
atmospheric circulation, interactions of climate Figure 4.2. Temperature increase (°F) for Maryland from 1990 to
with land surfaces and oceans, and other factors the year 2100. The shaded regions depict the 25th-75th percentile
drive patterns of heating and cooling that affect the spread between all the models.You can also read