Winners and Losers: Climate Change Impacts on Biodiversity in Ireland - Climate Change Research Programme (CCRP) 2007-2013 Report Series No. 19
←
→
Page content transcription
If your browser does not render page correctly, please read the page content below
Climate Change Research Programme (CCRP) 2007-2013
Report Series No. 19

                         Winners and Losers:
                         Climate Change Impacts
                         on Biodiversity in Ireland

                                      Comhshaol, Pobal agus Rialtas Áitiúil
                                      Environment, Community and Local Government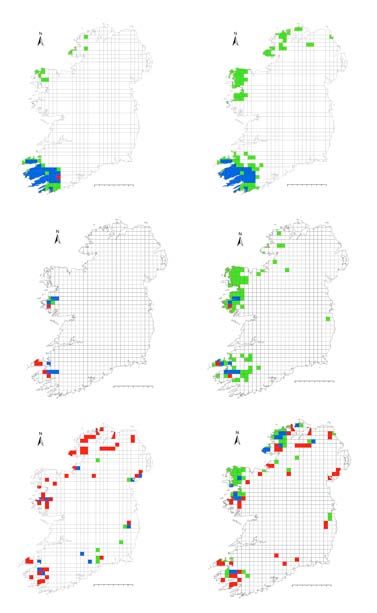
Environmental Protection Agency
The Environmental Protection Agency (EPA) is                REGULATING IRELAND’S GREENHOUSE GAS EMISSIONS
a statutory body responsible for protecting                 n Quantifying Ireland’s emissions of greenhouse gases
the environment in Ireland. We regulate and                   in the context of our Kyoto commitments.
police activities that might otherwise cause                n Implementing the Emissions Trading Directive,
pollution. We ensure there is solid                           involving over 100 companies who are major
                                                              generators of carbon dioxide in Ireland.
information on environmental trends so that
necessary actions are taken. Our priorities are
protecting the Irish environment and                        ENVIRONMENTAL RESEARCH AND DEVELOPMENT
ensuring that development is sustainable.                   n Co-ordinating research on environmental issues
                                                              (including air and water quality, climate change,
The EPA is an independent public body                         biodiversity, environmental technologies).
established in July 1993 under the
Environmental Protection Agency Act, 1992.                  STRATEGIC ENVIRONMENTAL ASSESSMENT
Its sponsor in Government is the Department
                                                            n Assessing the impact of plans and programmes on
of the Environment, Community and Local                       the Irish environment (such as waste management
Government.                                                   and development plans).

                                                            ENVIRONMENTAL PLANNING, EDUCATION AND
OUR RESPONSIBILITIES                                        GUIDANCE
                                                            n Providing guidance to the public and to industry on
LICENSING                                                     various environmental topics (including licence
We license the following to ensure that their emissions       applications, waste prevention and environmental
do not endanger human health or harm the environment:         regulations).
                                                            n Generating greater environmental awareness
n waste facilities (e.g., landfills, incinerators,            (through environmental television programmes and
  waste transfer stations);                                   primary and secondary schools’ resource packs).
n large scale industrial activities (e.g., pharmaceutical
  manufacturing, cement manufacturing, power
  plants);                                                  PROACTIVE WASTE MANAGEMENT

n intensive agriculture;                                    n Promoting waste prevention and minimisation
n the contained use and controlled release of                 projects through the co-ordination of the National
  Genetically Modified Organisms (GMOs);                      Waste Prevention Programme, including input into
                                                              the implementation of Producer Responsibility
n large petrol storage facilities;                            Initiatives.
n waste water discharges.                                   n Enforcing Regulations such as Waste Electrical and
                                                              Electronic Equipment (WEEE) and Restriction of
NATIONAL ENVIRONMENTAL ENFORCEMENT                            Hazardous Substances (RoHS) and substances that
                                                              deplete the ozone layer.
n Conducting over 2,000 audits and inspections of
  EPA licensed facilities every year.                       n Developing a National Hazardous Waste Management
                                                              Plan to prevent and manage hazardous waste.
n Overseeing local authorities’ environmental
  protection responsibilities in the areas of - air,
  noise, waste, waste-water and water quality.              MANAGEMENT AND STRUCTURE OF THE EPA
n Working with local authorities and the Gardaí to          The organisation is managed by a full time Board,
  stamp out illegal waste activity by co-ordinating a       consisting of a Director General and four Directors.
  national enforcement network, targeting offenders,
  conducting investigations and overseeing
  remediation.                                              The work of the EPA is carried out across four offices:

n Prosecuting those who flout environmental law and         n Office of Climate, Licensing and Resource Use
  damage the environment as a result of their actions.      n Office of Environmental Enforcement
                                                            n Office of Environmental Assessment
MONITORING, ANALYSING AND REPORTING ON THE                  n Office of Communications and Corporate Services
ENVIRONMENT
n Monitoring air quality and the quality of rivers,         The EPA is assisted by an Advisory Committee of twelve
  lakes, tidal waters and ground waters; measuring          members who meet several times a year to discuss
  water levels and river flows.                             issues of concern and offer advice to the Board.
n Independent reporting to inform decision making by
  national and local government.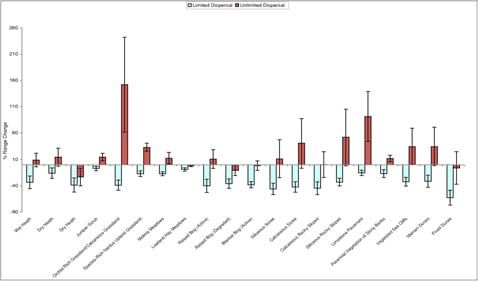
EPA Climate Change Research Programme 2007–2013

Winners and Losers: Climate Change Impacts on
                     Biodiversity in Ireland

Climate Change Impacts on Biodiversity in Ireland: Projecting
         Changes and Informing Adaptation Measures

                            CCRP Report

                Prepared for the Environmental Protection Agency

                                       by

     The Irish Climate Analysis and Research Units, Department of Geography,
                     National University of Ireland Maynooth
                                       and
  Department of Botany and Plant Science, National University of Ireland, Galway

                                    Authors:

   John Coll, David Bourke, Michael Gormally, Micheline Sheehy Skeffington
                               and John Sweeney

                ENVIRONMENTAL PROTECTION AGENCY
                 An Ghníomhaireacht um Chaomhnú Comhshaoil
               PO Box 3000, Johnstown Castle, Co. Wexford, Ireland

                Telephone: +353 53 916 0600 Fax: +353 53 916 0699
                     Email: info@epa.ie Website: www.epa.ie
© Environmental Protection Agency 2012
DISCLAIMER
Although every effort has been made to ensure the accuracy of the material contained in this
publication, complete accuracy cannot be guaranteed. Neither the Environmental Protection Agency
nor the author(s) accept any responsibility whatsoever for loss or damage occasioned or claimed to
have been occasioned, in part or in full, as a consequence of any person acting, or refraining from
acting, as a result of a matter contained in this publication. All or part of this publication may be
reproduced without further permission, provided the source is acknowledged.
The EPA Climate Change Research Programme addresses the need for research in Ireland to inform
policymakers and other stakeholders on a range of questions in relation to environmental protection.
These reports are intended as contributions to the necessary debate on the protection of the
environment.
EPA CLIMATE CHANGE RESEARCH PROGRAMME 2007–2013
Published by the Environmental Protection Agency, Ireland
ISBN: 978-1-84095-454-8
Online version
iiACKNOWLEDGEMENTS
This report is published as part of the Climate Change Research Programme 2007–2013. The
programme is financed by the Irish Government under the National Development Plan 2007–2013. It
is administered on behalf of the Department of the Environment, Community and Local Government
by the Environmental Protection Agency which has the statutory function of co-ordinating and
promoting environmental research.
The authors would like to thank the technical and scientific support staff at the National Parks and
Wildlife Service (NPWS) (Ireland) for supplying the GIS habitat maps for Irish priority habitats and
species, Graham French at the National Biodiversity Network (UK) for supplying the GIS-enabled
Irish Grid data and Steve Wilkinson at the Joint Nature Conservancy Council (UK) for the priority
habitats and species database containing the Northern Ireland records. They also thank Ray McGrath
and Tido Semmler at Met Éireann for providing the C4i climate data. John Coll would like to thank
his ICARUS colleagues Rod Teck and Colin Holman for their input in processing the climate change
data and Adam Ralph and Satish Bastola for their helpful discussions on some of the statistical
elements of the modelling. David Bourke would like to thank Dr Pam Berry (University of Oxford)
and Dr Jesse O’Hanley (University of Kent); his colleagues in the Applied Ecology Unit and
Department of Botany, in particular, Dr Rory McDonnell, Mr Rory Hodd, and Dr Caroline Sullivan
(all from National University of Ireland, Galway); Ms Florence Hecq (Trinity College Dublin); and
Dr Brian McConnell (Geological Survey of Ireland). Without their goodwill and support, progress in
the methods developed here for Ireland would not have been possible.
Finally, thanks are due to the project Steering Committee for its ongoing input and support over the
life of the project, and to the anonymous external reviewer for providing valuable advice on
improving earlier versions of this report.
This research was supported by the Irish Environmental Protection Agency under grant 2007-CCRP-
2.26.
iiiDetails of Project Partners
Dr John Coll Prof. John Sweeney
Irish Climate Analysis and Research Units Irish Climate Analysis and Research Units
Department of Geography Department of Geography
National University of Ireland National University of Ireland Maynooth
Maynooth Maynooth
Ireland Ireland
Tel.:+353 1 7086550 Tel.:+353 1 7086835
Email: john.coll@nuim.ie Email: john.sweeney@nuim.ie
Dr David Bourke Dr Michael Gormally
Applied Ecology Unit Applied Ecology Unit
Centre for Environmental Science, and Centre for Environmental Science
Department of Botany and Plant Science Department of Botany and Plant Science
National University of Ireland National University of Ireland
Galway Galway
Ireland Ireland
Email: bourkedo@tcd.ie Email: mike.gormally@nuigalway.ie
Dr Micheline Sheehy Skeffington
Department of Botany and Plant Science
National University of Ireland
Galway
Ireland
Email: micheline.sheehy@nuigalway.ie
ivTable of Contents
Disclaimer ii
Acknowledgements iii
Details of Project Partners iv
Executive Summary vii
1 Introduction 1
1.1 Observed Changes in Natural Systems 1
1.2 A European Policy and Conservation Context 1
1.3 Reducing Climate Change Impacts on the Biodiversity of Key Protected Areas 2
1.4 Statistical and Bioclimatic Envelope Modelling 3
1.5 Aims and Objectives 3
2 Methodology 5
2.1 Study Area 5
2.2 Climate and Climate Change Data 5
2.3 Priority Species and Habitat Data Sets for Ireland 5
2.4 Species Data and Selection Criteria 6
2.5 The Modelling Grid 6
2.6 Topographic Data 7
2.7 SDM 7
3 Results 8
3.1 Layout Summary 8
3.2 Results (i) 8
3.3 Results (ii) 15
4 Discussion 18
4.1 SDM Performance and Projected Range Changes for Species, Plant Communities
and Habitats 18
4.2 The GLM and GAM Habitat Results in Context 20
4.3 Applying and Extending Probabilistic Projections for Informing Robust Adaptation
Decisions on Habitats 21
4.4 The Habitat Modelling in Context – Wider Synergies of Climate Change Impacts and
Threats to Wetland Systems 22
4.5 Synthesis and Implications for Future Research 23
References 25
Acronyms 31
Appendix 1 33
Appendix 2 34
vExecutive Summary
1 Introduction to the Project 3 Results Summary
The climate envelope modelling described in this 3.1 Species modelling
report represents a staged investigation into the
The predictive accuracies of SDMs based on the area
possible impacts of climate change on the nature
under the curve (AUC) and Cohen’s Kappa
conservation resources of Ireland. It represents a
performance statistics identified species that could be
significant piece of original research applying state-of- modelled successfully using a range of climate and
the-art methods for the first time in Ireland, and is an topographical variables, but also highlighted those
important step in trying to understand the complex species with a poorer predictive performance (due to
interactions between climate, climate change, and the absence of variables crucial to defining their
species and habitats across the island. The work is one distribution, inadequate distribution data, etc.). The
part of the wider research programme Co-ordination, addition of topographical information to basic climate
Communication and Adaptation for Climate Change in variables resulted both in a significant improvement in
Ireland: an Integrated Approach (COCOADAPT) the predictive capacity of the models and in more
realistic spatially mapped model outputs. The
funded by the Environmental Protection Agency
performance of models was shown to vary with the
(EPA).
modelling technique used and the distribution patterns
of these species in Ireland and across Europe. Species
2 The Project in Context belonging to the particularly vulnerable arctic-montane
major biome group showed the greatest increase in
The prediction of climate-change-driven shifts in
model performance.
species and habitat distributions has so far been
dominated by continental-scale studies at a 50 × 50 km
It is projected that many species in Ireland will
grid-scale resolution. Many of these studies exclude
experience significant changes to their ranges under
topographic data and other important ecological future climate scenarios. Species with disjunct and
variables such as geology, and fail to capture the detail narrow distributions are projected to experience the
of distributions at finer scales, with regional and largest range changes, contracting and expanding,
landscape-scale applications essential for aiding respectively. In general, moss, liverwort, and fern
conservation. Such missing data and scale limitations species will experience range contractions, while
contribute to restricting confidence in species angiosperm species will see more variation in their
distribution model (SDM) projections. response, with some angiosperms expanding while
others contract. Species representative of arctic-
In this work, a finer-meshed model grid (10 × 10 km) montane, boreal-montane and boreo-arctic montane
biomes will be most vulnerable to climate change. On
was employed and other important information was
the island of Ireland, these species will not have higher
integrated in the predictive models developed. The
altitudes and latitudes to move to. Plant communities
work demonstrates that by collating some of the
from many of Ireland’s protected habitats are likely to
available database records in a unique way, the
see significant changes in their composition, with
construction and application of more statistically species moving in and out. Although not all species in
sophisticated and machine-based SDMs than have the plant communities of these habitats were
previously been available for Ireland have been made modelled, the following habitats may be the most
possible. vulnerable to climate change impacts:
vii• Upland habitats (siliceous and calcareous scree, • These changes will accelerate in scope and scale
siliceous and calcareous rocky slopes, alpine and in the coming decades due to greenhouse gases
subalpine heath); already in the atmosphere;
• Peatlands (raised bog, blanket bog); and • The scale and extent of changes will continue to
accelerate over longer timescales if greenhouse
• Coastal habitats (fixed dunes – combined with gas emissions continue unabated or increase;
the additional threat of sea-level rise to coastal and
habitats).
• Conservation decisions will have to be made
3.2 Habitats modelling based on longer timescales than has traditionally
The modelling was undertaken within a Generalised been the case.
Linear Modelling (GLM) and Generalised Additive
The ecological impacts associated with climate change
Modelling (GAM) framework, and consensus
will not occur in isolation; rather climate-driven
probabilities were assembled from the best performing
changes will combine with, and exacerbate, existing
models. Climate and topography-based models are
stresses on Ireland’s natural systems. An
presented which skilfully replicate the observed
understanding of those interactions will become
baseline distribution. The results suggest that both
increasingly critical in defining and implementing
GLMs and GAMs applying climatic-based variables
effective conservation measures. As a result,
are useful predictors of active blanket bog and wet
conservation in an era of climate change will require
heath distribution in particular. In general, climate is
that not only are the environmental problems of the
the primary controlling factor in the distribution of the
past acknowledged and addressed, but that those of
habitats, although the inclusion of elevation variables
an increasingly uncertain future are also anticipated
is also an important component in the models. When
and prepared for.
the climate change data are applied to project changes
of climate space for the habitats, the models overall are
4 Specific Recommendations
capturing an altitudinal component of change
superimposed on a latitudinal gradient, although the Based on the results of the project, some Ireland-
specific changes to areas of suitable climate space specific recommendations for the conservation sector
vary for each habitat type. are provided. These are:
1. The Habitats Directive requires regular
3.3 Key messages
assessment and reporting on the conservation
Results here reinforce the strongly emerging global
status of species and habitats listed in the
consensus in conservation science, whereby rapid
Directive’s Annexes I, II, IV, and V. These
climate change is widely considered to be the defining
assessments highlight the main threats to these
conservation issue for this generation. The effects of
species and habitats. Potential climate change
climate change are increasingly apparent from
impacts now need much greater priority in the
evidence-based assessments in countries and
assessment and management of Natura 2000
continents around the globe. These climate-driven
(N2K) sites in Ireland if appropriate actions to
changes will profoundly affect our ability to conserve
protect vulnerable species and habitats are to be
species and the habitats on which they depend.
implemented in time. To date, data concerning
Inherent uncertainties associated with climate change climate change projections have not been
projections underpin any impact assessment. incorporated into these assessments. Future
Nevertheless, the underlying message should remain assessments should ensure that the latest data
clear: and state-of-the-art modelling techniques are
used to project climate change impacts and that
• Widespread changes are already occurring in outputs from these should be used to directly
natural systems and these will continue; inform these assessments and recommendations.
viii2. The composition of plant communities in N2K most likely be necessary to designate some new
sites in the future is likely to be different from sites.
today. A more dynamic approach to habitat
classification and what is deemed to be a high 7. Ireland’s species and habitats currently face a
quality habitat will be required to account for these multitude of threats including land-use change,
changes. The likelihood of occurrence of novel habitat fragmentation and the introduction of non-
species assemblages in the future is high and the native species. The conservation sector will
conservation sector will need to be prepared to increasingly need to consider the cumulative
amend its conservation objectives accordingly. effects of these current pressures in the context of
future impacts of climate change.
3. Species will experience changes in their ranges
(due to changes in areas of suitable climate) in the 8. Some species in the future will not be capable of
future, moving to higher latitudes and altitudes. migrating to new areas of suitable climate and
The maintenance and promotion of connectivity in habitat or adapting to new conditions. If future
the wider landscape and between N2K sites is conservation objectives deem these species to be
vital to ensure that species can reach new areas a priority, then assisted migration (translocation)
of suitable climate space. The creation of green to areas with suitable climate and habitat may be
infrastructure (sustainable landscape necessary to avoid extinction.
management approaches which enable natural
9. It is recommended to focus limited conservation
processes to take place and thereby increase
resources on those species and habitats in Ireland
resilience of ecosystems) will help maintain a
that are most vulnerable. The current research
heterogeneous landscape, facilitating dispersal of
has identified many of these and they are referred
species to these new areas of suitable climate and
to in the report.
habitat.
10. Long-term monitoring and research are central to
4. Restoration of degraded habitats will improve the
the detection and quantification of climate change
extent, integrity and resilience of vulnerable
impacts on Ireland’s vulnerable species and
habitats such as blanket and raised bogs with
habitats and should be integrated as a core part of
knock-on benefits for species dependent on such
management planning at the site level. This
habitats.
monitoring (of species distribution, habitat quality,
5. Given the significant distances between some of etc.) will aid long-term survival of species through
Ireland’s designated sites, the role of well- the identification and rapid implementation of
designed agri-environment measures in non- appropriate conservation management actions.
protected areas (mainly agricultural areas) will be Long-term monitoring will also ensure that current
critical in maintaining heterogeneity and designated sites are effectively protecting the
connectivity in the wider landscape. species and habitats intended, encouraging
limited resources to be used more efficiently.
6. Future biodiversity conservation planning and Monitoring is also critical for improving and
management will require a more dynamic validating model-based projections.
approach to site designation and protection. The
identification of current sites where species will be 11. Future biodiversity modelling requires further
able to persist in the future, sites where species refinement of the techniques used in this study. A
will migrate to in the future, and areas that connect more integrated approach incorporating dispersal
these sites will underpin long-term planning. More models, biotic interactions and land-use change
flexibility in the designated site network than is scenarios is essential to provide more realistic
currently present will be required to achieve range change projections. More research and a
effective planning and management to adapt to retention and extension of the capacity developed
and mitigate the worst of climate change. It will here are needed to ensure that the tools required
ixto provide the conservation sector with the best • Monitoring of biodiversity and evaluation of
projections are available. actions;
As well as considering climate change adaptation, a
• Conservation of genetic and native species
number of other cross-cutting themes need to be
diversity; and
integrated for the strategic management of our natural
capital. These include:
• Socio-economic issues.
• Impacts of non-native species;
A brief synthesis of guiding principles based on current
• The role of biodiversity in ecosystem functioning
knowledge and conservation best practice is also
and ecosystem service provision;
provided (Appendix 1) which complements the specific
• Habitat and ecosystem management; recommendations outlined above.
x1 Introduction
1.1 Observed Changes in Natural (PEBLDS) (Araújo, 2009b). While these terrestrial
Systems protected areas in Europe may act as buffers against
climate change, the protected areas network is likely to
Globally, there is evidence that species are shifting
be no more effective in retaining suitable climate
their ranges in response to changes in regional
conditions for Habitats Directive species than the
climates (Fischlin et al., 2007), that species are altering
surrounding landscape (Araújo, 2009b). However, the
their phenology (Jones et al., 2006; Fischlin et al.,
extent to which European conservation areas are
2007; Donnelly et al., 2008), and that some species are
effective in protecting biodiversity is subject to ongoing
facing extinction, or have become extinct (Fischlin et
research (e.g. Dimitrakopoulos et al., 2004; Gaston et
al., 2007). Further evidence of climate change impacts
al. 2006; Araújo et al., 2007; Maiorano et al., 2007;
includes changes in species altitudinal and
Jackson et al., 2009).
geographical ranges (Fischlin et al., 2007) and
changes to population density, community structure, Addressing data gaps and the more streamlined
species genetics and evolution (Fischlin et al., 2007). integration of data in spatial planning is a key
Therefore, developing effective adaptation strategies component in informing and implementing the current
to offset the climate change threats to species European Commission (EC) Biodiversity Strategy and
persistence will be critical in maintaining species and Biodiversity Action Plan (BAP) and its proposed follow-
genetic diversity (Thuiller et al., 2008). up actions. Recent commitments from the EC also
emphasise the close inter-relationship between
1.2 A European Policy and Conservation climate change and biodiversity and the need for an
Context integrated approach to policy development. Crucially
The changing relationship between biodiversity and however, decisions have to be underpinned by the
climate has profound implications for the economic best available science. There is also recognition that
and social well-being of all countries, and maintaining the ecological impacts associated with climate change
healthy ecosystems will buffer against some of the do not exist in isolation, but combine with and
impacts of climate change. However, species– exacerbate existing stresses on natural systems.
environment relationships are complex and more Understanding those interactions is critical for
information on these linkages is needed to inform designing effective conservation measures.
spatial planning policy for climate change adaptation.
A major challenge is to enhance the coherence of the
There is widespread recognition that protected area
N2K network via extended habitat networks and
networks such as the Natura 2000 (N2K) network will
linkages to increase the overall spatial coverage of
become increasingly important refuges for habitats
natural and semi-natural habitats (Gaston et al., 2008).
and species in a warming climate.
Measures proposed to increase resilience include
Europe has the world’s most extensive network of plans to expand protected areas, maintain varied and
conservation areas; however, historically, sites have functional ecosystems, and preserve habitat quality
been selected without taking into account the effects of (Hopkins et al., 2007; Mitchell et al., 2007), as well as
climate change (Araújo et al., 2011). The Emerald planning on the basis of the functional connectivity of
Network extends the N2K network and allows for habitats rather than simple structural connectivity. This
implementation of its principles beyond the European can be considered as a form of anticipatory adaptation,
Union (EU). The N2K and the Emerald networks are since, as climatic conditions become unsuitable, a
the two major instruments of the Pan-European species either adapts to and tolerates the changes to
Ecological Network (PEEN), promoted under the Pan- its environment, moves its range to track suitable
European Biological and Landscape Diversity Strategy climate, or faces a high extinction risk (Jump and
1Winners and losers: climate change impacts on biodiversity in Ireland
Peñualas, 2003; Engler et al., 2009). Even species not where species are able to find suitable habitats
directly affected by a changed climate may not be able after they have been displaced by climate change
to compete with species whose expansion is facilitated from their original location. Typically these are
by it (Engler et al., 2011). areas at the leading edge of species ranges and
their distribution can be inferred using bioclimatic
Indications are that protected areas are expected to envelope models (e.g. Levinsky et al., 2007;
retain climatic suitability for species better than Huntley et al., 2008).
unprotected areas, but in fact N2K areas retain climate
suitability for species no better and sometimes less 3. The third category comprises regions of high
effectively than unprotected areas (Araújo et al., 2011). connectivity that allow species to track climate
Compounding all of these challenges, uncertainty is changes through dispersal. This has been
perhaps the single most characteristic facet of a extensively explored, and some work has begun
climate scenario, and is one that climate science to develop quantitative approaches for
continues to come to terms with (Morgan et al., 2009). identification of dispersal routes between
Consequently, in any impact assessment, it must protected areas under climate change (e.g.
remain as a compounding and underlying element, Williams et al., 2005; Phillips et al., 2008; Vos et
even if not explored in further detail here. Nonetheless, al., 2008). However, it must be remembered that
the underlying message should be clear – widespread species dispersal ability can vary considerably.
changes are already occurring which will continue and
accelerate in scope and scale in the next few decades Any policy initiatives geared to mitigating climate
due to greenhouse gases already in the atmosphere.
change impacts on biodiversity need to identify and
They will also expand over longer time horizons if
manage these three types of areas. However, in the
greenhouse gas emissions continue unabated.
fragmented landscapes of Ireland there are few
Therefore, conservation decisions will have to be
remaining areas of stationary refugia and, hence,
made based on longer timescales (e.g. over several
policy initiatives will have to focus on the latter two
decades) than has traditionally been the case.
options. Therefore, concerted efforts are required to
integrate protected areas into wider landscapes,
1.3 Reducing Climate Change Impacts seascapes and sectors through the use of connectivity
on the Biodiversity of Key Protected measures such as the development of ecological
Areas
networks and ecological corridors. Similarly, the
Despite knowledge gaps and uncertainty in relation to restoration of degraded habitats and landscapes is
conservation planning under a changing climate, a required to address climate change impacts and
number of general habitat types can be identified as increase resilience to climate change.
key areas for intervention:
In order to ensure that biodiversity projects take more
1. The first category is that of stationary refugia, or explicit account of the impacts of climate change, six
range retention areas, identified as regions where guiding principles have been identified for UK
species are most likely to survive despite climate conservation practice (Hopkins et al., 2007), based on
changes. Such stationary refugia escape the a wider international consensus. These principles
more dramatic climate changes, maintaining factor in sound conservation practice aimed at
climate variation within the range of tolerance of ensuring the best possible outcome in the face of
most species and, hence, allow species to persist limited knowledge and the imponderable future effects
through short-distance dispersal (e.g. Newton, of climate change. Given the analogous
2003; Araújo, 2009). biogeographical and landscape contexts of both
countries, these are also largely relevant to Ireland
2. The second category is that of displaced refugia, (see Box 2 of Hopkins et al., 2007).
2J. Coll et al. (2007-CCRP-2.6 COCOADAPT)
1.4 Statistical and Bioclimatic Envelope Franklin, 2009). In particular, the predictive
Modelling performance of the models has been shown to vary
with the modelling technique used (Heikkinen et al.,
Various modelling approaches have been developed
2006; Syphard and Franklin, 2009; Virkkala et al.,
to convert observations of species at point locations
2010), geographic distribution (Marmion et al., 2008),
into predictive maps (see, e.g., Table 2 in Coll et al.,
species traits (Syphard and Franklin, 2009; Hanspach
2011). These have been extensively reviewed (e.g.
et al., 2010), and the environmental information
Araújo and Guisan 2006; Heikkinen et al. 2006; Elith
included (Syphard and Franklin, 2009; Ashcroft et al.,
and Leathwick, 2009). Bioclimatic envelope models
2010; Virkkala et al., 2010). Nevertheless, a number of
(BEMs) can be considered as a special case of niche-
studies show that the inclusion of topographical
based models or species distribution models (SDMs)
variables has the potential to increase the accuracy
(Guisan and Zimmermann, 2000; Austin, 2002; Guisan
(Luoto and Heikkinen, 2008; Trivedi et al., 2008;
and Thuiller, 2005; Heikkinen et al., 2006). SDMs
Virkalla et al., 2010). A schematic representation of the
correlate current species distributions with climate and
approach adopted here is provided in Fig. 1.1 overleaf.
environmental variables, which then can be used to
project spatial shifts in species climatic envelopes 1.5 Aims and Objectives
according to selected climate change scenarios (e.g.
Specific aims and objectives include:
Thuiller et al., 2005; Huntley et al., 2008). However,
developing reliable applications of SDMs requires • To apply state-of-the-art SDMs to project possible
considerable knowledge of the factors influencing the future changes in the range of elements of
accuracy of model predictions (Heikkinen et al., 2006). Ireland’s biodiversity due to climate change and
to assess the performance of a range of
The limitations of SDMs are recognised and largely
modelling techniques when topographical
derive from their static correlative nature; however,
variables are added. A similar range of
they are easy to use. A fundamental issue for the
techniques is also applied to a number of priority
application of SDMs in the context of vulnerability
habitats using a modified approach to model
analysis is that they can only give information about
construction and evaluation.
exposure to climate stress, not sensitivity (House et al.,
2010). In other words, SDMs do not provide any • To project changes in the distribution of climate
process information or information on feedbacks within space associated with a range of species and
ecosystems once the climate becomes unsuitable. habitats of conservation interest in Ireland under
Nonetheless, SDMs can provide a valuable first projected future climate change, and to assess
approximation of climate change impacts at broad the potential implications for plant communities
geographic scales where climate is the primary associated with habitats protected under the
constraint on the distribution (Pearson and Dawson, Habitats Directive.
2003; Heikkinen et al., 2006; Ellis et al., 2007).
• To discuss the results of these model projections
These and related issues for the SDMs applied here in the context of the future conservation
are explored throughout the remainder of this report in management of Ireland’s protected habitats and
an Ireland-specific context. However, it should be the implications for climate change adaptation
borne in mind that many factors other than climate strategies, as well as to identify refinements for
influence the distribution of species (Hampe, 2004; future work.
3Winners and losers: climate change impacts on biodiversity in Ireland
Ecological and
Presence–absence or Candidate variables: multicollinearity
biogeographical
Presence only? Resolution 10 km2
theory
(e.g. niche concept)
Biodiversity
distribution data: 274 Environmental data:
species, 19 habitats. Baseline climate data
Sources – National Species distribution/abundance = F (light, (1961–1990), Climate
Biodiversity Network, temperature, nutrients, water, CO2,
change data (IPCC A1B
disturbance, biota)
Gateway, NPWS, NBDC Scenario, HadCM3
GCM), Topography DEM
Modelling framework:
Evaluation (1) Neural ensembles – Artificial Neural Projections – current
(AUC, Kappa, TSS) Networks distribution
(2) BIOMOD – Generalised Linear Models,
Generalised Boosting Method,
Generalised Additive Models, Classification
Tree Analysis, Artificial Neural Networks, Projections – future
Cross-validation Multivariate Adaptive Regression Splines, distribution (% range
(70–30% split) changes)
Random Forest
Ensemble Forecasting
Unlimited v Limited Dispersal
Mapped outputs:
GIS (ArcView 9.3)
Figure 1.1. Conceptual framework outlining the key components of species distribution modelling.
Biogeographical and ecological theory and concepts underpin the approach and identify the
characteristics of species and environmental data required for calibration which can then be applied to
produce a map of predicted and projected species distribution using climate data (adapted from Franklin,
2009). NPWS, National Parks and Wildlife Service; NBDC, National Biodiversity Data Centre; AUC, area
under the curve; IPCC, Intergovernmental Panel on Climate Change; HadCM3, Hadley Centre Coupled
Model, vers. 3; GCM, Global Climate Model; DEM, digital elevation model.
4J. Coll et al. (2007-CCRP-2.6 COCOADAPT)
2 Methodology
2.1 Study Area Met Éireann provided data from the HadCM3L GCM
dynamically downscaled via the high resolution limited
The study area covers ca 84,421 km2, with altitudes
area model (HIRLAM) and the regional atmospheric
ranging from sea level to 1,038 m a.s.l. (Corrán
model (RCA3), which was part of Ireland’s contribution
Tuathail, Co. Kerry). Much of the island is lowland,
to ENSEMBLES (McGrath and Lynch, 2008). The
partly surrounded by mountains, with a characteristic
model output employed was from an A1B Emission
temperate oceanic climate. Mean monthly
Scenario at a horizontal resolution of 14 km and this
temperatures range from 6–6.5°C in January to 15–
was processed in-house to yield new outputs at 10 km
15.5°C in July (Rohan, 1986). On average, annual
resolution.
precipitation totals range between 750 mm and 1,000
mm in the drier eastern half of the country, compared
As part of the A1 storyline and scenario family, the A1B
with more than 3,000 mm per year in parts of the
(Balanced) storyline describes a future world of very
western mountains.
rapid economic growth, low population growth, and the
rapid introduction of new and more efficient
2.2 Climate and Climate Change Data
technologies. Major underlying themes are
2.2.1 1961–1990 Baseline climate data convergence among regions, capacity building and
A quality-controlled gridded data set of 1961–1990 increased cultural and social interactions, with a
climate data was used to construct the predictive substantial reduction in regional differences in per
models for the baseline period. These 10 × 10 km capita income (IPCC, 2007).
resolution data are derived from monthly climate data
for 560 precipitation stations and 70 temperature 2.3 Priority Species and Habitat Data
stations interpolated via polynomial regression with an Sets for Ireland
inbuilt adjustment for elevation (Sweeney and Fealy,
2002, 2003; Fealy and Sweeney, 2007). Variables Data on the distribution of all Annex I (Habitats
used included mean, minimum and maximum monthly Directive) priority habitats and species on a 10 × 10 km
temperatures, and mean monthly precipitation; derived grid were provided by the National Parks and Wildlife
bioclimatic variables used included, for example, net Service (NPWS). The NPWS maps are based on a
annual rainfall, mean winter temperature, and combination of habitat and species distribution maps
continentality index (Appendix Table 1 of the End of and are supported by NPWS surveys (NPWS, 2008).
Project Report). Though these are to some degree incomplete and
none fully depict the national resource of habitats and
2.2.2 Climate change data species (NPWS, 2008), data of this resolution are
The ENSEMBLES project provides state-of-the-art appropriate for the modelling undertaken in the current
climate change information and aims to quantify and study. The NPWS data were complemented by data
reduce the uncertainty in regional climate change for Northern Ireland (NI) Annex I reporting for priority
projections (Van der Linden and Mitchell, 2009). This habitats and species from the Joint Nature
approach recognises that reliance on the output from a Conservancy Council (JNCC) (JNCC, 2007) database.
single Global Climate Model (GCM) leaves significant This work is the first to bring together these combined
potential for gross under or overestimation of the data for developing a predictive modelling capacity.
associated risks, which may result in poor decision Also, as these data sources are national repositories,
making and increase the risk of maladaptation (Fealy, they are highly reliable and the geo-referencing of the
2010). data is likely to be excellent.
5Winners and losers: climate change impacts on biodiversity in Ireland
2.4 Species Data and Selection Criteria categories, including major taxonomic groups, plant
taxonomic groups, distribution and biogeographical
In total, 274 species and 19 habitats were modelled
elements (Table 2.1). The biogeographical element
(Appendix Tables 2 and 3 of the End of Project
was divided into major biome and eastern limit
Report). Species and habitats are either currently
categories after Hill et al. (2004) for vascular plants and
protected by the Habitats Directive in Ireland or are
Hill et al. (2007) for bryophytes. Species data were
plant species listed as characteristic of plant
largely obtained from the National Biodiversity Network
communities across a range of terrestrial habitats
(NBN) Gateway (NBN Gateway, 2008), while data for
protected under the Habitats Directive (Appendix
bryophytes were obtained from the NPWS (NPWS,
Table 3 of the End of Project Report). No data were
2010).
sourced or used for the broader distribution of the
species and habitat types outside Ireland (e.g. Europe,
Asia, or North America). It is recognised that it would 2.5 The Modelling Grid
be better modelling practice to include data from these
The NBN provided the 10 × 10 km grid which was
wider distributions, as Ireland is likely to encompass
developed in partnership with the JNCC. This provided
only a small range of the species tolerances for
a framework to reference the climate and climate
particular variables. It is also recognised that adding
change data to the same grid as the biological and
such data is likely to considerably improve some of the
environmental data. Presence (1) and absence (0)
model test statistics. However, the added expense and
matrices were constructed for the species and habitats
effort of including such wider distribution data were
of interest from the relevant data records and
beyond the resources available to the project.
referenced to the other information. Grid-based
Nevertheless, it is recognised that this is an area where
applications have become near-universal as they allow
there is room for improvement were further funding
the construction of models bringing together different
available to future projects.
tiers of climatic and environmental information.
Vascular plants and bryophytes accounted for the bulk However, most SDM projections are based on
of the species modelled: 213 and 56, respectively. continental-scale studies at a 50 × 50 km resolution.
Data for the Irish fauna were either less reliable (e.g. The COCOADAPT work, therefore, represents a finer-
under-recorded), unavailable or otherwise unsuitable. scaled approach using climate and elevation variables
Species were also grouped according to other at a more regionally relevant scale.
Table 2.1. Modelling results are aggregated ecologically according to selected categories, including major
taxonomic groups, plant taxonomic groups, distribution in Ireland and biogeographical element (number
of species belonging to each group is shown in parentheses).
Taxon Plants Distribution Biogeographic element
Major biome Eastern limit
Vascular plant (213) Angiosperm (202) Wide (151) Arctic-montane (23) Hyperoceanic (12)
Bryophyte (56) Liverwort (16) Narrow (57) Boreo-arctic montane (14) Oceanic (41)
Invertebrate (1) Moss (40) Disjunct (74) Wide-boreal (17) Suboceanic (24)
Mammal (1) Fern (7) Intermediate (11) Boreal-montane (30) European (70)
Lichen (3) Clubmoss (4) Boreo-temperate (59) Eurosiberian (34)
Lichen (3) Wide-temperate (7) Eurasian (14)
Temperate (69) Circumpolar (70)
Southern temperate (27)
Mediterranean-Atlantic (19)
6J. Coll et al. (2007-CCRP-2.6 COCOADAPT)
2.6 Topographic Data steps in statistical modelling which guided the
approach taken:
To produce the topographic data, the range in
elevation variables was calculated for each grid cell 1. Conceptual model formulation;
from a global digital elevation model (DEM)
(GTOPO30) with a horizontal grid spacing of 30 arc s 2. Statistical model formulation;
(approximately 1 km). Mean, maximum and minimum
3. Calibration (fitting or estimation); and
elevations were also derived from the DEM and the
data referenced to the climatic data sets. Further 4. Evaluation.
topographical variables were extracted according to
the habitat and ecological factors deemed specific to 2.7.2 Predictor variable selection and data
the species. These included area greater than 350 m, splitting
area greater than 500 m, mean slope, area occupied A wide range of climatic and topographic variables was
by aspects facing north-west, north and north-east, evaluated for possible inclusion in the SDMs
and other combinations of these variables (Appendix (Appendix 3 Tables 1 and 4 of the End of Project
Table 4 of the End of Project Report). Hawth’s Tools, Report). All variables were screened for collinearity
an extension to ArcGIS, was used to carry out the using variance inflation factors (VIFs), with a VIF value
polygon in polygon analysis (Beyer, 2004). greater than 5 used as a working threshold (Zuur et al.,
2007) for discarding collinear terms. However,
2.7 SDM knowledge of species ecology also informed the final
variable selection. Models were tested until only
2.7.1 Principles governing variable selection
variables deemed to be ecologically sensible and non-
A sound conceptual underpinning is essential for collinear variables were used in the final models.
model building and the accurate prediction of species Finally, the models were tested using climatic variables
distributions. Therefore, model formulation in this only, or a combination of climatic and topographic
study’s work was underpinned by: variables to establish the effects of topographic
variables on the distribution of species, and to
1. A sound understanding of the ‘species niche
investigate the effects on predictions of disregarding
concept’ (Hutchinson, 1957); and
these variables (Virkalla et al., 2010).
2. Knowledge of the specific environmental
Since independent evaluation data were not available
variables that govern the distribution of species,
for much of the species data, data sets were randomly
with the latter also reliant on expert knowledge
divided into ‘training’ and ‘testing’ data prior to the
(Franklin, 2009).
modelling. The predictive power for the derived models
was examined based on an evaluation data set,
According to Austin and Van Niel (2011), plant growth
spatially mixed on a random split of 30% with the
and distribution as modelled by environmental and
calibration data set (70%). The predictive performance
biological variables can be conceptually summarised
of the models was evaluated using the area under the
by the simple formulation below:
curve (AUC) of a receiver operating characteristic
Species distribution/abundance = f (light, temperature, (ROC) plot (Fielding and Bell, 1997), together with
nutrients, water, CO2, disturbance, biota) Cohen’s Kappa statistic (K). Model performance was
considered to be excellent when K > 0.75, good when
To build the best possible models, it is essential to K = 0.40–0.75 and poor when K < 0.40 (Landis and
relate the variables selected to the ecophysiological Koch, 1977). The interested reader is directed to
process they are intended to represent, and to identify Appendix 1 of the End of Project Report where more
what assumptions have been made about those detail on the various technical and statistical
variables not included (Austin and Van Niel, 2011). performance measures used in the modelling is
Guisan and Zimmermann (2000) highlight four key provided.
7Winners and losers: climate change impacts on biodiversity in Ireland
3 Results
3.1 Layout Summary 5 The ‘best’ HDMs are calibrated prior to
applying the climate change data. Projected
This chapter is structured into two main subsections changes are presented alongside the
and interested readers are also directed to Appendix 2 baseline results. Potential changes to the
of the End of Project Report to aid interpretation: climate space relative to the HDM-projected
baseline are described and interpreted.
(i) Evaluation of the performance of the SDMs used
to project the changes for species distributions. 5 To avoid overlap with the reporting on
These are further subdivided into three main modelling, a description of the habitats is
areas examining: provided in Appendix 3 of the End of Project
Report (Supplementary Information 1). These
5 Model performance characteristics between are duplicated from the information supplied
the different model families (Appendix 2 of the to the EC by the NPWS in the 2008
End of Project Report); Assessment Report (NPWS, 2008). Additional
information has been supplied for some of the
5 Projected range changes for focal species; habitats by Cross (2006).
and
3.2 Results (i)
5 The implications of the above for community
structure. 3.2.1 Model performance
Overall, 156 of the 293 species and habitats modelled
(ii) Evaluation of the performance of the habitat achieved excellent or good predictive performance
BEMs (hereafter referred to as HDMs) with scores for AUC and/or Kappa. However, the Neural
reference to the baseline data using the Ensembles (NE) model predictive performance
performance test measures (Appendix 2 of the significantly improved with the addition of topographic
End of Project Report). The fitted baseline HDMs variables to the basic climate variables (Table 3.1) –
are mapped alongside the observed distribution of significantly more models recorded excellent scores
the habitats to provide a comparison. for AUC and Kappa (p < 0.0001) with climate and
Table 3.1. Comparison of performance (AUC and Kappa statistics) of models using Neural Ensembles for
species distribution and habitats using climate and ecology versus climate only variables. Mean (standard
error of mean) performance statistics also given.
Performance category AUC Kappa
Climate and ecology Climate only Climate and ecology Climate only
Excellent 66 38 7 3
Good 84 89 108 78
Fair 84 89
Poor 45 69 172 206
Fail 8 2
Mean (SE) 0.867 (0.006) 0.828 (0.007) 0.477 (0.01) 0.401 (0.011)
AUC, area under the curve.
8J. Coll et al. (2007-CCRP-2.6 COCOADAPT)
topography than for climate variables alone; 81% and (Table 3.2). In models using only climate variables, the
78% of the species and habitats modelled, latter value increased to 54%, again highlighting the
respectively, showed significant improvements in AUC importance of additional topographic variables in
(p < 0.0001) and Kappa (p < 0.0001) with addition of refining model outputs.
topographical data. The species of the arctic-montane
biome showed greatest increases in overall model The species distribution patterns in Ireland and across
performance (p < 0.01). Europe were shown to have an effect on the projected
changes in the ranges of the species. In particular,
Figure 3.1 demonstrates the benefits of including
under a limited dispersal scenario, species with
specific additional ecological (geological,
disjunct distributions (mean contraction = –43%) had
topographical and habitat) variables in species
significantly higher contractions in their range when
distribution models, highlighting spatially mapped NE
compared with species with wide distributions (mean
model outputs for three case study species
contraction = –26%) (p < 0.05) (Fig. 3.2a). Under an
(Geomalacus maculosus, Salix herbacea,
unlimited dispersal scenario, species with disjunct
Mastigophora woodsii). There is a clear refinement of
distributions still underwent range contractions (mean
projected ranges of species when topographic
contraction = –1.5%), which was significantly lower
variables are included in the models (Fig. 3.1).
than for species with narrow distributions (mean range
Projected areas of suitable climate space decrease
expansion = 90%) (p < 0.001). Species with narrow
when areas with suitable environmental conditions and
distributions were also projected to see significantly
habitat become a constraint on the model. For
higher range expansions compared with species
example, in the case of Geomalacus maculosus (Kerry
having wide distributions (mean range expansion =
Slug), only areas with suitable climate, geology
4%) (p < 0.001) (Fig. 3.2a) under an unlimited
(Devonian sandstone) and habitat (oak-dominated
dispersal scenario and demonstrated the largest
woodland and unimproved oligotrophic open moor or
potential for range expansions. Significant differences
blanket bog) remained in the mapped projected ranges
between the projected range changes of species
– a more accurate reflection on its future distribution.
belonging to different major biomes under a limited
For Mastigophora woodsii (Woods’ Whipwort), this
dispersal scenario were also shown (Fig. 3.2b). For
refinement highlights the probably critical distribution
example, species belonging to the boreal-montane
of this species in the future. For Salix herbacea (Dwarf
biome had significantly higher range contractions
Willow), the influence of additional topographical
(mean = –50%) when compared with species
variables resulted in a projected future range that
belonging to the temperate biomes (mean contraction
included grid cells with higher elevations.
= –25%) (p < 0.05) (Fig. 3.2b). No significant
Significant differences were found between the differences were found for species grouped according
predictive performances of the seven modelling types to major biome under an unlimited dispersal scenario
applied in this study. The interested scientific reader is (Fig. 3.2b), or for species grouped according to their
directed to Appendix 2 of the End of Project Report eastern limit under either dispersal scenario (Fig.
where the technical and statistical measures used to 3.2c).
evaluate the baseline distribution models are reported,
including a further series of figures. The projected range changes of a selection of habitats
(directly modelled) protected under the Habitats
3.2.2 Projected range changes Directive are presented in Fig. 3.3. Overall, a mean
In this section, only results of species and habitats with range contraction of 22% was shown for all habitats,
sufficiently high model predictive performance ranging from a 5% contraction for wet heath (WH), a
(n = 156) are presented. Overall, there was a mean 60% contraction for juniper scrub, a 26% contraction
loss of range (33%) for all species under a limited for calcareous rock slopes to a 94% contraction for
dispersal scenario, while under an unlimited dispersal orchid-rich (calcareous) grasslands under limited
scenario, a mean increase in range of 24% was shown dispersal scenarios.
9Winners and losers: climate change impacts on biodiversity in Ireland
Climate and ecology Climate only
Gain
Stable
Loss
Geomalacus maculosus
(Kerry Slug)
0 25 50 100 0 25 50 100
Mastigophora woodsii
(Wood’s Whipwort)
0 25 50 100
0 25 50 100
Salix herbacea
(Dwarf Willow)
0 25 50 100 0 25 50 100
Figure 3.1. Comparison of spatially mapped Neural Ensembles model outputs for three case study species
(Geomalacus maculosus, Salix herbacea, Mastigophora woodsii) for models with and without additional
ecological (topographical) variables, highlighting refinement of projected ranges of species when
additional variables are included in the models.
10J. Coll et al. (2007-CCRP-2.6 COCOADAPT)
(a)
Limited Dispersal Unlimited Dispersal
110
90
% Range Change 70
50
30
10
-10
-30
-50
-70
w
e
t
te
nc
id
ro
ia
W
ju
ar
ed
is
N
rm
D
te
In
(b) 160
% Range Change
110
60
10
-40
-90
te
e
al
ic
te
e
ne
te
e
t
n
nt
n
re
ra
ra
ra
ra
ta
ta
ta
tla
bo
pe
pe
pe
pe
on
on
on
-A
e-
m
m
m
m
-m
l-m
-m
an
te
te
id
Te
te
ic
ic
W
o-
a
-
e-
ne
rn
ct
re
ct
re
id
he
ar
rra
Bo
Ar
Bo
W
o-
ut
ite
re
So
ed
Bo
M
(c) 80
60
% Range Change
40
20
0
-20
-40
-60
an
n
r
c
ic
an
ic
la
ni
ria
an
an
pe
po
si
ea
be
ce
ra
ce
ro
um
oc
si
Eu
O
bo
Eu
er
ro
irc
Su
yp
Eu
C
H
Figure 3.2. Association of species ecology: (a) distribution in Ireland, (b) major biome (biogeographic
element/European distribution), and (c) eastern limit (biogeographic element/European, Asian, and North
American distribution). Standard errors of the mean are shown by vertical bars.
11You can also read