Federal Republic of NIGERIA 2014
←
→
Page content transcription
If your browser does not render page correctly, please read the page content below
NATIONAL AGENCY FOR THE CONTROL OF AIDS (NACA)

      Federal Republic of
                 NIGERIA
            GLOBAL AIDS RESPONSE
              Country Progress Report
                       Nigeria GARPR 2014

                                            2014

                 ABUJA, NIGERIA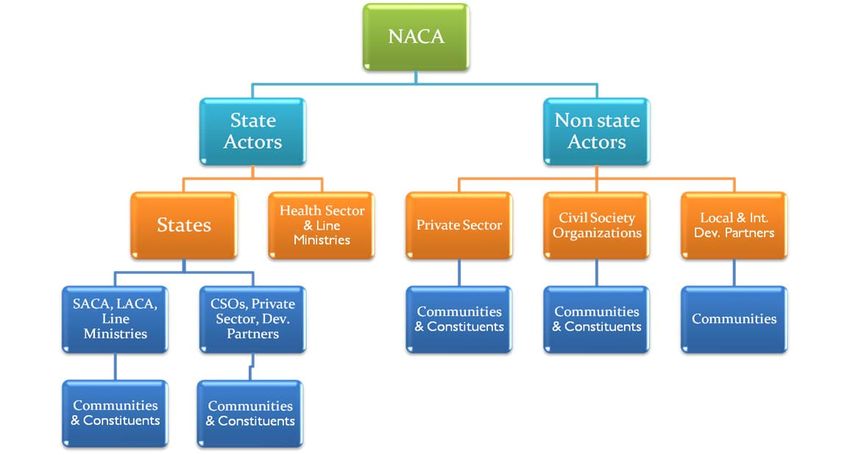
Contents
ACRONYMS ..................................................................................................................................................... 3
NIGERIA GARPR 2014 STEERING COMMITTEE ....................................................................................... 4
NIGERIA GARPR 2014 CORE TEAM ............................................................................................................ 5
FOREWORD ...................................................................................................................................................... 6
ACKNOWLEDGEMENT ................................................................................................................................. 7
Section One: Status at a Glance ........................................................................................................................ 8
Inclusiveness of Stakeholders in the Report Writing Process .......................................................................... 10
Section Two: Overview of the Epidemic ........................................................................................................ 17
  HIV Prevalence ............................................................................................................................................ 17
Section Three: National Response to the Epidemic ....................................................................................... 26
  A. Policy and Framework ............................................................................................................................. 26
  B. Strategy .................................................................................................................................................... 27
  C. Coordinating Structures............................................................................................................................ 29
     National Level Coordination and Interface .............................................................................................. 31
     Vision of NACA ...................................................................................................................................... 31
     Mission of NACA .................................................................................................................................... 31
     Mandate of NACA ................................................................................................................................... 31
     State level coordination and interface ...................................................................................................... 32
     Civil Society Organizations Interface ..................................................................................................... 32
     Coordination of Private Sector Response ................................................................................................. 33
     Coordination of Non-Health Public Sector Response .............................................................................. 34
  D.National Targets and Program Responses ................................................................................................ 35
     Promotion of Behavior Change and Prevention of New Infections ........................................................ 35
     HIV Counseling and Testing .................................................................................................................... 28
     Sexually Transmitted Infections............................................................................................................... 30
     Behavioural Change Communication among Young People ................................................................... 31
     Behavior Change Communication among MARPs .................................................................................. 33
     Prevention of Mother to Child Transmission (PMTCT) of HIV .............................................................. 33
     Condom Programming ............................................................................................................................. 34
     Biomedical Transmission of HIV ............................................................................................................ 35
     Treatment of HIV and related Health complications .............................................................................. 36
     Care and Support of people infected and affected by HIV/AIDS including OVC ................................... 38
Section Four: Best Practices ............................................................................................................................ 40
  Coordination at National and Sub-National Levels ................................................................................... 40
  Program Implementation through partnerships .......................................................................................... 40
  The President’s HIV/AIDS Comprehensive Response Plan ........................................................................ 40
  ESTABLISHMENT OF NATIONAL HIV/AIDS RESOURCE CENTRE (NHRC) .................................. 41
  Shaping the Nigeria HIV Response programming landscape at sub-national level (States and LGAs)
  towards increased ownership and sustainability effort ................................................................................. 41
  THE NATIONAL CALL CENTRE FOR HIV/AIDS ................................................................................. 42
  Men and PMTCT in Benue State ................................................................................................................. 43
Section Five: Major Challenges and Remedial Actions ................................................................................. 44
  Challenges in the Current Reporting Period ................................................................................................. 45
Section Six: Support from the Country’s Development Partners ..................................................................... 39
Section Seven: Monitoring &Evaluation ......................................................................................................... 40
  7.1 Overview of the National HIV/AIDS M&E System ........................................................................... 40
  7.2 Routine Data Sources for the National Response................................................................................... 41
     7.2.1 PMTCT data collection and reporting tools .................................................................................... 41
     7.2.2 ART Data Collection and Reporting Tools ..................................................................................... 41
     7.2.3 HCT Data Collection and Reporting tools ...................................................................................... 41
     7.2.4 OVC data collection and reporting tools ......................................................................................... 42
  7.3 Non Routine data sources for the national response .............................................................................. 42
     7.4 Second Generation Surveillance System ............................................................................................ 43
Conclusion ....................................................................................................................................................... 46

                                                                                                                                                           2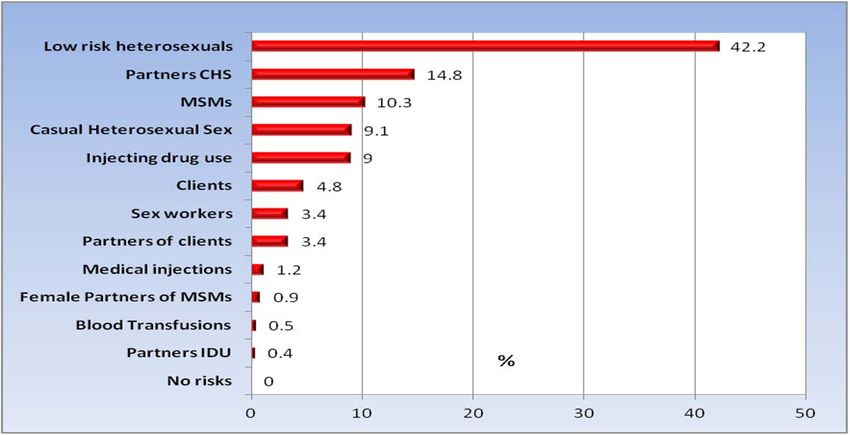
ACRONYMS
AIDS       -   Acquired Immune Deficiency Syndrome
ANC        -   Ante-Natal Clinics
ART        -   Anti-Retroviral Therapy
ARV        -   Anti-Retroviral
BSS        -   Behavioural Sentinel Survey
CSO        -   Civil Society Organization
CSW        -   Commercial Sex Workers
DoC        -   Declaration of Commitment
FCT        -   Federal Capital Territory
FMOH       -   Federal Ministry of Health
GARPR      -   Global AIDS Response Progress Report
HCT        -   HIV/AIDS Counselling and Testing
HEAP       -   HIV/AIDS Emergency Action Plan
HIV        -   Human Immunodeficiency Virus
IBBSS      -   Integrated Biological and Behavioural Surveillance Survey
ICAP       -   International Centre for AIDS Care and Treatment Program
IDU        -   Injecting Drug Users
LACA       -   Local Action Committee on AIDS
LAC        -   Local Government Action and Communication
LGA        -   Local Government Area
MDA        -   Ministries, Department and Agencies
MDG        -   Millennium Development Goals
M&E        -   Monitoring and Evaluation
MARPs      -   Most at Risk Populations
MOT        -   Modes of Transmission
MSM        -   Men who have Sex with Men
NACA       -   National Agency for the Control of AIDS
NASA       -   National AIDS Spending Assessment
NARHS      -   National HIV/AIDS Reproductive Health Survey
NARHS Plus -   National HIV/AIDS Reproductive Health Survey Plus
NDHS       -   Nigeria Demographic and Health Survey
NGOs       -   Non-Governmental Organization
NNRIMS     -   Nigeria National Response Information Management System
NOP        -   NNRIMS Operational Plan
NSF        -   National Strategic Framework

SKM        -   Strategic Knowledge Management
                                                                           3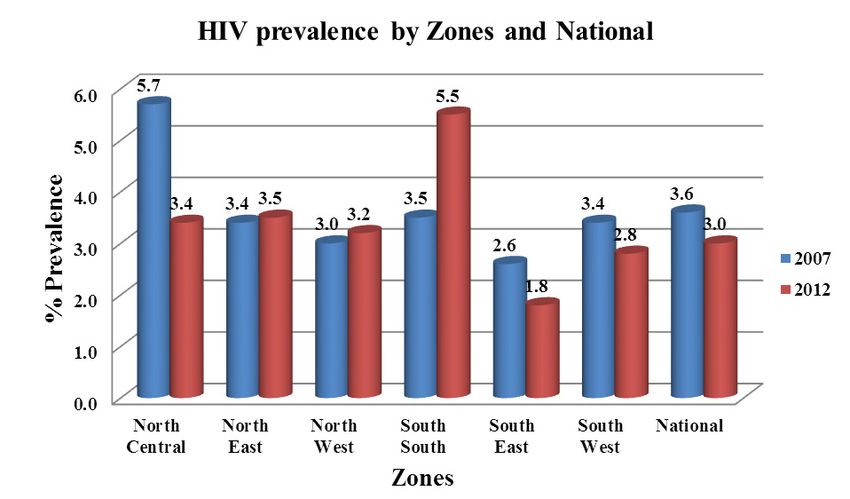
NIGERIA GARPR 2014 STEERING COMMITTEE

  1. Prof. John Idoko- NACA

  2. Dr. Bilali Camara- UNAIDS

  3. Dr. Kayode Ogungbemi- NACA

  4. Dr. Evelyn Ngige- HIV/AIDS Division (FMOH)

  5. Dr. Greg Ashefor- NACA

  6. Dr. Masauso Nzima- UNAIDS

  7. Dr. Niyi Ogundiran- WHO

  8. Mr. Akin Atobatele – USAID

  9. Dr. Arjen Dewagt- UNICEF

  10. Mrs. Modupe Taiwo – CISHAN

  11. Dr. Omokhudu Idogho- ENR/DFID

  12. D r . A b i o d u n H a s s a n – ARFH

  13. Mr. Samson Bamidele- MEASURE Evaluation

  14. Mr. Francis Agbo – NACA

  15. Mrs. Doris Ogbang- NACA

                                                  4
NIGERIA GARPR 2014 CORE TEAM
1. Mr. Emmanuel Abatta – HIV/AIDS Division (FMOH)
2. Mr. Francis Agbo – NACA
3. Mrs. Doris Ogbang- NACA
4. Dr. Masauso Nzima- UNAIDS
5. Mr. Funso Adebayo– F H I 3 6 0
6. D r . N i y i O g u n d i r a n – WHO
7. Dr. Dare Onimode – USDOD
8. Mrs. Fati Murtala Ibrahim - IHVN
9. Mr. Joseph Kogi – ENR
10. Miss Uzoma Anosa – CISHAN
11. Mrs. Modupe Taiwo – CISHAN
12. Mr. Lawrence Kwaghga – NACA
13. Miss. Oluchi Obi- NACA
14. M r s . M e r c y M o r k a – FMOH (NASCP)
15. Miss Eunice Ekong – IHVN
16. Dr. Adedayo Adeyemi- MEASURE Evaluation
17. Mr. Jeph Oluwagbemiga- MEASURE Evaluation
18. Mr. Justus Uzim- FHI 360
19. Mr. Ola Matthews- NACA
20. Mr. Festus Idepefo- NACA
21. Mr. Kenneth Alau- NACA
22. Dr. Ogbonna Amanze- NACA
23. Mrs. Ronke Adeoye- NACA
24. Mr. Akintomide Akinrogunde- NACA
25. Dr. Bodunde Onifade (NASCP)
5FOREWORD
In 2013 Nigeria continued her commitment towards meeting the vision of Millennium
Development Goal (MDG) to halt and reverse HIV and AIDS epidemic in the country and
promote the achievement of universal access to HIV/AIDS prevention, treatment, care and
support in line with global commitments. With the valuable support of local and
international partners, the country has seen the epidemic profile change significantly from
HIV prevalence of 5.8% in 2001 to 4.1% in 2010. Attaining the status of a country with
stable HIV epidemic among adults 15–49 years old between 2001 and 2011 is a significant
achievement, though there are still gaps and challenges with access to HIV/AIDS service
by eligible persons.
Reviews of the national response further helped to identify some other key challenges
which revolve around limited domestic financing of the response, weak coordination at
national and state levels, inadequate state government contribution to resourcing for the
response; challenges with human resources for health, weak supply chain management
systems; limited service delivery capacity and access to HIV services.
In a bid to address these challenges and strengthen the national response towards ensuring
we reach our set national response targets, the Federal Government of Nigeria led by his
Excellency President Goodluck Ebele Jonathan launched the President’s Comprehensive
Response Plan for HIV/AIDS in Nigeria (PCRP). The PCRP incorporates these tenets and
provides a unique opportunity to achieve greater ownership of the response at sub-national
levels and thereby guarantees improved access and sustainability. It is also anticipated that
this will inject the required momentum into the HIV response and attainment of our
national commitments.
The 2014 Nigeria GARPR report highlights the progress in the national response and the
collective efforts stakeholders have made in Nigeria in the year 2013 while providing
evidence that will further strengthen the need to do more towards ensuring that we reach
our country goals, objectives and targets for HIV response.
I present to you the Nigeria 2014 GARPR report and also use this opportunity to thank all
our Donors, Partners, Civil Society and Government Ministries, Departments and Agencies
for your continued financial and technical support.
Professor John Idoko,
Director General, National Agency for the Control of AIDS
(NACA)
6ACKNOWLEDGEMENT
I wish to thank the Director-General of the National Agency for the Control of AIDS
(NACA), Prof. John Idoko for providing the institutional and leadership support needed for
the development of the Nigeria 2014 GARPR report. On behalf of NACA, I also wish to
recognize the technical and financial contributions of the UNAIDS team led by Dr. Bilali
Camara and ably supported by the UNAIDS M&E Advisor for Nigeria, Dr. Masauso
Nzima.
Similarly, NACA appreciates the contributions of all the members of the Nigeria 2014
Report Steering committee for their technical and financial support towards the entire
process leading to the submission of the Nigeria GARPR report. Our national response has
been successfully built and sustained on this collaborative and participatory approach. Let
us continue in this same spirit as we work together to ensure that we meet our target of
halting and reversing the HIV/AIDS epidemic in the country.
The immense contributions of the GARPR core team is also acknowledged and
appreciated. The team implemented the approved work plan for 2014 GARPR report
writing and was directly responsible for all of the activities involved including the
HIV/AIDS estimates meeting; NCPI survey meeting, data analysis, stakeholder validation
meeting; submitting the data for the indicators using the online reporting tool and drafting
the narrative report.
Special thanks to Mr. Francis Agbo and Mrs. Doris Ogbang of the Strategic Knowledge
Management Department of NACA for their leadership and coordination role of the day to
day activities in the process of generating Global AIDS Response Progress Report. The
diligent efforts of all members of the core team including: Funso Adebayo (FHI360);
Mercy Morka (FMoH/NASCP); Modupe Taiwo and Uzoma Anaso (CISHAN), Adedayo
Adeyemi (MEASURE), Fati Murtala Ibrahim and Eunice Ekong (IHVN); Kogi Joseph
(ENR/DFID); Dare Onimode (USDOD); Lawrence Kwaghga (NACA); Oluchi Obi
(NACA) and Abu Ibrahim (NYNETHA) are also recognized and appreciated
My sincere gratitude also goes to staff of the Strategic Knowledge Management
Department at NACA for their logistic and technical support towards the timely
completion and submission of this report.
Dr. Kayode Ogungbemi,
Director, Strategic Knowledge Management Department,
National Agency for the Control of AIDS
7Section One: Status at a Glance
Nigeria Country Profile
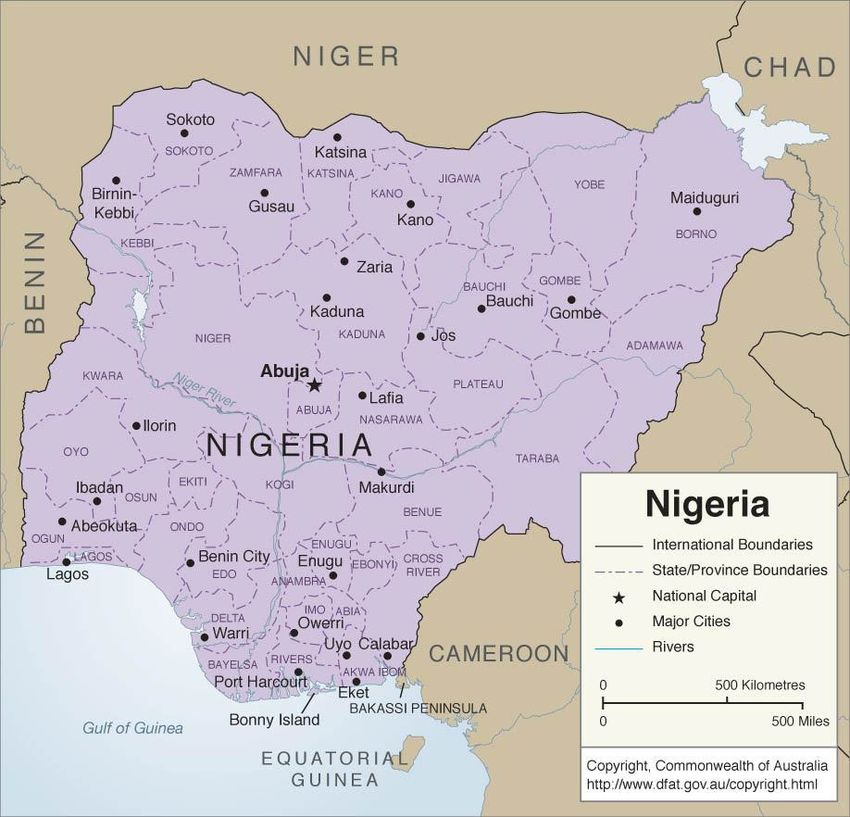
Nigeria lies within latitudes 4° 1’ and 13º 9’ North and longitudes 2º 2’ and 14º 30’ East, and is
bordered in the North by Niger Republic; in the East by the Republic of Chad and Cameroun; in the
West by the Republic of Benin and in the South by the Atlantic ocean. The country occupies a total
surface area of approximately 923,768 square kilometers and 800km of coast line.
Nigeria’s climate varies with an equatorial south, a tropical center, savannah and arid north. Natural
resources include: natural gas, petroleum, tin, iron ore, coal, limestone, niobium, lead, zinc and
arable land. Nigeria has southern lowlands which merge into central hills and plateaus; while
mountains abound in the southeast, and mostly plains dominate the north.
The country has 36 states and the Federal Capital Territory (FCT) with the states further divided
into 774 Local Government Areas (LGAs). The states are grouped into six geopolitical zones based
on geopolitical considerations; North East (NE), North West (NW), North Central (NC), South
West (SW), South East (SE) and South-South (SS). Each geopolitical zone is distinct in character
with its own unique size, composition of population, ecology, language, norms, settlement patterns,
economic opportunities and historical background.
Nigeria is the most populous African country with an estimated population of 177,071,561 as at
July-2013 and Total Fertility Rate (TFR) of 5.5. Nigeria’s annual growth rate is estimated to be
82.54% in 2013. Nigeria has over 250 ethnic groups. The languages include English (Official),
Hausa, Yoruba, Igbo and over 500 other indigenous languages. Approximately 50% of the
population lives in urban areas with the rate of urbanization estimated at 3.75% annual rate of
change.
Table 1 Nigeria Basic Indicators
Basic Indicators
Under-5 mortality rate, 2013 128
Infant mortality rate (under 1), 2013 72.97
Neonatal mortality rate, 2013 46
Total population, 2013 estimates 177,072,561
Annual number of births (thousands), 2013 31828
Annual number of under- 5 deaths (thousands), 2013 861
GNI per capita (US$), 2011 1280
Life expectancy at birth (years), 2011 52
Total adult literacy rate (%), 2005-2010 61
Primary school net enrollment ratio (%), 2013 58
% share of household income, lowest 40%, 2000-2010 15
% share of household income, highest 20%, 2000-2010 54
9Inclusiveness of Stakeholders in the Report Writing Process
The report writing process commenced i n e ar n es t i n J an u a r y 2 0 1 4 with the
formation of the Global AIDS Response Program Report (GARPR) Steering Committee
by the National Agency for the Control of AIDS in January 2014. T h e S t e e r i n g
committee was led by NACA and had membership from a broad
spectrum of stakeholders that included FMOH (HIV/AIDS Division);
U N A I D S ; U S D O D ; E N R / D F I D a n d C I S H A N . The Steering Committee was
tasked with the responsibility of a p p r o v i n g t h e G A R P R r e p o r t i n g w o r k p l a n ;
r e s o u r c e m o b i l i z a t i o n a n d r e s p o n s i b l e f o r e n s u r i n g t h a t the country report is
submitted to UNAIDS Geneva on or before the deadline of 31st March 2014.
The Steering Committee then approved the establishment of GARPR core team of
technical experts from various key stakeholders to implement the approved GARPR
report writing work plan. The main responsibilities of the core team included the
following: guide data collection, collation, analysis, interpretation and reporting. Essentially,
the team reviewed epidemiological, programmatic and financial data to describe the national
HIV response. Financial and technical assistance was provided by some development
partners that are present in Nigeria, including the United Nations system, bi-lateral and
other multi-lateral agencies.
For this 2014 reporting, a decision was taken to have members of the core team compile the
report and to a large extent conduct the data analysis and collation. This is an effort to build the
capacity of government staff (i.e. NACA and FMoH) and other relevant stakeholders in the
HIV/AIDS response. The work of the core team was however monitored for quality and
adherence to standards by the steering committee.
Sub-activities for the GARPR report commenced on the 5th of February 2014 with formal
letters dispatched from the NACA Director General to Federal Line Ministries, Departments
and Agencies as well as key Development Partners in the national HIV/AIDS response to
solicit their support for the process. The core team met at various times to review the GARPR
reporting guidelines and map out activities and timeline towards ensuring that the country meets
the deadline for submission of the report. The team also reviewed data sources for the GARPR
indicators and ascertained availability of new data particularly population surveys where
relevant.
The Federal Ministry of Health worked closely with NACA, to guide the collation o f all
health sector data. Since the last repo rtin g period, the n ation al reportin g s yst em
has improv ed con siderabl y. As a result , ART and PMTCT pro gram dat a were
ex tract ed directl y at the lev el of th e facilit y. T he d ata were then co nsolid ated
with data from impl ementin g p art ners funded b y th e US go vernm ent an d the
Global Fun d. An int ern al p rocess o f v ali dation was cond uct ed b y a team mad e
up of NACA, FMo H and Dev elopm ent Partn ers. T his step was tak en to ensu re
that repo rted dat a was of accept able and high qu alit y.
10 The f u l l compilation of the report started with a desk review of background documents on
the HIV epidemic and response in Nigeria. Documents reviewed included the following:
a. Strategic documents: National HIV/AIDS Strategic Framework (NSF) 2010-2015(1)
b. Programmatic Reports: National AIDS Control Programme annual reports.
c. Population based survey reports: Nigeria Demographic and Health Survey (NDHS)
2003 and 2008; National HIV/AIDS and Reproductive Health Survey (NARHS) 2005,
2007 and 2012.
d.
Sub-population survey reports; Antenatal HIV sentinel surveillance 2008 and 2010.
Integrated Biological and Behavioural Surveillance Survey (IBBSS) 2007 and 2010.
e. Specialized surveys in specific population groups, patient tracking systems,
programmatic data, National AIDS Spending Assessment reports of 2007/2008,
2009/2010 and 2011/2012.
f. Programme Reviews: the National Commitment and Policy Instrument (NCPI),
Nigeria Country UNGASS Report, 2003, 2005, 2007 and 2010, Nigeria Global AIDS
Response Progress Report 2012, Joint Annual Review of the National Response to
HIV/AIDS 2011 and the combined NSF Mid-Term Review Report 2013.
g. National HIV/AIDS Epidemiology Impact Assessment 2014, program data and other
relevant data sources.
h. Modes of HIV Transmission report 2009
i. Universal Access report 2010
GARPR reporting activities continued with the compilation of the National Composite and Policy
Instrument (NCPI) section. The NCPI questionnaire was first circulated to Government
Department and Agencies, Development Partners and Civil Society organizations contributing to
the national response to HIV. This was done at the early stages of commencement of the exercise
to enable stakeholders prepare responses ahead of the NCPI response collation workshop. Part A
of the NCPI questionnaire was completed by NACA and the HIV/AIDS Division of the
Federal Ministry of Health. Part B was administered to representatives from national and
international CSOs, bilateral and multi-lateral partners and the UN. Responses to the
questionnaires were collated with agreement obtained on unified responses to NCPI questions at
the NCPI workshop.
Similarly, a two day HIV/AIDS estimates workshop was held to revise the HIV/AIDS estimates
for the country. UNAIDS Geneva provided technical support while UNAIDS country office in
Nigeria provided financial support for the workshop which was led by the Federal Ministry of
Health (HIV/AIDS Division)and ably supported by NACA and the GARPR core team.
After the estimates workshop, the core team spent a week in GARPR report writing workshop to
draft the narrative report which was then circulated for inputs and comments by the Steering
committee.
11 In preparation for submission, a two day stakeholders’ meeting was held in Abuja to present data
on the GARPR indicators and other findings for validation prior to final submission to UNAIDS
Geneva. This stakeholders’ meeting also included finalization of the report prior to submission.
Using login access and password given to the country designated focal person for the GARPR
report by UNAIDS, the final validated data was submitted using the GARPR online reporting tool.
12 Status of the Epidemic
The first case of AIDS in Nigeria was reported in 1986. Consequently, and in line with
guidelines from the World Health Organization (WHO), the government adopted ANC sentinel
surveillance as the system for assessing the epidemic. Sentinel survey data showed that the HIV
prevalence increased from 1.2% in 1991 to 5.8% in 2001. After 2003 the prevalence declined to
4.4% in 2005 before slightly increasing to 4.6% in 2008. Results from the latest round of sentinel
survey shows that the national prevalence was 4.1% in 2010. (FMOH, 2010) Trend analysis of
HIV prevalence from sentinel surveillance in Nigeria indicates that the epidemic has halted and is
showing signs of stabilizing at about 4% from 2005 till date.
Similarly, based on projected HIV estimates of 2013, about 3,229,757 people now live with HIV
while it is estimated that 220,394 new HIV infections occurred in 2013. A total of 210,031 died
from AIDS related cases. It is also estimated that a total of 1,476,741 required anti-retroviral
drugs (ARV) in 2013.
Although most-at-risk populations contribute to the spread of HIV, heterosexual sex, particularly of
the low-risk type, still makes up about 80 percent. Mother-to-child transmission and transfusion of
infected blood and blood products, on the other hand, account for the other notable modes of
transmission.
Another National HIV/AIDS and Reproductive Health Survey (NARHS) was conducted in 2012,
with a national prevalence of 3.4%. There was a slight decline from the previous estimates of 2007
which was 3.6%.The overall national prevalence also masks several nuances and variations in
Nigeria’s epidemic at the sub-national (state) levels and among population groups. The 2012
NARHS HIV prevalence was highest among those aged 35 to 39 (4.4%), and lowest among the 15-
19 age group (2.9%). The prevalence for males aged 35 to 39years was highest at 5.3%, while
women aged 30 to 34 years was 4.2%.
Geographically, the HIV prevalence was highest in the South South zone. The prevalence of 5.5%
recorded, in the NARHS 2012, depicting an increase from 3.5% in 2007 [NARHS 2012]
Key drivers of the HIV epidemic in Nigeria include low personal risk perception, multiple
concurrent sexual partnerships, t r a n s a c t i o n a l and inter-generational sex, ineffective and
inefficient services for sexually transmitted infections (STIs), and inadequate access to and poor
quality of healthcare services. Entrenched gender inequalities and inequities, chronic and
debilitating poverty, and p ersi st en ce of HIV/AIDS-related stigma and discrimination also
significantly contribute to the spread of the infection.
13 Policy and Programmatic Response
Policy
HIV/AIDS remains a threat to population health in Nigeria; it continues to strain the
struggling health system and reverse many developmental gains of the recent past including
maternal and under-five mortality rates. Nigeria has enacted a number of laws and policies
to guide the multi-sectoral response to HIV/AIDS. The policies have been well articulated in
and draw on a number of documents including the following:
A. The National Policy on HIV/AIDS was developed in 2009 by the National Agency for
the Control of AIDS. The policy provides regulations and guiding principles on topics
ranging from prevention of new infections and behavior change, treatment, care and
support for infected and affected persons, institutional architecture and resourcing,
advocacy, legal issues and human rights, monitoring and evaluation, research and
knowledge management and policy implementation by the various stakeholders in the
national response. The national policy was developed in agreement with key national
and international frameworks relevant to the HIV/AIDS response in Nigeria, including:
• The 1999 Constitution of the Federal Republic of Nigeria, which affirms the
national philosophy of social justice, and guarantees the fundamental right of every
citizen to life and freedom from discrimination.
• Complementary government policy documents which provide the framework for the
National HIV policy, including the NACA Act, Medium Term Strategy, National
Economic Empowerment and Development Strategy (NEEDS) I and II, National
Gender Policy, and the Seven Point Agenda of the Federal Government of Nigeria.
• Commitments to and ratification of numerous international conventions including
Universal Declaration of Human Rights (1948), the Convention on Economic, Social
and Cultural Rights (1976), the Convention on the Elimination of All Forms of
Discrimination Against Women (1979), Convention on the Rights of the Child
(1989), and the African Charter on Human and People’s Rights (2003)
• Nigeria’s ratification of agreed international community goals including the
Programme of Action of the International Conference on Population and
Development ICPD (1994), The Political Declaration and further action and initiatives
to implement the Beijing Declaration and Platform for Action (2000), Political
Declaration at the World Summit for Social Development (1995), The United Nations
Millennium Declaration (2000) which target 2015 for the reversal of the epidemic
trajectory, Greater Involvement of People with AIDS (GIPA) and Meaningful
Involvement of People with AIDS (MIPA) principles, The Abuja Declaration and
Framework for Action for the Fight Against HIV/AIDS, Tuberculosis and other related
diseases in Africa (2001) and the United Nations General Assembly Special Session on
HIV/AIDS (UNGASS) (2001).
• Nigeria’s Commitment to Universal Access and to comprehensive HIV prevention,
treatment, care and support as enunciated in the following: the 2005 Gleneagles G8
Universal Access Targets, the 2006 United Nations Political Declaration on
HIV/AIDS, the African Union’s Abuja Call for Accelerated Action towards Universal
Access for HIV/AIDS (2006), and the Brazzaville Commitment on scaling up
towards Universal Access to HIV and AIDS prevention, treatment, care and
support services in Africa by 2010
14 B. The Nigerian government has been pro-active in its efforts to confront the HIV
scourge with its overarching strategy elaborated in the bottom-up poly-stakeholder
and multi-sectoral National Strategic Plan (NSP).The NSP is derived from the
architecture of the National Strategic Framework 2010-15 (NSF II) and has targets
to halt and begin to reverse the spread of HIV infection, as well as mitigate the
impact of HIV/AIDS, by 2015. With the condition that where appropriate, the
targets of the NSP should be population-based, the Federal Government of Nigeria
implicitly recognizes HIV care and treatment as a national public health good.
To this effect, the NSF II was developed to provide direction and ensure consistency in
the development of the strategic plans by all stakeholders including all the 36 states of
the Federation and the Federal Capital Territory (FCT); Government Ministries,
Departments and Agencies (MDAs); and the constituent coordinating entities of Civil
Society Organization (CSOs) Networks. The NSF II, unlike the NSF 2005-2009 (NSF I), is
linked to Universal and MDG targets and Vision 20:2020 and has an overriding emphasis
on HIV prevention. The NSFII recently underwent a mid-term review, and the report is
currently available. The findings of the MTR of the NSPII show that Nigeria is making
some progress with respect to achieving a number of the UN general assembly targets. In
particular, the country reports being on course to achieve targets 1, 5, 6, and 8.
The Response Analysis of the preceding NSF 2005-2009, together with input from
over 250 stakeholders from public, private and civil society sectors and Development
Partners provided the evidence for findings and recommendations that guided the NSF II.
Although approximately 1,555,780 PLHIV require ARV drugs, about one third of this
group are currently on treatment. The gender dynamics in the profile of infections and
the growing burden of the 2.2 million HIV orphans in the country has made it
necessary for the revised policy to critically address the following:
• The rising HIV prevalence among women
• The expansion in number of orphans and vulnerable children
• The stigmatization of PLHIV and violation of their rights as well as their roles and
responsibilities.
• The differences in communication messages on abstinence, condom use etc in post –
primary educational institutions.
• The issues associated with increased access to treatment and care.
The NSF II builds on the National HIV Policy and provides a broad structural framework for
the implementation of this policy. Considerations that informed the development of this
framework include the burden of HIV/AIDS in the country, the public health challenge of
HIV/AIDS, comprehensive HIV/AIDS services, feminization of the epidemic and strategy
for gender streaming, young people, MARPs, modes of HIV transmission, drivers of
the epidemic, stigma and discrimination, cultures, traditions and religion, human
rights and multisectoral partnership.
C. Other policy documents that the national response to HIV draws from are: the National
Action Plan on Orphans and Vulnerable Children and the National HIV/AIDS Prevention
Plan.
In spite of the numerous policies, minimal progress has been made in addressing the human
rights and legal issues surrounding HIV/AIDS. This is mainly due to the fact that, in
Nigeria, official policy documents do not constitute law and cannot be enforced in the
15 courts of law. They constitute merely administrative tools and guidelines that provide
direction for governmental action. However, these policy documents can and may
elaborate and specify the goals, values, and standards to which existing laws aspire
and may be useful in interpreting the latter as well as guiding programmatic
interventions by the government. The problem is that, at the moment, there are no
HIV/AIDS specific laws on the statutes. Due to the delay in the progress of legal
reforms and the absence of the backing of the law, government policy documents
can only serve to inspire an effective national HIV/AIDS response that respects the
rights of PLHIV and PABA.
Currently, the 1999 Nigerian constitution and international treaties ratified by the
country have provided the major sources of human rights for PLHIV and PABA in
the country. However, as none of these treaties or the constitution specifically addresses
the situation of PLHIV and PABA, the case of their applicability often has to be made
through advocacy and lobbying. One outcome of this advocacy agenda has been the
efforts made by civil society networks in spearheading the pressure for the passage of the
anti-discriminatory bill. Anti- stigma and discrimination bill has passed through Senate
and House of Representatives. The bill is waiting to be sign into law by the president.
Four (4) states have passed the bill into law. Efforts by civil society networks like
CiSHAN, NYNETHA and NEPWHAN have recently included advocacy for increased
government investment in the HIV response, facilitation of the use of available policies
and guidelines and promotion of the establishment of the legal framework for protection
of prospective employees and intending couples.
For most-at-risk and other vulnerable population groups like sex workers, men who have
sex with men (MSMs) and injecting drug users (IDUs), there remains a clear absence
of non- discrimination laws or regulations specifying protection for these groups. The
National Assembly, has passed a bill to prohibit same sex marriage. Tagged
S a m e -Sex Prohibition Law, the law proposed up to 14 years imprisonment each for gay
couples who decided to solemnize their union while witnesses to the marriage or anyone
who assisted the couples to marry could be sentenced to 10 years behind bars. Also
proscribed by the new Bill is “public show of same-sex amorous relationships directly or
indirectly” with 10 years’ imprisonment s t i p u l a t e d as punishment. The bill has since
been signed into law by The President of the Federal Republic of Nigeria. This Law now
criminalizes gay groups and organizations and promotes the discrimination and persecution
of persons on the basis of their sexual orientation and gender identity. However, according
to the Director-General of NACA:
“Nothing in the same sex Marriage (Prohibition) Act 2013 refers to or prohibits programs
targeted at prevention, treatment, care and support for people living with HIV or affected by
AIDS in Nigeria. No provision of this law will deny anybody in Nigeria access to HIV
treatment and other medical services.’’
The Government of Nigeria remains fully committed to improving the health of Nigerians
and preventing all AIDS related deaths, and therefore will continue to ensure that Nigerians
have access to the requisite services that they may require as guaranteed by the constitution’’
In the 12 northern states that have adopted Shari'a law, anal intercourse is punished with
100 lashes (for unmarried Muslim men) and one year's imprisonment and death by
stoning for married or divorced Muslim men. As of March 2006, press reports say that more
16 than a dozen people have been sentenced to death by stoning since 2000, but the sentences
had not been carried out.
Programmatic Response
Based on commitments to secure significantly increased resources (human, material,
financial and technical) for the national HIV/AIDS response from both domestic and
international sources, Nigeria set ambitious country specific targets to monitor progress
towards Universal Access to HIV/AIDS Interventions. A number of large scale
interventions were identified as critical to the success of progress towards the universal
access goal. These interventions included gender mainstreaming, advocacy at all levels,
capacity building including training and skills development, increased access to material
goods, technical assistance and sustainable funding addressed in all six defined thematic
areas for the national response, outlined below:
1. Promotion of Behaviour Change and Prevention of New Infections
2. Treatment of HIV/AIDS and related Health Complications
3. Care and Support of PLHIV, PABA and OVC
4. Policy, Advocacy, Human Rights and Legal Issues
5. Institutional Architecture, Systems, Coordination and Resourcing
6. Monitoring and Evaluation, Research and Knowledge Management
17 Indicator Overview Table Table 2 - Global AIDS Response Program Indicators TARGET / INDICATOR UNGASS 2007 UNGASS 2010 GARPR 2012 GARPR2013 Target 1: Reduce Sexual Transmission of HIV by 50% General Population Percentage of young women and men 22.5% 24.2% 24.2% 24% aged 15–24 who correctly identify NARHS 2005 NARHS 2007 NARHS 2007 NARHS 2012 ways of preventing the sexual transmission of HIV and who reject major misconceptions about HIV transmission* Percentage of young women and men 9.8% 11.9% 11.9% 15.5% aged 15-24 who have had sexual NARHS 2005 NARHS 2007 NARHS 2007 NARHS 2012 intercourse before the age of 15. Percentage of respondents aged 15-49 10.4% 11.4% 11.4% 16.3% who have had sexual intercourse with NARHS 2005 NARHS 2007 NARHS 2007 NARHS 2012 more than one partner in the last 12 months Percentage of adults aged 15–49 who 56.1% 52.5% 52.5% 64.5% have had sexual intercourse with more than one partner in the past 12 months and who report the use of a condom NARHS 2005 NARHS 2007 NARHS 2007 NARHS 2012 during their last intercourse Percentage of women and men aged 15- 8.60% 11.7% 11.7% 17.1% 49 who received an HIV test in the past (NARHS 2005) (NARHS 2007) (NARHS 2007) NARHS 2012
12 months and know their results
Percentage of young people aged 15-24      4.3%                4.2%             4.2%            4.2%
who are living with HIV                    (ANC 2005)          (ANC 2008)       (ANC 2010)      (ANC 2010)
Sex workers
Percentage of sex workers reached with     34.30%              34.30%           18.2%           18.2%
HIV prevention programmes                  (IBBSS 2007)        (IBBSS 2007)     (IBBSS 2010)    (IBBSS 2010)

Percentage of sex workers reporting the    91.97%              98% (FSW only)   88.6%           88.6%
use of a condom with their most            (IBBSS 2007)                         (MSW & FSW)     (MSW & FSW)
recent client                                                                   54.7% (MSW)      54.7% (MSW)
                                                                                92.9% (FSW)      92.9% (FSW)
                                                                                (IBBSS 2010)     (IBBSS 2010)
Percentage of sex workers who have         38.2% (Female       38.2% (Female    41.8% (Male &   41.8% (Male &
received an HIV test in the past           Sex Workers         Sex Workers      Female Sex      Female Sex
12 months and know their results           Only)               Only)            Workers)        Workers)
                                           (IBBSS 2007)        (IBBSS 2007)     17.5% (Male
                                                                                Sex Workers)    17.5% (Male
                                                                                44.8% (Female   Sex Workers)
                                                                                Sex Workers)    44.8% (Female
Percentage of sex workers who are living   32.7% (Female       32.7% (Female    24.5%(Male &    Sex Workers)&
                                                                                                24.5%(Male
with HIV                                   Sex workers only)   Sex workers      Female Sex      Female Sex
                                           (IBBSS 2007)        only)            Workers)        Workers)
                                                               (IBBSS 2007)     18.6% (Male
                                                                                sex workers)    18.6% (Male
                                                                                25.2% (Female   sex workers)
                                                                                Sex Workers)    25.2% (Female
                                                                                (IBBSS 2007)    Sex Workers)
                                                                                                (IBBSS 2007)
Men who have sex with men
Percentage of men who have sex with        54.38%              54.38%           17.99%          17.99%
men reached with HIV prevention            (IBBSS 2007)        (IBBSS 2007)     (IBBSS 2010)    (IBBSS 2010)
programmes

Percentage of men reporting the use of a   52.79%              52.79%           50.97%          50.97%
condom the last time they had anal sex     (IBBSS 2007)        (IBBSS 2007)     (IBBSS 2010)    (IBBSS 2010)
with a male partner
Percentage of men who have sex with 30.15% 30.15% 24.92% 24.92%
men that have received an HIV test in the (IBBSS 2007) (IBBSS 2007) (IBBSS 2010) (IBBSS 2010)
past 12 months and know their results
Target 2: Reduce transmission of HIV among people who inject drugs by 50 per cent by 2015
Number of syringes distributed per Not Available Not Available Not Available Not available
person who injects drugs per year by
needle and syringe programmes
Percentage of people who inject drugs 66.1% 66.2% 52.5% 52.5%
who report the use of a condom at last (IBBSS 2007) (IBBSS 2007) (IBBSS 2010) (IBBSS 2010)
sexual intercourse
Percentage of people who inject drugs 89.2% 89.2% 70.89% 70.89%
who reported using sterile injecting (IBBSS 2007) (IBBSS 2007) (IBBSS 2010) (IBBSS 2010)
equipment the last time they injected
Percentage of people who inject drugs 23.19% 23.19% 19.42% 19.42%
that have received an HIV test in the past (IBBSS 2007) (IBBSS 2007) (IBBSS 2010) (IBBSS 2010)
12 months and know their results
Percentage of people who inject drugs 5.6% 5.6% 4.2% 4.2%
who are living with HIV (IBBSS 2007) (IBBSS 2007) (IBBSS 2010) (IBBSS 2010)
Target 3: Eliminate mother‐to‐child transmission of HIV by 2015 and substantially reduce AIDS related
maternal deaths
15 Percentage of HIV-positive pregnant 5.25% (NNRIMS 21.6% 15.9% 30.1%
women who receive antiretroviral to Data Base) (FMOH 2009) (FMOH 2011)
reduce the risk of mother-to-child (FMOH 2013)
transmission
Percentage of infants born to HIV- Not Available Not Available 4.0% 3.9%
positive women receiving a virological (FMOH 2011)
test for HIV within 2 months of birth (FMOH 2013)
Mother-to-child transmission of HIV -- 29.1% 19.8% 27.3%
(modelled) (2010 Spectrum (2011 Spectrum (2014 Spectrum
Modelling) Modelling) Modelling)
Target 4: Have 15 million people living with HIV on antiretroviral treatment by 2015
Percentage of eligible adults and children 16.67% 34.4% 29.8% 19.8%
currently receiving antiretroviral therapy (NNRIMS Data (FMOH 2009) (FMOH 2011)
Base) (FMOH 2013)
Percentage of adults and children with 94.56% 70% 73.4% 81.0%
HIV known to be on treatment 12 (ICAP (FMOH 2009) (FMOH 2011)
months after initiation of antiretroviral Programme (FMOH 2013)
therapy Record)
Target 5: Reduce tuberculosis deaths in people living with HIV by 50 per cent by 2015
Percentage of estimated HIV-positive 55.95% (NTBLCP- 69.1% ------------- 28.1%
incident TB cases that received treatment Programme Data) (FMOH 2009)
for both TB and HIV NTBLCP(2013)
Target 6: Reach a significant level of annual global expenditure (US$22‐24 billion) in low‐ and middle‐
income countries
Domestic and international AIDS US$42,275,977.57 US$ 394,963,881 US$497,817,471 US$574,310,06
spending by categories and financing (NASA) (NASA 2008) (NASA 2010 ) 2
Sources (NASA 2012
expenditure)
Target 7: Critical Enablers and Synergies with Development Sectors
National Commitments and Policy Refer to CRIS Refer to Online Refer to Online Refer to Online
Instruments (prevention, treatment, care UNGASS GARP GARP
and support, human rights, civil society Reporting Reporting Reporting
involvement, gender, workplace Template Template Template
programmes, stigma and discrimination
and monitoring and evaluation)Proportion of ever-married or partnered ------------ ------------ 17.5% 17.5%
women aged 15-49 who experienced (NDHS 2008) (NDHS 2008)
physical or sexual violence from a male
intimate partner in the past 12 months
Current school attendance among Orphans:75%, OVC: 83.9% OVC: 83.9% OVC: 83.9%
orphans and non-orphans aged 10–14* Non- Non-OVC:71.7% Non- Non
Orphans:87% OVC:71.7% OVC:71.7%
(CRS 2006 OVC
Situational (NDHS 2008) (NDHS 2008) (NDHS 2008)
Analysis)
Proportion of the poorest households Not available Not available Not available Not available
who received external economic support
in the last 3 months
16Section Two: Overview of the Epidemic
HIV Prevalence
The first case of AIDS in Nigeria was reported in 1986 thus establishing the presence
of the epidemic in the country. Consequently, and in line with WHO guidelines, the
government adopted ANC sentinel surveillance as the system for assessing the
epidemic. Between 1991 and 2001, Nigeria witnessed an increase in the prevalence
of HIV in the country. The first HIV Sentinel Survey in 1991 showed a
prevalence of 1.8%. Subsequent sentinel surveys produced prevalence of
3.8% (1993), 4.5% (1996), 5.4% (1999), 5.8% (2001), 5.0% (2003), 4.4% (2005),
4.6% (2008) and 4.1 %( 2010). The National HIV/AIDS and Reproductive Health
Survey (NARHS) was adopted in 2003 to provide information on key HIV/AIDS and
Reproductive Health knowledge and behaviour-related issues. In 2007, the scope was
expanded to include estimation of HIV prevalence in the country. A more
comprehensive survey was conducted in 2012, (NARHS plus II 2012) which showed a
decline to 3.4% in HIV prevalence, indicating a reversal of the epidemic in the
country, compared to the 2007 figure of 3.6%.
Nigeria’s epidemic is generalized, with wide variation in prevalence within the country.
An analysis of the 2012 NARHS prevalence data in the country’s six geopolitical zones
shows that the prevalence is highest in the South South Zone (5.5%) while the lowest
prevalence is in the South East Zone at 1.8%. There are also differences between urban
and rural areas with prevalence figures in urban 3% and 4% in rural area. The pattern of
distribution of HIV prevalence by sex showed that irrespective of sex disaggregation,
the HIV prevalence pattern is the same across all selected background characteristics.
Socio-demographic differences in t h e H IV p r e v a l e n c e are also o b s e r v a b l e
with women, youths, and people with low level of formal education being worst
affected by the epidemic. NARHS plus 2012 showed an increase from 1.7% in 2007 to
2.9% in 2012 in the 15-19 years age group while the prevalence for the age category
(20-24) for both years remain the same with a value of 3.2%.
17 Nigeria is the most populated country in sub- Saharan Africa, a r e g i o n w h i c h
c a r r i e s the g l o b e ’ s heaviest burden of H I V /AIDS. In estimated numbers
this represents about 3,229,757 still keeping Nigeria as the country with the second
highest burden of HIV in the world, only after South Africa. The number of persons
requiring ART stands at 1, 476, 741 in 2013 out of which 639,397 are currently
receiving treatment.
Based on spectrum estimates for 2013, the number of new infections, annual AIDS
death stands at 210,031.
.
Figure 1- National median HIV prevalence trend in ANC 1991-2010
HIV Prevalence by Age
According to the NARHS 2012 data, the HIV prevalence was highest among 35-39 age
group with a prevalence of 4.4 while 40-44 and 15-19 age groups had the lowest
prevalence of 2.9%.
18 Figure 2: HIV Prevalence by age and sex
Patterns observed in the previous population based survey (NARHS 2007) shows
that gender inequality is an important driver for the H I V / A I D S epidemic.
Prevalence rates were generally higher among females (4.0%) than m a l e s
(3.2%) in 2007. In 2012 even though there was a drop in prevalence it was still higher
among females (3.5%) than males (3.3%). Findings also showed higher early
vulnerability and infections for girls and women relative to boys and men.
HIV Prevalence by Geopolitical Zones and States
When 2007 data was compared with 2012 it was observed that while the HIV prevalence
decreased in the North-Central, South-East and South-West Zones respectively it
increased in the three other zones: South-South, North-East and North-West.
19 Figure 3: HIV Prevalence by zones and national
Fourteen states reported a prevalence that was higher than the national prevalence of
3.0% while nine other states had a low prevalence ranging 0.2 to 0.9%. The four
states with the highest prevalence were Rivers (15.2%), Taraba (10.5%), Kaduna (9.2%)
and Nassarawa (8.1%) respectively. Ten States have prevalence ranging from 3.3% - 6.5%.
Ekiti state has the lowest prevalence among the states in the country.
22 Figure 4 - Geographic Distribution of HIV Prevalence by States
Sokoto
Katsina Yobe
Jigawa
Kebbi Zamfara Borno
Kano
Kaduna Bauchi Gombe
Niger
Plateau Adamawa
Kwara FCT
Nassarawa
Oyo
Taraba
Ekiti Kogi Legend
Osun
Benue < 0.21
Ogun Ondo
0.21 - 1.10
Lagos Edo Enugu 1.10 - 3.00
Anambra Ebonyi
3.01 - 8.00
Cross River
>8.00
Delta Imo Abia
Akwa Ibom
Bayelsa Rivers
22 Across the country, urban prevalence is higher than rural in all six geopolitical
zones. Similarly, urban prevalence was found to be higher in twenty eight states and
FCT with the remaining eight states having higher rural prevalence.
Figure 5: HIV Prevalence by states (NARHS 2012)
22 HIV Prevalence among Most-at-Risk-Populations
Based on comparison between IBBSS 2010 data for high risk groups and
NARHS 2012 data for the general population, it is observed that key target
populations or MARPS have a significantly higher prevalence than the
general population. At the top of this group are the brothel-based female sex
workers (BBFSW), with a current estimated prevalence of 27.4%. Non-brothel based
female sex workers (NBBFSW) rank next with an estimated prevalence of 21.7%,
followed by men who have sex with men with an estimated prevalence of 17.2%.
While the HIV prevalence among FSW and transport workers is reducing, the
prevalence is increasing among MSM: from 13.5% (2007) to 17.4% (2010).
Figure 6 - HIV Prevalence trend among MARPS (IBBSS 2007 & 2010)
HIV Incidence
New Infections
Recent estimates indicate that the annual number of new infections in the country has
been on a steady decline, decreasing from 288,870 in 2009 to 283,589 in 2010 and then
slightly again to 274,367 in 2011. Similarly, it decreased to 239,706 in 2012 and
eventually 220,394 in 2013. The total number of new infections in females continued
to surpass that of the males.
22 Table 3 - Trends in estimated new HIV infections 2009 to 2013
Female Male Total
2009 157,976 130,893 288,869
2010 154,973 128,616 283,589
2011 149,864 124,504 274,368
2012 130,497 109,209 239,706
2013 120,003 100,390 220,393
Among young people age 15-24 the estimated number of new HIV infections showed
similar trends. The number of new HIV infections dropped from 74,783 in 2009 to 72,814
in 2010 and 70, 0992 in 2011. A further drop occurred with new infections estimated at
59,739 in 2012 and 54662 in 2013 respectively. Similarly the estimates showed that more
of the new infections occurred among young women age 15-24 than their male
counterparts.
Figure 7: Trends in estimated number of new HIV infections among young people
age 15-24 years
Transmission of HIV Infection
According to the mode of transmission studies conducted in 2008, majority of the
infections occurring in Nigeria are due to HIV transmission within the general
population. The bulk of the new infections occur in persons who are not engaging in
high risk sex, a sub-population that includes cohabiting or married sexual partners.
Two-fifths (42%) of the infections occur amongst persons practicing ‘low-risk’ sex.
Because condom use in this group tends to be particularly low, infection acquired as a
result of the previous / present high risk behaviors or relationships by one of the sex
partners is easily transmitted to the unsuspecting partner.
However, the high risk groups still contribute a significant proportion of the new
infections. Directly, Female Sex Workers, IDUs and MSMs alone, who constitute about
23 1% of the adult population, contribute as much as almost 23% of new HIV infections.
These most-at-risk- population groups and their partners contribute as much as
40% of new infections, a population that makes up only about 3.4% of the adult
population. Half of the infections contributed by MARPs and their partners are
attributed to female sex workers, their clients and clients’ partners alone, highlighting
a profound need for programmatic response focus on this sub-population group.
MSMs and IDUs and their partners contribute about 10% and 9% respectively of the
annual new infections. Targeting these groups will be significantly beneficial to
reversing the spread of the epidemic in Nigeria. Notwithstanding the clarity of this
need, there still remain enormous hurdles to mounting an effective response targeted at
slowing down the transmission of HIV through these groups. These include the
presence of policy and regulatory barriers that prevent engagement and recognition of
these groups, increasing stigma and discrimination and threatening all efforts made at
providing effective prevention, treatment, care and support for them.
Figure 8 - Distribution of New Infections by mode of exposure
24 Impact of HIV/AIDS on Children
Children are affected by HIV/AIDS through mother to child transmission
infection or through the loss of one or both parents from AIDS. The 2008 National
Situation Assessment and Analysis (SAA) on OVC showed that HIV/ AIDS h a s been a
major cause of death of parents (especially in households where both parents have died).
Also, loss of parents may lead to social and economic vulnerability. When parents fall
chronically ill from AIDS, children migrate between households. Many of the
households taking on these children find it difficult to afford their support. Of 17.5
million vulnerable children, an estimated 7.3 million have lost one or both parents
due to various causes. Of these, 2.23 million were orphaned by HIV/AIDS, while
about 260,000 children are living with HIV/AIDS. About 20.3% OVC are not regular
school attendant, and 18% have been victims of sexual abuse.
25 Section Three: National Response to the Epidemic
A. Policy and Framework
The first case of AIDS was reported in 1986 in Nigeria. This necessitated the creation of the
National Expert Advisory Committee on AIDS (NEACA), Nigeria’s first national response
to HIV/AIDS Epidemic in 1987. This was soon followed with the establishment of the
National AIDS and STI Control Program (NASCP) in the Federal Ministry of Health in
1988. Though it was an improvement, NASCP was essentially a health sector response.
Following the advent of democratic rule in 1999, a Presidential Committee on AIDS
(PCA) and the National Action Committee on AIDS (NACA) were established in 2001 to
coordinate the multi-sectoral response at the federal level. This represented the crucial
point that domestic political acknowledgement of the diseases begun in earnest. Six years
later, NACA was transformed into an agency - the National Agency for the Control of
AIDS (NACA) to further strengthen its coordinating role and ensure a multisectoral
response to the epidemic established and sustained. NACA oversees the activities of the
State Action Committee on AIDS (SACA) and Local Government Action Committee on
AIDS (LACA) that coordinate response at the sub-national levels.
As a mechanism to enhance harmonization and effectiveness of the national HIV/AIDS
response, the “three ones” principle was adopted in 2005. NACA being the coordinating
body for HIV National response utilizes one National Strategic Framework (NSF),
and one Monitoring and Evaluation system - Nigeria National Response Information
Management System (NNRIMS). All these are operationally in line with the three ones
principle.
The first National Strategic Framework (NSF) for action tagged NSF 2005-2009 was
implemented following the review and expiration of the HIV/AIDS Emergency Action Plan
(HEAP) 2001-2013 in 2004/2005. The expiration of NSF 2005-2009 provided yet another
opportunity to review the national response with a view to deploying new strategies to
ensure the attainment of the national development goals and objectives. This is designed to
reposition the prevention of new HIV infections as the major focus of the national
HIV/AIDS response, for the National HIV/AIDS Strategic Plan (NSP) 2010-2015.
The NSP 2010-2015 aligns with key priorities outlined in the poverty reduction strategy
for Nigeria (Nigeria Vision 20:2020) and the National HIV Policy. As a resource
mobilization tool for the national response, it will help achieve universal access to HIV
prevention, treatment, care and support and the Millennium Development Goal six on
HIV in Nigeria.
The key HIV/AIDS priorities of the NSP 2010-2015 are related to the thematic areas
identified by the National HIV/AIDS Policy 2010-2015. These areas are:
• Promotion of Behavior Change and Prevention of New HIV Infections
• Treatment of HIV/AIDS and Related Health Conditions
• Care and Support of PLHIV, PABA, and OVC
• Policy, Advocacy, Human Rights, and Legal Issues
• Institutional Architecture, Systems, Coordination, and Resources
26 You can also read