What is driving the HIV/AIDS epidemic in Swaziland, and what more can we do about it?
←
→
Page content transcription
If your browser does not render page correctly, please read the page content below
What is driving the HIV/AIDS epidemic in Swaziland,
and what more can we do about it?

                              Final report prepared
                                  by Alan Whiteside
                                 with Alison Hickey
                              Nkosinathi Ngcobo &
                                      Jane Tomlinson

for the
National Emergency Response Committee on HIV/AIDS (NERCHA)
and United Nations Programme on HIV/AIDS (UNAIDS)

                                                   April 2003
National Emergency Response Committee on HIV/AIDS (NERCHA)
P.O Box 1937, Mbabane, Swaziland
Tel: +268 404 1703/8
+268 404 1720/6
Fax: +268 404 1692
Email: info@nercha.org.sz
Health Economics & HIV/AIDS Research Division (HEARD)
Room 907, Shepstone Building, University of Natal, Durban
Tel: +27 (0) 31 260 2592
Fax: +27 (0) 31 260 2587
Email: freeman@nu.ac.za
www.heard.org.za
2Contents
Executive Summary . . . . . . . . . . . . . . . . . . . . . . . . . . . . . . . . . . . . . . . . . . . . .4
Background to the Report and the HIV/AIDS epidemic in Swaziland . . . . . .6
Purpose and methodology of the report . . . . . . . . . . . . . . . . . . . . . . . . . . . . . . .7
Basic epidemiology . . . . . . . . . . . . . . . . . . . . . . . . . . . . . . . . . . . . . . . . . . . . . . . .8
Are the data credible? . . . . . . . . . . . . . . . . . . . . . . . . . . . . . . . . . . . . . . . . . . . . . . .10
Is Swaziland unique in the region? . . . . . . . . . . . . . . . . . . . . . . . . . . . . . . . . . . . . . .11
What we expect to happen – the natural history of HIV . . . . . . . . . . . . . . . . . . . .13
The Drivers of the epidemic . . . . . . . . . . . . . . . . . . . . . . . . . . . . . . . . . . . . .17
Biologic and behavioural drivers . . . . . . . . . . . . . . . . . . . . . . . . . . . . . . . . . . . . . . .17
The age and gender structure of the population. . . . . . . . . . . . . . . . . . . . . . . . .19
Sexually transmitted infections . . . . . . . . . . . . . . . . . . . . . . . . . . . . . . . . . . . . . .20
Knowledge of HIV . . . . . . . . . . . . . . . . . . . . . . . . . . . . . . . . . . . . . . . . . . . . . . .22
Sexual behaviours among youth . . . . . . . . . . . . . . . . . . . . . . . . . . . . . . . . . . . . .23
Condom use . . . . . . . . . . . . . . . . . . . . . . . . . . . . . . . . . . . . . . . . . . . . . . . . . . .26
Socio-economic drivers . . . . . . . . . . . . . . . . . . . . . . . . . . . . . . . . . . . . . . . . . . . . . .26
Culture and women’s status . . . . . . . . . . . . . . . . . . . . . . . . . . . . . . . . . . . . . . . .26
Social norms . . . . . . . . . . . . . . . . . . . . . . . . . . . . . . . . . . . . . . . . . . . . . . . . . . .28
Poverty and inequality . . . . . . . . . . . . . . . . . . . . . . . . . . . . . . . . . . . . . . . . . . . .29
Food production . . . . . . . . . . . . . . . . . . . . . . . . . . . . . . . . . . . . . . . . . . . . . . . .31
Mobility . . . . . . . . . . . . . . . . . . . . . . . . . . . . . . . . . . . . . . . . . . . . . . . . . . . . . . .32
The Swazi economy . . . . . . . . . . . . . . . . . . . . . . . . . . . . . . . . . . . . . . . . . . . . . .33
Transition . . . . . . . . . . . . . . . . . . . . . . . . . . . . . . . . . . . . . . . . . . . . . . . . . . . . . .35
Impact: what we know . . . . . . . . . . . . . . . . . . . . . . . . . . . . . . . . . . . . . . . . . .37
Health care . . . . . . . . . . . . . . . . . . . . . . . . . . . . . . . . . . . . . . . . . . . . . . . . . . . . . . .38
Increasing mortality . . . . . . . . . . . . . . . . . . . . . . . . . . . . . . . . . . . . . . . . . . . . . . . . .38
Central Agencies . . . . . . . . . . . . . . . . . . . . . . . . . . . . . . . . . . . . . . . . . . . . . . . . . . .38
Education Ministry . . . . . . . . . . . . . . . . . . . . . . . . . . . . . . . . . . . . . . . . . . . . . . . . .39
Agriculture and the private sector . . . . . . . . . . . . . . . . . . . . . . . . . . . . . . . . . . . . .40
Orphans and vulnerable children . . . . . . . . . . . . . . . . . . . . . . . . . . . . . . . . . . . . . . .41
Innovative responses . . . . . . . . . . . . . . . . . . . . . . . . . . . . . . . . . . . . . . . . . . .43
Conclusion . . . . . . . . . . . . . . . . . . . . . . . . . . . . . . . . . . . . . . . . . . . . . . . . . . .47
Appendix 1 Summary of the 7th March, 2003 Workshop . . . . . . . . . . . . . . .48
Appendix 2 Material provided for review (in chronological
order – most recent first) . . . . . . . . . . . . . . . . . . . . . . . . . . . . . .52
Endnotes . . . . . . . . . . . . . . . . . . . . . . . . . . . . . . . . . . . . . . . . . . . . . . . . . . . . .56
3Executive Summary
S waziland is hard hit by the HIV/AIDS pandemic. Various forms of intervention
strategies have been adopted by the government as well as civil society to
combat the spread of the pandemic and deal with its consequences. However, little
change in the trajectory of HIV prevalence has been observed thus far.
This report reviews the documents on behaviour and the epidemic in Swaziland
in an attempt to establish what is driving the epidemic. It asks ‘What is driving the
HIV/AIDS epidemic in Swaziland? What more can we do about it?’ The questions
posed were:
■ Why is HIV prevalence in Swaziland so high?
■ What can be done about it?
■ What are the innovative responses?
In the first part we look at the basic epidemiology and the data from Swaziland.
Are the data – showing very high levels of HIV prevalence in Swaziland – correct? The
surveys are excellent and we believe that they do indeed reflect the reality in Swaziland.
The second question is ‘how unique is the national epidemic?’ Here the evidence is that,
with the exception of Southern Mozambique the data show Swaziland to be on a par
with other countries and provinces in the region. However what makes Swaziland
unique is that prevalence rates seem to vary little between rural and urban areas and
districts. Will it get worse? The evidence suggests that HIV prevalence rates may be
reaching a plateau, but in all likelihood there will be a rise of a few more percentage
points.
The second section looks at the drivers of the epidemic. Here we examine
biologic and behavioural drivers then go on to look at socio-economic drivers.
Swaziland’s population is youthful, which means that the epidemic will have an inbuilt
momentum and prevention efforts will have to be maintained for the youth. There
seems to be a high level of sexually transmitted infections and this will aid the spread
of HIV. However there is a lack of information on this and it is an area for further
research.
While the level of knowledge is generally good, people feel that they do not
know enough, and there is confusion about some things. In addition material is needed
in SiSwati. The most striking finding is that in-school youth have low levels of sexual
activity (70% are not sexually active); the converse is true for out-of-school youth (more
than 70% are sexually active). The lack of employment and recreational opportunities
are also highlighted. While apparent levels of condom use are high, the report notes
that condom promotion alone is not enough to stop the epidemic (it was certainly not
in Uganda – the one success we have).
4The social drivers include culture and women’s status. This was strongly
emphasised at the workshop we held, but very little is written on the role of culture.
We feel that this is a very sensitive area which requires involvement and empowerment
by Swazi people. There are other factors of importance in Swaziland, including poverty,
inequality and mobility. At the moment the economy is going through a very difficult
stage and this will contribute to the spread of HIV. We note that it is times of transition
that are most problematic.
The report reviews the few recent studies of the impact of AIDS in Swaziland and
notes the gaping hole – the lack of assessment of what AIDS means for the health sector.
Finally it concludes by looking at drivers of Uganda’s success and implications of this
for Swaziland.
Our conclusion is that the epidemic in Swaziland is very serious, but we know
what is going on. There are some gaps in the research that need to be addressed but
there is enough information available now to act. The workshop we held confirmed this.
The biggest issues are around poverty and culture. The issue of culture needs to be
addressed squarely but sensitively and by the Swazi people. There are signs of hope. The
activities of National Emergency Response Committee on HIV/AIDS (NERCHA) and
the participants at our workshop were evidence of a unique and exciting mobilisation.
This is one of the things that will make a difference.
5Background to the Report and
the HIV/AIDS epidemic in
Swaziland
T he first HIV infection was identified in Swaziland in 1986. The government
responded by establishing the National AIDS Prevention and Control
Programme (NAPCP), later renamed the Swaziland National AIDS/STI Programme
(SNAP), with support from the WHO’s Global Programme on AIDS. By the end of the
1990’s a standard package of interventions had been put in place. As in most countries
this was done through the Short Term Plans which evolved into Medium Term Plans.
The interventions included mandatory screening of all donated blood; information,
education and communication programmes (IEC); condom promotion and distribution;
and the establishment of AIDS Information and Support Centres.
For the first seven years of the epidemic the main source of data was notified
AIDS cases and there was a steady increase from the earliest AIDS case in 1987 to over
150 in 1993. In 1992 the original national survey of women attending ante-natal
clinics (ANC) was carried out, and HIV prevalence in this group was found to be 3.9
per cent. In 1994 prevalence was 16.1 per cent. Since then surveys have been carried
out every two years. The most recent data, from the 2002 survey, gives an HIV
prevalence of 38.6 per cent among ANC attenders.
The response to the epidemic has been in accordance with international norms,
and indeed in many cases has gone beyond them. As early as 1993 the NACP conducted
a one-day retreat for the Cabinet at which a commitment was made to fight the disease.
Swaziland was one of the earliest countries to make mention of HIV in its national
development plans; it was the first to commission a study on the socio-economic impact
of HIV/AIDS; and one of the senior government and diplomatic officials was open
about his HIV status and the need for behaviour change as early as the mid-1990s.
The inexorable rise in HIV prevalence led to new measures. In 1998 a new
HIV/AIDS policy was developed and approved by Cabinet. This policy focuses on the
three components: prevention, care and support, and impact mitigation. In February
1999, His Majesty King Mswati III declared HIV/AIDS a national disaster. Two new
committees: the Cabinet Committee on HIV/AIDS; and the Crisis Management and
Technical Committee were created and launched. The Economic and Social Reform
Agenda (ESRA) recognised the threat posed by the epidemic.
The response went beyond government with programmes being initiated by the
private sector, NGO’s, religious groups and communities. The donor agencies have
6been extremely concerned about the epidemic since the earliest years and money has
been made available. The constraint (except in treatment and care) is not money but
capacity, bureaucracy and innovative ideas on where to spend it.
In 2001 the National Emergency Response Committee on HIV/AIDS
(NERCHA) was created and is mandated to coordinate and mobilize resources for an
expanded, scaled up and coordinated response in the country.
In early 2003 Swaziland was awarded two grants by the Global Fund for AIDS, TB
and Malaria. The total award (over 5 years) is for $56,736,900 but funding is only
guaranteed for the first two years and this totals $30,610,400. Disbursement of the
balance will be dependent on the Global Fund attracting additional donor commitments.
Purpose and methodology of the Report
Given the response documented above, there are three key questions:
1. Why is HIV prevalence in Swaziland so high?
2. What can be done about it?
3. What are the innovative responses?
This report was compiled in two stages. A draft was prepared using material collected
by UNAIDS and NERCHA in Swaziland, documents in the HEARD resource centre, and
information collected through literature searches in other data bases and on the web.
The aim of the study as set out in the terms of reference was to:
…comprehensively and critically analyse and synthesize HIV/AIDS/STI/TB
and reproductive heath studies to establish critical issues and indicators that
may explain the driving forces of the epidemic and trends, both biological and
behavioural. The purpose of the review will be to assist NERCHA in the design
of their programmes; understanding who and how to target and grasping the
systemic interdependent nature of the epidemic. The review will address the
issues of prevention; care and mitigation. The framework for analysis will be
that developed by Professors Whiteside and Barnett over a number of years. In
addition the review will identify the gaps in information and the critical
research questions or areas that need to be addressed.
7The terms of reference were agreed in January 2003. Following the literature
review a draft paper was prepared describing the epidemic in Swaziland – what is
driving it and what needs to be done. This submitted and circulated in early March
and presented at a workshop on Friday 7th March in Swaziland. During the
workshop the participants were asked to comment on what was missing from the
report, both in terms of information they knew about that had been excluded and
what other information they would have liked to have seen. The second task was to
identify the drivers of the epidemic in Swaziland. Participants were not asked to
identify interventions, but simply to discuss and report on the key drivers. The final
draft was presented in Swaziland at NERCHA on Thursday 3rd April 2003. At this
meeting the text and content of this the final version was agreed. This was followed
by a meeting on innovative interventions, which is written up separately.
At the March meeting the participants noted the differences in sample size,
type of questions, level of analysis and methodology of the different studies
synthesised in the report (and listed in the appendix). It was made clear that the
purpose of this study is to synthesize what is known and draw out lessons about the
drivers of the epidemic. A separate document, available from NERCHA, summarises
all the reports accessed 1 .
Basic epidemiology
Any epidemic will follow a similar pattern: a few initial cases followed by further
spread until the epidemic peaks at the point when all those who are susceptible to
infection have been infected. Then as people recover or die the epidemic curve turns
down. An HIV curve is different because people do not recover – they will remain
in the pool of HIV positive people until they die. This is important because it means
that prevalence (the number of people infected in the population at a given time,
expressed as a per cent) may be stable, while the incidence (the number of new
infections) remains high. This will happen if the number of new infections equals
the number of deaths.
What also sets HIV and AIDS apart from other epidemics is that there are
two curves, as shown in Figure 1. With most other diseases, infection is followed by
illness within a few days, or at most weeks. In the case of HIV the infection curve
precedes the AIDS curve by between five to eight years. This reflects the long
incubation period between infection and the onset of illness. This is why HIV/AIDS
is such a lethal epidemic compared to, say, cholera. In the latter case, victims of the
disease quickly and visibly fall ill, putting the general population and public health
professionals on their guard. In addition the incubation period prolongs the time
when HIV-infected people may unwittingly spread the infection.
1. Available from National Emergency Response Committee on HIV/AIDS (NERCHA)
Contact person: Dr Dereck von Wissel: dvwi@nercha.org.sz
8Figure 1:The two epidemic curves
Numbers
HIV
A1 A2
A
AIDS
B B1
T1 T2 Time
HIV infection moves through a population giving little sign of its presence. It is
only later – when substantial numbers are infected – that the number of deaths from
AIDS begins to rise. People do not leave the infected pool by getting better as there is
no cure. They leave by dying (of AIDS or other causes). Figure 1 illustrates this. The
vertical axis represents numbers of infections or cases of illness: the horizontal axis
shows time. At time T1, when the level of HIV is at A1, the cumulative number of
AIDS cases and deaths will be very much lower, at B1. AIDS cases will only reach A2
(i.e. the same level as A1) at time T2. By then years will have passed and the numbers
of people who are infected with HIV will have risen even higher. A third line can be
drawn on the graph to the right of the HIV prevalence and AIDS case lines to represent
the various impacts that take even longer to evolve.
The figure also shows that while prevention efforts may aim to lower the number
of new infections, the reality is that - without affordable and effective treatment - AIDS
case numbers and deaths will continue to increase after the HIV tide of new infections
has been turned.
Beyond the point T2, the lines are hatched. This is because we do not know how
either the HIV or the AIDS curves will proceed. Uganda and Thailand are the only
9countries where national HIV prevalence and incidence has peaked and turned down.
Figure 1 shows an epidemic curve. But a national epidemic is made up of many sub-
epidemics, with different gradients and peaks. These sub-epidemics vary geographically
and in terms of their distribution among social or economic groups. Often there is little
data on the sub-epidemics, but in Swaziland we have some information that will be
discussed.
The data we have from Southern Africa shows that the majority of infections are
transmitted through heterosexual intercourse. The next major category of infection is
from mother to infant. Some infections occur due to unsafe medical practices both
western and traditional contaminated blood and from patient to carer. This is a
relatively small source of transmission, although there have been a number of recent
articles on it and the WHO is planning a meeting on the topic.2 While it may not be
an issue in Swaziland it points to the need to ensure provision of safe blood supplies,
prevent use of unsafe needles, and address related issues of medical safety. Carers
providing home-based care need basic safety equipment.
Are the data credible?
Do the data reflect the true scale of HIV infection in Swaziland? Is the epidemic as
serious as they suggest?
First we need to look at the data collection and analysis and ask if this is in
accordance with good epidemiological sampling and statistical principles. The
antenatal survey in Swaziland is conducted in accordance with global best standards.
The survey methodology is described in Chapter 4 of the report and it cannot be
faulted.3 For example, it was estimated that a total of 2157 samples would be needed
in order to give 95% confidence intervals; in the event 2787 samples were collected.
The World Health Organisation only requires one ELISA test for surveys, but in
Swaziland, where a sample was positive, an additional test was carried out to confirm
the result.
We conclude that the survey provides sound information on HIV prevalence
among pregnant women in Swaziland, and the trends over the period since 1992 are
clear.
To what extent can these data be a proxy for the general population? As the 2002
survey notes:
The use of pregnant mothers attending antenatal clinics raises issues on the
representativeness of this sentinel population to the general population or even
women in general. Sentinel surveillance in ANC clinics has an inherent
selection bias against women using modern contraceptives. Women who have
adopted safer sexual behaviours such as consistent condom use are unlikely to
10become pregnant and therefore not attend antenatal care. Women with
infertility are not likely to be captured in the ANC clinics. Infertility caused
by STIs would tend to result in an underestimation of HIV prevalence rates
especially in the older age groups where infertility is most common. However,
infertility due to STIs and HIV are unlikely to affect the HIV prevalence rates
in the young age groups 15-19 years. Fortunately enough the ANC based data
has been found to closely reflect the HIV prevalence in the reproductive age
group. (p.21)
Certainly in the rest of southern Africa these data are accepted as providing a
good measure of what is going on in the general adult population. Indeed a concern is
that ANC data may underestimate HIV prevalence in more mature epidemics because
of falling fertility among HIV positive women. A recent study by the Royal Swazi
Sugar Corporation (RSSC) of 4183 mainly male workers found HIV prevalence to be
37.5%. This survey used saliva tests and had a 60 per cent compliance. (personal
communication RSSC, February 2003). This suggests that the ANC data is
representative of infection rates in the adult Swazi population.
Although we believe that the quality of data on the HIV epidemic is among the
best globally, it was evident that other data are confusing. The prime example is the
projected population growth. The 1997 census data estimates population growth rate
at 2.6%, while the Health Statistics Unit Health Statistical Report 2000 gives
population growth as 3.2%.4 The Development Plan notes that population projections
do not incorporate the impact of HIV/AIDS, which the US Bureau of the Census
predicts will mean that the actual population will fall.5-6.
But as importantly people are confused about what is going on in Swazi society,
what the social norms are and should be. For example in a Knowledge, Attitudes and
Practice baseline study conducted by Family Life Association of Swaziland and
UNICEF 2001, 45% of youth self-reported as being sexually active but felt that 70%
of their friends were sexually active.7 Most parents thought youth engage in early
sexual activity (as evidenced by early pregnancy). These views are not in accordance
with other data we have thus providing further evidence that, although information
on the prevalence rate is reliable other statistical information is inconsistent or
confusing.
Is Swaziland unique in the region?
We accept the Swazi data as correct. The next question is whether Swaziland is unique
in the region in its epidemic trajectory. Comparative national data is available from
Botswana, Namibia, and South Africa, as well as data from border areas: southern
Mozambique, Mpumalanga and KwaZulu-Natal.
11Figure 2: National trends in HIV prevalence
45
40
35
30
25
20
15
10
5
0
01
91
92
93
94
95
97
98
99
90
00
02
96
20
19
19
19
19
19
19
19
19
19
20
20
19
Botswana South Africa
Namibia Swaziland
The release of the 2002 survey data puts Swaziland in the unenviable position of
having the second highest national ANC HIV prevalence in the world. Botswana is
first, but only just, with HIV prevalence of 38.8 per cent.8 The most recent data from
Zimbabwe and Lesotho indicate ANC HIV prevalence of over 35 per cent. In South
Africa there is considerable provincial variation. In the 2001 Survey HIV prevalence in
KwaZulu-Natal was 33.5 per cent (a slight decline on the 36 percent in previous years)
while in Mpumalanga it has consistently been about 29 per cent. The only location
with a significantly lower prevalence is Mozambique’s Maputo Province which adjoins
Swaziland, where HIV prevalence is 9 per cent.
We can therefore conclude that Swaziland is not unique in having these
astonishingly high national HIV prevalence rates. However the national rate masks
differences between sectors of the population. We must look at these data to understand
the drivers of the epidemic.
What is unique in Swaziland is how uniformly bad the epidemic is. There is
little difference between rural and urban areas and between districts (see Figure 3). This
is indicative of population mobility and close links between rural and urban areas in
12Swaziland. (See discussion below.) There is also little difference in HIV prevalence
between districts: Hhohho has the lowest level at 36.6%; and Manzini the highest at
41.2%. These are the richer and more urbanised districts while the poorer and more
rural districts of Lubombo and Shiselweni have prevalence rates of 38.5 and 37.9%
respectively.
Figure 3: HIV prevalence by urban/rural residence, 2000-2002
45
40 40.6%
35 35.6% 35.0%
32.7%
30
% 25
20
15
10
5
0
Urban Rural
2000
Residence
2002
What we expect to happen – the natural
history of HIV
The expectations in the early 1990s were that HIV prevalence would not exceed 25 per
cent. The most recent data confounds this. The June 2002 UNAIDS Global Report states:
Circulating in southern Africa (where the epidemic is the most severe in the
world) has been the hope that the epidemic may have reached its ‘natural limit’
beyond which it would not grow. Thus it has been assumed that the very high
prevalence rates in some countries have reached a plateau. If a natural HIV
prevalence limit does exist in these countries, it is considerably higher than
previously thought.9
13The December 2002 update states plaintively:
The worst of the epidemic clearly has not yet passed, even in southern Africa
where rampant epidemics are under way. In four southern African countries,
national adult HIV prevalence has risen higher than thought possible,
exceeding 30%: Botswana (38.8%), Lesotho (31%), Swaziland (33.4%)
and Zimbabwe (33.7%).10
The reality is that, as yet, there are no instances where national ANC HIV
prevalence has exceeded 40%. Where HIV prevalence has reached the high 30s there
seems to be a trend for the epidemic to plateau. It should be noted that there are
‘hotspots’ where ANC HIV prevalence has reached more than 60 per cent. (The highest
we are aware of was 70.7% prevalence in Chiredzi, a sugar plantation area in Zimbabwe
in 2000).11 The present data do not show any such ‘hotspots’ in Swaziland.
The national trend in HIV prevalence is shown in Figure 4 while Table 1 shows
the breakdown by region. (All data from the Ministry of Health and Social Welfare 8th
Sentinal Survey).
Figure 4: HIV prevalence among ANC respondents, 1992-2002
45
38.6
40
34.2
35 31.6
30
26
% 25
20
16.1
15
10
5 3.9
0
1992 1994 1996 1998 2000 2002
Year
14Table 1: HIV infection trends among ANC respondents by region,
1994-2002
Region HIV Prevalence (%)
1994 1996 1998 2000 2002
Hhohho 15.5 26.3 30.3 32.3 36.6
Lubombo 16.8 26.5 31.5 34.5 38.5
Manzini 15.6 27.7 34.8 41.0 41.2
Shiselweni 16.8 23.9 29.6 27.0 37.9
Unfortunately there is little good news in the data. Given that we measure
prevalence rather than incidence, an early indication of HIV being brought under
control would be in the data for the youngest ages. The data are shown in Table 2 and
Figure 5.
The increase in the 15–19 and 20–24 age groups shows that Swaziland still has
a long way to go in bringing the epidemic under control. And, significant for long-term
planning, there will be rise in illness and death until at least 2008. The long term
implications are considerable.
Table 2: HIV prevalence among ANC respondents by age group,
1994-2002
Age group HIV Prevalence (%)
in years
1994 1996 1998 2000 2002
15-19 17.8 24.1 25.6 26.3 32.5
20-24 18.8 32.3 38.4 42.5 45.4
25-29 14.3 27.2 38.0 40.7 47.7
30-34 10.8 21.7 24.8 29.7 29.6
35-39 9.1 11.0 21.8 17.0 23.9
40+ 18.3 11.7 25.7 26.9 25.0
Total 16.1 26.0 31.6 34.2 38.6
15Figure 5: HIV prevalence among ANC respondents by age group,
1994-2002
50
45
40
35
30
%
25
20
15
10
5
0 35-39 40+
15-19 20-24 25-29 30-34
Age group
1994
1996
1998
2000
2002
16The Drivers of the epidemic
W hy is the Swazi epidemic so bad? We will concentrate on the HIV/AIDS
epidemic resulting from sexual transmission between men and women.
Figure 6 shows the proximate and distal causes of the epidemic. 12
Biologic and behavioural drivers
In order for a person to be infected they need to be exposed to the virus. However
even then, exposure does not necessarily lead to infection. Sufficient virus particles
must penetrate the body’s defences and enter the blood for infection to gain hold.
There are a number of biological determinants:
■ At the early and later stages of the infection an HIV-positive person has more
viruses in their body fluids and this increases exposure of partners.
■ Women are more likely to be infected then men (semen enters their bodies and
remains there).
■ Younger women are more prone to infection as their virginal tracts are less
mature and more prone to tearing. Linked to this, violence also increases the
chance of infection especially for women.
■ There is a growing body of evidence that circumcised men are less likely to be
infected and thus infect their partners. (Circumcision is mainly protective if it
is carried out prior to sexual debuti).
■ The presence of other sexually transmitted infections greatly increases the
chance of HIV infection. First other STIs create a portal for entry for the HIV
virus. Second, the presence of other STIs concentrates the cells the HIV virus
targets for infection—at the point where the HIV virus enters a person’s body.
■ Poor nutrition and bad general health mean the body’s immune system is less
able to fight any infection, therefore the virus is more likely to gain a hold.13
In order for these factors to come into play, people have to have sex with a partner
(or partners) who are infected. If someone does not have sex or sticks to one uninfected
partner (who also is faithfulii to them) then they will not have sexual exposure. Here
there are a number of factors we need to consider. They include:
■ Number of partners: the more people a person has sex with, the more likely
they are to come into contact with someone with HIV.
i. There is a growing literature on this, but as circumcision is not practiced in Swaziland this
topic is not covered further.
ii. Terminology is fraught with difficulty, here faithful means does not have any other sexual
partners
17■ The rate of concurrent partnering: If a person has more than one partner at the same
time and if any of them are infected, this infection is more likely to be transmitted.
■ Sexual mixing patterns: A person who works in Mbabane, has a rural home in
Nhlangano, travels regularly to Durban and who has partners in each location
could spread any STI very rapidly and widely.
■ Some sexual practices are conducive to the spread of HIV. These include ‘dry
sex’ and sex with young partners. Other practices will help prevent its spread –
for example consistent, correct and regular use of condoms or late sexual debut.
Let us now review what we know about the biology, knowledge and behaviour
in Swaziland.
Figure 6: Proximal and distal ‘causes’ of sexual transmission of
HIV/AIDS14
Determinants Distal determinant Proximal determinants
Macro- Micro- Behaviour Biology
environment environment
Wealth or poverty Mobility Rate of partner Age
change
Income distribution Urbanisation Prevalence of Stage of
Education concurrent infection and
partners Virus sub-types
Culture Access to health Sexual mixing Presence of other
care patterns STIs
Religion Levels of violence Sexual practices Gender
and condom use
Governance Women’s rights Age of sexual
and status debut
Levels of sexual & Circumcision
physical abuse
Interventions Social policy Social Policy Behaviour change STI treatment
redistribution Economic Policy communication Condom
Legal Reform Legal Reform including: Promotion
Human Rights Employment Condom use Anti-retroviral
Taxation Legislation Delay sexual therapy during
Debt relief debut pregnancy
Terms of Trade Fewer partners Blood safety
Address abuse Post exposure
and violence prophylaxis
18The age and gender structure of the population
The Swaziland age pyramid and population data shows a youthful population.
According to the 1991 Demographic and Housing Survey, 43.5% of the population is
below 15 years old. This youthful population is reflected in the population pyramid
from the 1997 Census (see figure 7 below). This is a serious concern because it means
that without behaviour change, the potential for a sustained epidemic remains.
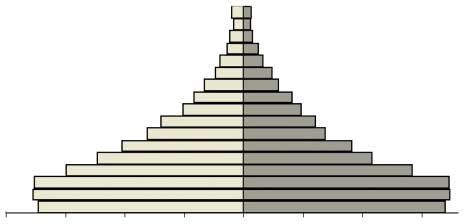
Figure 7: Swaziland population structure, 1997 census
80+
70-74
60-64
50-54
40-44
30-34
20-24
10-14
0-4
80 000 60 000 40 000 20 000 0 20 000 40 000 60 000 80 000
Males Females
The Swazi population pyramid shown in Figure 7 is typical of an African
population. The reasons for the decrease in 0-4 year olds are not known. However if this
pattern continues, AIDS mortality and decreasing fertility will be implicated. The large
number of people under the age of 25, clearly shown on the graph, means that HIV
spread will be maintained in the absence of effective interventions.
19Sexually transmitted infections
The literature reveals a consistently higher HIV prevalence among people with STIs. In
1992 HIV prevalence was 3.9% among ANC attenders and 11.1% among people with
STIs. The 2002 survey found that of those who tested positive for syphilis, 53% were
HIV positive; among those who tested negative for syphilis, 37.9% were HIV positive.
There is however a declining trend in syphilis prevalence. Since 1994 syphilis
prevalence among ANC attenders has fallen from 11.6% to 4.2.
Of greater concern for HIV transmission are ulcerative STIs. Here we do have
some recent data from the 2003 Behaviour Survey. This is shown on Table 3, for various
occupations and on Table 4, for in- and out-of-school youthiii.
Table 3: STI incidence and behaviours, by occupation, (%)
Military Police Seasonal Watch- Kombi Long Female Female
workers men Drivers & Distance Factory Sex
Assistants Drivers Workers Workers
Reported 12.1 6.5 10.0 4.8 4.3 5.7 14.7 16.1
STIs episode
in last 12
months
Sex with non 54.8 38.4 30.7 49.1 57.7 28.5 32.5 NA
non-regular
partner in
last 12
months
Condom use 59.4 73.2 29.9 59.8 59.8 57.1 48 60
at last sex
with non-
regular
partner
iii. For this National Behavioural Surveillance Survey (BSS), in-school youth aged 15-19 from
30 schools around the country were systematically sampled and interviewed. Out-of-school
youth were identified using a PPS sampling technique. Those aged 15-24 unmarried and not
cohabiting were selected from 90 Enumeration Areas (EAs) – 30 from each of the three
regions covered for in-school youth. (p.18 of the BSS report gives more details.)
20Table 4: Behaviour of in- and out-of-school youth by region
Male and female in-school youth
BSS indicators Hhohho Lubombo Manzini National
Ever had sex 26.8% 31.1% 28.6% 28.3%
86/321 37/119 151/525 274/967
Condom use at first sex 89.5% 59.5% 69.5% 74.5%
77/86* 22/37* 105/151 204/274
Reported episode of STIs in the 0 0.8% 0.8% 0.5%
last 12 months 0/321 1/119 4/528 5/968
Sex with non commercial sexual 13.7% 20.2% 24/119 15.9%
partners in the last 12 months 44/321 84/528 15.7% 152/968
Condom use with last non 96.1% 83.3% 83.3% 84.8%
commercial partner 44/321 20/24 71/84 129/152
Male and female out-of-school youth by region
Ever had sexual intercourse 73.3% 71% 64.6% 69.3%
328/448 489/689 413/639 1230/1776
Condom use at first sex 38.6% 33.3% 41.2% 37.3%
126/328 163/489 170/413 459/1230
Reported episode of STI in the 4.7% 7.4% 4.9% 5.8%
last 12 months 21/448 51/689 31/639 103/1776
Sex with non-commercial partner 52.7% 47.8% 48.4% 49.2%
in the last 12 months 236/448 329/689 309/639 874/1776
Condom use with last non 52.1% 41.6% 57% 49.9%
commercial partner 123/236 137/329 176/309 436/874
*Sample size too small for any meaningful inferences to be made.
21It is alarming to note the very high levels of STIs among female factory workers, female
sex workers, seasonal workers and the military and police. Clearly the evidence of the
fall in syphilis incidence among ANC attenders is hiding other problems. The
difference in the STI rates between in and out of school youth should also be noted.
Among youth in school, STI rates are negligible while STI rates are significant among
those not in school.
There is one other source of information on STIs that we were able to locate –
the Annual Statistical Bulletin. The most recent (1999) shows a small decline in
outpatient visits for genital disorders over the period 1997 to 1999.15 (The drop from
118 93 to 106 05 must be seen in the context of a decline in total outpatient visits from
1 485 685 in 1997 to 1 270 020 in 1999.) Workshop participants identified STIs as
one of the drivers of the epidemic in Swaziland, and there is little evidence to show that
STI infection is under control.
Knowledge of HIV
The data on knowledge around HIV is encouraging. A number of surveys have been
carried out – ranging from the 1991 Project Hope and Family Life Association of
Swaziland (FLAS) Knowledge, Attitudes and Practice study16 to the 2003 National
Behavioural Survey17 and the School HIV/Aids and Population Programme (SHAPE)
baseline study18.
In 1991 41% respondents with high media exposure claimed to know just a
little about AIDS, however knowledge about true modes of transmission was high (90-
97%). The sources of information on AIDS were ranked as follows: radio (90.4%), clinic
(36.9%), newspaper (30.4%), and T.V. (19.1%). Of the respondents 55% acknowledged
that AIDS is a serious disease, 70% viewed it as a current threat to the local community,
and 73% think it will become a threat, and mostly a serious threat in the future. The
ideas of how to avoid it were sound: 80% thought that it could be avoided by
behavioural change, 69% said they had made a change, and 9.5% said they intend to
change their behaviour.19
By 2003 the Behavioural Survey could conclude: ‘the Swazi people are highly
knowledgeable about HIV/AIDS/ STIs, though this knowledge has not translated into
desirable behavioural change’.
However, close reading of the reports shows that while people may be
knowledgeable about how HIV is transmitted and how to protect themselves, they are
confused about many other aspects of the disease. This echoes the second of the four
main findings of the 1999 Education report: ‘We are confused’.20
Findings from extensive field consultations show high levels of self-perceived
and actual confusion surrounding HIV/AIDS. Parents and other community
22members were clearly the least informed about the epidemic, but confusion by no
means stopped there. Teachers, head teachers and pupils all expressed concerns
about their own knowledge and understanding of HIV/AIDS. Indeed, even
members of the relatively few anti-AIDS clubs that still existed held deep-
seated views that were at odds with the nature and scope of the pandemic.
(Executive Summary p. 3)
Interestingly this is echoed in the February 2003 School HIV/AIDS and
Population Programme (SHAPE) report.
Pupils’ understanding seemed to outrank that of parents and teachers. It was
surprising though, that these children got the information from teachers who the
latter had shown hazy knowledge on the subject compared to pupils. However,
there was a need for constant update on new information and provision of
clarifications on certain issues as HIV and AIDS invokes panic and scare in
society. This panic sometimes clouds the understanding that one has of the
disease. Teachers and parents as well, needed the chance of continuous update,
as HIV was a dynamic disease of which new discoveries were made every time.21
At the workshop we held there was a consensus that insufficient information is
available in Swaziland. There was also consensus that the messages sometimes
conflicted and were wrongly targeted. Although it is unclear what additional
information is required, one clear message was that material should be available in
SiSwati.
Sexual behaviours among youth
The 2003 National Behavioural Surveillance Survey (BSS) study found that the
majority of youth were not sexually active. More than 70 per cent of those in school
have never had sex (Table 4); by contrast more than 70 per cent of out of school youth
have had sex. This partly confirms the 1996 Family Life Association of Swaziland
(FLAS) survey which found that only 18.8% of both males and females admitted to
having had sexual intercourse (in and out of school).The information on age at sexual
debut is somewhat limited. Hard data can only be extracted from the BSS and is shown
in Table 5. It is somewhat counterintuitive as in-school youth are shown to have a
younger age of debut.
23Table 5: Sexual behaviour of in- and out- of school youth
In-school youth
Ever had sex Age at first sexual Mean age of
intercourse sexual partner
Male 28.3 16.3 15.1
Female 28.3 16.1 20
Out-of-school youth
Male 69.3 19.8 22.4
Female 69.3 18.3 28.7
Out-of-school youth’s sexual debut was at an older age. It is also striking that these
people’s partners have been uniformly older than was the case for those in school. This is
significant because it may indicate exploitative relationships. The relationship between
older men and younger women has been identified as crucial in Botswana. This is shown
in Figure 8, taken from Botswana’s 2000 Human Development Report.22
The Government of Botswana noted that in more advanced epidemics, one of the
key interventions is stopping the spread of AIDS from one generation to another. Given
that prevalence rates have been found to be four to twelve times higher in young females
than young males, this particularly means stopping the spread from older men to girls.23
Figure 8:The intergenerational transmission of HIV
Men Girls
Women Boys
The arrows indicate the direction of sexual relationships
24The recent (February 2003) School HIV/AIDS and Population Programme
(SHAPE) report on behaviour of in-school youth tends to confirm this view of low levels
of sexual intercourse. (Although of concern is the number who did not answer the
question).
Table 6: Percentage having sexual intercourse, by age group
Had Sexual Age Group 13 to 15 Age group 16 to 19 Total
intercourse Girls Boys Girls Boys Girls Boys
No 46.9 42.0 18.1 19.1 64.9 61.0
Yes 9.9 16.7 9.5 11.9 19.3 28.6
No answer 11.0 7.8 4.6 2.4 15.6 10.3
Uncodable .1 .1 .1 .1
TOTAL % 67.8 66.6 32.2 33.4 100.0 100.0
The lesson from these data and the discussions at the workshop is that in-school
youth are far less sexually active than out-of-school youth. Indeed it is clear that once
youth leave school they become sexually active. Why is this? Part of the reason is the
normal rite of passage to adulthood. Once a person leaves school they have more
freedom. But there are other factors at work. The majority of youth will not find formal
employment. This means they will be forced into poverty and dependence on others and
in addition will be unoccupied for much of the time.
The responses are complex. The first goal should be to ensure youth complete
schooling – being in school is a protection. The second is to create employment, but
that is a national goal. The third, and this was mentioned by a number of participants,
is to provide recreational facilities. Finally, if youth are sexually active they must be
encouraged to be faithful and use condoms.
The issue of substance abuse has not been widely studied. There is some evidence
in the SHAPE Baseline Study that among in school youth about 6% of 13 to 15 year
olds and 16% of 16 to 19 year olds used alcohol. There is no data on drugs. However
‘substance abuse’ was mentioned by a number workshop participants as one of the
drivers of the epidemic in Swaziland.
25Condom use
There is good evidence of increasing condom use. In the 1991 Family Life Association
of Swaziland (FLAS) study, 86% of all respondents knew about condoms, but only 18%
had ever used them. By the time the FLAS/ UNICEF 1999 study was carried out, 62.3
per cent of youth said they used condoms when they last had sex. The evidence on
condom use in the 2003 BSS study is shown on Tables 3 and 4. In all the occupational
groups – except seasonal workers (29.9%) and female factory workers (48%) – most had
used condoms at last sex with a non-regular partner. (In the case of the police, the figure
was 73.2 % of the time). Among in-school youth, condom use at first sex ranged from
59.5% to 89.5% by district, and from 83.3% to 96.1 % for sex with a non-regular
partner. In out-of-school youth, rates were lower: 33.3 to 41.2% at first sex and 41.6 to
57% for sex with non-regular partner.
Concern was expressed by some participants at the workshop at the messages
used in the social marketing of condoms in Swaziland. These events promote a lifestyle
that many (and particularly out-of -school youth) cannot afford while the promotional
events themselves often take place in settings that do not encourage safe behaviours.
While this type of social marketing successfully targets wealthier, employed urban
young people, it may provide different messages to the majority who are rural,
unemployed and come from poor backgrounds.
The SHAPE 2003 survey found that in the 13 to 15 age group, 62.1% of youth
(presumably those having sex although this is not clear from the report) used condoms
in their first sexual encounter, while in the 16 – 19 age group the rate was 72.6 %. The
per cent who did not answer the question was 14.2 % and 8.7 % respectively.
There may be merit in additional promotion of condoms as the primary mode of
family planning. The Swaziland Multiple Indicator Cluster Survey in 2000 found
condoms are only used by 1.8% of women who are aged 15-49, married or in union and
using contraceptives.24
Socio-economic drivers
Culture and women’s status
Swaziland is a society where polygamy is practiced; indeed the Royal Family has
traditionally been one of the main proponents of this way of life. Polygamy does not in
itself lead to greater risk. As one of the earlier posters put it: ‘Be faithful in your
polygamous family’. If the partners are faithful to each other then HIV is not a threat.
However if one partner is unfaithful then it is much more likely that an infection will
spread through the household. In addition the level of trust has to be greater.
26In traditional Swazi society, polygamous unions were no more likely to lead to
non-regular partnering than monogamous ones. However in traditional Swazi society
sex outside marriage was not allowed. In both Swazi and Zulu culture boys and girls
were permitted to experiment but expected to stop short of full intercourse. Virginity
was greatly valued. The practice of thigh sex was one mechanism for sexual pleasure
stopping short of penetrative sexual intercourse. The SHAPE study found that 10.8%
of pupils (presumably those having sex) reported having thigh sex.
In Swazi culture men are superior in strength and law and the upbringing of
boys and girls is very different. This has led to a situation in which boys are expected
to seek sex and girls are more compliant. It is felt this is no longer appropriate in the
current cultural, economic and epidemiological environment.
The issues of gender relations, the relative lack of power of women, women’s
status, and Swazi culture were raised by all the groups during the report-back session
of the workshop. It is clearly a hot issue, but is not mentioned in the literature we have
reviewed – with one exception. The United Nations Development Programme
produced a report entitled ‘Gender focused responses to HIV/AIDS in Swaziland’.25
The study found:
Women’s vulnerability to HIV/AIDS infection is increased by economic,
social and cultural factors and by different forms of violence, (particularly
sexual), that place them at a disadvantage within relationships, the family,
the economy and society at large. Women’s economic dependence on men, their
high poverty levels and lack of access to opportunities and resources, contribute
to their vulnerability to HIV/AIDS infection. Because of the economic
dependence on men, women are unable to take control of their lives and protect
themselves against HIV infection. This is because the men can withdraw the
economic support if women refuse to do as they want.
Most cultural expectations and practices were found to contribute to women’s
vulnerability to HIV/AIDS. The Swazi society expects women to be subordinate
and submissive; allows men to have multiple sexual partners; and polygamy,
which exposes women to HIV infection, is legal in the country. (p.1)
This study is based on a very small number of interviews (only 58 in total: 32
women and 26 men). Nonetheless it echoes the concerns of our workshop participants.
Notably some cultural practices were viewed as contributing to the spread of HIV:
these included polygamy, kwendziswa (arranged marriages), kungenwa (widow
inheritance), umhlanga (reed dance). Others were viewed as positive, such as: virginity
tests for young women and men, sexual abstinence until later in life when young people
are mature enough to make meaningful decisions about their bodies and sexual lives,
lusekwane (age regiment for boys), and umcwasho (the wearing of woollen tassels to
indicate virginity by young girls).
27Most concerning was the finding that although basic information on HIV/AIDS
is available to women, this knowledge does not assist them in making decisions to avoid
risky sexual behaviour. This is shown in Table 7. (It should be noted that the anomalous
response from Manzini may be because it is the only region where there were more men
than women.)
Table 7: Can women use information/knowledge on HIV/AIDS
to negotiate safer sex?
Region Yes % No % Don’t Know %
Hhohho 17 83 –
Manzini 50 25 25
Shiselweni 33 50 17
Lubombo 33 67 –
Social norms
The idea of what young men and women can expect from relationships is also a source
of apprehension. The Family Life Association of Swaziland 1996 study found that when
asked what they expect from boys, the most common response from female participants
was money (36.2%), sex (30.4%), fidelity (16.9%), gifts and entertainment (5.8%), and
1.8% did not know.26 When males were asked what they believed girls expected from
their boyfriends 38.8% said girls expected money; 18.1% expected sex, 14.3% said
they expected love, hugs, kisses and to be cared for, 8.9% said they expected love, sex
and money.
Among the females, 87.0% believed that their boyfriend was the one who
‘pressured’ them into having sexual intercourse. Some 7.8% believed it was no-one’s
fault, it happened spontaneously; 2.6% admitted to have insisted on having sexual
relations; and 1.9% believed it was by mutual consent. On the issue of multiple sex
partners, 29.6% of the respondents admitted to having had sex with more than one
person in their lifetime. 29.9% (97 out of 324) of the respondents indicated that the
primary cause of promiscuity was that ‘girls want more money from their boyfriends’.
However 69.6% of the female respondents felt that it was not a good idea to engage in
28sex before completing one’s formal education (school, college or university) and 18.4%
thought it was unwise because it could lead to dropping out of school/college/
university due to pregnancy.
Among males, 69.8% said their current girlfriend was not their first sexual
partner. More males (65%) than girls (47.5%) admitted to being sexually active.
The only male/female distinction in the BSS is from students at tertiary
institutions. Here the data shows that females have marginally better knowledge but
are less likely to use condoms with non-regular partners (55.4% for females, 86.9% for
males). Females are more likely to report STIs (6.6% for females, 3.7% for males).
It has been suggested that boys ‘are pressured at an early age to experience sex
and prove their masculinity. The pressure to have sex and many partners is a socially
expected competition among youth … [for girls there] is a cultural belief that girls are
not women until they give birth’.27
Poverty and inequality
Poverty and inequality increases the likelihood that poor women will be forced into
transactional sex as a survival strategy.iv Orphans and vulnerable children are more
likely to be exploited and this may include sexual exploitation and abuse.
A picture of poverty is given in the Afrobarometer survey which presented
survey respondents with a list of basic needs and asked: ‘In the last twelve months, how
often have you or your family gone without (these things)?’ The survey has not been
carried out in Swaziland but the finding can be applied here.
Table 8 below displays the proportions of people who say that they ‘sometimes’
or ‘often’ do without.28 These data show widespread poverty. Significant proportions
say they or their families have gone without basic necessities at least occasionally, if not
frequently. Southern Africans were most likely to have been short of cash income (on
average, 66 per cent in each country) and least likely to experience homelessness (9 per
cent). Between these extremes, significant proportions of people sometimes or often
went without food (an average of 49 per cent in each country), medical treatment (46
per cent), clean water (36 per cent) and fuel for heating or cooking (36 per cent).
iv. This includes commercial sex where people sell sex for money as well as situations where a
women will exchange sex for food, shelter or protection.
29Table 8: Shortages of basic goods and services, Southern Africa,
1999-2000
Botswana Zimbabwe Zambia Malawi Lesotho Namibia South
Africa
Shelter 6 4 5 14 13 16 5
Enough fuel
to heat your
home or
cook food 31 43 29 41 38 40 28
Enough
clean water
to drink
and cook 16 46 30 47 50 41 24
Medicine or
medical
treatment
that you
needed 16 38 49 58 69 54 38
Enough
food to eat 49 60 38 54 61 50 34
A cash
income 52 77 69 69 80 71 47
In the last twelve months, how often have you or your family gone without: _____________? Was it often, sometimes,
rarely or never? (Percentage saying ‘sometimes’ or ‘often’ with reference to the previous twelve months)
World Vision writes:
Poverty assessment surveys done by World Bank and UNDP show that 66%
of Swazis live in absolute poverty. For rural areas, the percentage of people
living in absolute poverty is even higher in some areas is at 80%. Furthermore,
data shows high inequalities in the distribution of income, with 10% of the
population obtaining 60% of the country’s income, and 90% of the population
30receiving only 40% of the income. This gap is increasing. This is one of the
major causes of poverty in the country. The high rates of HIV/AIDS have
further contributed to the declining standards of living.29
The UN Common Country Assessment (from http://www.ecs.co.sz/cca) data
show that in 1997 the food poverty line included 47.9 per cent of the national
population (29.7 per cent of the urban population and 54.9 per cent of the rural), and
the total poverty line included 65.5 per cent (45.4 per cent of the urban population and
70.6 per cent of the rural). Those who are unable to meet the food poverty line are
described as ‘very poor’, those unable to meet the total poverty line as ‘poor’. We have
no evidence to suggest that the situation has improved and our workshop participants
indicated they felt poverty was increasing.
Food production
There is a food crisis in the region. There are 14.4 million people at risk of
starvation in six countries: Zimbabwe, Zambia, Lesotho, Swaziland, Malawi and
Mozambique. In September 2002 James Morris, head of the World Food Programme
(WFP), visited the region and recognized that food is only part of the problem; the
heart of the issue is AIDS.
What the mission team found was shocking. There is a dramatic and complex
crisis unfolding in Southern Africa. Erratic rainfall and drought can be
identified as contributing factors to acute vulnerability, but in many cases the
causes of the crisis can be linked to other sources … Worst of all, Southern
Africa is being devastated by the HIV/AIDS pandemic. HIV/AIDS is a
fundamental, underlying cause of vulnerability in the region, and represents the
single largest threat to its people and societies.30
A WFP press report states, ‘Across the six countries visited, healthcare workers
universally emphasised the lethal combination of hunger and HIV – how the
convergence of the two calamities sharply increase people’s vulnerability to infection
and disease. In every country visited the special envoy’s team was confronted by a
devastating mix of extreme hunger and severe shortcomings in agriculture, health,
sanitation and institutional capacity’. The WFP estimated in September 2002 that 144
000 people faced food shortages in Swaziland and 15 000 tons of food per month were
needed.
It should also be noted that the current food crisis comes on top of a general
decline in the per capita production in the region. This is shown in Table 9 below. Up
to 2000 all these countries had seen marked declines in output. Furthermore we know
that while drought is a regular phenomenon, the current drought is recent which means
its impact is not yet reflected in these indicators.
31Table 9: Food Production
Country Food production Per capita index
(average 1989 – 91 = 100)
1991 1995 2000
Lesotho 81 80 81
Mozambique 92 89 82
Namibia 100 96 78
South Africa 98 79 92
Swaziland 102 76 67
Crop failure may result in rural urban migration and increased poverty. Stillwagon has
shown ‘that HIV prevalence is highly correlated with falling calorie consumption,
falling protein consumption, unequal distribution of income and other variables
conventionally associated with susceptibility to infectious disease, however
transmitted.’31 Malnutrition and parasite infestation depress both specific and non-
specific immune responses by weakening epithelial integrity and the effectiveness of
cells in the immune system. Protein-energy malnutrition, iron deficiency anaemia,
vitamin-A deficiency (which are all poverty related conditions) decrease resistance to
disease, including HIV.
Mobility
People’s mobility is known to give both the opportunity, and increase the likelihood of
having non-regular sexual partners. In a setting where people don’t know each other,
contacts are more anonymous. When people travel they are likely to be lonelier, drink
and behave differently. The people of Swaziland are extremely mobile both within the
country and across borders. In 1993 (Land and Housing Survey, MHUD) it was found
that 54% of all urban households in informal areas maintained linkages with their rural
homestead, visiting these at least once in the past month. While no recent data on
internal migration exists, it is not thought that this will have changed substantially.32
Swaziland is a small country with good infrastructure and as a result it is easy for urban
dwellers to maintain contact with their rural homesteads.
32You can also read