WAIKAREMOANA POWER SCHEME
←
→
Page content transcription
If your browser does not render page correctly, please read the page content below
POWER SCHEME
       WAIKAREMOANA
ENVIRONMENTAL REPORT // 01.07.13 // 30.06.14
14

     This report provides a summary of key environmental outcomes arising out
     of the process to renew resource consents for the ongoing operation of the
     Waikaremoana Power Scheme.
     The process to renew resource consents was lengthy and complicated, with
     a vast amount of technical information collected. It is not the intention of
     this report to reproduce or replicate this information in any way, rather it
     summarises the key outcomes for the operating period 1 July 2013 to 30 June
     2014 (hereafter referred to as ‘the reporting period’).
     The report also only provides a summary of key result areas. There are a
     number of technical reports, research programmes, environmental initiatives
     and agreements that have fed into this report. As stated above, it is not the
     intention of this report to reproduce or replicate this information, rather to
     provide a summary of it. Genesis Energy is happy to provide further details or
     technical reports or discuss matters directly with interested parties.
HIGHLIGHTS
1 July 2013–30 June 2014
02 01 INTRODUCTION
02 1.1 Document Overview Tuna Migration Programme Another record number of elvers
02 1.2 Resource Consent Process Overview (68,734) were captured below Piripaua Power Station and
02 1.3 How to use this document transferred to upstream habitats during the reporting period.
02 1.4 Genesis Energy’s Approach Ongoing survey work has helped understand eel population
to Environmental Management trends as a result of these transfers. A bank of bright, LED
02 1.4.1 Genesis Energy’s Values spot lights were installed on the Piripaua Intake as an eel
02 1.4.2 Environmental Management System deterrent to migrant tuna and a by-pass was completed on
03 1.4.3 Resource Consents Management System the Whakamarino spillway to provide an alternative safe eel
03 1.4.4 Hydrology passage out of Lake Whakamarino into the Waikaretaheke River
03 1.5 Feedback (see Section 4.2.3).
04 02 WAIKAREMOANA POWER SCHEME
Onepoto Siphon It was identified through the WPS Public Safety
05 2.1 Operating the Waikaremoana Power Scheme
– Risk Assessment process that the intake area for the Onepoto
05 2.2 Climate and Power Generation
Siphon needed to be marked on the lake surface. In early 2014,
06 03 LAKE WAIKAREMOANA Genesis Energy installed four large permanent buoys, chained
07 3.1 Hydrology to weights placed on the lake bed (see Section 5.1.1)
08 3.1.1 Level Trends at Lake Waikaremoana
08 3.2 Ecosystems and Water Quality Lake Waikaremoana Hapu Restoration Trust The Trust has
08 3.2.1 Terrestrial Vegetation remained focused on its core activity, the kiwi project, and
09 3.2.2 Aquatic Vegetation achieved some significant milestones. For example, getting
10 3.2.3 Trout Monitoring the Puketukutuku kiwi population to “carrying capacity’;
10 3.2.4 Ecological Restoration Programme completing the kiwi fence and predator trapping networks on
10 3.3 Sediment (Erosion, Transport and Deposition) Whareama; and beginning translocations of surplus kiwi from
11 3.3.1 Event-Driven Monitoring Puketukutuku to Whareama (see Section 6.1).
12 04 WAIKARETAHEKE RIVER
Schoolgen The Schoolgen programme was introduced and
13 4.1 Hydrology
rolled out to Te Kura o Waikaremoana in Tuai. The programme
13 4.1.1 Lake Kaitawa
enables children to learn about Renewable Energy and
13 4.1.2 Waikaretaheke River from Kaitawa Spillway to
especially solar power through dedicated teaching resources.
Lake Whakamarino
A 2 kW array of solar panels were installed including a 4kW
14 4.1.3 Lake Whakamarino
invertor providing the opportunity to expand the array to 4 kW
14 4.1.4 Waikaretaheke River below Piripaua Power Station
if the school wishes to increase the capacity. This is the first
15 4.1.5 Maximum Flows: Waikaretaheke River and Lakes
Schoolgen School in the region. (see Section 6.6).
Waikaremoana, Kaitawa and Whakamarino
15 4.2 Aquatic Ecosystems and Water Quality
15 4.2.1 Macro-Invertebrates ABBREVIATIONS
17 4.2.2 Waikaretaheke River Trout
AER Annual Environmental Report
17 4.2.3 Tuna (eel) Migration Programmes
CSR Comprehensive Safety Review
19 4.3 Water Quality
DOC Department of Conservation
19 4.3.1 Routine Monitoring ECNZ Electricity Corporation of New Zealand
19 4.3.2 Lake Whakamarino Water Quality Monitoring EMS Environmental Management System
19 4.4 Sediment (Erosion, Transport and Deposition) EPT Ephemeroptera, Plecoptera, and Trichoptera
20 4.5 Recreation and Tourism (the three insect orders commonly used to test water quality)
20 4.5.1 Piripaua Power Station GPS Global Positioning System
20 4.5.2 Whakamarino Dam GWh Gigawatt hour
22 05 SCHEME-WIDE OUTCOMES kW kilowatt
23 5.1 Scheme-wide Maintenance Activities HBCC Hawkes Bay Canoe Club
HBRC Hawkes Bay Regional Council
23 5.1.1 Onepoto Siphon
LWHRT Lake Waikaremoana Hapu Restoration Trust
23 5.1.2 Piripaua Transformer Upgrade
masl meters above sea level – Moturiki Datum
23 5.2 The Waikaremoana Sportsfish Habitat Enhancement Trust
MCI Macro-Invertebrate Community Index
24 5.3 Dam Safety MPI Ministry of Primary Industries
24 5.4 Oil Spill Response MVA Megavolt Amp
24 5.5 Public Complaints MW Megawatt
24 5.6 Publicly Available Hydrology Information NIWA National Institute of Water and Atmospheric Research
25 06 COMMUNITY & ENVIRONMENTAL INITIATIVES NZSOLD NZ Society on Large Dams
26 6.1 Lake Waikaremoana Hapu NZTA New Zealand Transport Authority
Restoration Trust Partnership QMCI Quantitative Macro-invertebrate Community Index
26 6.2 Whio Forever RECC Renewable Energy Control Centre
RCMS Resource Consent Management System
27 6.3 Waikareiti Biodiversity Project
SPI Submerged Plant Indicators
27 6.4 Lake Waikaremoana Challenge
WERP Waikaremoana Ecological Restoration Programme
28 6.5 Aquatic Weeds
WHOINE Whio Nest Egg project
29 6.6 Schoolgen WPS Waikaremoana Power Scheme
29 6.7 Wader Safety Training WSHET Waikaremoana Sportsfish Habitat Enhancement Trust
30 07 KEY OBJECTIVES
31 7.1 Review of Key Objectives for 2013-14
32 7.2 Key Objectives for 2014-15
32 08 REFERENCES
Front cover photo: One of four kiwi released on Whareama Peninsula
during the translocation from Puketukuku Peninsula.
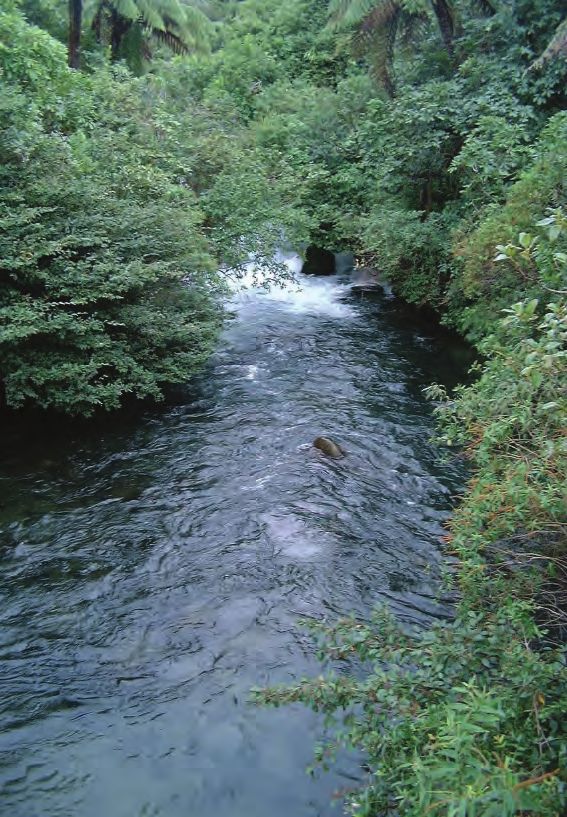
Back cover photo: LWHRT staff constructing the fish trap on the
Waikaretaheke with Fish & Game Officers Matt Osborne and
Anthony Van Dorp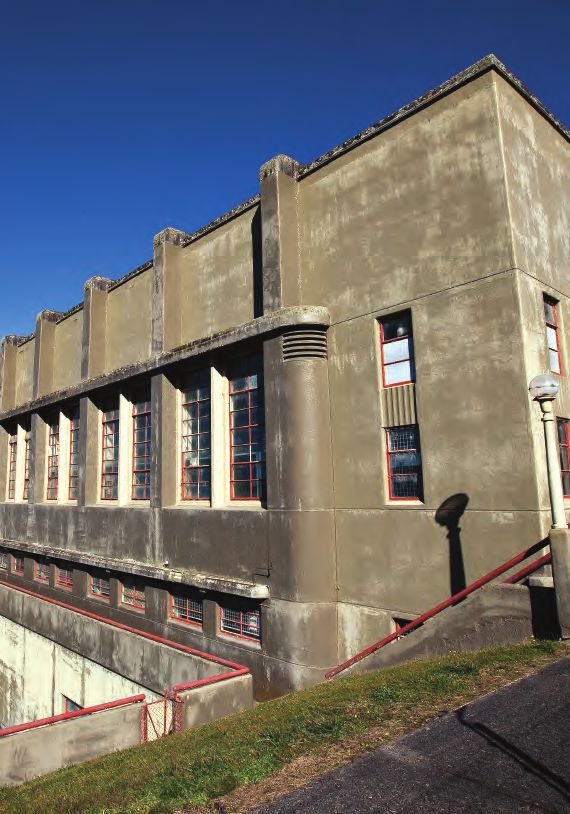
01 INTRODUCTION                                                        agreed. Forty-five resource consents were granted for a term of 35
                                                                                            years, subject to a range of conditions, including a five-yearly review.
                     Nau mai haere mai ki tenei Ripoata Taiao e pa ana ki te mahi
                     hihiko mo tenei rohe o Waikaremoana.                                   Up to 2012, scheme–wide resource consents for routine
                                                                                            maintenance activities around the WPS were generally applied
                     Welcome to the 2013-2014 Annual Environmental Report (AER)             for on an as-required basis.  During the 2012/13 reporting period,
                     for the Waikaremoana Power Scheme (WPS).  The purpose of this          scheme-wide resource consents to undertake various routine
                     report is to update the community and stakeholders on the wide         maintenance activities at the WPS were granted by Hawkes Bay
                     range of activities which occurred at the WPS between 1 July 2013      Regional Council (HBRC). They provide an efficient mechanism
                     and 30 June 2014 (the ‘reporting period’). This document is the        to undertake routine maintenance activities, whilst effectively
                     eighth AER for the WPS and follows the previous year’s (2012/13)       managing the effects of these activities on the environment (see
                     report. This report will:                                              Section 5.1).
                         provide an overview of resource consent compliance                 The first five-yearly review was in 2004 and at this time Genesis
                         at the WPS;                                                        Energy sought changes to the monitoring and reporting conditions
                         provide an update on monitoring and research programmes;           to allow for more targeted monitoring programmes at Lake
                         report back on key projects;                                       Waikaremoana and on the Waikaretaheke River. The HBRC
                         report on community and environmental initiatives; and             adopted the recommendations and the resource consents were
                         define environmental objectives for the next 12 months.            varied in 2005. Subsequently the Lake Waikaremoana Monitoring
                                                                                            Plan and the Waikaretaheke River Monitoring Plans were
                     Genesis Energy aims to be accessible to the public, to address
                                                                                            completed in 2006.
                     issues as they arise and to develop closer working relationships
                     within the communities in which it operates.                           Opportunities for a five-yearly review occurred in 2009 and 2014;
                                                                                            however a review of the resource consents was not requested by
                     1.1 DOCUMENT OVERVIEW
                                                                                            Genesis Energy nor undertaken by HBRC.
                     Genesis Energy produces a suite of reports and other
                                                                                            1.3 HOW TO USE THIS DOCUMENT
                     documentation on its activities each year (Figure 1).  These include
                     detailed technical reports, audit reports and various reporting        This report documents environmental outcomes based on two key
                     requirements to stakeholders. They address specific issues at a        areas of the scheme:
                     site/local level.
                                                                                                Lake Waikaremoana;
                     The Company’s Annual Report provides an overview of Genesis                Waikaretaheke River.
                     Energy’s performance as a company.
                                                                                            The report also provides information for:

                                                                                                Scheme-wide Outcomes;
                                                                                                Community and Environmental Initiatives.

                                                                                            Bold text like this will help you to find your way around the report.

                                                                                            Consent Description  Consent # (condition) identifies the parts of
                                                                                            the report that relate to specific resource consent conditions.

                                                                                            Orange text like this throughout the report provides useful
                                                                                            background information on specific issues.

                                                                                            1.4 GENESIS ENERGY’S APPROACH
                                                                                            TO ENVIRONMENTAL MANAGEMENT

                                                                                            1.4.1 GENESIS ENERGY’S VALUES

                                                                                            Genesis Energy’s four core values define the way things are done
                                                                                            at Genesis Energy.  They are the actions and behaviours which
                                                                                            help contribute to the success of the company.

                        FIGURE 1 // Report hierarchy at Genesis Energy.                     Genesis Energy’s Values are:

                                                                                                Respect – We treat people and places as we would
                                                                                                wish to be treated
                     This AER bridges the gap between site specific reporting and               Drive – We achieve with energy, courage and commitment
                     the company’s Annual Report.  It provides an overview of all               Imagine – We challenge today and change tomorrow
                     environmental and stakeholder activities relating to the WPS.  It          Support – We work together, take responsibility and have fun
                     does not detail company strategy or performance (refer to the
WAIKAREMOANA // 14

                     Annual Report for this information) or provide extensive detailed      Genesis Energy’s intent is to become the preferred provider of
                     information on monitoring programmes and other initiatives             energy in New Zealand. We will achieve this by:
                     undertaken (refer to specific technical reports listed in the
                     references).                                                               Delivering efficient service and smart solutions to customers;
                                                                                                Optimising the performance of our generation portfolio;
                     More information about Genesis Energy, including an electronic             ‘Living’ our values; and
                     copy of this document, can be found on the website                         Operating in a way that is safe and healthy for our people,
                     www.genesisenergy.co.nz                                                    our customers, our communities and the environment.
                     1.2 RESOURCE CONSENT PROCESS OVERVIEW                                  1.4.2 ENVIRONMENTAL MANAGEMENT SYSTEM
                     Resource consents for the on-going operation of the WPS were           Genesis Energy is committed to ensuring that environmental and
                     granted in November 1998. This followed a period of intensive          social awareness are the cornerstones of its business. Achieving
                     consultation, technical assessments, recommendations and review        full regulatory compliance is considered the minimum standard
                     via a formal consultative group, and through one on one consultation   that Genesis Energy strives to achieve in the operation of its
                     with affected and interested parties. The consultation process         business. Genesis Energy’s Environmental Values are to:
02

                     addressed numerous issues and in most cases outcomes were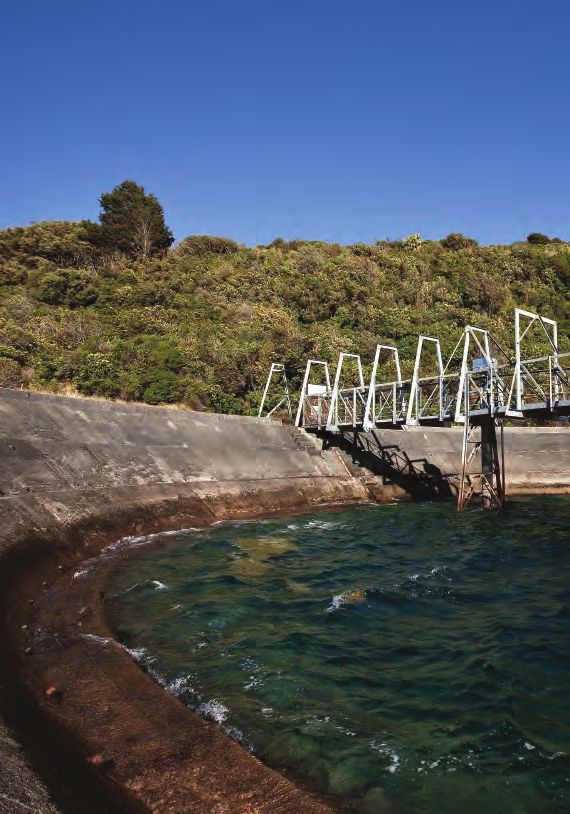
Act with integrity at all times;                                  of transparency and external credibility; this also ensures data is
    Foster close relationships with the community and                 being collected and processed to a high standard.
    stakeholders, so that their views can be incorporated into
    environmental decision making;                                    During the reporting period the hydrology staff put an extensive
    Acknowledge that our activities affect both the environment       amount of work into improving the monitoring network which
    and the communities within which we operate;                      resulted in a high level of compliance and more efficient operation
    Respect the role of tangata whenua as kaitiaki of the natural     of plant for Genesis Energy. Genesis Energy is constantly looking for
    resources and taonga within the rohe;                             safer and more efficient ways of operating its assets. Examples of
    Investigate to better understand the nature of our                this are; finding ways of calculating flows from fixed structures to
    environmental effects – and share this information with the       provide operational and compliance data and upgrading monitoring
    community and stakeholders; and                                   stations to provide effective information to the control centre.
    Seek environmental improvements in all aspects
                                                                      During the reporting period the Hydrology data has been
    of our business.
                                                                      externally audited and it was found that the data was collected to a
To give effect to these values, Genesis Energy implements an          high standard and all correct procedures were followed.
Environmental Management System (‘EMS’) which incorporates a          1.5 FEEDBACK
suite of management processes and tools that are well integrated
with other core business systems. The EMS applies to all activities   Genesis Energy has worked to make this report informative and
involving the use of natural and physical resources and the           easy to understand.  Your feedback is welcome on both content
environment, from the conceptual stage of any project through to      and layout. Contact details are as follows:
Genesis Energy’s normal day-to-day operational activities.
                                                                      Renewable Energy – Tokaanu Power Station
During the reporting period, Genesis Energy reviewed its              State Highway 47
EMS against relevant national and international standards             Private Bag 36
for environmental management systems (e.g. the ISO 14001              TURANGI 3353
standard), and will seek to align its EMS more closely with           Phone (07) 384 7200
these standards.  This includes the development of core internal
Environmental Standards in alignment with the Company’s
overarching Business Management System.

1.4.3 RESOURCE CONSENT MANAGEMENT SYSTEM

To help manage compliance across all generation sites, Genesis
Energy has developed a Resource Consent Management System
(RCMS).  This system holds all information relating to resource
consents, third party agreements, and permitted activities,
and defines, prompts and monitors actions required by their
conditions, and reports on the status of these.  The purpose of the
RCMS is to ensure that Genesis Energy manages its statutory and
stakeholder obligations effectively and that essential requirements
are not overlooked.

All Genesis Energy staff can access the RCMS through the
company’s intranet but only designated administrators within the
Environmental Team can make changes and update/sign off tasks,
or view potentially confidential information contained within third
party agreements.

An internal RCMS and environmental compliance audit is
undertaken on an annual basis at generation sites. The purpose of
the audit is to ensure correct procedures are being followed and to
identify any improvements that could be made to RCMS systems
or processes to best achieve 100% compliance.

During the 2012/13 reporting period, improvements to the RCMS

                                                                                                                                              ENVIRONMENTAL REPORT // 14
were identified including enhanced reporting functionality and
ensuring that the system is more user-friendly. A project was
planned to incorporate these changes in the RCMS in the reporting
period, but due to IT infrastructure upgrades this project had to
be deferred. As a result, the implementation of these changes will
now occur in the 2014/15 reporting period.

During the reporting period the WPS resource consents and
third party agreements were internally audited. The audit found
that all other required actions from the previous audit had been
successfully addressed and observed excellent overall compliance
with environmental reporting procedures.

1.4.4 HYDROLOGY

Genesis Energy has an extensive hydrology monitoring network
around the WPS.  A variety of flow, water level, water quality
and rainfall data is collected in real-time and telemetered near
real-time. This information is sent to Genesis Energy’s Renewable
Energy Control Centre (RECC), located in Tokaanu near Turangi,
together with a range of plant and market information.
                                                                                                                                              03

Data collected by the hydrology network is audited by an
independent third party on an annual basis to maintain a high level
02
                     WAIKAREMOANA
                     POWER SCHEME
WAIKAREMOANA // 14
04
02 WAIKAREMOANA POWER SCHEME
                                                                            TABLE 1 // Average monthly inflows into Lake Waikaremoana during
The Waikaremoana Power Scheme (WPS) is located within and                   the reporting period.
adjacent to Te Urewera National Park in the northern Hawkes Bay
Region. The location and features of the scheme are shown on the
                                                                          Month                  2013-14                 Long Term     Percent of
map inside the back cover.                                                                 Average Inflow            average Inflow      Average
                                                                                                   (m3/s)   (1930 - present)  (m3/s)         (%)
The potential for power generation from the outflow of Lake
Waikaremoana was recognised in the 19th century (Natusch,                 July                      14.46                     27.95           52%
1992) and three power stations were commissioned between 1929             August                    21.44                     25.48           84%
and 1948. The WPS uses water from Lake Waikaremoana and the
                                                                          September                 41.94                      21.4         196%
Waikaretaheke River and a number of its tributaries to generate
electricity at three hydroelectric power stations – Kaitawa (36           October                   11.74                     17.33           68%
megawatts [MW]), Tuai (60 MW) and Piripaua (42 MW). Water is
                                                                          November                  12.44                     13.79           90%
taken from Lake Waikaremoana via tunnels at Onepoto Bay and is
passed through Kaitawa Power Station before being discharged              December                   8.92                     11.35           79%
into Lake Kaitawa. It is then passed through Tuai Power Station           January                    6.14                     10.29           60%
and discharged into Lake Whakamarino. From here, a further
tunnel and penstocks carry the water to Piripaua Power Station            February                  11.81                     11.08         107%
before it is discharged back into the Waikaretaheke River, the            March                       2.8                     12.41           23%
natural outlet of Lake Waikaremoana.
                                                                          April                     29.55                     15.54         190%
The generating plant has undergone major refurbishment and the            May                           7                     20.06           35%
scheme’s generation capacity has increased from 124 to 138 MW.
Operation of the WPS depends on the demand for electricity and            June                      19.42                     23.52           83%
the availability of water. Electricity from the WPS feeds into the        Annual Average            15.56                     17.67           88%
national electricity grid and assists in maintaining voltage levels
on the transmission system.

Supply of electricity to the East Coast from the WPS is important
for two reasons. Firstly, the generators at Waikaremoana provide
voltage support for the Gisborne and Tokomaru Bay Transpower
transmission circuits. Secondly, the close proximity of the WPS
to Gisborne results in lower transmission losses, which reduces
the need for generation overall. The WPS is also ideally situated
to provide power to the East Cape area when the East Cape loses
connection to the national grid such as during large snowfall
events in 1997 and 2006.

2.1 OPERATING THE WAIKAREMOANA POWER SCHEME

The WPS is operated remotely from Genesis Energy’s Renewable
Energy Control Centre (RECC), which is part of the Tongariro
Power Scheme near Turangi.  A 24/7 Generation Control team
runs the WPS as effectively and efficiently as possible using a             FIGURE 2 // Modelled inflows and rainfall for Lake Waikaremoana
variety of flow, water level and rainfall data, as well as a range of       during the reporting period.
plant and market information to optimise electricity generation
revenue requirements while maintaining compliance with resource
consent conditions and operating within the electricity market           The total rainfall recorded at the Lake Waikaremoana at Onepoto
rules. A complex operational control system that underwent a             rain gauge for the reporting period was 1,962 mm, 20 mm above
significant upgrade in 2010 assists the operations team, providing       the long-term average at this site (1,942 mm). April 2014 had the
details on all aspects of the scheme, enabling remote control and        highest monthly rainfall during the reporting period with 310 mm,
                                                                         while October 2013 had the lowest monthly rainfall during the
alerting the operators when various parameters trend outside of
                                                                         reporting period with just 47.2 mm.
their standard operating limits (including resource consent limits).
                                                                         The WPS generated a total of 424 Gigawatt hours (GWh) of

                                                                                                                                                    ENVIRONMENTAL REPORT // 14
There is a full maintenance team at the WPS with roaming                 electricity (Table 2) during the reporting period. In parallel with the
Controllers on site. These Controllers are available 24/7 to fix         scheme inflows, generation was also below the long-term average
faults or defects as they arise.                                         (approximately 450 GWh). This reflects the rainfall during the
                                                                         reporting period along with outages which took place, such as the
2.2 CLIMATE AND POWER GENERATION                                         completion of the Piripaua transformer upgrade, which reduced
The Lake Waikaremoana at Onepoto rain gauge received about               the generation capacity of the scheme for the first two weeks of
                                                                         the reporting period.
average rainfall over the reporting period. Inflows to Lake
Waikaremoana were below the long-term average from October               Based on an average figure of electricity consumption per
2013 to March 2014 (Table 1) and for the rest of the year monthly        household of 7,760 kWh/yr (Ministry of Economic Development,
inflows were around the mean with no discernable trend in the            2012; p121) the 424 GWh produced by the WPS in the reporting
data. The period from October through to March mirrored the              period was enough electricity to power the annual demand of
previous year where inflows were among some of the lowest on             approximately 55,000 households.
record however, the dry period was broken a month earlier than
the previous year. Inflows for the year overall were 88% of the
                                                                            TABLE 2 // Waikaremoana Power Scheme generation
long-term average (1930 – present) indicating that the rain gauge           during the reporting period.
received more than the average rainfall that fell across the entire
catchment in this period.
                                                                          Site                                                 Generation (GWh)
Over the reporting period the lake was maintained between 17%             Kaitawa                                                              83
and 92% full (Figure 2). This low point (17%) is the lowest level the
lake has been since May 2009.                                             Tuai                                                                210
                                                                                                                                                    05

                                                                          Piripaua                                                            131
There were two moderate inflow events in September
2013 and April 2014 during the reporting period.                          Total                                                               424
06   WAIKAREMOANA // 14

                          03
                          LAKE
                          WAIKAREMOANA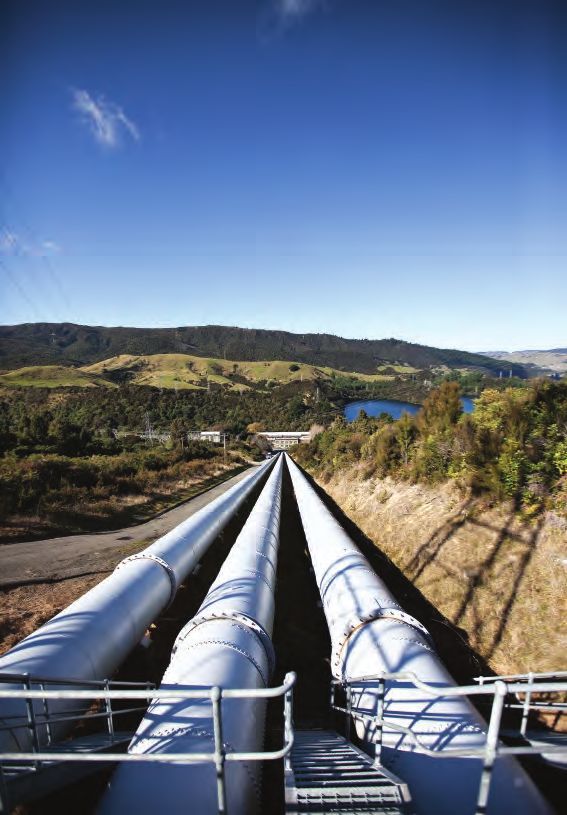
03 LAKE WAIKAREMOANA                                                       event-driven monitoring to assess the impact of lake
                                                                           level excursions outside of the operating range on shoreline
Lake Waikaremoana was created approximately 2200 years ago                 morphology and vegetation;
by a massive landslide that dammed the Waikaretaheke River.                a third party agreement with DOC with a focus on ecological
The landslide created a steep natural dam face at the head of the          enhancement on the shore of Lake Waikaremoana;
valley down which the Waikaretaheke River once flowed. Below               a third party agreement with Fish and Game Council of New
this natural dam, the Waikaretaheke River was fed by water                 Zealand to increase angler opportunities in the Hawkes Bay
leaking through the dam.                                                   Region and
                                                                           In association with DOC and the Royal Forest and Bird
Lake Waikaremoana is the primary hydro-storage lake for the
                                                                           Protection Society, Genesis Energy undertook a project to
Waikaremoana Power Scheme (WPS). The lake has a surface
                                                                           enhance the Onepoto Gatehouse area (a main access point
area of approximately 53 km2 and an operating range of three
                                                                           for the Great Walk track) by planting native species and
metres, from 580.29 to 583.29 masl. In 1946 the level of Lake
                                                                           erecting information panels.
Waikaremoana was lowered by five metres to facilitate the
operation of the WPS (Figure 3). The natural lake level range was
approximately seven metres.                                               TABLE 3 // Controlled discharge rates from Lake Waikaremoana
                                                                          when lake level exceeds 583.29 masl.

                                                                        Lake level (m)                            Controlled discharge (m3/s)
                                                                          583.29                                        No Controlled Release
                                                                          583.29                                                             43
                                                                          583.49                                                             47
                                                                          583.69                                                             51
                                                                          584.09                                                             55

                                                                       3.1 HYDROLOGY

                                                                       Lake Waikaremoana has a normal operating range from 580.29
                                                                       to 583.29 masl.  Genesis Energy must release a controlled
                                                                       discharge from the lake (Table 3) if the maximum lake level is
                                                                       reached or exceeded.
                                                                       Lake Waikaremoana HBRC WP982030Mc (3,4)

                                                                       Genesis Energy has a scheme-wide maintenance consent to allow
   FIGURE 3 // Water level at Lake Waikaremoana                        for temporary cessation of controlled discharge for maintenance
   (1929–30 June 2014).                                                purposes, for example to allow for the safe removal of obstructions
                                                                       from intake screens (see Section 5.1). This consent condition was
                                                                       not exercised in this reporting period.

Lowering the lake level and narrowing the lake level operating         Genesis Energy constantly monitors the level of Lake
range changed the energy of waves acting on the shoreline. Lake        Waikaremoana. A three hour average lake level is used to assess
Waikaremoana has always experienced significant fluctuations in        lake level compliance. This average helps to remove sieche and
level (up to seven metres), and these fluctuations had significant     wave effects from the lake level record. Figure 4 shows the level of
effects on the character of the pre-1946 shoreline (large eroded       Lake Waikaremoana for the reporting period.
shoreline scarps are evident in many places). Some on-going
erosion and change is entirely natural, even though the lake is now
managed within a three metre operating range.

Lowering the lake level directly affected the shoreline, creating
large, flat, unvegetated areas. These have subsequently been
utilised for assets such as the campground at Home Bay and
related sewage ponds (which have now been relocated away from

                                                                                                                                                  ENVIRONMENTAL REPORT // 14
the lake shore), Department of Conservation (DOC) huts and
campsites, and parts of the Great Walk track.

After the lake level was lowered, attempts were made to seal
leaks in the natural dam by constructing rock filter blankets in the
lakebed at Te Wharawhara Bay. Combined with the lake lowering,
sealing the lake reduced leakage through the natural dam from
approximately 17 cubic metres per second (m3/s) to five m3/s,
increasing the water available for electricity generation.

Key outcomes of the resource consents process in 1998 and the
subsequent change of resource consent in 2005 were:

    a three metre operating range for the lake, with specific             FIGURE 4 // Level of Lake Waikaremoana for the reporting period.
    conditions controlling discharges above and below the
    operating range;
    preparation and implementation of the Lake Waikaremoana
    Monitoring Plan which includes information on:
                                                                       Lake level compliance for Lake Waikaremoana for the reporting
         hydrology;                                                    period is detailed in Table 4. The lake did not exceed the maximum
         terrestrial shoreline vegetation;                             control level during the reporting period.
         shoreline morphology;
                                                                                                                                                  07

         littoral ecology; and
         brown trout.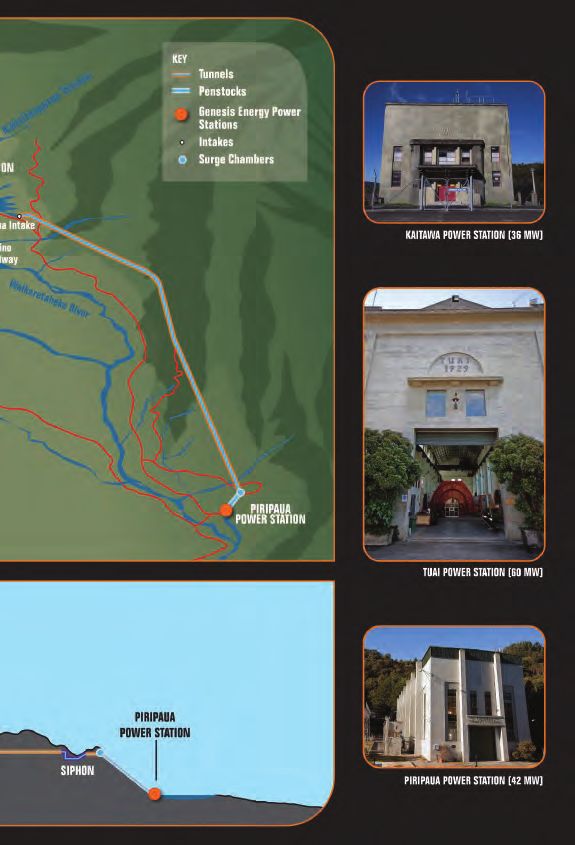
3.2.1 TERRESTRIAL VEGETATION
TABLE 4 // Lake Waikaremoana level compliance during
the reporting period. The natural vegetation around the shore of Lake Waikaremoana
is a significant feature of the lake. Much of the post-1946 exposed
Parameter Value (masl) Compliance (%) Consent Number shoreline is now covered with indigenous vegetation, with
(condition) localised areas of exotic grassland, particularly on the old, more
fertile river delta shorelines.
Minimum level 580.29 100 WP982030Mc (3)
Maximum level 583.29 100 WP982030Mc (3) The key purpose of shoreline vegetation monitoring is to assess
the effects of the lake level management regime on terrestrial
vegetation structure and development.
Outflows from Lake Waikaremoana are limited by the permeability
of the dam wall and the flow that can be taken through Genesis A total of 100 vegetation transects and/or photo-points have been
Energy structures. Genesis Energy can only take water from established around the Lake Waikaremoana shoreline since 1999.
Lake Waikaremoana via a siphon system, through Kaitawa Power These monitoring sites represent a full range of shoreline profiles,
Station, or via a spillway (at very high lake levels). The maximum substrates and habitat types. Shoreline vegetation transects are
rate of take through each structure is related to the design of surveyed every five years and photo-points are surveyed annually.
the system. The design criteria of these structures are defined in They provide baseline data which enable detection of even minor
resource consents. There have been no changes to the structures changes in vegetation related to lake level variation.
during the reporting period.
Lake Waikaremoana HBRC WP982010Ta; HBRC WP982001Ta; Monitoring since 1999 indicates that fluctuations in lake level
HBRC WP982003Ta within the three metre operating range have resulted in detectable
changes to the terrestrial vegetation. The ecological effect of these
3.1.1 LEVEL TRENDS AT LAKE WAIKAREMOANA changes, however, is minor and is comparable to that which would
occur naturally on similar lake shorelines. A lake level regime
Prior to construction of the power scheme, lake levels were
reflecting the natural range of over seven metres would result in
generally high heading into summer, reducing during summer
far more dramatic changes (Single & Shaw, 2005).
and autumn and increasing during winter and spring. Lake
Waikaremoana is managed to reflect this natural cycle. The key driver of vegetation change at Lake Waikaremoana is the
length of time that the lake spends above or below certain levels.
During the reporting period the lake level mimicked this natural
Prolonged high lake levels enable turf communities to establish
pattern of variability closely by rising to its highest level in spring
at high elevations but will also kill terrestrial species that cannot
and dropping steadily through to autumn (see Figure 5). During
tolerate prolonged submergence. Prolonged low lake levels
May the level dropped significantly until it reached its lowest level
have the opposite effect: turf communities dry out and terrestrial
in five years at 17% of volume. For the remainder of the reporting
species are able to establish at lower elevation, where they are at
period the level stayed at low levels which also resembled the
risk of submergence when the level increases again.
natural level fluctuations.
Lake Waikaremoana HBRC WP982030Mc (4) In 2005, in line with a change of resource consent, the original
monitoring programme (Shaw, 1998) was formally revised and
vegetation and shoreline morphology monitoring became more
integrated (Single 2005; Single and Shaw 2005).
Lake Waikaremoana HBRC WP982030Mc (11-12)
The annual Lake Waikaremoana shoreline inspection, involving
circumnavigation of the entire shoreline, photographing, and
evaluating all photo-points, was undertaken in March 2014. Details
of the key findings are reported by Wildland Consultants Ltd
(Wildlands, 2014) and monitoring locations are shown (see Figure 6).
Changes to the shoreline vegetation and profiles in the reporting
period were very minor, with no change evident for 95% of the
monitored sites. Minor changes in the distribution of species
were largely related to the establishment of early successional
terrestrial species due to the lack of high lake levels. Turf
communities were exposed in many places, also due to the
relatively low lake level. Deer sign was commonly present, and
Carex sinclairii was often well-grazed (see Figure 7).
Minor changes occurred locally on the following three shoreline types:
FIGURE 5 // Lake Waikaremoana inflows and level during the
reporting period. Stream Sedimentary Fans;
Wave Cut Terrace with Scarp and
WAIKAREMOANA // 14
Rock Platform or Pavement Overlain with Wave Cut Terrace.
3.2 ECOSYSTEMS AND WATER QUALITY No change was noted on the following seven shoreline types:
The Lake Waikaremoana Monitoring Plan defines the type and Wave Cut Terrace - Gentle Slope;
frequency of monitoring to be undertaken on Lake Waikaremoana. Sandstone boulders grading back into wave cut
The plan was reviewed and updated during the reporting period to terrace (four sites);
reflect the data and information received, recommendations from Rock headland;
consultants and feedback from HBRC and stakeholders, since the Pocket beach;
plan was first developed in 2006. Blocks boulders;
Cliffs and
This section describes the current ecosystem and water quality Narrow sandy beach.
monitoring programmes, which are shown on Figure 6
High lake levels, at or near the top of the operating range, are
positive influence on lakeshore ecology. They are also natural
events, due to periods of high rainfall, and cannot be avoided, at
08
least on an occasional basis. In ecological terms, there are no
new observations of changes or developments on the shorelineFIGURE 6 // Location of Lake Waikaremoana Monitoring Sites.
3.2.2 AQUATIC VEGETATION
relating to lake level management that give cause for concern.
Weed management, however, is an issue that requires further Lake Waikaremoana has high native aquatic plant species
consideration, with Montbretia becoming more and more evident diversity and contains the best remaining example of native
at numerous sites. aquatic vegetation assemblages in a large, deep, clear lake in
the North Island. Aquatic plants (macrophytes) provide substrate
The next annual photo-point inspections will be undertaken in
for epiphytic algae, upon which many littoral (shallow shoreline)
ENVIRONMENTAL REPORT // 14
March 2015, and the next five-yearly vegetation transect re-
macro-invertebrates feed. As such, maintenance of the littoral
measurement is due in March 2016.
zone is important to the productivity and ecology of the lake.
Changes in aquatic macrophyte communities may result from
prolonged periods of lowered water levels which have the
potential to expose shallow-water plant communities. Narrowing
the overall lake level operating range also has the potential to
change the macrophyte species composition. Monitoring of these
communities is, therefore, an important part of lake management.
Lake Waikaremoana HBRC WP982030Mc (15-16)
The littoral aquatic macrophyte vegetation of Lake Waikaremoana
is monitored every five years along 17 transects within the lake.
Prior to this year, the last survey was undertaken in February
2013. The next littoral aquatic macrophyte vegetation survey is due
in February 2018.
FIGURE 7 // Extensive band of exposed turf, heavily grazed by deer,
at the southern end of Wairaumoana (Photo: Wildlands).
093.2.3 TROUT MONITORING 3.2.4 ECOLOGICAL RESTORATION PROGRAMME
Brown and rainbow trout were introduced into Lake Waikaremoana During the resource consents process many complex issues
in 1896 for recreational angling. The resultant fishery is now were raised and worked through with the DOC. Some of these
considered to be of national importance. During summer, brown issues were addressed through consent conditions and the
trout live in the lake’s littoral zone. development of monitoring programmes; others were mitigated
via a ten year agreement with DOC. Under this agreement,
A key feature of the Lake Waikaremoana brown trout fishery is the known as the Waikaremoana Ecological Restoration Programme
opportunity for anglers to stalk around the shoreline spotting and (WERP), Genesis Energy provided funding to DOC for ecological
fishing to brown trout feeding in the shallow lake margins. Lake enhancement around the shore of the lake.
levels can affect this angling opportunity by altering the amount
of shoreline physically accessible during spring and summer. The original focus of WERP was to help secure a viable
High lake levels restrict the number of shoreline sites available kiwi population on the Puketukutuku Peninsula. Over time,
for angling and accessibility for moving between fishing sites as management of the kiwi programme on Puketukutuku Peninsula
there is limited room to wade around the shoreline between the transferred to the LWHRT and their increasing contribution to the
water’s edge and the vegetation. There is also very limited room kiwi programme allowed DOC, with the LWHRT’s support, to focus
for fly fishermen to back-cast: the curtain of vegetation close to on other threatened species such as: whio (blue duck), ngutukaka
the water’s edge limiting the amount of fishable water for this (kaka-beak), Powelliphanta snails, mistletoe and Dactylantus
technique. Fewer places to fish result in more frequent encounters (wood rose). The WERP agreement with DOC concluded in 2008.
with other anglers, more fishing pressure at the fewer fishable
sites and consequently lower catch rates. In the past, Genesis While the original WERP agreement has now expired, Genesis
Energy was required to quantify the change in shore-based Energy continues to work with DOC staff from the Central North
angling opportunity as a result of lake level changes. This consent Island Region and Tangata Whenua on the Genesis Energy
requirement was completed between November 2008 and March sponsored biodiversity management project in the Lake Waikareiti
2010 and was reported in the 2009/10 Annual Environmental area (see Section 6.3).
Report for the WPS (Genesis Energy, 2010). 3.3 SEDIMENT (EROSION, TRANSPORT AND DEPOSITION)
Lake level manipulation also has the potential to affect the The sedimentary geology of the Lake Waikaremoana shoreline
littoral ecosystem and therefore, could adversely affect both is a significant natural feature. Monitoring the effects of the lake
juvenile trout habitat and adult growth rates. Between 2000 and level management regime on the structure and development of
2005, a brown trout monitoring programme was undertaken to shoreline landforms and erosion patterns is a key focus of the
assess any potential adverse effects of the current operating Lake Waikaremoana Monitoring Plan.
regime (Pitkethley and Kusabs, 2005). Brown trout population
estimates for Lake Waikaremoana were originally indexed by Lowering the lake level in the 1940’s exposed large flat areas of
counting spawning adult trout in the Waiotukupuna Stream, soft delta-sediment shorelines. These have subsequently been
one of the major spawning streams. However, these estimates used as sites for huts, tracks, camping grounds, sewage ponds
were not considered satisfactory and a five-yearly intensive and other recreational and tourism assets. Shore change has
trapping operation of trout on their spawning migration in the created hazards at some of these sites. Erosion, in particular,
Waiotukupuna Stream has been instigated in its place. threatens the viability of the assets and impacts on use of the
Lake Waikaremoana HBRC WP982030Mc (17-18) shoreline resource.
The Waiotukupuna Stream fish trap was established on site in In 1999, Allan et al. developed an annual monitoring programme
May 2014 and will be operated 10 nights per month over the 2014 which used a network of profiles and photo-points to assess
winter period (May – August). Figure 6 shows the location of the shoreline change and to determine the adequacy of existing
fish trap. The project is contracted to the Lake Waikaremoana erosion protection works, and set timeframes for future erosion
Hapu Restoration Trust (LWHRT) under the supervision of Fish & hazard management. This programme was formally revised in
Game staff from Rotorua. The first 10 day trapping period in May 2005 and incorporated into the Lake Waikaremoana Monitoring
yielded just two fish, but the June runs increased significantly, Plan. A significant change was the integration of DOC’s assets at
resulting in 136 fish processed. These were all brown trout, up to high erosion risk sites with the shoreline vegetation and erosion
2.4 kg and in good condition. Rainbow trout are expected to start monitoring programmes (Single 2005; Single and Shaw 2005).
showing up in the later runs, particularly through August.
The current comprehensive monitoring network is based on a
combination of beach profile and differential Global Positioning
System (GPS) surveys, covering sites established in 1999–2000.
New sites were also established between 2004 and 2007. Annual
photo-point records compliment five-yearly field transect
measurements, which are designed to assess:
changes in profile form over time;
the stability of the shoreline;
rates of shoreline advance and retreat;
WAIKAREMOANA // 14
changes in the position or patterns of shoreline contours;
predictions of expected future shoreline changes and
measurement of erosion rates on mudstone benches.
Monitoring identifies the magnitude and rates of shore change
around the lake for different shore types and for shores
with different wave exposure, and it will continue to provide
benchmarks for future change.
Changes during the monitoring period 1999–2005 occurred to
beaches, soft shores and mudstone benches. Variations between
annual surveys reflected the characteristics of wind, wave and
water level influences during the period between surveys. Overall,
FIGURE 8 // LWHRT staff receive training on fish trap construction the magnitude of change at Lake Waikaremoana is comparable
and operation from Fish & Game Officers Matt Osborne and Anthony to or less than that measured on other New Zealand lakes
Van Dorp.
10
Single, 2005).A Shoreline Hazard Management Report was also produced
in 2010 (Single et al, 2010) and forwarded to DOC, Hawkes
Bay Regional Council (HBRC) and to local Tangata Whenua
representatives. The report presents information for managing
the risk posed by lake level changes, to activities and assets
around the shore of Lake Waikaremoana. This report is a
valuable resource to assist future asset management on the Lake
Waikaremoana shoreline.
Lake Waikaremoana HBRC WP982030Mc (13-14)
The annual Lake Waikaremoana shoreline inspection, involving
circumnavigation of the entire shoreline, photographing, and
evaluating all photo-points, was undertaken in March 2014.
Details of the key findings are reported by Shore Processes and
Management Ltd (Single, 2014) and monitoring points are shown
(see Figure 6).
The 2014 inspection of the shoreline and comparison to the
historic photographic record showed only slight geomorphological
changes at monitored sites, and on other sections of the shore
inspected in association with the vegetation assessment.
There was no evidence of water level or wave events noticeably
modifying or adjusting the beaches.
The next annual inspection and photo-point survey is due in
March 2015, while the next shoreline profile transect resurvey is
scheduled for 2016. This survey date will coincide with the five-
yearly vegetation survey.
3.3.1 EVENT-DRIVEN MONITORING
Lake Waikaremoana has a large catchment with a restricted
outlet and lake levels can rise very rapidly following heavy rainfall.
Vegetation within the three metre operating range can experience
dramatic change, depending on whether it is submerged, and
for how long. The shoreline substrate also experiences dramatic
change in moisture level and wave energy in relation to the degree
of inundation.
Lake Waikaremoana HBRC WP982030Mc (11-14)
Event-driven monitoring is required when lake levels exceed
583.29 masl or go below 580.29 masl for more than seven
consecutive days. Event driven monitoring was not required during
the reporting period.
ENVIRONMENTAL REPORT // 14
1112 WAIKAREMOANA // 14
04
RIVER
WAIKARETAHEKE04 WAIKARETAHEKE RIVER
The Waikaretaheke River is the natural outlet from Lake
Waikaremoana. Below the lake outlet, the river has cut into the
landslide debris creating a very steep, incised and fast-flowing
river system.
Damming the natural outlet, sealing spring leaks and creating
lakes for the purposes of power generation has modified the
upper Waikaretaheke River catchment significantly. The two man-
made lakes, Kaitawa and Whakamarino, have become renowned
trout fisheries: Lake Whakamarino, in particular, produces high
numbers of very large trout.
A change of resource consent in 2005 sought a more focused and
targeted monitoring programme for the Waikaretaheke River,
which is articulated in the Waikaretaheke River Monitoring Plan.
The change of resource consent also allows for improvements
to the monitoring programmes to be made as more information
becomes available.
FIGURE 9 // Lake Kaitawa level during the reporting period.
Key outcomes of the 1998 resource consents process and the
subsequent change of resource consent in 2005 were:
a 3.4 m operating range for Lake Kaitawa and a 1.8 m range
for Lake Whakamarino;
a requirement to measure and record the amount of flow During the reporting period, Lake Kaitawa achieved a very
in the Waikaretaheke River and the three power stations and high level of compliance (Table 5). Two minor non-compliances
to provide this data annually to the Hawkes Bay Regional occurred during the reporting period lasting 10 and 15 minutes
Council (HBRC); respectively. The maximum drop below the minimum control level
minimum flows of 25 l/s downstream of the Waikaretaheke was 7.7 cm. Both events occurred one day apart at midnight on
Diversion Structure and five l/s downstream of the the 11 January and the 12 January 2014; during the testing of a
Whakamarino Dam; different operating regime for the scheme. An investigation was
a requirement to maintain the quality of water discharges undertaken and appropriate actions put in place to help prevent
from the Waikaremoana Power Scheme (WPS); this from reoccurring in the future.
an agreement with the New Zealand Recreational Canoeing During the reporting period the lake level spilt over the Kaitawa
Association – now known as Whitewater NZ – to provide tip gate on two occasions, the first was on the 29 January 2014
recreational kayaking opportunities within the Waikaremoana and the second was on the 10 April 2014. On both occasions the
Power Scheme; spill was less than five m3/s and was part of normal consented
an agreement with Transit New Zealand – now known as the operation of the scheme.
New Zealand Transport Authority (NZTA) – to monitor erosion
in the Waikaretaheke River;
an agreement with Federated Farmers to provide minimum TABLE 5 // Lake Kaitawa level compliance during
flows as a stock barrier downstream of Piripaua Power Station; the reporting period.
preparation and implementation of the Waikaretaheke River
Monitoring Plan that includes monitoring programmes for: Parameter Value (masl) Compliance (%) Consent Number
(condition)
macro-invertebrates below the Waikaretaheke
Minimum level 450.1 99.99 WP982121Mb (3)
Diversion Gates;
the effect of recreational releases on trout in the river; Maximum level 453.5 100 WP982121Mb (3)
an elver trap and upstream transfer programme;
a mature eel downstream transfer programme and 4.1.2 WAIKARETAHEKE RIVER FROM KAITAWA SPILLWAY
hydrology monitoring. TO LAKE WHAKAMARINO
4.1 HYDROLOGY The damming and diversion of waters from the Waikaretaheke
ENVIRONMENTAL REPORT // 14
River by the Waikaretaheke Diversion Structure have reduced the
4.1.1 LAKE KAITAWA
magnitude and variability of flows downstream, thereby reducing
Lake Kaitawa was formed following the construction of an earth the amount of habitat available for aquatic flora and fauna.
dam and weir across the Waikaretaheke River in the mid-1930s, Investigations into invertebrate populations have shown that the
converting a small spring-fed lake and wetland into a larger numbers in the river below the diversion structure are lower
storage reservoir. The water level was raised by approximately than would naturally have occurred. A minimum flow of 25 l/s is
three m, creating a lake with a surface area of approximately 6.1 released downstream of the Waikaretaheke Diversion Structure to
ha. The lake is fed by water diverted from the Waikaretaheke River provide some suitable habitat for native flora and fauna.
and a number of springs that flow directly into the lake. Waikaretaheke River HBRC WP982320Mf (6, 8)
Lake Kaitawa HBRC WP982121Mb
To maintain the minimum flow of 25 l/s downstream of the
Lake Kaitawa is the headpond for Tuai Power Station. The Waikaretaheke Diversion Structure, holes have been drilled
operating range of the lake is 3.4 m, from 450.1 to 453.5 masl through the gate to release the correct flow. To maintain the flow
(Figure 9). Water for the Tuai Power Station is taken through the Genesis Energy staff check the holes regularly to ensure that they
Tuai Intake, located on the eastern side of the lake, at a maximum remain free of any blockages.
rate of up to 42 m3/s. There is no minimum flow requirement in the
Compliance with this consent can be measured in two ways, from
Waikaretaheke River downstream of Lake Kaitawa, with seepage
quarterly volumetric flow gaugings and via calculation from the
and spring flows creating flow only a short distance downstream.
flow station at the intake structure. The calculation is a more
effective way to measure this minimum flow requirement it uses
hydraulic head from the local water level station at the diversion
gates. Over time it was found that the volumetric gaugings
13
confirmed the flow calculation, Genesis Energy now measuresits consent compliance in real time using this method. All of the
gauged flows and flow data for this reporting period were above
the minimum flow with full compliance being achieved (see Figure 10).
The calculation for this flow was included in the annual hydrology
data audit and the audit confirmed that this method was
appropriate
FIGURE 11 // Lake Whakamarino level during the reporting period.
TABLE 6 // Lake Whakamarino level compliance for the
reporting period.
FIGURE 10 // Waikaretaheke Diversion minimum flow record during
the reporting period.
Parameter Value (masl) Compliance (%) Consent Number
(condition)
Minimum level 246.3 100 WP982420Md (5)
It is noted that the dip in flow in July 2013 was due to the Maximum level 248.1 100 WP982420Md (5)
gates being lifted, when this occurs the minimum flow is met
downstream of the gates (as the water is released under the gate)
A minimum flow of at least five l/s is maintained in the
Genesis Energy is required to close the Waikaretaheke Diversion Kahuitangaroa Stream immediately downstream of Lake
for two hours, whenever a flow of greater than five m³/s is spilled Whakamarino. The minimum flow is based on leakage flow from
from Lake Kaitawa down the Waikaretaheke River. Spill from Lake the drainage galleries within the dam. This flow is monitored
Kaitawa is not permitted on 01 October, the first weekend after 01 quarterly by Genesis Energy hydrology staff and was fully
October, or during Labour Weekend, to reduce discolouration in compliant during the reporting period.
Lake Whakamarino during these important angling periods. 4.1.4 WAIKARETAHEKE RIVER BELOW PIRIPAUA POWER STATION
This condition was not exercised during this reporting period. During the consent process, farmers along the Waikaretaheke
4.1.3 LAKE WHAKAMARINO River, downstream of Piripaua Power Station, raised concerns that
the river did not provide an adequate stock barrier during times
Lake Whakamarino was created following the construction of low flow from Piripaua Power Station. Following a number of
of an earth dam (which contains a spillway structure) across flow trials, Genesis Energy reached an agreement with Federated
the Kahuitangaroa Stream. The lake has a surface area of Farmers to provide a minimum flow from Piripaua Power Station
approximately 29.8 hectares. Water for the Piripaua Power Station of two m3/s between 1 November and 31 March each year.
is taken through the Piripaua Intake, located on the south-eastern
side of Lake Whakamarino, at a maximum rate of up to 49 m3/s. The seasonal minimum flow below Piripaua Power Station,
Below Whakamarino Dam a continuous minimum flow of as agreed with Federated Farmers, was compliant during the
five l/s is maintained. reporting period except for a single event lasting 6 hours (from
Lake Whakamarino HBRC WP982420Md (6) 9:00am to 3:00pm) on 3 November 2013. During this event,
Piripaua Power Station was shut down to provide low flows (0.8
As part of the schemewide maintenance consent Genesis Energy m³/s) for Fish & Game to undertake a drift dive to assess trout
may lower the level of water in Lake Whakamarino by up to one m numbers (see Section 4.2.2). Federated Farmers and adjacent
below the minimum operating level (246.3 masl) for the purpose of land owners were notified in advance of the event and no concerns
undertaking any maintenance and/or repair work(see Section 5.1) were raised. The compliance record is shown in the hydrograph
WAIKAREMOANA // 14
below (see Figure 12).
Lake Whakamarino has a normal operating range of 1.8 m, from
246.3 to 248.1 masl (Figure 11). There was one period of 9 hours
and 35 minutes (from 9:10pm on 23 July to 8:40pm 24 July)
where the above consent condition was exercised to allow for the
installation of an eel bypass in the dam wall. During this time, the
minimum level that the lake reached was recorded as 245.5 masl,
well within the one m allowance.
14TABLE 7 // Design capacities of discharge control points within the WPS.
Site Type Design Capacity l/s Consent No.
Kaitawa tunnels Discharge g/w and drainage water 80 DP982020W
Kaitawa weir drains Discharge to Waikaretaheke River 100 DP982111W
Kaitawa Power Station penstock main inlet valve Discharge to unnamed tributary 700 DP982114W
Kaitawa Power Station tailrace Take for cooling 110 WP982113T
Tuai Power Station Discharge 10 DP982220W
Waikaretaheke Diversion Canal Discharge to Waikaretaheke River 100 DP982323W
Piripaua Power Station cooling circuits and penstocks Discharge to Waikaretaheke River 100 DP982512W
Piripaua Power Station oil interceptor Discharge to Waikaretaheke River 15 DP982515W
Piripaua Power Station tailrace Take for cooling 110 WP982511T
Piripaua Tunnel large siphon Discharge to Waikaretaheke River 200 DP982501W
Piripaua Tunnel small siphon Discharge to an unnamed tributary of the 150 DP982503W
Waikaretaheke River
Tuai Outdoor Switchyard cooling water system Discharge to an unnamed tributary 11 DP982403W
Tuai Power Station cooling water system Discharge to Lake Whakamarino 100 DP982412W
Tuai Power Station oil interceptors Discharge to Lake Whakamarino 20 DP982413W
Tuai Outdoor Switchyard cooling water system No.1 Discharge to Kahutangaroa Stream 1.4 DP982414W
Tuai auxiliary turbines Discharge to Lake Whakamarino 400 DP982415W
4.2.1 MACRO-INVERTEBRATES
The Waikaretaheke Monitoring Plan requires regular assessment
of macro-invertebrate communities in the Waikaretaheke
downstream of the diversion structure to assess the effect of
reduced flows below the Waikaretaheke Diversion structure,
down to the Mangaone Stream confluence where flow recovery
begins. Genesis Energy engaged the National Institue of Water
& Atomospheric Research (NIWA) to undertake a five year
study between 1999 and 2003 to assess the effects on macro-
invertebrates of increasing minimum residual flows in the
Waikaretaheke River below the Waikaretaheke River diversion
structure (Scarsbrook & Bowman, 2003). Results collected by
Tonkin & Taylor in March/April 2009 were compared to the NIWA
five year study. Tonkin & Taylor (2009) recommended that five-
yearly assessments of sites above and below the Intake would be
sufficient to provide an ongoing dataset that can be used to assess
long-term impacts of the WPS on the Waikaretaheke River.
This recommendation was accepted by the HBRC in October 2009.
Lake Whakamarino HBRC WP982420Md (9)
FIGURE 12 // Flow below Piripaua Power Station 1 November 2013 Piripaua Power Station HBRC DP982510Wb (11)
and 31 March 2014.
Waikaretaheke River HBRC WP982320Mf (13)
Macro-invertebrate and periphyton communities were surveyed
ENVIRONMENTAL REPORT // 14
in the Waikaretaheke in April 2014 and reported by Freshwater
4.1.5 MAXIMUM FLOWS: WAIKARETAHEKE RIVER AND LAKES Solutions Ltd (Montgomerie, 2014). Survey locations are shown in
WAIKAREMOANA, KAITAWA AND WHAKAMARINO Figure 13. The survey used the same methods as previous surveys
by NIWA and Tonkin & Taylor, at three sites at varying distances
Resource consents specify maximum flow limits, based on design
(20, 200 and 400 metres) below the Waikaretaheke Diversion and
criteria, for several discharge control points (Table 7). There
one reference site upstream.
have been no modifications to any of these control points and
therefore no alteration of their flow capacities. Genesis Energy The periphyton cover of percent thick mats ( 3 mm) was below
was therefore fully compliant with these conditions during the the Biggs (2000) guideline for the protection of aesthetic and
reporting period. recreational values at all sites. The highest cover of thick mats
4.2 AQUATIC ECOSYSTEMS AND WATER QUALITY (20%) was recorded at the site immediately below the diversion
where shallow water depth, a lack of channel shading and low,
The Waikaretaheke River Monitoring Plan defines the type and stable flows were conducive to supporting thick algal mat growth.
frequency of monitoring to be undertaken on Waikaretaheke River. The community at this site was dominated with what appeared to
The plan was reviewed and updated during the reporting period to be late stage Phormidium (Cyanobacteria), a potentially toxic algae
reflect the data and information received, recommendations from species. The percent cover of long filamentous algae exceeded
consultants and feedback from HBRC and stakeholders, since the the Biggs (2000) guideline of 30% immediately below the diversion
plan was first developed in 2006. and again at the site below the Waikaretaheke Siphon (some 200 m
further downstream). The exceedance of the Biggs (2000) guidelines
This section describes the current ecosystem and water quality at these sites reflects the stable, low flows at the sites.
monitoring programmes which are shown on Figure 13.
15
Mean Macro-invertebrate Community Index (MCI) scores have
remained within a narrow band [between 100 - 110 or “good”You can also read