Brighton & Hove Bike Share Business Case and Business Plan
←
→
Page content transcription
If your browser does not render page correctly, please read the page content below
Brighton & Hove Bike      Brighton & Hove City Council
Share Business Case and
Business Plan

Report                    Our ref: 22745301
December 2014             Client ref:
Brighton & Hove Bike                                  Brighton & Hove City Council
Share Business Case and
Business Plan

Report                                                Our ref: 22745301
December 2014                                         Client ref:

Prepared by:                                         Prepared for:

Steer Davies Gleave                                  Brighton & Hove City Council
28-32 Upper Ground                                   Hove Town Hall
London SE1 9PD                                       Norton Road
                                                     Hove
                                                     BN3 3BQ
+44 (0)20 7910 5000
www.steerdaviesgleave.com

Steer Davies Gleave has prepared this work for Brighton & Hove City Council. This work may only be
used within the context and scope of work for which Steer Davies Gleave was commissioned and may
not be relied upon in part or whole by any third party or be used for any other purpose. Any person
choosing to use any part of this work without the express and written permission of Steer Davies Gleave
shall be deemed to confirm their agreement to indemnify Steer Davies Gleave for all loss or damage
resulting therefrom. Steer Davies Gleave has prepared this work using professional practices and
procedures using information available to it at the time and as such any new information could alter the
validity of the results and conclusions made.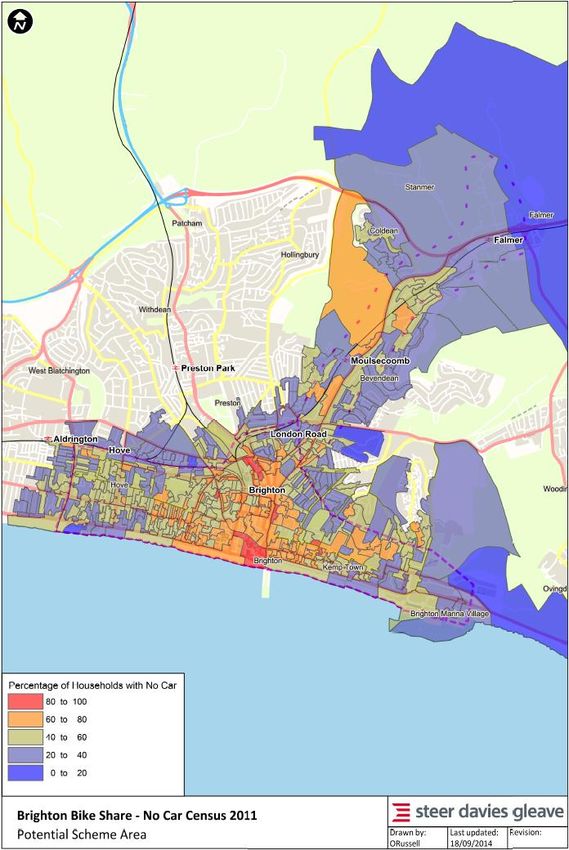
Contents

Executive Summary...................................................................................................................... 1

1       Introduction ....................................................................................................................... 3
        Structure of Document ................................................................................................................. 3

2       Policy Context and Rationale .............................................................................................. 4
        National Cycle Policy..................................................................................................................... 4
        Coast to Capital LEP Strategic Economic Plan .............................................................................. 5
        City Plan ........................................................................................................................................ 7
        Local Transport Plan ..................................................................................................................... 8
        Transport and Health .................................................................................................................... 9
        Strategy for the Visitor Economy................................................................................................ 13
        Biosphere .................................................................................................................................... 13
        One Planet Living ........................................................................................................................ 14

3       Scheme Description and Development .............................................................................. 15
        Scheme Description .................................................................................................................... 15
        Market Analysis .......................................................................................................................... 16

4       Scheme Costs ................................................................................................................... 31
        Capital Costs ............................................................................................................................... 31
        Operating and Maintenance Costs ............................................................................................. 33
        Bike Renewals ............................................................................................................................. 33

5       Scheme Demand and Revenues ........................................................................................ 34
        Demand Forecasts ...................................................................................................................... 34
        Revenue Forecasts ...................................................................................................................... 35

6       Strategic and Economic Case ............................................................................................. 37
        Strategic Case – Fit with Policy Objectives ................................................................................. 37
        Economic Case – Value for Money ............................................................................................. 40
        Contribution to the Strategic Economic Plan ............................................................................. 47
        Local Policy.................................................................................................................................. 49

7       Financial Case ................................................................................................................... 52
        Cost and Funding Profile............................................................................................................. 52

                                                                                                                                          December 2014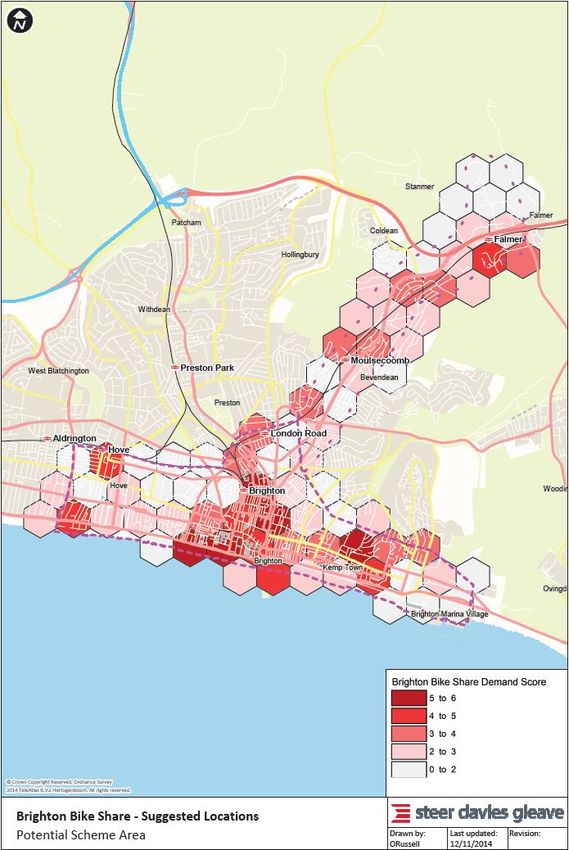
Affordability and Financial Sustainability ................................................................................... 52

8   Management Case - Delivery Plan ..................................................................................... 54
    Promoter / Sponsor .................................................................................................................... 54
    Planning Consents and TROs ...................................................................................................... 54
    Stakeholder Engagement............................................................................................................ 54
    Implementation Programme ...................................................................................................... 55

9   System Procurement – Commercial Case ........................................................................... 56
    Social Enterprise Approach......................................................................................................... 56
    Organisational Model ................................................................................................................. 59
    Protecting Assets ........................................................................................................................ 59
    Monitoring and Evaluation ......................................................................................................... 60

    Figures
    Figure 2-1: Brighton & Hove AQMA.............................................................................................. 9
    Figure 3-1: Number of Hexcells by Good Potential Score .......................................................... 28
    Figure 6-1: User Benefit Calculation: Example JourneyOn Trip.................................................. 44
    Figure 8-1: Suggested Implementation Programme .................................................................. 55
    Figure 9-1: Breakdown of Total Income by Source .................................................................... 58
    Figure 9-2: Breakdown of Total Expenses by Type ..................................................................... 59

    Tables
    Table 2-1: Coast to Capital Local Enterprise Partnership Local Growth Fund Breakdown (£m) .. 7
    Table 2-2: Reduced Health Risk Through Physical Activity ......................................................... 11
    Table 3-1: Benchmarking Brighton & Hove to Other Bike Share Locations ............................... 17
    Table 3-2: Criteria for Assessing Potential for Bike Sharing Location by Hexcell ....................... 28
    Table 3-3: Bicycles to Hire per 1,000 Population in Existing Schemes ....................................... 29
    Table 4-1: Capital Costs per Bike Share Bike .............................................................................. 32
    Table 4-2: Scheme Capital Cost Estimate ................................................................................... 32
    Table 5-1: In Scope Population and Daily Trips by User Type .................................................... 34

                                                                                                                               December 2014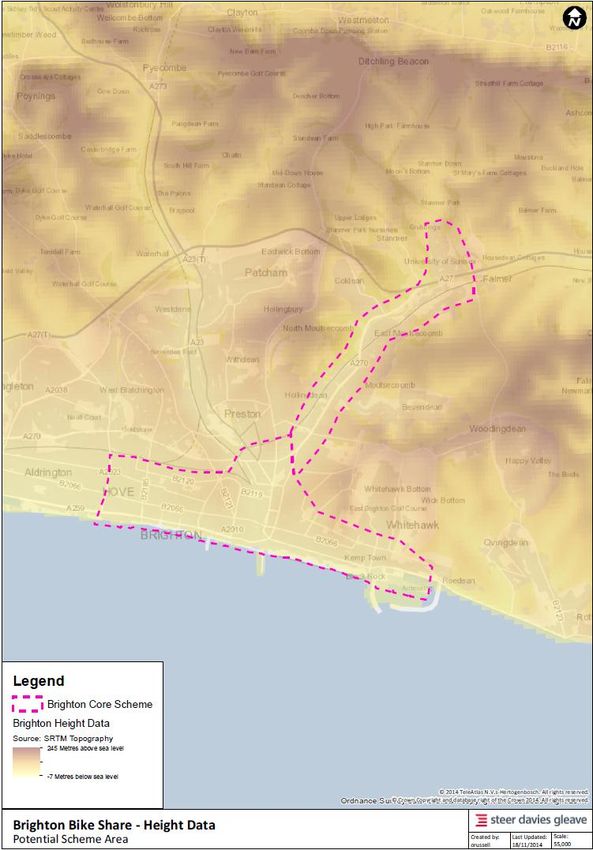
Table 5-2: Current Cycle Mode Share, Potential Bike Share Mode Share and Daily Trips by User
    Type ............................................................................................................................................ 35
    Table 5-3: Tariffs for Existing Bike Share Schemes ..................................................................... 35
    Table 5-4: Revenue Estimates, Based on 2,400 trips per Day .................................................... 36
    Table 6-1: Economic Appraisal of Bike Share ............................................................................. 42
    Table 6-2: Sensitivity Tests (2016/2017, £000s, 2010 prices) .................................................... 43
    Table 6-3: Assessment of Economic Benefits Relating to Transport .......................................... 43
    Table 6-4: Assessment of Economic Benefits Relating to Economic Growth ............................. 45
    Table 6-5: Assessment of Social Distributional Impact............................................................... 46
    Table 6-6: Assessment of Environmental Impact ....................................................................... 47
    Table 6-7: Assessment of Impact on Jobs ................................................................................... 47
    Table 6-8: Assessment of Impact on Employment Floorspace................................................... 48
    Table 6-9: Assessment of Impact on Housing............................................................................. 48
    Table 6-10: Assessment of Impact on Sustainable Transport and Network Resilience ............. 48
    Table 7-1: Funding Breakdown ................................................................................................... 52
    Table 7-2: Annual Operating Costs and Revenues (£000s, 2010 prices) .................................... 53
    Table 7-3: Financial Sustainability Sensitivity Tests (£000s, 2010 prices) .................................. 53
    Appendix B.1: Brighton Beach Bikes (run by Brighton Sports Company) ................................... 73
    Appendix B.2: Re:Cycle (run by students at the University of Sussex) ....................................... 73
    Appendix B.3: Summary of Cycle Hire Prices.............................................................................. 73

    Appendices

A   Scheme Supporters

B   Informing the Scheme Specification

C   Smarter TravelStyle

                                                                                                                                      December 2014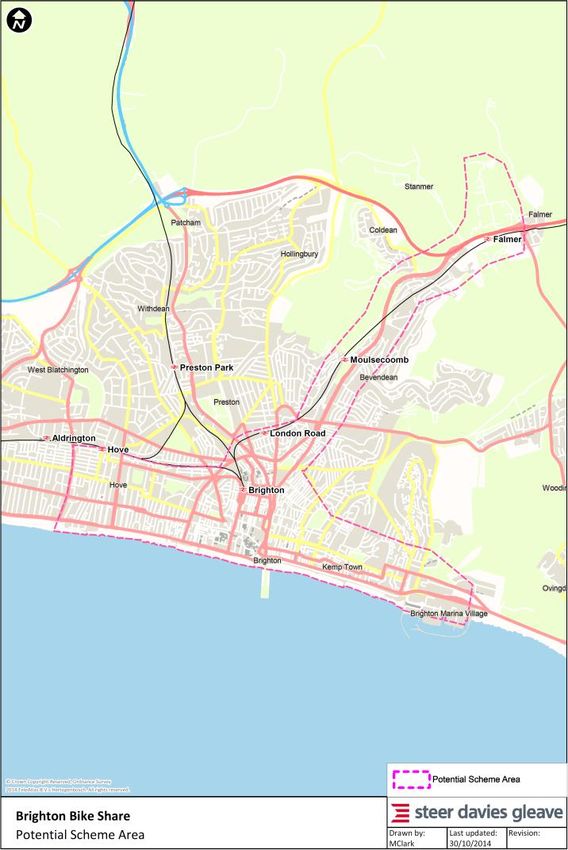
Executive Summary
Project Description
Brighton & Hove City Council (BHCC) and the Brighton & Hove Clinical Commissioning Group
(CCG) have commissioned this study to develop a business case and plan for a Bike Share
system in Brighton & Hove.
There has been a long standing interest in developing a Public Bike Share system in Brighton &
Hove. In 2010 a study was undertaken considering the feasibility of introducing Public Bike
Share to Brighton & Hove, this was followed by a ‘soft market test’ with potential Bike Share
providers in 2011. In recent years there has been considerable activity, growth and innovation
in the Bike Share market with new schemes launching and existing schemes expanding in the
UK and worldwide.
The proposed scheme area (shown in
the map to the right) covers from Hove
Station in the west, to Brighton Marina
Village in the east and along the A270
corridor to Falmer and the University of
Sussex to the north.
We recommend a scheme including 50
docking station locations spread across
the scheme area with 430 bikes.
The scheme is designed for use by
residents, rail commuters, employees
and tourists, with tariffs designed to
encourage journeys of up to 30
minutes in length and maximise the
utilisation of each bike.
The total capital cost of the scheme is
estimated to be £1.45m in 2014 prices.
Project Business Case and Benefits
The purpose of this document is to
provide supporting analysis and
evidence for the funding bid
submission to the Coast to Capital
(C2C) LEP. The case presented in this document underpins the summary information that will
be provided to the LEP in the scheme pro-forma.
A detailed assessment of the demand and benefits of the scheme has been undertaken. This
shows that forecast usage is estimated to be 884,000 trips per annum, and forecast revenues
will be £921,000 per annum in 2014 prices. Our analysis suggests that scheme revenues will
exceed operating costs, and that the scheme will therefore be financially sustainable.
An economic appraisal of the scheme has been undertaken, and this suggests that the project
will deliver a benefit to cost ratio of over 7 : 1, suggesting the project will deliver very high
value for money.

                                                                                   December 2014 | 1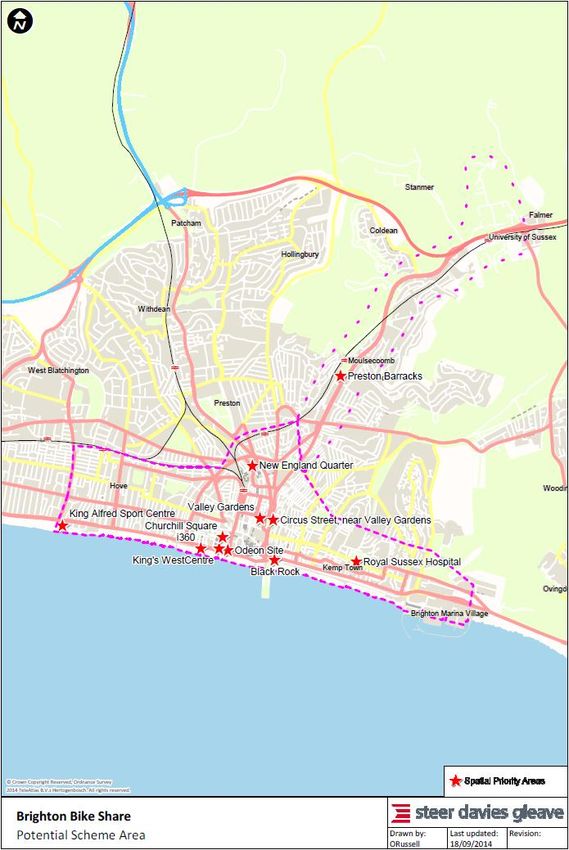
We have also assessed the contribution of the project to the wider objectives of the Coast to
Capital LEP, around employment, housing and delivery of development. The case presented
shows that the scheme is fully supportive of, and will assist in the delivery of these wider
objectives.
In addition, the project will support the delivery of local objectives. The integration of
transport policy and health, and specifically the role that the promotion of active travel can
play in promoting better health outcomes is a fundamental element of the scheme. A related
benefit is the role Bike Share will play in reducing emissions within a designated Air Quality
Management Area.
Funding Bid
The compelling business case for Bike Share presented in this document supports BHCC and its
partners funding bid for Bike Share, with funding sought from the £3.7m Coast to Capital LEP
Growth Deal allocation for Sustainable Transport Packages for 2015/16.
BHCC and its partners are seeking £1.16m (2014 prices) of funding from the LEP, which would
support the implementation of the scheme starting in the financial year 2015/16 and
completing in the financial year 2016/17. The promoters will contribute £0.29m, equivalent to
20% of the scheme costs, through local contributions.
Stakeholder Support
Stakeholder support for a scheme of this kind is important to developing and successfully
launching the scheme. BHCC have worked closely with the local Clinical Commissioning Group
(CCG) and local stakeholders to garner support for the proposed scheme. Details of
stakeholders who have noted their support for the proposed scheme are included in Appendix
A.

                                                                                 December 2014 | 2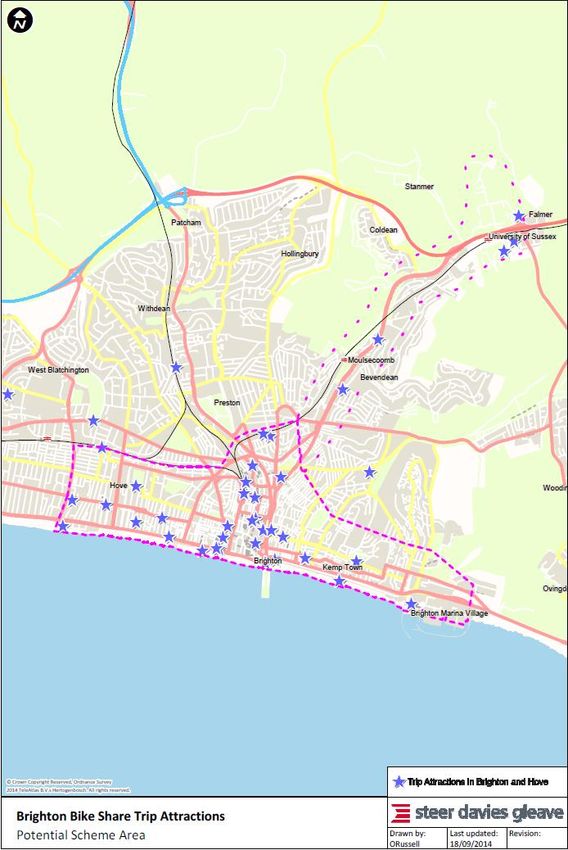
1 Introduction
1.1 Brighton & Hove City Council (BHCC) and the Brighton & Hove Clinical Commissioning Group
(CCG) have commissioned this study to develop a business case and plan for a Bike Share
system in Brighton & Hove.
1.2 There has been a long standing interest in developing a Public Bike Share system in Brighton &
Hove. In 2010 a study was undertaken considering the feasibility of introducing public Bike
Share to Brighton & Hove, this was followed by a ‘soft market test’ with potential Bike Share
providers in 2011. In recent years there has been considerable activity, growth and innovation
in the Bike Share market with new schemes launching and existing schemes expanding in the
UK and worldwide.
1.3 The project covers Central Brighton extending to Hove in the west and Brighton Marina to the
east, and also includes the A270 corridor to Falmer / University of Sussex to the north. The
scheme comprises 50 docking station locations spread across the scheme area with 430 bikes.
1.4 This document presents the business case and business plan for the proposed Bike Share
scheme, and is the basis for a funding submission to the Coast to Capital LEP.
Structure of Document
1.5 This document includes the following chapters:
Chapter 2 - Policy Context and Rationale
Chapter 3 - Scheme Development and Description
Chapter 4 - Scheme Costs
Chapter 5 - Scheme Demand and Revenues
Chapter 6 - Strategic and Economic Case
Chapter 7 - Financial Case
Chapter 8 - Management Case - Delivery Plan
Chapter 9 - System Procurement – Commercial Case
December 2014 | 3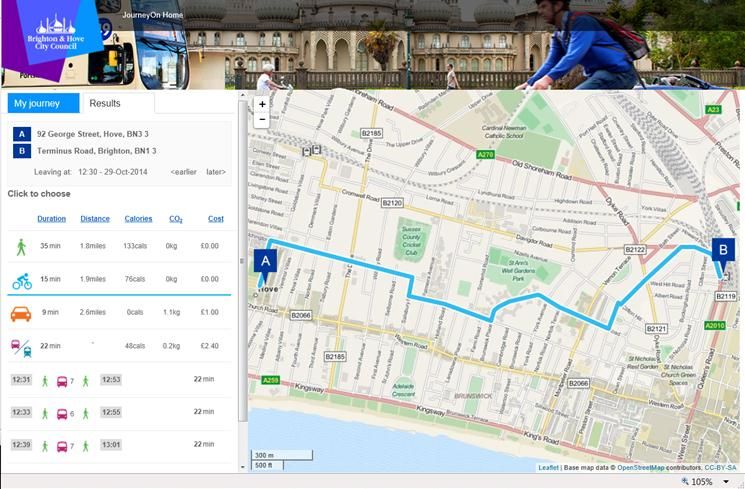
2     Policy Context and Rationale
2.1   This chapter sets out local and national policies which relate to the Brighton & Hove Bike Share
      scheme. An assessment of the contribution of the Bike Share scheme in supporting these
      objectives is provided in Chapter 6.
      National Cycle Policy
2.2   Cycling is a priority for Central Government. The Prime Minister’s vision is for a nation where
      cycling levels compete with those in Denmark, the Netherlands and Germany, where people
      want to live and work and where international organisations are confident the infrastructure is
      in place for them to do business.
2.3   In October 2014 the DfT published their (draft) Cycling Delivery Plan1, which supports
      Government’s ambition for cycling to become an everyday choice for short distance journeys
      among the population as a whole.

      “The government is committed to giving people a realistic choice to cycle
      so that anyone, of any age, gender, fitness level and income can make the
      choice to get on a bike. The case for cycling as the natural choice for
      shorter journeys is strong, and the resulting benefits are wide reaching -
      to the economy, to the environment, to the health of individuals and
      communities.” Cycling Delivery Plan (Consultation draft), DfT, October
      2014

2.4   The Plan is a ten year strategy for delivering the desired step change in cycling. It calls for
      leadership, commitment and long term planning from a wide range of stakeholders including
      local and national government, businesses, interest groups and individuals.
2.5   The ambition is to double cycling, where cycling activity is measured as the estimated total
      number of bicycle stages made each year, from 0.8 billion stages in 2013 to 1.6 billion stages.
      To achieve this the Government is calling for local authorities and LEPs to affirm their
      commitment to increasing local levels of cycling and to set out local visions and ways to
      increase and support cycling. In exchange Government will provide access to a range of tools
      and incentives to help realise local ambitions, including access to new funding streams,
      support from the DfT’s Active Travel Consortium and support in implementing cycling plans.

      1
      https://www.gov.uk/government/consultations/cycling-delivery-plan-informal-consultation

                                                                                         December 2014 | 4
2.6 To ensure the uptake of cycling across the population as a whole, infrastructure needs to be
put in place to ‘cycle proof’ the network, including providing improvements to infrastructure,
allowing access to cycling facilities, storage and parking. Additionally the DfT is developing a
programme of work to address the issue of safety with the view of reducing the rate of cyclists
being killed or seriously injured on the roads and to address the perception that cycling is not
a safe mode of transport.
2.7 In August 2014, the DfT published a report detailing the outcomes of a value for money
assessment of the 12 large Local Sustainable Transport Fund projects which received more
than £5 million DfT contribution2. Funding for these projects was awarded between 2011 and
2012. The report finds the 12 projects represent a combined return on investment of 5:1,
demonstrating that investment in local sustainable transport, including walking and cycling,
represents very high value for money.
Coast to Capital LEP Strategic Economic Plan
Policy Objectives
2.8 The Coast to Capital (C2C) Strategic Economic Plan (SEP) sets out the LEP’s strategy to
encourage growth across the region by investing in infrastructure and innovation and
supporting the economy. The SEP aims to create:
60,000 new jobs;
26,000 additional homes; and
970,000 m2 of new employment space.
2.9 The SEP acknowledges that transport, quality of life in its communities and its skilled
workforce give the region a competitive advantage in achieving the desired level of growth. In
order to maintain this competitive advantage, the SEP strives to deliver several objectives
including:
To provide residents of the C2C region with access to opportunities to improve their skills
and progress in their careers; and
That public transport will enable people to gain access to education, learning and a wider
range of jobs.
2.10 The SEP aims to deliver economic and residential growth alongside its vision for sustainability:
maximising wellbeing and protecting the environment, without impacting on the ability of
future generations to do the same.
2.11 In order to realise this vision, the SEP identifies six strategic priorities:
i. Successful growth locations, including transport investment;
ii. Support business investment in growth and create the conditions for enterprise to
flourish;
iii. Build competitive advantage – back investment and development where we can lead
nationally and internationally;
iv. Skills and workforce – encouraging employers to invest more and making the most of
our talent;
2
https://www.gov.uk/government/uploads/system/uploads/attachment_data/file/347894/vfm-
assessment-of-lstf.pdf
December 2014 | 5v. Ensure digital infrastructure is fit to drive growth; and
vi. Develop sustainable communities and invest in strategic infrastructure to unlock
growth.
2.12 Within the successful growth locations and transport infrastructure priority the SEP commits to
reducing car journeys through sustainable transport improvements, thereby contributing to
national requirements to reduce carbon emissions, tackling congestion and improving journey
quality and reliability.
Transport Objectives
2.13 Performance of the Coast to Capital region is good but further investment in infrastructure is
integral to sustaining and building on its economic success.
2.14 The relative wealth of the area has meant that the car is the most dominant mode of travel,
with a very high level of car ownership compared with the national average. Several road and
rail links are over capacity in the region, which causes frequent congestion. This is aggravated
because the network does not have spare capacity to cope with incidents such as vehicle
collisions or adverse weather.
2.15 The SEP identifies transport as key to supporting the delivery of its wider objectives. Five
overarching transport objectives have been developed enable successful delivery of the SEP
objectives:
i. Connectivity: ‘Can I get where I want to go’
ii. Reliability: ‘Will I arrive when I expect’
iii. Capacity: ‘Will I get a seat, a parking space, a clear road’
iv. Quality: ‘Will my journey be healthy, safe, clean, sustainable and enjoyable’
v. Resilience: ‘Will transport be there when I need it – 24/7’
Spatial Objectives
2.16 The SEP recognises Brighton & Hove as a ‘city with an international reputation for creativity
and entrepreneurism’ and the foundation of C2C’s economy, with its successful creative and IT
based industries.
2.17 Brighton & Hove has excellent connections with the Gatwick Diamond and beyond into
Croydon and London. As a result of its connections, Brighton & Hove serves markets
throughout London, the South East and overseas.
2.18 As well as its successful digital economy, Brighton & Hove is a key centre for tourism,
something the C2C SEP intends to build over the coming years.
C2C Growth Deal
2.19 The Growth Deal brings together the local, national and private funding for the Coast to
Capital’s growth priorities identified in the LEP’s SEP.
2.20 The C2C LEP has secured £202.4 million from the Central Government’s Local Growth Fund to
support growth in the area. This investment from Government will result in at least £240
million of additional investment from local partners and the private sector, making the
combined total new investment package worth £442.4 million for the C2C LEP. Further to this,
£237 million will be invested in the new housing which will be enabled by the Growth Deal
investment.
December 2014 | 6Table 2-1: Coast to Capital Local Enterprise Partnership Local Growth Fund Breakdown (£m)
2015/16 2016 onwards Total
Local Growth Fund Award 38 124.2 162.2
Previously Committed Funding 6.1 18.1 24.2
Provisional Allocations to Projects Starting in 2016/17 and Beyond - 16.0 16.0
Total 44.1 158.3 202.4
2.21 Coast to Capital and Central Government have agreed to co-invest in a number of jointly
agreed priorities including:
Sustainable Transport Packages – £31.7 million Government and £10 million LEP funding
to tackle congestion and improve sustainable transport, with £3.7 million to come forward
in 2015/16;
Brighton Valley Gardens Phase 3 – £6 million Government funding for transport network
improvements to allow new businesses and innovation space, regeneration of existing
area and new housing development;
Central Brighton and Preston Barracks Central Research Laboratory – £7.7 million
Government and £3.5 million LEP funding for a city centre mixed land use regeneration
project to deliver new homes, office building, student accommodation, a library and
academic buildings;
City College Brighton & Hove – £21 million Government and £46 million LEP funding for
the refurbishment of dilapidated buildings and facilities;
Circus Street and Edward Street Quarter – £2.7 million Government and £35 million LEP
funding for the redevelopment of a brownfield site including office, housing and retail
space; and
Resilience Schemes – £35.9 million investment for Intelligent Transport System traffic
management, strategic road maintenance and flood and critical incident alleviation.
2.22 BHCC and its partners are seeking funding for the Bike Share Scheme from the £3.7m Growth
Deal allocation for Sustainable Transport Packages for 2015/16.
City Plan
2.23 Brighton & Hove’s City Plan sets out the Council’s role in ‘working with partners, stakeholders
and communities to provide an integrated, safe and sustainable transport system that is able
to accommodate new development; support the city’s role as a sub-regional service and
employment hub; and improve accessibility’.
2.24 The Council support measures to encourage the uptake of sustainable modes of transport in
order to reduce traffic congestion, increase physical activity and improve the health of the
local population, as well as their safety and quality of life.
2.25 The top priorities of the Transport Strategy includes improving access to significant land uses,
facilities and services by supporting or providing sustainable transport measures, better public
realm and improved safety. In terms of encouraging and enabling the uptake of walking and
cycling the Transport Strategy commits to improving the public realm in key areas and their
access routes, including:
Valley Gardens;
Station Gateway;
Lewes Road;
December 2014 | 7 London Road;
Edward Street and Eastern Road;
Old Shoreham Road;
A259 Seafront;
Seven Dials;
Hove Station;
Pool Valley; and at
Local shopping areas.
2.26 Additionally the City Plan commits to implementing an integrated cycle network by 2030,
promoting cycling and walking as ‘active travel’ by providing advice and information to
residents, workers and visitors to the city and improving Rights of Way and access to open
spaces and the National Park, including wheelchair friendly provision.
Local Transport Plan
Encouraging Use of Sustainable Transport
2.27 The Local Transport Plan envisages Brighton & Hove as a City of Opportunity, in which
residents, employees and visitors can lead healthy and active lifestyles. It recognises the role
transport can have in enabling this vision, by providing and promoting use of healthier modes
of transport where possible and reducing the impacts of traffic.
2.28 Between 2005 and 2011, Brighton & Hove was designated as a cycling town and considerable
investment has been focussed on delivering new cycling infrastructure and promoting cycling
as a mode of transport. Brighton & Hove now have a cycle network with over 20km of
designated cycle routes. The Local Transport Plan commits to further improving cycling
facilities, routes and networks with the aim of continuing to increase the proportion of cycling
as a mode share in the area, particularly for commuting trips.
Promoting Equality and Opportunity
2.29 The Local Transport Plan aims to promote greater equality in Brighton & Hove and highlights
the role transport can have in achieving this. The Plan sets out objectives for creating
sustainable and fairer neighbourhoods, including:
Help create communities that work well – with good local facilities, open space and
community facilities;
Increase the availability of jobs and training;
Encourage healthier lifestyles;
Improve accessibility and make roads in residential areas safer; and
Encourage environmental sustainability.
2.30 Consultation with local people highlighted additional issues of importance including:
Reducing traffic congestion in central Brighton;
Reducing traffic fumes and improving air quality;
Improving the safety, security and attractiveness of streets;
Promoting the health benefits of walking and cycling, including more priority areas; and
Better transport links to jobs, leisure facilities, healthcare, education and food stores.
December 2014 | 8Air Quality
2.31 It is estimated that Brighton & Hove is responsible for approximately 1.3 million tonnes of CO2
emissions per year and recent research suggests that emissions per person is higher than the
national average.
2.32 Brighton & Hove’s Review and Assessment report for air quality identifies road traffic as the
primary contributing factor to Nitrogen Dioxide emissions in the city. They have produced an
Air Quality Action Plan (AQAP), to help reduce the levels of NO2. The measures identified
focus on improving the flow of road traffic and encourage greater use of sustainable transport,
including walking and cycling, as an alternative for some journeys. Brighton & Hove intend to
persuade all road users, individuals and companies, of the benefits of walking and cycling in
order to reduce vehicle traffic while accommodating increasing numbers of people and their
transport requirements.
2.33 An Air Quality Management Area (AQMA) has been designated that encompasses much of
central Brighton & Hove, see Figure 2-1. This is an area identified by BHCC as requiring
measures to reduce air pollution to acceptable levels.
Figure 2-1: Brighton & Hove AQMA
Transport and Health
Overview
2.34 There has been increasing recognition of the importance of physical activity in reducing the
risk of illness, and of the role that the transport environment in general, and promotion of
active modes in particular, can play in promoting physical activity.
2.35 BHCC and the Clinical Commissioning Group (CCG) are working in partnership to address
health issues and health inequality.
December 2014 | 92.36 The proposed Bike Share scheme has the potential to deliver significant health benefits, and
these can be maximised by the integration of transport and health policy. The geographical
scope of the scheme definition has been developed to include areas where high levels of
deprivation and poor health are prevalent (related to low levels of physical activity), and there
is the potential opportunity for GPs to facilitate active travel and improved health by
prescribing Bike Share access (e.g. free access at the point of use for individual patients).
Physical Inactivity and Illness
2.37 Physical inactivity is a major health risk and the fourth leading risk factor for global mortality3.
It is associated with increased risk of many diseases and conditions, including coronary heart
disease, obesity, type 2 diabetes, cancer, depression and dementia.
2.38 It is estimated that 44% of adults in the UK do not meet the recommended amount of physical
exercise a week (150 minutes of moderate intensity activity)4 and the direct cost of physical
inactivity to the NHS across the UK is thought to be £1.1 billion per annum5. In Brighton &
Hove, the impact on the health service has been estimated at £3.1 million per annum6.
2.39 Physical inactivity also creates costs for the wider economy through absenteeism. In England,
the costs of lost productivity have been estimated at £5.5 billion per year from sickness
absence and £1.0 billion per year from the premature death of people of working age7.
Transport and Air Quality
2.40 The Committee on the medical effects of air pollution (COMEAP) estimates that around 29,000
deaths a year are related to air pollution. The Environmental Audit Committee state that
‘Transport causes the most exposure to harmful air pollutants and air quality targets would
never be met without a significant shift in transport policy’8.
2.41 NICE note that short journeys play a significant part in the pollution from motor vehicles. 20%
of all car related CO2 emissions are from journeys under 5 miles, so encouraging people to
walk or cycle short distance trips is important for reducing air pollution.
The Role of Active Travel
2.42 Moderate activity such as walking and cycling is effective in achieving good health, providing
predictable and inexpensive forms of transport for short trips and can easily fit into people’s
daily routines. In November 2012, the National Institute for Health and Care Excellence (NICE)
3
Start Active, Stay Active: A Report on Physical Activity for Health from the Four Home Counties (2011),
Department of Health, UK.
4
Active People Survey January 2013–January 2014, available at www.phoutcomes.info/
5
Start Active, Stay Active: A Report on Physical Activity for Health from the Four Home Counties (2011),
Department of Health, UK.
6
A Partnership for Active Living in Brighton & Hove, available at
http://www.healthycities.org.uk/uploads/files/001_a_partnership_for_active_living_in_brighton_and_h
ove___brighton__hove.pdf.
7
Start Active, Stay Active: A Report on Physical Activity for Health from the Four Home Counties (2011),
Department of Health, UK.
8
NICE Local Government Briefings: Walking and Cycling (2013) NICE, UK.
December 2014 | 10published recommendations for local authorities and partner organisations on encouraging
walking and cycling in their areas9. NICE recommends that local authorities employ a wide-
range of initiatives to help individuals to walk and cycle more, address the main barriers to
active travel and provide people with new opportunities to travel in these ways.
2.43 Recent research commissioned by Transport for London10 highlighted that physical activity
reduced the risk of developing a number of health conditions (Table 2-2) including coronary
heart disease (20-35%), colon cancer (30-50%) and Alzheimer’s (40-45%).
Table 2-2: Reduced Health Risk Through Physical Activity
Health Condition Reduced Risk from Being Physically Active
Death 20-35%
Coronary Heart Disease and Strokes 20-35%
Type 2 Diabetes 35-50%
Colon Cancer 30-50%
Breast Cancer 20%
Hip Fracture 36-68%
Depression 20-30%
Alzheimer’s Disease 40-45%
2.44 The report also revealed that the health benefits of physical activity from walking and cycling
outweighed the harms of exposure to air pollution and road traffic injuries. It is estimated
that the average life expectancy of people who swap from using a car to riding a bicycle on a
regular basis will increase by 3–14 months due to the physical activity benefits. This
outweighs any reductions to their life expectancy from road traffic injuries (5–9 days lost) or
inhaling air pollution (0.8–4 days lost).
2.45 Further research conducted by the Greater London Authority showed that switching short
journeys from inactive modes e.g. car or bus, to active modes – walking and cycling – can
deliver enormous health benefits11. In London, the net benefits (in terms of Disability Adjusted
Life Years12) of a scenario in which all switchable trips were made by active modes delivered a
10-fold increase (~55,000 DALYs) on a projection based solely upon a broad demographic of
individuals taking up cycling by 203113. Whilst there was a very small impact on the overall
health of the population due to lives lost to injuries as a result of increased time spent walking
and cycling, this dis-benefit was equivalent to just 1.5% of the total benefit from increased
9
NICE Guidelines: Walking and cycling: local measures to promote walking and cycling as forms of travel
or recreation, available at http://www.nice.org.uk/guidance/ph41.
10
Improving the Health of Londoners: Transport Action Plan (2014), Transport for London, UK.
11
Switchable trips include those where people are not carrying heavy or burdensome objects, are
between 2km (walking) and 8km (cycling) in length and are made at certain times of day.
12
The disability-adjusted life year (DALY) is a measure of overall disease burden, expressed as the
number of years lost due to ill-health, disability or early death. One DALY is equal to one year of healthy
life lost.
13
Transport and Health in London: The Main Impacts of London Road Transport on Health (2014)
Greater London Authority, UK.
December 2014 | 11physical activity and serves to highlight the potential health benefits locked in short motorised
trips.
Policy Implications
Promoting Active Travel
2.46 It has been demonstrated across the UK and Europe that integrating a range of hard measures
(coherent high quality networks linking everyday destinations, bike sharing schemes, reducing
urban speed limits to 20mph) and soft measures (personalised travel marketing, school and
workplace travel plans) increases cycling. Once these measures are in place there is the
potential to facilitate the switching of trips from motorised vehicles to active modes.
2.47 Whilst public health guidance from NICE found insufficient evidence to recommend the use of
cycling schemes to promote physical activity14 it recommended that professionals should
continue to promote cycling, along with other forms of physical activity like walking, gardening
and household activities, as a means of incorporating regular physical activity into people's
daily lives.
2.48 A new program unveiled by the city of Boston, Massachusetts, in March 2014 allows doctors
to prescribe their patients membership for the city's Bike Share program, Hubway. The idea is
that doctors can provide their low-income patients a healthy, affordable transport alternative.
With a prescription, annual membership for Hubway costs only $5. Without the prescription,
fees are $85. Obesity is a significant and growing health concern for Boston, particularly
among low-income residents. Regular exercise is seen as key to combating this trend, and
Prescribe-a-Bike is one way that caregivers can help patients get the exercise they need to
improve their health.
Valuation of Health Benefits
2.49 The Health Economic Assessment Tool (HEAT) is an online resource made available by the
World Health Organisation to estimate the economic savings resulting from reductions in
mortality as a consequence of regular cycling and/or walking. It is based on best available
evidence, with parameters that can be adapted to fit specific situations. Default parameters
are correct for Europe but the tool has been adapted for use in other parts of the world too.
HEAT calculates the answer to the following question: “If X people cycle or walk Y distance on
most days, what is the economic value of mortality rate improvements?”
2.50 The HEAT method is employed by the Department for Transport in its transport appraisal
guidelines (webTAG). HEAT can be used to evaluate many scenarios, such as the
consequences of infrastructural or other changes that result in either more or less cycling. We
have valued the health benefits from Bike Share in accordance with HEAT guidance.
2.51 European research into the health benefits of an adult switching to cycling for regular
commuting (based on a valuation of a year of human life) showed €1,300 per year of health
benefits from physical activity compared with a €20 loss from the additional exposure to air
14
Other than as part of research studies where effectiveness can be evaluated.
December 2014 | 12pollution. It also estimated that there would be a €30 gain for the general public from reduced
pollution15.
Strategy for the Visitor Economy
Tourism Strategy
2.52 In 2013, an estimated 4.8 million visitor nights and 9.5 million tourism day trips were spent in
Brighton & Hove. Tourism activity and expenditure on second homes and goods was worth
over £1.1 billion16. In 2013, Brighton & Hove’s tourism economy supported 15,123 FTE jobs
(20,622 actual jobs), which represented 17% of the workforce.
2.53 In order to continue the success of the tourism industry, the City of Brighton & Hove has
developed a refreshed strategy for the visitor economy17. The focus is on improving visitor
experience, in particular the city’s overall environment and infrastructure and visitors’ first and
lasting impressions. To encourage visitors to return to Brighton & Hove, the city should be
clean, safe and welcoming. To achieve this vision, the following measures have been
identified:
Management of the public spaces;
Promote sustainable transport options;
Improve gateways to the city;
Improve and enhance the environment;
Ensure parking provision and operating policies reflect the need of the visitor economy;
and
Develop new facilities.
2.54 The city promotes sustainable and responsible tourism, including the choices made by visitors
with regard to modes of transport.
2.55 In order to remain competitive with other destinations nationally and internationally, Brighton
& Hove identify the need to continually improve the quality of its offer and raise the standards
of the physical environment at all stages of the ‘visitor journey’. There is a focus on the arrival
and departure of visitors and how they travel around during their visit.
Biosphere
2.56 The Brighton & Lewes Downs Biosphere aims to serve as a world-class demonstration area of
how we might live better in the future, in greater harmony with our local environment by
bringing people and nature closer together. The Biosphere’s aim is:
Together we will create a world-class environment that is economically successful and
enjoyed by all.
2.57 Their supporting objectives are:
Nature conservation
Sustainable socio-economic development
15
Rabl & de Nazelle (2012) Benefits of Shift from Car to Active Transport, Transport Policy 19,121–131.
16
Tourism South East ‘The Economic Impact of Brighton & Hove 2013’
17
http://www.visitbrighton.com/xsdbimgs/Tourism%20strategy%5B1%5D.pdf
December 2014 | 13 Knowledge, learning and awareness
2.58 In achieving this aim Biosphere intends to improve residents and visitors’ quality of life by
creating a healthier environment; strengthen the economy by making the city a more
attractive place to visit; achieve stronger community awareness and pride in the local
environment; and achieve greater coordination between conservation and development,
among other benefits.
One Planet Living
2.59 In 2013, Brighton & Hove was accredited as the world’s first One Planet City based on its
Sustainability Action Plan. The One Planet approach breaks down sustainability into ten
principles:
1. Zero carbon: making buildings more energy efficient and delivering all energy with
renewable technologies.
2. Zero waste: reducing waste, reusing where possible, and ultimately sending zero to
landfill.
3. Sustainable transport: encouraging low carbon modes of transport to reduce emissions,
reducing the need to travel.
4. Sustainable materials: using sustainable products that have low embodied energy.
5. Sustainable water: using water more efficiently in buildings and in the products we buy;
tackling local flooding and water course pollution.
6. Land use and wildlife: protecting and expanding old habitats and creating new space for
wildlife.
7. Culture and community: reviving local identity and wisdom; support for, and participation
in, the arts.
8. Equity and local economy: inclusive , empowering workplaces with equitable pay;
support for local communities and fair trade.
9. Health and happiness: encouraging active, sociable, meaningful lives to promote good
health and well-being.
2.60 The One Planet Living vision for sustainable transport seeks to enable people to travel more
sustainably by supporting active and healthy travel; to increase the use of low emission forms
of transport and avoid travel with technology; and to minimise the impacts of transport
related air and noise pollution on people, and the natural and built environment.
December 2014 | 143 Scheme Description and
Development
Scheme Description
Overview
3.1 The proposed scheme area, suggested and agreed with BHCC extends from Hove Station in the
west, to Brighton Marina Village in the east and along the A270 corridor to Falmer and the
University of Sussex to the north.
3.2 The proposed scheme includes 430 bikes and 50 docking stations, across the defined scheme
area.
3.3 The scheme is designed to be used by residents, rail users, employees and tourists. To
facilitate use of the scheme users should offered a tariff with options for both regular (annual
subscription) and occasional use.
3.4 The proposed locations for docking stations provide a good density of locations providing a
consistent coverage across the scheme area, which facilitates one way trips. The proposed
locations take into account the following factors, which affect potential demand for cycle trips:
Residential population (weighted by propensity to cycle);
Employment;
Index of Multiple Deprivation – overall rank;
Index of Multiple Deprivation – health rank;
Priority sites – new developments and railway stations; and
Previously identified sites.
3.5 This chapter provides more detail about analysis undertaken to inform the development of the
scheme in the market analysis section which follows on page 16.
Recommendations
3.6 We have detailed a series of recommendations for a bike sharing scheme in Brighton & Hove
based on our experience and analysis of existing schemes. The research and analysis which
has informed these recommendations are included in Appendix B.
Ease of Use and Durability
Operated using a standard static docking system, with potential to use solar power to
reduce costs of maintenance and installation.
Using ‘slow’ bicycles that are durable, long lasting and expose few moving parts.
Using an intelligent urban Bike Share system, that also tracks the bicycles through GPS.
December 2014 | 15Payments/Tariffs
A simple two tier tariff system designed for:
Regular users and residents; and
Infrequent users and tourists.
Tariff to incentivise regular users and encourage continued use of the Bike Share scheme.
Tariff to include a ‘free 30 minutes’ for the Bike Share to encourage use for short trips.
Integration with public transport smart ticketing.
Financial Sustainability
A scheme sponsor (or sponsors) to ensure the financial sustainability of the scheme.
Monitoring of the scheme, in order to understand what parts of the network perform
most successfully and actively managing any issues with redistribution of bikes.
Complementary Measures
Ensure that the wayfinding for the Bike Share scheme is integrated into Brighton & Hove’s
existing wayfinding system.
Integrated into Brighton & Hove’s journey planner to ensure Bike Share is seen as an
integrated transport mode in the city.
Create a strong brand, possibly linked to a sponsor, and leverage users through a robust
social media presence.
Market Analysis
Benchmarking Compared to Existing Schemes
3.7 To provide a context for Brighton & Hove we have compared the city to locations where
existing schemes are operating, comparing population levels, employment levels, rail usage
and visitor numbers.
3.8 The table which follows shows how Brighton & Hove compares to other existing Bike Share
locations. The table shows that compared to other locations the proposed scheme area in
Brighton & Hove has:
A greater population than the Glasgow, Bath and Dublin scheme; and
A greater number of tourists than Glasgow and Bath.
December 2014 | 16Table 3-1: Benchmarking Brighton & Hove to Other Bike Share Locations
Brighton &
Glasgow Bath London Dublin
Hove
Operator Nextbike Nextbike TfL/Serco JCDecaux -
Number of Bikes 400 100 10,000 1,500 -
Number of
31 9 700 101 -
Docking Locations
18
Population 70,000 14,400 1,100,000 78,600 135,700
19
Employment 117,000 27,300 1,900,000 n/a 83,300
20
Rail Usage (m) 52.7 5.7 628.6 n/a 20.7
21
Visitor Numbers 515,000 283,000 16,784,000 3,998,000 1,482,000
Detailed Analysis of Brighton & Hove
3.9 To provide a context for developing Bike Share in Brighton & Hove we have analysed the
following data, across the proposed scheme area:
Population density;
Population demographics;
Weighted population;
Car ownership;
Cycle to work mode share;
Indices of Multiple Deprivation;
Key developments and Spatial Priority Areas; and
Key trip attractors.
3.10 Where possible we have analysed data using coverage of hexagons 500m in size across the
defined study area (79 in total). For a scheme to function effectively a suitable density of
docking stations is required. Effective existing schemes have docking stations located
approximately every 500m, or closer, within the study area.
3.11 Taking into account the range of factors detailed, we have mapped the potential Bike Share
locations across the proposed scheme area, which is shown on page 30.
18
2013 Mid-Year Estimates (Office for National Statistics), 2011 Census (Central Statistics Office Ireland)
– population within scheme area/proposed scheme area
19
2011 Census workplace population (Office for National Statistics) – employment within scheme area,
except Glasgow which is for the larger Council Area.
20
Estimates of Station Usage 2012/13 (ORR) - rail stations within scheme area/proposed scheme area
21
Staying visits 2013 (VisitBritain), Regional tourism performance in 2013 (Failte Ireland), The Economic
Impact of Tourism Brighton & Hove 2013 (Tourism South East)
December 2014 | 17Population Density
3.12 Good densities of residential population are important to provide sufficient residential
demand for use of a Bike Share scheme. The map which follows shows good levels of
residential population density across much of the scheme area, particularly from Hove to
Kemp Town, albeit with lower levels of population density around Brighton Marina Village and
to the north on London Road station in the A270 corridor to Moulsecoomb and Falmer.
December 2014 | 18Population Demographics
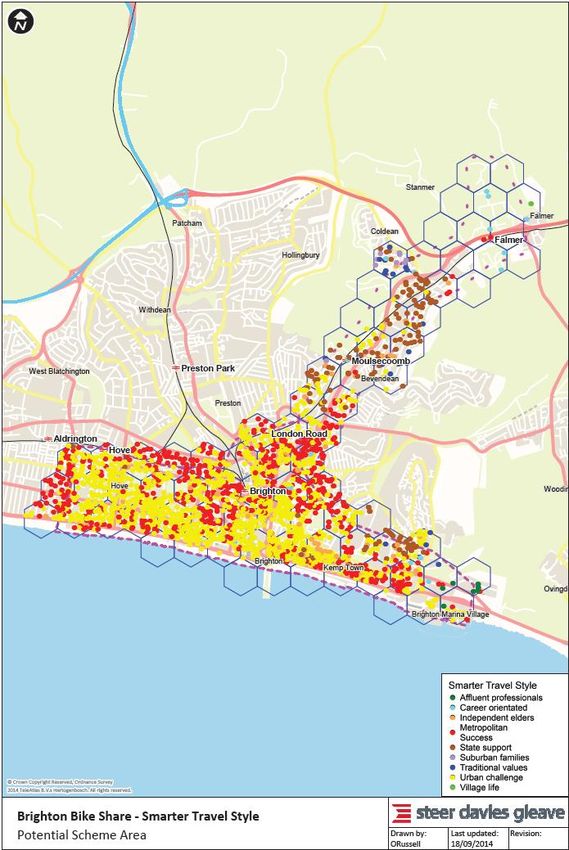
3.13 The map which follows shows the residential population profile using our Smarter TravelStyle
population profiling data. Each postcode is classified into one of nine Smarter TravelStyle
groups. Each group has a different propensity to cycle (more information can be found in
Appendix C). The Smarter TravelStyle groups with the greatest propensity to cycle are
Metropolitan Success, Career Orientated and Affluent Professionals. There are a high
proportion of Metropolitan Success across the proposed scheme area, from Hove to Brighton
Marina and north to London Road.
December 2014 | 19Weighted Population
3.14 By taking into account the population profile using Smarter TravelStyle we have weighted the
population, to reflect the potential underlying demand for Bike Share (using the propensity to
cycle scores detailed in Appendix C). The map below shows this underlying demand, with
strong demand from the population, particularly across the south of the scheme area.
December 2014 | 20Car Ownership
3.15 The map below shows that, in the proposed scheme area, car ownership levels are low in the
centre of Brighton with fewer than 40% of households owning a car in many areas. Towards
the edges of the proposed scheme area car ownership levels are much higher. Bike Share can
provide an alternative for travel by car, for those people who own a car (reducing the need to
travel by car in the city), or facilitate more convenient cycle and multi-modal journeys for
those who do not have access to a car.
December 2014 | 21Cycle to Work Mode Share
3.16 Across the scheme area the average cycle to work mode share is 3.4%, based on data from the
2011 Census. The map below shows that cycle to work mode share varies across Brighton &
Hove, with some areas with a cycle to work mode share of as high as 11.9%. The areas with
the highest share of people cycling to work include much of Hove, around London Road
railway station and along the seafront in Kemptown.
December 2014 | 22Indices of Multiple Deprivation – General Rank
3.17 One aim of a Bike Share scheme is to provide access to a bicycle for more deprived
communities, people who either cannot afford to purchase a bicycle, or have limited space to
store a bicycle. The map below shows that the proposed scheme covers locations in the city
which are amongst the 5% most deprived areas of the country, including parts of Kemptown
and Moulsecoomb.
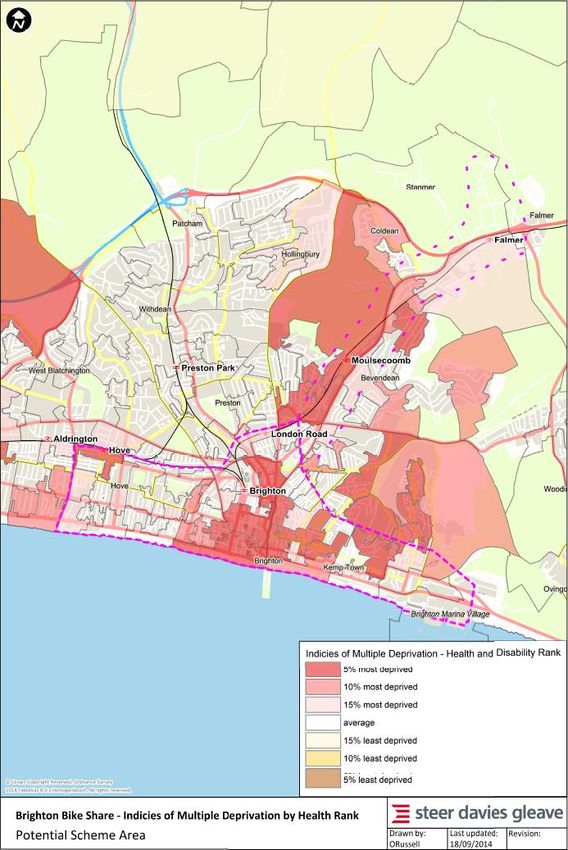
December 2014 | 23Indices of Multiple Deprivation – Health and Disability Rank
3.18 The Indices of Multiple Deprivation include indicators about the general health and disability
levels. The health domain measures premature death and the impairment of quality of life by
poor health. It considers both physical and mental health. Across the potential scheme area
there are locations which are in the 5% most deprived in the country, based on these
measures. These areas include central Brighton, parts of Kemptown and Moulsecoomb.
Providing Bike Share at these locations is a way to promote healthier and more active travel.
December 2014 | 24Key Developments and Spatial Priority Areas
3.19 The map below shows a number of key development and spatial priority areas, which will be
important to be served by the proposed Bike Share scheme. These key developments include
residential, leisure, commercial and mix use schemes. Providing Bike Share at each of these
locations will enable a greater proportion of trips to each location to be made by non-car
modes, reducing congestion and demand for car parking.
December 2014 | 25Key Trip Attractors
3.20 The map below shows key trip attractors, as identified within the previous feasibility study
work. The previous study highlighted a range of key trip attractors. Within the proposed
scheme area it will be important to serve a wide range of key trip attractors, to ensure that the
scheme can be used for as wide a range of trips as possible.
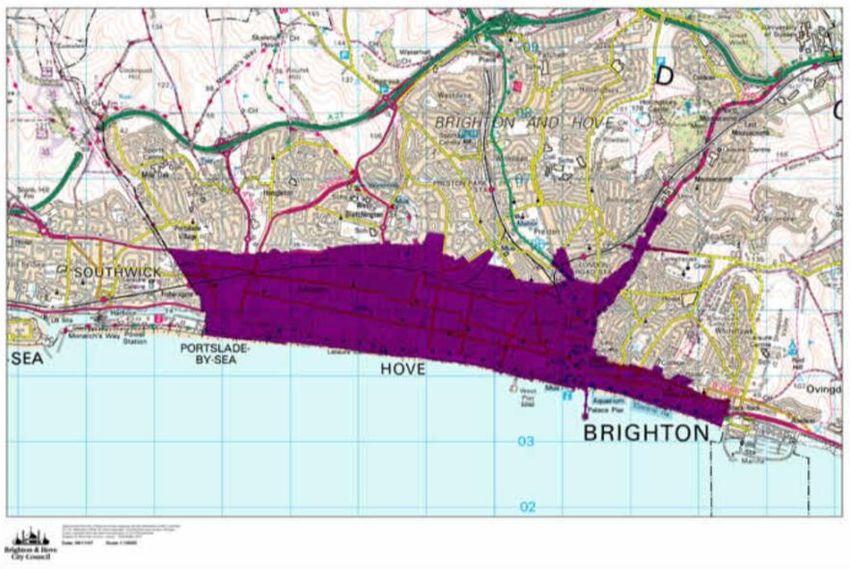
December 2014 | 26Topography
3.21 The map shown below illustrates the topography of Brighton & Hove and the proposed
scheme area. As the map shows, the scheme is focused on areas which have the least hilly
terrain.
December 2014 | 27Potential Bike Share Locations
3.22 Using a coverage of hexagons 500m in size across the defined study area (79 in total) we have
analysed the following data to inform the recommended scheme coverage and size:
Residential population (weighted by propensity to cycle);
Employment;
Index of Multiple Deprivation – overall rank;
Index of Multiple Deprivation – health rank;
Priority sites – new developments and railway stations; and
Previously identified sites.
3.23 A coverage of 500m hexcells was used to provide a suitable density of geography for docking
station locations.
3.24 For each hexcell we have assessed each of the criteria to determine relative expected demand
for the Bike Share scheme. Each hexcell is scored either good potential, or not good potential,
based on the following criteria:
Table 3-2: Criteria for Assessing Potential for Bike Sharing Location by Hexcell
Number of hexcells with good
Data Criteria for good potential
potential
Residential Population (weighted by
Over 1,000 population 46 out of 79
propensity to cycle)
Employment Over 2,000 employees 10 out of 79
Index of Multiple Deprivation – overall
15% or higher most deprived 30 out of 79
rank
Index of Multiple Deprivation – health
15% or higher most deprived 42 out of 79
rank
Priority Sites – new developments and Includes priority site and/or
15 out of 79
railway stations railway station
Previously Identified Sites Includes previously identified
19 out of 79
site
3.25 Each hexcell was then scored from
Zero (none of the data met the criteria for good potential); to
Six (all of the data met the criteria for good potential).
3.26 We consider that hexcells with a good potential score of two or greater are suitable locations
for a Bike Share docking station.
Figure 3-1: Number of Hexcells by Good Potential Score
30
25
Number of hexcells
20
Suitable locations
15
10
5
0
0 1 2 3 4 5 6
Good Potential Score
December 2014 | 28You can also read