Department for Transport - January 2016 - Gov.uk
←
→
Page content transcription
If your browser does not render page correctly, please read the page content below
Efficient Driving
 A Rapid Evidence Assessment for the
           Department for Transport

                         January 2016

Efficient Driving                                        A Rapid Evidence Assessment for the Department for Transport

Contents
Acknowledgements                                                                                     i
Glossary of terms                                                                                    ii
Executive Summary                                                                                    iii
1           Introduction                                                                             1
2           Vehicle Ownership, Mileage and Emissions                                                 4
3           Current Levels of Efficient Driving and Future Potential                                 9
4           Motivations and Barriers                                                                 20
5           Measures to Increase Efficient Driving                                                   27
6           Synergies between efficient driving and other policy areas                               43
7           Conclusions                                                                              48
Bibliography                                                                                         53
Annex 1 Mileage Estimates Methodology                                                                57
Annex 2 Case Study - The Dutch ecodrive programme: ‘Het Nieuwe Rijden’                               58

© Brook Lyndhurst 2015

This report has been produced by Brook Lyndhurst Ltd as part of a contract placed by the Department for
Transport. Any views expressed in it are not necessarily those of the Department for Transport. Brook Lyndhurst
warrants that all reasonable skill and care has been used in preparing this report. Notwithstanding this warranty,
Brook Lyndhurst shall not be under any liability for loss of profit, business, revenues or any special indirect or
consequential damage of any nature whatsoever or loss of anticipated saving or for any increased costs
sustained by the client or his or her servants or agents arising in any way whether directly or indirectly as a result
of reliance on this report or of any error or defect in this report.

Department for Transport Disclaimer
Although this report was commissioned by the Department for Transport (DfT), the findings and
recommendations are those of the authors and do not necessarily represent the views of DfT. The information or
guidance in this document (including third party information, products and services) is provided by DfT on an 'as
is' basis, without any representation or endorsement made and without warranty of any kind whether express or
implied.
Efficient Driving                               A Rapid Evidence Assessment for the Department for Transport

Acknowledgements
This report has been researched, written and produced by Tom McInnerney, Gareth Williams, Tim
Knight, David Fell and Jonathan Bain of Brook Lyndhurst Ltd. Advice and support, for which the Brook
Lyndhurst team is extremely grateful, was provided by Craig Morton of the University of Aberdeen.
Thanks are also due to Andrew Scott, Department for Transport, for his project management and
editorial comment.

                                                                                                               i
Efficient Driving A Rapid Evidence Assessment for the Department for Transport
Glossary of terms
CO2 Carbon Dioxide
CSR Corporate Social Responsibility
EST Energy Saving Trust
DfT Department for Transport
PAYD Pay As You Drive
ROI Return on Investment
SMMT Society of Motor Manufacturers and Traders
iiEfficient Driving A Rapid Evidence Assessment for the Department for Transport
Executive Summary
Introduction
This report presents the findings from a rapid evidence assessment undertaken to review recent
research on efficient driving.
Efficient driving is based on a series of techniques (including minimising engine idling,
maintaining a steady speed, and avoiding sharp acceleration and braking) that drivers can adopt
to reduce their fuel consumption and reduce CO2 emissions.
The objectives of the rapid evidence assessment were to review recent UK and international
evidence on current levels of efficient driving; motivations and barriers; measures to increase
efficient driving; and synergies between efficient driving and other policy areas.
The methodology followed Government Social Research guidance on the conduct of rapid
evidence assessments. 295 evidence sources were initially identified and assessed; 55 of these
were then reviewed and analysed in detail. Overall, there are still significant gaps and limitations
in the evidence base on efficient driving, and several areas for potential further research.
Vehicle Ownership, Mileage and Emissions
There are nearly 30 million licenced cars and 3.5 million licenced vans in the UK. Most cars are
privately owned, while vans are split equally between private and company ownership.
Privately owned cars and vans account for 76% of the CO2 emissions arising from car and van
travel; while company owned cars and vans account for 24%.
Personal travel by cars and vans also account for 77% of the total CO2 emissions compared to
23% for business travel by cars and vans.
Current Levels of Efficient Driving and Future Potential
The majority of private drivers claim to drive efficiently to the best of their knowledge, but
indicative evidence suggests most could do lot more – e.g. UK private drivers average “6 out of
10” on an efficient driving scale.
There is some indicative evidence of variation by demographics – suggesting well educated,
affluent women, aged 25 – 65, with low annual mileage using a small vehicle are the most likely
to practise efficient driving.
No equivalent data on levels of efficient driving among employee drivers was identified in this
review – either overall or by different types of employee driver.
Indicative evidence suggests that around 20% of organisations with a vehicle fleet have provided
training on efficient driving for their employees and around 25% have introduced in-vehicle
telematics. Larger organisations with larger vehicle fleets are also reported to be most likely to
be taking action on efficient driving.
iiiEfficient Driving A Rapid Evidence Assessment for the Department for Transport
The potential CO2 savings from efficient driving being adopted more widely are significant –
potentially over 220kg per car per year, up to 0.3 million tonnes annually across the UK. Total
potential financial savings for drivers are in excess of £15 billion per year across the EU and circa
£96 per driver.
No evidence was identified on the potential savings from efficient driving being adopted more
widely by organisations and employee drivers, although this could be estimated making use of
existing data.
Motivations and Barriers
The principal motivation for private drivers to adopt efficient driving is saving money - cited by
over 50% as a motivation. Safety is also a factor (although this is not always included in survey
options) and environmental concerns are a more limited motivation.
Barriers to efficient driving for private drivers include: habit; awareness of efficient driving
techniques; competing priorities (e.g. to arrive at a destination as soon as possible); social
norms; and the presence of other behaviours that drivers can adopt to save either money or
emissions (e.g. buying a more fuel efficient car).
Motivations and barriers are reported to be similar for employee drivers – although they may
not be motivated by saving money to the same extent that private drivers are because their fuel
costs are generally met by their employer.
Organisations are primarily motivated to promote efficient driving amongst their employees by
potential financial savings on fuel and other associated costs, although safety is also cited as a
motivation, as is a desire to project an environmentally friendly corporate image.
A key barrier for organisations is the current lack of robust, independent data quantifying the
return on investment for introducing measures such as training for their employees and in-
vehicle technology.
Measures to Increase Efficient Driving
Training
Efficient driving is not currently a high profile element of training for learner drivers and is not a
pass/fail criterion in the current driving test.
There is a broad consensus that training for existing private drivers can lead to a reduction in
fuel use (and the equivalent in terms of CO2) of up to 25% immediately following the training;
and up to 10% in the long-term.
Finding on the impact of training on employee drivers is similar – suggesting an immediate
reduction of up to 25%; and of up to 6.5% in the long-term.
There is, however, evidence of very low willingness to pay for such training amongst private
drivers and organisations may currently be deterred from investing in training for their
employees by the absence of reliable return on investment data.
ivEfficient Driving A Rapid Evidence Assessment for the Department for Transport
Technology
A wide range of technologies are covered by the evidence, and whilst there is a shortage of real-
world testing all are generally reported to deliver a long-term 5-10% reduction in fuel use (and
equivalent in CO2) for both private and employee drivers.
In general there is a preference among private drivers for real-time, tailored, visual feedback,
but still, the evidence suggests, a low willingness to pay for such technology if it is not already
embedded in the vehicle at the point of purchase. The installation of embedded telematics on
new cars is expected to surpass 50% by 2020 and 90% by 2025.
Technology aimed at organisations generally provides feedback to the individual driver and has
the additional functionality to benchmark and compare levels of efficient driving across different
employees – meaning it is typically more expensive to purchase and that there are additional
costs associated with actively making use of it as a management tool.
Communications
Communication campaigns to promote efficient driving are sometimes cited in the literature as
being a necessary accompaniment to either training-based or technology-based approaches, but
only one campaign in the Netherlands – which revealed a cost of €9 per tonne of avoided CO2 –
has been robustly evaluated, meaning drawing conclusions about their effectiveness is difficult.
Synergies With Other Policy Areas
There is strong evidence of road safety benefits arising from efficient driving (e.g. training for
efficient driving has been reported to correlate with reductions in subsequent accidents rates of
between 14% and 35%).
There is convincing evidence, too, of financial benefits (for private drivers and organisations)
arising from efficient driving, but these have yet to be quantified in their entirety. Efficient
driving is widely reported to result in lower maintenance and insurance costs but these savings
are not currently incorporated into calculations of the financial benefits of efficient driving.
The wider environmental benefits of efficient driving (beyond reductions in CO2) are reported to
be relatively minimal or even negative (e.g. some efficient driving techniques may lead to
increased emissions of carbon monoxide and hydrocarbon).
There has been relatively little attention in the literature given to the extent to which such
synergies have been harnessed by policy-makers. Looking ahead, the greatest potential for
increasing efficient driving may lie in capitalising on overlaps between efficient driving, safety
and insurance (notably pay-as-you-drive models).
Conclusions
Overall, the current evidence-base on efficient driving is patchy, of variable quality and
occasionally ambiguous.
Key gaps in the evidence identified by this review include:
vEfficient Driving A Rapid Evidence Assessment for the Department for Transport
o the prevalence of different types of efficient driving
o definitive potential CO2 and £ savings from efficient driving
o how motivations and barriers compare between different types of driver
o the comparative effectiveness of different measures to increase efficient driving, and
the added value of combining two or more measures
Potential areas for future consideration by policy-makers and researchers include:
o enabling all drivers easy access to technologies promoting efficient driving
o testing and further exploring the linkages between efficient driving, safety and insurance
o segmenting and targeting of future measures at key types of driver and organisation
viEfficient Driving A Rapid Evidence Assessment for the Department for Transport
1 Introduction
This report presents the findings from a rapid evidence assessment undertaken to review recent
research on efficient driving.
Efficient driving is based on a series of techniques (including minimising engine idling, maintaining
a steady speed, and avoiding sharp acceleration and braking) that drivers can adopt to reduce
their fuel consumption and reduce CO2 emissions.
The objectives of the rapid evidence assessment were to review recent UK and international
evidence on current levels of efficient driving; motivations and barriers; measures to increase
efficient driving; and synergies between efficient driving and other policy areas.
The methodology followed Government Social Research guidance on the conduct of rapid
evidence assessments. 295 evidence sources were initially identified and assessed; 55 of these
were then reviewed and analysed in detail. Overall, there are still significant gaps and limitations
in the evidence base on efficient driving, and several areas for potential further research.
1.1 Background
This report presents the findings from a rapid evidence assessment undertaken to review UK and
international research on efficient driving. Efficient driving, frequently also referred to as eco-driving,
is a collection of driving behaviours intended to reduce fuel consumption. Key aspects of efficient
driving:
o Not using air conditioning.
o Minimising engine idling.
o Maintaining a steady speed, and avoiding sharp acceleration and braking.
o Changing up as soon as possible: generally at or below 2,500 rpm.
o Staying in gear when slowing but removing pressure on the accelerator early.
Additional measures that can also improve the efficiency of driving include:
o regular vehicle maintenance
o using the correct engine oil
o checking and maintaining correct tyre pressure
o minimising the weight of the vehicle
o streamlining the vehicle (e.g. by removing un-used roof racks)
1.2 Scope
The rapid evidence assessment was focused on efficient driving in cars and vans. Other vehicle types,
e.g. HGVs, buses and coaches, were not considered.
1Efficient Driving A Rapid Evidence Assessment for the Department for Transport
Aims
The specific research questions this rapid evidence assessment sought to address were:
1. How efficiently do UK drivers currently drive and what is the future potential?
2. What are the main motivations and barriers to efficient driving?
3. How effective are different measures in increasing levels of efficient driving?
4. What are the synergies between efficient driving and other policy areas?
Car and van ownership and use in the UK is split between private drivers and organisations that buy
vehicles for use by their employees. Each of these questions was considered from the perspective of
private drivers and organisations that buy vehicles for use by their employees.
Methodology
The methodology followed Government Social Research guidance on the conduct of rapid evidence
assessments 1, with some tailoring to reflect the specific requirements of the research. Search terms
were developed and used to identify potential evidence sources, using commercial and academic
search engines, and additional potential sources were identified by members of the research team,
academic staff and DfT. This generated a long-list of 245 sources which were logged and assessed in
terms of their relevance to the research questions and methodological strength. A shortlist of 40
sources was then agreed with DfT, and 15 further sources were subsequently identified and added
during the later phases.
Figure 1. Rapid Evidence Assessment phases
Develop Log and assess Detailed
Short-
search potential review Analysis Report
listing
terms sources [n=245] [n=55]
September October November
Shortlisted sources were reviewed in detail, and relevant findings extracted into an analytical
database.
Evidence coverage and quality
There are significant gaps and limitations in the current evidence base on efficient driving, across all of
the research questions this rapid evidence assessment sought to address. These are highlighted
throughout the report but the most pertinent include:
1
http://www.civilservice.gov.uk/networks/gsr/resources-and-guidance/rapid-evidence-assessment
2Efficient Driving A Rapid Evidence Assessment for the Department for Transport
o A shortfall of robust, independent data on current levels of efficient driving. Evidence that is
currently available comes mainly in the form of self-reported data collected through surveys of
drivers and employers.
o A lack of depth of insight into the relative importance of different motivations and barriers to
efficient driving, how susceptible these may be to change, and how these vary between
different types of driver and organisation.
o A persistent lack of methodological rigour in studies that have sought to assess the
effectiveness of measures aimed at increasing efficient driving, which has also been noted by
other authors:
“One of the most notable features of the literature on eco-driving is that,
while there is a large body of information reporting success in reducing fuel
consumption, relatively little of this data appears to arise from detailed and
rigorous evaluations.”
Luther et al (2011)
o A general tendency for efficient driving to be treated as a distinct free-standing topic for
research – with few attempts made to consider its relationship with other areas such as road
safety, vehicle insurance, and the finances of households and organisations.
Priorities and recommendations for addressing these gaps and limitations are considered in the final
chapter of the report.
1.6 Structure of report
The next chapter provides a brief contextual overview of car and van ownership, mileage and
emissions in the UK. Chapters 3 to 5 then present evidence for the first four research questions listed
in section 1.3 Chapter 6 addresses the synergies between efficient driving and other policy areas.
Chapter 7 discusses what conclusions can be drawn from the preceding evidence and priorities for
future research.
Note: the terms ‘efficient driving’, ‘ecodriving’, ‘eco-driving’ etc are used interchangeably throughout
the report, in general following usage in source material.
3Efficient Driving A Rapid Evidence Assessment for the Department for Transport
2 Vehicle Ownership, Mileage and
Emissions
There are nearly 30 million licenced cars and 3.5 million licenced vans in the UK.
Most cars are privately owned, while vans are split equally between private and company
ownership.
Privately owned cars and vans account for 76% of the CO2 emissions arising from car and van
travel; while company owned cars and vans account for 24%.
Personal travel by cars and vans also account for 77% of the total CO2 emissions compared to
23% for business travel by cars and vans.
The majority of this report considers private drivers and employees who drive company owned
vehicles separately. However, in order to provide some initial context this chapter summarises
evidence on the relative mileages and emissions of these two populations of drivers.
It also compares mileages and emissions for personal travel as opposed to business travel. These
comparisons are returned to in the discussion of future policy options in relation to efficient driving in
the final chapter of the report.
The data drawn on in this chapter is predominantly very robust. The Department for Transport collect
data annually on vehicle ownership and mileages through the National Travel Survey, and provide
annual forecasts of total mileage levels based on observational data. SMMT also publish annual data
on the (advertised) CO2 emissions of cars and vans in the UK.
Equally, there are some gaps in the evidence and instances where it has been necessary to provide an
estimate rather than robust up to date data. Explanatory notes on the assumptions made in such
instances are provided in Annex 1.
Given the focus of this review on cars and vans, data for other types of vehicles have been excluded
from the following analysis. However it is worth noting that they also contribute CO2 emissions. For
example, HGVs emit an estimated 22% of all CO2 emissions arising from road transport in the UK (DfT,
2014).
4Efficient Driving A Rapid Evidence Assessment for the Department for Transport
2.1 Vehicles
In 2014 there were 29.6 million licenced cars and 3.5 million licenced vans in the UK.
Figure 2. Licenced Cars and Vans: 2014
3,471,280
10%
cars
vans
29,611,489
90%
sources: DfT (2015a); DfT (2015b)
2.2 Ownership
The majority of cars in the UK are privately owned, with company owned cars (which includes
company cars and other types of company owned cars 2) representing the minority. Vans are split
roughly equally between private and company ownership.
Figure 3. Registered Cars and Vans by Ownership: 2014
1,625,094
1,788,000
5%
5%
1,644,989
5%
940,000 cars (private)
3%
cars (company car)
cars (company owned other)
vans (private)
vans (company owned)
26,527,500
82%
sources: DfT (2015a); DfT (2015b); HMRC (2015)
2
Other types of company owned cars represent something of a blindspot in the current evidence base but are
thought to be primarily pool cars, which are maintained centrally by the company and may be used by more
than one employee.
5Efficient Driving A Rapid Evidence Assessment for the Department for Transport
2.3 Mileages
The average annual mileage of privately owned cars in 2014 was 7,500 miles, compared to 19,500
miles for company cars (DfT, 2015c). Data on the mileages of other company owned cars and vans in
2014 is not readily available but can be estimated drawing on other data from previous years (see
annex). This suggests that other company owned cars have an average annual mileage of around
17,000 miles, while for privately owned vans this figure is 10,000 miles, and for company owned vans
16,000 miles. In total, cars and vans drove an estimated total of 289 billion miles in 2014. Privately
owned cars and vans undertook 77% of this total, compared to 23% for company owned cars and vans.
Figure 4. Estimated Annual Mileage by Vehicle Type and Ownership: 2014
26 billion miles
9%
18.5 billion miles
7%
24 billion miles cars (private)
8% cars (company car)
cars (company owned other)
17.5 billion miles
vans (private)
6%
203 billion miles vans (company owned)
70%
sources: DfT (2015b); DfT (2015c); DfT (2015d) DfT (2004); DfT (2006)
2.4 Emissions
Based on advertised CO2 emission data, SMMT estimate that UK cars emit on average 156.6 grams of
CO2 per kilometre. This average is based on all cars purchased new in 2014 and all older cars also on
the road in 2014. Comparative data is only available for new vans purchased in 2014 but this suggests
that the average UK van emits circa 182.4 grams of CO2 per kilometre (SMMT, 2015). In total, UK cars
and vans emitted an estimated total of 74.7 million tonnes of CO2 in 2014. Again, privately owned cars
are responsible for the majority of this, and together privately owned cars and vans accounted for 76%
of CO2 emissions, compared to 24% for company owned cars and vans.
6Efficient Driving A Rapid Evidence Assessment for the Department for Transport
Figure 5. Estimated CO2 Emissions by Vehicle Type and Ownership: 2014
7.7 million tonnes
10%
5.4 million tonnes
7%
cars (private)
6 million tonnes cars (company car)
8%
cars (company owned other)
4.4 million tonnes vans (private)
6% 51.2 million vans (company owned)
tonnes
69%
sources: DfT (2015b); DfT (2015c); DfT (2015d) DfT (2004); DfT (2006); SMMT (2015)
One important caveat to the emissions data presented here is that it is based on advertised emissions
data. Firstly, real-world emissions are likely to vary from those advertised, for both cars and vans and
irrespective of ownership. Secondly, privately owned cars are older on average than company owned
cars, and older cars generally have higher emissions than newer ones. The implications of this are that
the relative contribution of privately owned cars to CO2 emissions may be even higher than indicated
in figure 5.
2.5 Personal v Business Travel
Another means of classifying travel by cars and vans is in terms of journey purpose. This can be
divided into personal travel (which includes journeys to and from work) and business travel.
Privately owned vehicles are not just used for personal travel and likewise company owned vehicles
are not all just used for business travel. For example, based on National Travel Survey data for 2014,
company cars were driven on average more for personal travel (12,400 miles) than they were for
business travel (7,200 miles). In comparison, privately owned cars were driven on average for 7,100
miles for personal travel and 400 miles for business travel 3, while both private and company owned
vans are driven for varying combinations of personal and business travel.
In total, just over three-quarters of the estimated mileage and emissions by cars and vans in the UK in
2014 arose from personal travel, and just under a quarter from business travel.
3 This represents travel by the “grey fleet” - i.e. privately owned cars that are driven for business travel. EST (undated) and
Volkswagen (undated) report that there are approximately 4 million such cars in the UK although other sources, e.g. Lex
Autolease (2015), suggest this could be as high as 14 million, depending on how these are defined.
7Efficient Driving A Rapid Evidence Assessment for the Department for Transport
Figure 6. Total Estimated Mileage and Emissions by Travel Type: 2014
Vehicles & Ownership Type of Travel Miles Tonnes of CO2
personal 192.4 billion (67%) 48.5 million (65%)
cars (private)
business 10.8 billion (4%) 2.7 million (4%)
personal 11.2 billion (4%) 2.8 million (4%)
cars (company cars)
business 6.4 billion (2%) 1.6 million (2%)
cars (other company owned personal 0 billion (0%) 0 million (0%)
cars) 4 business 23.7 billion (8%) 6.0 million (8%)
personal 11.4 billion (4%) 3.3 million (4%)
vans (private)
business 7.0 billion (2%) 2.0 million (3%)
personal 9.2 billion (3%) 2.7 million (4%)
vans (company owned)
business 17.0 billion (6%) 5.0 million (7%)
total personal travel 224.1 billion (78%) 57.3 million (77%)
total business travel 64.9 billion (22%) 17.4 million (23%)
sources: DfT (2015b); DfT (2015c); DfT (2015d) DfT (2004); DfT (2006); SMMT (2015)
4 In the absence of published data on the split between personal and business travel for other company owned cars, it has
been assumed in this analysis that all their mileage is for business travel.
8Efficient Driving A Rapid Evidence Assessment for the Department for Transport
3 Current Levels of Efficient Driving and
Future Potential
The majority of private drivers claim to drive efficiently to the best of their knowledge, but
indicative evidence suggests most could do lot more – e.g. UK private drivers average “6 out of
10” on an efficient driving scale.
There is some indicative evidence of variation by demographics – suggesting well educated,
affluent women, aged 25 – 65, with low annual mileage using a small vehicle are the most likely
to practise efficient driving.
No equivalent data on levels of efficient driving among employee drivers was identified in this
review – either overall or by different types of employee driver.
Indicative evidence suggests that around 20% of organisations with a vehicle fleet have provided
training on efficient driving for their employees and around 25% have introduced in-vehicle
telematics. Larger organisations with larger vehicle fleets are also reported to be most likely to be
taking action on efficient driving.
The potential CO2 savings from efficient driving being adopted more widely are significant –
potentially over 220kg per car per year, up to 0.3 million tonnes annually across the UK. Total
potential financial savings for drivers are in excess of £15 billion per year across the EU and circa
£96 per driver.
No evidence was identified on the potential savings from efficient driving being adopted more
widely by organisations and employee drivers, although this could be estimated making use of
existing data.
This chapter presents evidence of the current level of efficient driving in the UK and investigates the
number of, and the extent to which, drivers are currently practising efficient driving techniques, and
whether or not this is influenced by driver characteristics. Using evidence from previous reports on
efficient driving, an estimate is given of the potential savings that could be made, both financially and
in terms of emissions, if more drivers were to adopt efficient driving techniques.
3.1 Current levels of efficient driving
Private Drivers
Evidence from private drivers in the UK suggests that the current level of knowledge and
understanding around efficient driving is fairly low. One previous survey of private drivers in the UK
found that 75% of participants claimed to know ‘little’ or ‘nothing’ about efficient driving – 19% of
these had never heard the term ‘efficient driving’ – and just 5% claimed to know ‘a lot’ (Thornton et al,
2010). Despite this apparent lack of knowledge, there is evidence that most drivers are aware of some
efficient driving techniques, but not necessarily the full range – a study of US private drivers found that
9Efficient Driving A Rapid Evidence Assessment for the Department for Transport
the average number of efficient driving techniques which could be named by participants was two
(Kurani et al, 2013). However, even with this limited familiarity with efficient driving, it is not to say
that drivers are not still using driving techniques which fall under the umbrella of efficient driving.
Questionnaires have found that that private drivers see many efficient driving techniques as ‘common
sense’ and simply as strategies to drive safely, sensibly and smoothly, rather than associating them
directly with efficient driving (Campbell-Hall et al, 2011).
In a 2010 survey of UK private drivers, when presented with a list of 10 efficient driving techniques,
89% of respondents claimed to have adopted at least one of the techniques and only 9% had not used
any – see below.
Figure 7. Self-reported use of efficient driving techniques by UK drivers
Adopted any of listed techniques 89%
Gentle acceleration 56%
Regularly checking tyre pressures 56%
Reading the road 51%
Changing speed to save fuel 47%
Planning journey to increse efficiency 41%
Using air conditioning sparingly 38%
Not warming car before journey 28%
Changing gear early 22%
Switching off engine in traffic 22%
Removing unused roof racks 7%
None 10%
Source: Thornton et al (2010)
The findings above also illustrate that the most commonly used techniques are regularly checking tyre
pressures, gentle acceleration and reading the road, which are used by a fairly modest 56%, 56% and
51% of private drivers respectively. The relatively low use of even the most popular techniques
supports the notion that drivers are aware of some, but not all, efficient driving techniques, and also
raises the point that whilst drivers may be driving efficiently to the best of their knowledge, they may
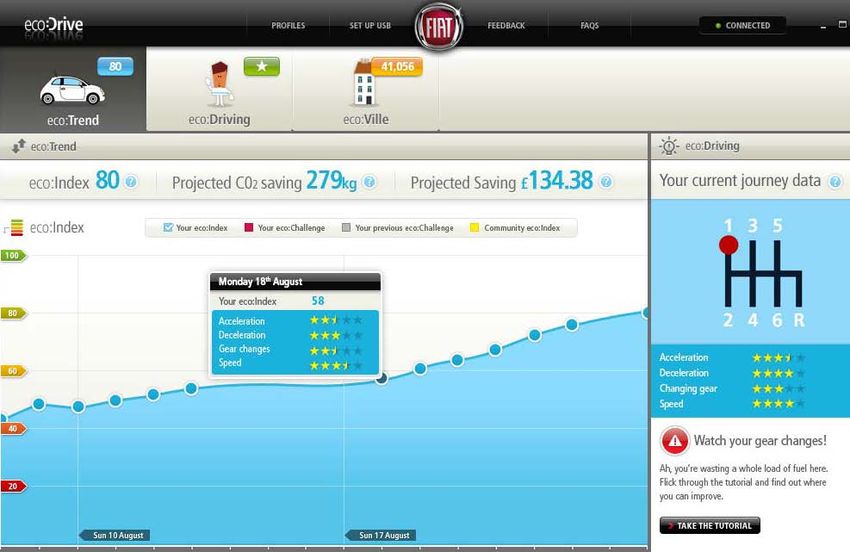
not be fulfilling the potential of efficient driving. This statement is further supported by findings from a
large-scale study by Fiat on drivers in Europe and the UK, which used long-term monitoring and
recording technology to provide drivers with an efficiency score (‘an eco:Index’) from 0 to 100, a
higher score representing more efficient driving. This study concludes that on average, UK private
drivers achieved a score of 61.8. While this was higher than the average score across Europe of 59.2, it
still demonstrates substantial room for improvement (Fiat, 2010).
10Efficient Driving A Rapid Evidence Assessment for the Department for Transport
Although useful, these results do not give a sense of whether or not efficient driving is being practised
as a sustained behaviour, rather than occasional actions. There is some evidence to suggest that
private drivers in the UK are, to the best of their knowledge, regularly efficient driving, and in a 2009
survey of private drivers, 78% were categorised into the ‘maintenance’ phase (characterised by
continued commitment to the behaviour) with regards to efficient driving (Thornton, 2009). Only 4%
of this sample had begun to drive efficiently, before relapsing to less efficient techniques.
Figure 8. Status of UK drivers in relation to efficient driving
4% Maintenance – characterised by
4% continued commitment to
6% sustaining the behaviour
Contemplation – when the subject
7% is aware of the behaviour and is
considering it but has done nothing
about this
Pre-contemplation – characterised
by not being aware of the behaviour
or lack of consideration
Rejection – aware of the behaviour
and after consideration have
decided not to change behaviour
79%
Relapse – resumption of the old
behaviour
Source: Thornton (2009)
Although limited, there is some evidence to suggest that number of efficient drivers in the UK may be
increasing, with 45% of participants in a UK study claiming to have begun to drive in a more fuel
efficient manner in the past 12 months, and 27% claiming to have actively changed their driving
behaviour to minimise their fuel consumption (Thornton et al, 2010). It should be mentioned that
these results were taken from a 2010 study, a time during which fuel prices in the UK were rising
sharply; we have been unable to find more recent figures which may be more reflective of current
attitudes in a time of relatively lower fuel prices.
Some authors writing more recently suggest that efficient driving may become more prevalent as an
increasing number of new cars are built with in-built technology to support efficient driving, such as
fuel economy displays and stop-start technology (Aecom, 2013; Wengraf, 2012). A 2013 study from
the USA also found that of the 72% of drivers who had fuel economy displays in their car, 67% use
them regularly (Kurani et al, 2013). However, robust data illustrating trends in the prevalence of
efficient driving over recent years is currently lacking, and it is possible that the increasing ubiquity of
in-car devices has not, as claimed, translated into higher levels of efficient driving.
11Efficient Driving A Rapid Evidence Assessment for the Department for Transport
In addition, it is possible that the rise of in-car support devices and an increasing frequency of efficient
driving could be followed by a greater prevalence of the ‘rebound effect’ – the idea that the fuel and
money savings achieved by efficient driving may encourage longer or more regular car journeys. It is
possible that the rebound effect will nullify some of the potential benefits provided by increases in
efficient driving behaviours (Ecowill, 2011; Wengraf, 2012).
It is important to note that, with the exception of the Fiat study, the findings so far presented are
based on self-reporting by drivers, and that this may result in overestimations in the claims. Further to
this, the majority of these figures are taken from studies in which participants are asked directly about
their efficient driving habits. This may act, for the duration of the study, to increase the relative
importance of efficient driving in the minds of the participants: there is evidence from a 2015 survey
that drivers prioritise safety and time saving whilst driving, while only 6% of drivers consider efficiency
(Barclaycard, 2015).
Finally, it is pertinent to consider the limited knowledge and perhaps misguided sense of skill
possessed by private drivers regarding efficient driving, and that drivers describing the frequency of
their efficient driving behaviours can only do so to the best of their knowledge, perhaps unaware of
their potential for improvement.
Organisations and Employee Drivers
Overall the evidence in this area is quite limited. Some evidence was identified in this review on the
proportions of organisations undertaking certain measures related to efficient driving but this was
generally from small-scale surveys which may not be representative of UK employers and their drivers
as a whole. Apart from one study for DfT (Campbell-Hall et al, 2011) most of the research in this area
has also been produced by companies with a commercial interest in the fleet sector, meaning there is
some potential for bias. With these caveats in mind, the findings presented in this section should be
treated with caution, and as indicative only.
The available evidence suggests that around a half or more of UK organisations with a car/van fleet are
taking some actions aimed at increasing efficient driving by their employees. Qualitative research with
a sample of 28 employers, training providers and industry stakeholders conducted in 2011 concluded
that “Most companies were already attempting to manage drivers’ fuel efficiency...” (Campbell-Hall et
al, 2011).
A more recent survey of 72 European fleet managers reported that 49% had a defined program in
place aimed at influencing the driving of their employees (GE Capital, 2014). The same source also
reported that "72% of fleet managers monitor the actual fuel consumption of their car fleet drivers in
order to optimise fuel management.” However, evidence from a larger 2015 survey of 501 UK
company car drivers suggests a somewhat lower figure – see below.
12Efficient Driving A Rapid Evidence Assessment for the Department for Transport
Figure 9. Measures relating to efficient driving introduced by employers
Q. Which of these does your employer do, if any, with regards to company car drivers?
Monitors miles driven 36%
Monitors fuel consumption 22%
Driver monitoring equipment in car 9%
Has emergency call button in cars 2%
Cameras installed to record incidents 2%
None of these 53%
Source: Lex Autolease (2015)
No equivalent findings for van drivers or drivers of other types of company owned car (e.g. pool cars)
were found in this review.
There is also indicative evidence on the proportion of UK organisations introducing other measures
associated with efficient driving. Firstly, evidence from surveys of employee drivers suggests that
around one in five had been provided with training in efficient driving by their employer. Figure 10 is
based on a survey of 812 company car drivers and employees who use a privately owned car for work
purposes (also known as a member of the “grey fleet”). Figure 11 is based on a survey of 722 light van
drivers in six European countries 5.
Figure 10. The provision of training by employers
Q. Has your current or a past employer ever provided any information or training in the
following areas?
Health and safety awareness whilst
26%
driving
Accident avoidance 19%
Economical/fuel-efficient driving 18%
Speed awareness training 14%
Other driver-related training 16%
None of the above 61%
Source: Lex Autolease (2015)
5
Great Britain, France, Germany, Spain, Netherlands, Italy.
13Efficient Driving A Rapid Evidence Assessment for the Department for Transport
Figure 11. The provision of training by employers
Q. Has your company ever provided you with training for safer, more fuel
efficient driving?
21%
Yes
No
79%
Source: TomTom (2013)
In addition, survey evidence suggests that around a quarter of UK organisations have introduced in-
vehicle technology in their fleets.
Figure 12. The provision of in-vehicle technology by employers
FLEET MANAGERS
Q. Which of the following do you provide to drivers/have on some or all vehicles?
In-vehicle telematics 27%
Cameras on vehicles 12%
COMPANY CAR DRIVERS
Q. Which of these does your employer do, if any, with regards to company car drivers?
Installed driver monitoring equipment 22%
Installed cameras on vehicles 10%
Source: Lex Autolease (2014)
Based on their survey of light van drivers in six European countries, TomTom (2013) also report that “a
large majority of companies do not appear to operate technology to monitor driving performance and
fuel efficiency…only 23 per cent of drivers say their employers have such systems in place.” Sources
suggest that the general direction of travel is towards more organisations doing more to promote
efficient driving by their employees in the future – particularly with regards to technology-based
approaches. For example, based on a survey of 249 UK fleet managers, Lex Autolease (2015) report
that “a significant minority of those Fleet Managers (17%) not currently using telematics say they are
likely to introduce such a system in the next two years, particularly those managing larger fleets”.
14Efficient Driving A Rapid Evidence Assessment for the Department for Transport
Evidence on current levels of efficient driving by employee drivers themselves is also limited and even
somewhat contradictory. No sources were identified which provide a robust quantitative measure of
how efficiently employees currently drive but RAC (2015), based on a survey of 1,526 private car
drivers and company car drivers, did compare self-reported levels of efficient driving between the two.
They report that:
“40% (of company car drivers) said they actively changed their driving
behaviour to keep their miles per gallon low, compared to 27% of private
vehicle owners (and) 66% said they monitored the fuel consumption of their
vehicle, compared to 44% of private vehicle owners.”
RAC (2015)
TomTom (2013), in a survey of light van drivers, also asked respondents: Do you drive more carefully
and fuel efficiently when driving your personal rather than your business vehicle? Amongst GB
respondents, 39% answered Yes and 61% answered No. Although the wording of the survey question
is not ideal, as it conflates careful and efficient driving, the responses indicate that only a minority of
employee drivers may drive more efficiently in their private vehicle than in their company owned
vehicle.
Equally, other evidence concerning employee drivers suggest they exhibit certain driving behaviours
(in general or specifically when driving for work purposes) that may run counter to the principles of
efficient driving. Lex Autolease (2015), based on a survey of 1,041 employee drivers, report that “in
the last 12 months…63% admit to breaking the speed limits on major roads or motorways...5% admit
to drink-driving and 3% to driving under the influence of recreational drugs”. 6% also said they had
“had a minor accident that was their fault” in the last 12 months. Unfortunately the survey did not ask
respondents to differentiate between incidents when they were driving for personal or work purposes.
In addition, 77% of light van drivers surveyed by TomTom (2013) said they break the speed limit when
driving for work purposes occasionally or regularly, and 59% said time pressures made them more
likely to speed and take risks on the road while driving for work purposes.
3.2 Variations between different types of driver
Private Drivers
Inclination to drive efficiently is not uniform across all demographics, and there is evidence which
suggests variations by factors including by age, gender and education.
Gender
There is evidence that male drivers claim to have a greater knowledge of efficient driving and efficient
driving techniques than female drivers. This is demonstrated in the self-reported findings of a 2011
study, which found 92% of male drivers claimed to have adopted at least one efficient driving
technique, compared to 86% of females (Thornton et al, 2010). Males were also more likely than
females to have claimed that they have been driving in a more fuel efficient manner over the past 12
months – 52% compared to 36% - see below.
15Efficient Driving A Rapid Evidence Assessment for the Department for Transport
Figure 13. Self-reported use of efficient driving techniques by male and female UK drivers
Adopted any of listed techniques 86%
92%
Regularly checking tyre pressures 47%
65%
Gentle acceleration 51%
61%
Reading the road 47% Female
55%
drivers
Changing speed to save fuel 41%
51%
Planning journey to increse 38%
efficiency 43% Male
drivers
Using air conditioning sparingly 37%
39%
Not warming car before journey 25%
30%
Changing gear early 17%
26%
Switching off engine in traffic 20%
23%
Removing unused roof racks 5%
10%
None 12%
7%
Source: Thornton et al (2010)
However, it has also been reported that female drivers are more likely to regard the car as an ‘object
of utility’, as opposed to something to have fun in (Trommer et al, 2012). This supports claims from
two European studies which find female drivers to be more likely to hold efficiency as an objective
while driving, and maintain efficient driving for a sustained period (Trommer et al, 2012; Delhomme et
al, 2013). Based on this evidence, it could be suggested that there is a higher level of efficient driving
knowledge amongst male drivers, but that it is female drivers who are more likely to practise these
regularly.
Age
The majority of the evidence suggests that there is a variation in efficient driving by age, and that
‘older’ drivers are more likely to practise efficient driving than are ‘younger’ drivers. This is supported
by a study from New Zealand which reports that, on average, 51% of 25-44 year olds, compared to
71% of 45-65 year olds ‘always’ or ‘usually’ practise efficient driving techniques when driving (King,
2011). Further support for this comes from a 2010 UK study, which reports that 35% of drivers under
30 claimed to have started driving in a fuel efficient manner over the past 12 months, compared to
47% aged over 30 (Thornton et al, 2010). This may be attributed to the greater likelihood for younger
drivers (below the age of 24) to exhibit ‘sporty’ driving, and for older drivers (25 and over) to exhibit a
focus on fuel consumption (Trommer et al, 2012). However, one UK study finds that over half (55%) of
those aged over 65 admit they don’t drive in ways that might save fuel (Barclaycard, 2015). Given the
differing definitions of ‘young’ and ‘old’ across the evidence, it is difficult to draw strong conclusions
16Efficient Driving A Rapid Evidence Assessment for the Department for Transport
on the effect of age on propensity to practise efficient driving. However, from the evidence, three
classes of drivers do emerge: younger drivers (below 25), middle age drivers (26 – 65), older drivers
(over 65). From these categories, the evidence indicates that the most likely to practise efficient
driving are the middle age drivers.
Upon reviewing the evidence, a number of other demographics were mentioned which may impact on
efficient driving behaviours. It has been reported that drivers with low annual mileage are more likely
to practise efficient driving than higher mileage drivers, who hold time saving as a higher priority than
efficiency (Trommer et al, 2012). Furthermore, level of education, and environmental awareness,
influence likelihood of efficient driving, with more highly educated drivers more likely to drive
efficiently (Schroten, 2012; Thornton et al, 2010). This ties into reports that drivers of small vehicles,
as opposed to large vehicles, are more likely to hold pro-environmental attitudes, which correlates
with greater tendency to drive efficiently (Campbell-Hall et al, 2011; Delhomme et al, 2013).
Income
Finally, findings from Thornton et al (2010) suggest efficient driving may be more prevalent amongst
more affluent segments of UK drivers.
Figure 14. Self-reported use of efficient driving techniques by UK segment
Less affluent urban families 35%
Older, less mobile car owners 43%
Town and rural heavy car use 45%
Less affluent older sceptics 46%
Educated suburban families 51%
Affluent empty nesters 51%
Source: Thornton et al (2010)
Given the contradictions across the evidence, it is difficult to make robust judgements about how
efficient driving differs with socio-demographic characteristics. However, the available evidence
suggests that male drivers are more knowledgeable about efficient driving techniques than female
drivers, but that females are more likely to practise efficient driving regularly. The ‘middle’ age group
(26 – 65) show the greatest tendency to ecodrive, but new and younger drivers may be becoming
more aware of efficient driving techniques. Other factors, including annual mileage, education,
affluence and car type may also be indicators of efficient driving behaviours.
Organisations and Employee Drivers
The evidence suggests that larger organisations with larger fleets are most likely to be taking action to
promote efficient driving by their employees. For example, Lex Autolease (2014), based on a survey of
505 UK company car drivers, reported that 71% of company car drivers in larger organisations (with
250+ employees) have received some form of driver training or information, while this was 45%
amongst company car drivers in smaller organisations. Campbell-Hall et al (2011) also reported that
17Efficient Driving A Rapid Evidence Assessment for the Department for Transport
“larger employers with bigger vehicle fleets were starting to introduce more actions and strategies
aimed at fuel efficient driving”. This is reinforced by previous research concerning organisations with
truck and HGV fleets (Lawson et al, 2007a; Lawson et al, 2007b) conducted for DfT which found those
with larger fleets were more likely to be taking active steps to promote efficient driving by their
drivers.
No evidence was identified in this review comparing levels of efficient driving amongst different types
of employee driver – e.g. company car drivers compared to drivers of pool cars
3.3 Future Potential
Private Drivers
There is a consensus in the evidence that if drivers consistently adopted all efficient driving techniques
at all times then fuel consumption, and thus emissions, could be reduced by around 20% - 25% (Fiat,
2010; Kurani et al, 2015; Barkenbus, 2010; CICEA, 2007; RAC, 2015; Shaheen et al, 2012; Aecom, 2013).
However, the evidence is equally in agreement that drivers are very unlikely to sustain this in the long
term. Most suggest a realistic long term reduction of between 5% - 10% (Fiat, 2010; Schroten, 2012;
Kurani et al, 2013; Barkenbus, 2010; CICEA, 2007; Wengraf, 2012; Luther et al, 2011; Alam et al, 2014;
Graves et al, 2012; Gonder et al, 2011; Shaheen et al, 2012).
Using figures from a study conducted by Fiat, it can been estimated that if efficient driving was to
reduce fuel consumption by 10%, then individual drivers could reduce their annual CO2 emissions by
over 220kg, and by over 1,800kg over the life of the car. This would translate into an annual saving of
up to £96 for the average driver and £735 over the lifecycle of the car (Fiat, 2010). However, these
figures are, of course, dependent on fuel prices, miles driven and the fuel efficiency of the driver’s
vehicle.
It has also been estimated by the Committee on Climate Change that if 3.9 million of the drivers in the
UK (10% of full driving license holders, and 15% of those with access to a car) were to be trained to
increase the efficiency of their driving, then by 2020 CO2 emissions could be reduced by 0.3 million
tonnes (Wengraf, 2012). On a greater scale, in 2001, the EU European Climate Change Programme
projected that the adoption of eco-driving techniques in 15 EU countries 6 had the potential to remove
50 million tons of CO2 per year from the total road traffic emissions resulting in annual cost savings in
the region of €20 billion (Luther et al, 2011). These figures for EU-wide savings are perhaps outdated,
but they give a sense of the substantial savings, both in terms of money and emissions, that could be
made if efficient driving was more prevalent.
Organisations and Employee Drivers
No off-the-shelf answer was found in this review to the question of how much could be saved (in CO2
or money terms) if efficient driving by employee drivers in the UK increases in the future. However,
this can be estimated, drawing on various sources of data, some of which have already been
highlighted in this review. In terms of CO2, basic estimates were provided in chapter 2 for the tonnes
6
Austria, Belgium, Denmark, Finland, France, Germany, Greece, Ireland, Italy, Luxembourg, Netherlands,
Portugal, Spain, Sweden and United Kingdom.
18Efficient Driving A Rapid Evidence Assessment for the Department for Transport
of CO2 arising from company owned cars and vans in the UK. Evidence presented later in chapter 5
also suggests the scale by which fuel consumption can be reduced if organisations introduce measures
to promote efficient driving amongst their employees. CO2 emissions are known to fall in line with
reductions in fuel consumption, meaning it is possible to roughly estimate potential CO2 savings at a
national level.
For example:
• Estimated annual CO2 emissions arising from travel by company-owned cars and vans in the
UK: 18.1 million tonnes.
• Estimated reduction in fuel consumption if measures to promote efficient driving are
introduced: 2%-12%.
• Estimated annual CO2 savings if measures introduced across all company-owned cars and vans
in the UK: 0.36 – 2.17 million tonnes.
These results should be treated as indicative only, as there certain caveats with both the estimated
CO2 emissions (see chapter 2) and the estimated reductions in fuel consumptions (see chapter 5).
Both could benefit from further research and analysis - which it has been beyond the scope of this
review to undertake. The above is also based on certain simplistic assumptions and does not account,
for example, for the fact that some UK companies have already introduced measures to promote
efficient driving. Further analysis could address such issues and also provide more nuanced results for
different scenarios – for example, what are the potential CO2 savings if only a segment of UK
companies introduce measures to promote efficient driving rather than all of them, or if measures are
targeted at company-owned vans but not company cars?
In terms of potential financial savings, this is more complex. There are direct and indirect costs
associated with a company introducing measures to promote efficient driving. In addition, although
the financial savings arising from lower fuel consumption can be relatively easily estimated, there are
highly likely to be additional savings (e.g. arising from lower maintenance and insurance costs) that
have not yet been comprehensively quantified or monetised in the evidence base on efficient driving
(see chapter 6).
19Efficient Driving A Rapid Evidence Assessment for the Department for Transport
4 Motivations and Barriers
The principal motivation for private drivers to adopt efficient driving is saving money - cited by
over 50% as a motivation. Safety is also a factor (although this is not always included in survey
options) and environmental concerns are a more limited motivation.
Barriers to efficient driving for private drivers include: habit; awareness of efficient driving
techniques; competing priorities (e.g. to arrive at a destination as soon as possible); social norms;
and the presence of other behaviours that drivers can adopt to save either money or emissions
(e.g. buying a more fuel efficient car).
Motivations and barriers are reported to be similar for employee drivers – although they may not
be motivated by saving money to the same extent that private drivers are because their fuel costs
are generally met by their employer.
Organisations are primarily motivated to promote efficient driving amongst their employees by
potential financial savings on fuel and other associated costs, although safety is also cited as a
motivation, as is a desire to project an environmentally friendly corporate image.
A key barrier for organisations is the current lack of robust, independent data quantifying the
return on investment for introducing measures such as training for their employees and in-
vehicle technology.
This chapter presents evidence on the motivations and barriers that exist for efficient driving,
variations in these between different types of driver, and whether there are any key influencing points
for motivating efficient driving. Where the evidence is sufficient, these questions are considered for
both private drivers and organisations and their employees.
4.1 Motivations
Private Drivers
A number of key motivations for efficient driving are identified in the evidence, and there is also a
reasonable amount of evidence regarding the relative strength or importance of these motivations.
Saving Money
Identified most widely in the evidence are economic motivations, which are also identified as some of
the strongest or most important motivations. One source, for example, cites previous research that “A
poll by GfK NOP (2009) suggests that the strongest driver for behaviour change is economic. The main
reason given for eco-driving by 51% of drivers polled was the financial savings gained by reduced fuel
consumption”. Similarly, a Populus survey in 2011 showed that “key motivators for eco-driving were
related to finance and safety.” (Wengraf, 2012).
Context may also important in regard to economic motivations and fuel economy. A number of
sources suggest that these motivations can become more important or salient to drivers during times
20You can also read