Improving air quality in the UK - Tackling nitrogen dioxide in our towns and cities UK overview document December 2015
←
→
Page content transcription
If your browser does not render page correctly, please read the page content below
www.gov.ur

Improving air quality in the UK
Tackling nitrogen dioxide in our towns and cities

UK overview document
December 2015
© Crown copyright 2015

You may re-use this information (excluding logos) free of charge in any format or medium,
under the terms of the Open Government Licence v.3. To view this licence visit
www.nationalarchives.gov.uk/doc/open-government-licence/version/3/ or email
PSI@nationalarchives.gsi.gov.uk

Any enquiries regarding this publication should be sent to us at:

air.quality@defra.gsi.gov.uk
Contents

Executive Summary .............................................................................................................. i

1.      Introduction ................................................................................................................... 1

2.      The challenge ............................................................................................................... 1

     2.1. The causes of air pollution ...................................................................................... 1

     2.2. Impact on health and the environment.................................................................... 3

     2.3. Emissions from transport ........................................................................................ 4

     2.4. UK record in tackling air pollution ........................................................................... 4

     2.5. Raising awareness ................................................................................................. 6

     2.6. Quantifying the ambition ......................................................................................... 8

3.      National action to improve air quality .......................................................................... 15

     3.1. England ................................................................................................................ 15

     3.2. Scotland ................................................................................................................ 15

     3.3. Wales .................................................................................................................... 16

     3.4. Northern Ireland .................................................................................................... 17

     3.5. Clean Air Zones .................................................................................................... 19

     3.6. Clean Air Zones outside London........................................................................... 24

     3.7. Greater London..................................................................................................... 25

     3.8. Improving air quality in all areas ........................................................................... 28

4.      Impact of measures .................................................................................................... 33

5.      Detailed measures ...................................................................................................... 36

     5.1. Incentivising ultra low emission vehicles ............................................................... 36

     5.2. The national and local road network ..................................................................... 38

     5.3. Reducing emissions from buildings ...................................................................... 40

     5.4. Reducing emissions from other sources ............................................................... 40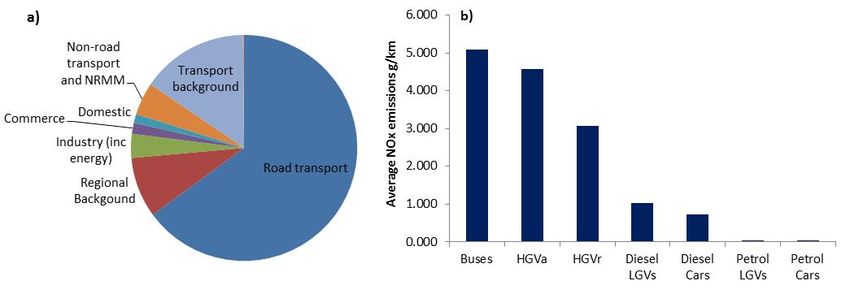
6.      Annex 1 ...................................................................................................................... 45

     6.1. Evaluation of progress towards meeting the nitrogen dioxide limit values ............ 45

     6.2. General background information on the UK .......................................................... 48

7.      Annex 2 ...................................................................................................................... 50

     7.1. Infrastructure and land use planning..................................................................... 50

     7.2. Local action .......................................................................................................... 52

     7.3. Ports and shipping ................................................................................................ 54

     7.4. Freight .................................................................................................................. 56

     7.5. Reducing emissions from buildings ...................................................................... 57

     7.6. Industry ................................................................................................................. 58

     7.7. Emissions from other stationary sources .............................................................. 59

     7.8. Non-Road Mobile Machinery ................................................................................ 60

8.      Annex 3 ...................................................................................................................... 61

9.      Glossary ..................................................................................................................... 63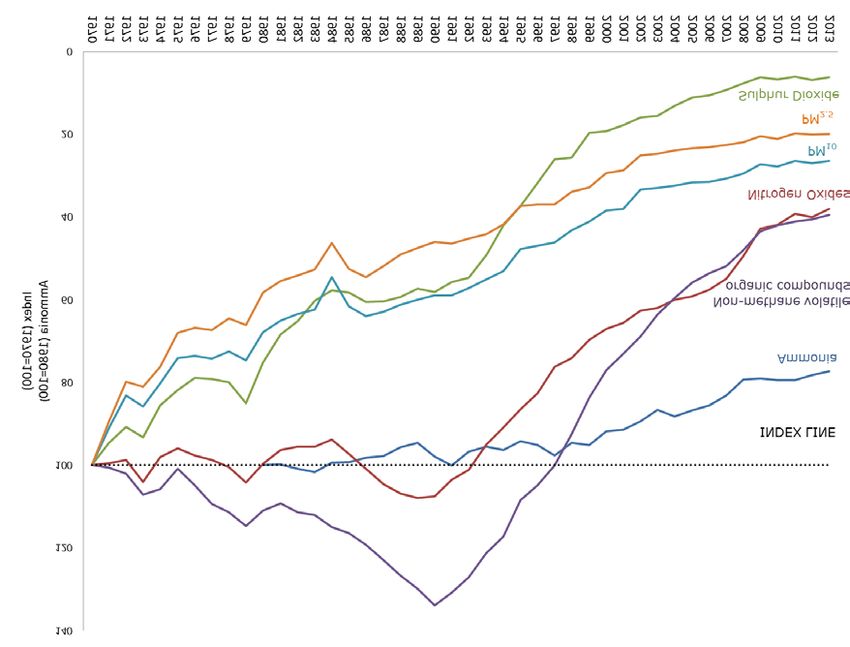
Executive Summary
We are committed to improving the UK’s air quality, reducing health impacts, and fulfilling
our legal obligations. This Plan sets out a comprehensive approach for meeting these
goals by implementing a new programme of Clean Air Zones. Under this Plan, by 2020 the
most polluting diesel vehicles - old polluting buses, coaches, taxis and lorries - will be
discouraged from entering the centres of Birmingham, Leeds, Southampton, Nottingham
and Derby. Newer vehicles that meet the latest emission standards, and private cars, will
be unaffected.

Progress to date
Over recent decades, air quality has improved significantly. Between 2005 and 2013
emissions of nitrogen oxides have fallen by 38% and particulate matter has reduced by
more than 16%. Over the past five years the Government has committed over £2 billion to
help bus operators upgrade their fleets, reduce pollution from a range of vehicles such as
refuse trucks and fire engines through cutting edge technologies, and promote the
development of clean alternative fuels such as powering taxis with liquid petroleum gas in
Birmingham.

Targeted Clean Air Zones
In order to bring the UK into legal compliance and to reduce concentrations of nitrogen
dioxide below 40 µg/m3 Clean Air Zones will be introduced in five cities. These Zones will
reduce the pollution in city centres and encourage the replacement of old, polluting
vehicles with modern, cleaner vehicles. Similar zones in Germany and Denmark have
been shown to improve air quality.

These Zones will target air quality hot spots. Following scoping studies, which Government
will provide funding for, Councils will consult on the details on these Zones.

Vehicles covered
In Birmingham, Leeds, Southampton, Nottingham and Derby, these Zones will cover old
diesel buses, coaches, taxis and lorries. Newer vehicles that meet the latest emissions
standards will not need to pay and, under this Plan, no private car will have to pay. The
local authorities will have to set charges at levels designed to reduce pollution, not to raise
revenue (beyond recovering the costs of the scheme).

Birmingham and Leeds will also discourage old polluting diesel vans and implement other
measures including park and ride schemes, signage, changes in road layouts and
provision of infrastructure for alternative fuels.

                                               i
Transition to new fleets
Many companies have already started to update their fleets to modern, cleaner vehicles.
For example, by 2017 British Gas will have replaced at least 10% of their commercial fleet
with electric vehicles, reducing emissions compared to their old diesel vans. The new
electric vans also represent a saving over their diesel counterparts. In London the cost
savings could be as high as 20%, with other locations saving between 6-10%.
The Environment Agency, winner of Green Fleet of the Year 2015, has committed to
increase the number of ultra-low emission vehicles to more than 100 by the end of 2015.
Another example of businesses modernising their fleet is Reading Buses - 38% of their
fleet are ‘ultra-clean’ drastically reducing their emissions. Drivers are also given advice on
fuel efficient eco-driving techniques.
Testing standards
One of the main reasons our cities continue to face air quality problems is the failure of
diesel vehicles to deliver expected emission reductions in real world driving conditions. We
have recently secured agreement in the EU to introduce more stringent emissions testing
across the EU, ensuring that vehicles live up to their low emission credentials. Our Plan
fully factors in current car performance and future performance standards following this
agreement.
London
The Mayor of London has a well-developed strategy for improving air quality by 2025,
including the implementation of an ultra-low emission zone by 2020, retro-fitting of buses
and licensing new taxis to be zero emission capable from 2018. We will continue to
support and monitor the delivery of the Mayor’s plans.
ii1. Introduction
1. This document provides an overview of the UK plan for improving air quality. Along
with the associated zone plans it sets out how the Government will fulfil its
commitment to improve air quality and meet the requirements of the Ambient Air
Quality Directive 2008 (the ‘Air Quality Directive’) 1 for nitrogen dioxide in the shortest
possible time.
2. This plan has been developed following a forty day public consultation on draft plans
(launched in September 2015) which received over 480 responses. The plan has
also been informed by a series of round table discussions with relevant industries
and specialist groups. We held two engagement events where key elements of the
plan were discussed in depth, one with local authorities and the other with
organisations covering a broad range of interests from environmental groups to
technology providers. We have also held detailed discussions on the local issues
facing those cities with the most challenging air quality issues.
3. Implementation of the plan and progress on delivering improved air quality across the
country will be closely monitored both through formal reporting processes and
through continued engagement with local authorities, industry, and other relevant
parties.
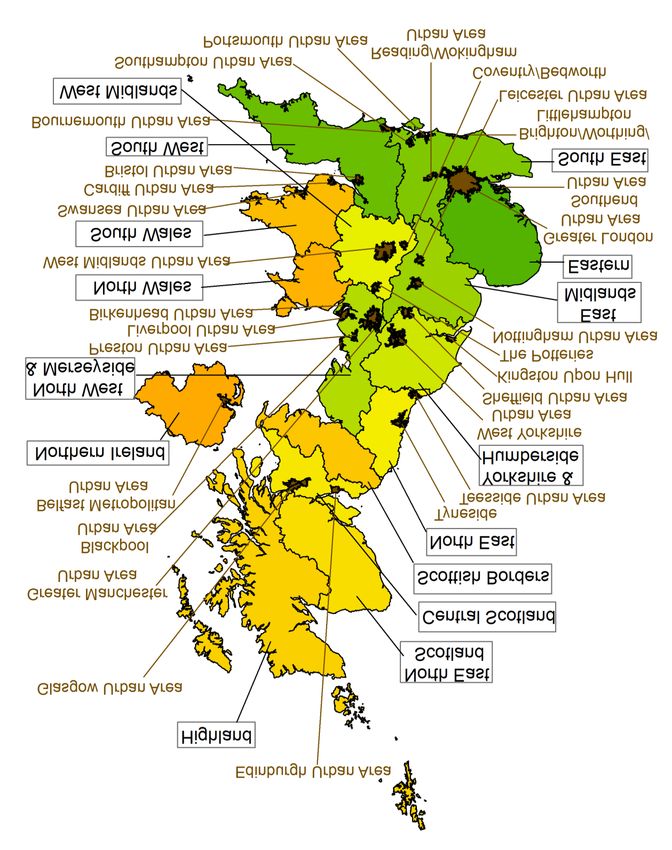
4. The UK is divided into 43 zones and agglomerations for air quality monitoring and
reporting purposes (see map 1 in Annex 1). This plan should be read alongside the
other documents published with this overview:
• the individual local plans for each of the 38 zones where we have currently
identified air quality issues with nitrogen dioxide (NO2);
• the list of UK and national measures; and
• the technical report on the modelling and assessment methodology used in
the preparation of the plan.
2. The challenge
5. The Government is taking action on air quality in order to improve health and the
environment. We are not alone in facing this challenge, 16 other European countries
will need to take action to reduce their nitrogen dioxide levels.
2.1. The causes of air pollution
6. Air pollution is primarily caused by the combustion of fossil fuels, for example, in
power generation, industrial processes, domestic heating and road vehicles. These
1
European Directive 2008/50/EC on ambient air quality and cleaner air for Europe. This sets maximum
concentrations of key pollutants in ambient air, i.e. the air that we all breathe.
1can give rise to a number of pollutants including nitrogen oxides (NOx) 2, sulphur
dioxide (SO2) and particulate matter (PM). Chemical reactions in the atmosphere can
also lead to the generation of other pollutants. Ozone is produced by the effect of
sunlight on nitrogen oxides and volatile organic compounds (also produced by
industry), while NOx and sulphur oxides can also contribute to the formation of
particulate matter.
7. On average transport is responsible for 80% of NOx emissions at the roadside in
areas where we need to act to reduce levels. Figure 1 provides an overview of the
breakdown of roadside NOx emissions in 2013 and the emission rates by vehicle type
for Euro 5/V (the standards in force in 2013).
Figure 1: a) Average NOx source apportionment on UK road links outside London
exceeding an annual mean NO2 concentration of 40µg/m3 in 2013 b) vehicle emissions
per kilometre by vehicle type Euro 5/V
8. Although non-transport sources of nitrogen oxides, such as industrial processes, are
still considerable contributors, the largest source of emissions in the areas of greatest
concern are diesel vehicles. This is due to both the significant growth in vehicle
numbers over the last ten years and the emissions standards not delivering the
expected reductions under real world driving conditions 3, even before the revelations
over the use of so called ‘defeat devices’. However, the vehicle mix in particular
areas will vary according to circumstance and the approach in this plan seeks to
address all relevant modes of transport. A more detailed breakdown of source
apportionment by road link is available in the accompanying zone plans.
2
Nitrogen oxides (NOX) is the term used to describe the sum of nitrogen dioxide (NO2) and nitric oxide (NO).
Ambient NO2 concentrations include contributions from both directly emitted primary NO2 and secondary
NO2 formed in the atmosphere by the oxidation of NO.
3
Compared to laboratory testing
22.2. Impact on health and the environment
9. Improving air quality can improve health in the short and in the long-term. Better air
quality will have particular benefits for people with heart or lung conditions or
breathing problems.
10. The Committee on the Medical Effects of Air Pollutants (COMEAP) has identified that
the evidence associating exposure to NO2 with health effects has strengthened
substantially in recent years 4. An estimate of an effect on mortality equivalent to
23,500 deaths annually in the UK has been made on the basis of NO2
concentrations 5. Many of the sources of NOx are also sources of particulate matter
(PM). The impact of exposure to small particulate matter pollution (PM2.5) is estimated
to have an effect on mortality equivalent to nearly 29,000 deaths in the UK 6. There
may be overlap between these two estimates of mortality, but the combined impact of
these two pollutants is a significant challenge to public health. Recommended limits
for exposure have been set taking account of guidelines by the World Health
Organisation.
11. At a local level the potential impact of poor air quality on health is captured in the
Public Health Outcomes Framework 7, which sets out the desired outcomes for public
health in England and provides a means for driving improvement within and across
authorities. The Public Health Outcomes Framework includes an air pollution
indicator: the percentage of mortality attributable to particulate matter (PM2.5)
pollution. This indicator is intended to raise awareness of the impact of air pollution
on public health. It allows Directors of Public Health to prioritise action on air quality
in their local area to help reduce the health burden from air pollution. Public Health
England has also published estimates of the mortality burden attributable to
particulate matter pollution in local authority areas in the UK 8. Although these
estimates are based on studies of the health effects associated with particulate
matter pollution, many of the measures and the drivers behind improvements will
have wider benefits, including reducing NOx emissions and NO2 concentrations.
12. Improving air quality will also provide additional benefits by reducing damage to the
natural environment. Nitrogen oxides can contribute to eutrophication of waterways
that damages aquatic life. They can also lead, through chemical reactions with
volatile organic compounds, to ground level ozone that damages crops.
4
Statement on the evidence for the effects of nitrogen dioxide on health
https://www.gov.uk/government/publications/nitrogen-dioxide-health-effects-of-exposure
5
Defra analysis using interim recommendations from COMEAP’s working group on NO2. The working group
made an interim recommendation for a coefficient to reflect the relationship between mortality and NO2
concentrations (per µg/m3). COMEAP has not yet made any estimates of the effects of NO2 on mortality.
Any analysis will be subject to change following further analysis by the working group and consultation with
the full committee.
6
COMEAP (2009) The Mortality Effects of Long-Term Exposure to Particulate Air Pollution in the United
Kingdom
https://www.gov.uk/government/uploads/system/uploads/attachment_data/file/304641/COMEAP_mortality_e
ffects_of_long_term_exposure.pdf
7
https://www.gov.uk/government/publications/healthy-lives-healthy-people-improving-outcomes-and-
supporting-transparency
8
https://www.gov.uk/government/publications/estimating-local-mortality-burdens-associated-with-particulate-
air-pollution
32.3. Emissions from transport
13. The introduction of increasingly strict vehicle emissions regulations (Euro standards)
has not delivered the expected NOx emission reductions from diesel vehicles in real
world use. As a result road transport is still by far the largest contributor to NO2
pollution in areas where the UK is exceeding NO2 limit values.
14. Addressing road transport therefore presents the most significant opportunity to
improve air quality. Transport is a key part of almost everything we do, as individuals
or businesses, and its impacts are much wider than air quality. By the careful choice
of appropriate and proportionate measures that recognise the economic and social
impacts and value, we can deliver broader benefits. The opportunities are not limited
to transport. A significant proportion of background emissions still come from non-
transport sources and, as set out in Section 5 and Annex 2, we are also taking action
to tackle emissions from industrial, domestic and other sources.
15. Transport is a major source of atmospheric carbon dioxide (CO2) and many of the
measures which will improve air quality will also decrease CO2 emissions and reduce
long term climate change.
16. Increasing the number of ultra low emission technologies in the vehicle fleet, most
notably through electrification, has a number of benefits. Not only does it support
growth and UK innovation, it is the most significant action that can benefit both air
quality and reducing carbon emissions. Ultra low emission vehicles emit extremely
low levels of carbon dioxide 9 and other pollutants compared to conventional vehicles
fuelled by petrol/diesel. They typically also have much lower or virtually nil emissions
of air pollutants, and lower noise levels. In the longer term, combined with increasing
use of low carbon energy to provide the power from the National Grid, these vehicles
can become truly zero emission, not just when in use.
17. The UK is a leader in the development of clean transport technologies. Accelerating
the uptake of these technologies will help drive growth and the economy as well as
improve air quality. The 2015 Autumn Statement set out that Government will spend
more than £600 million between 2015 and 2020 to support uptake and manufacturing
of ultra low emission vehicles in the UK. This will help maintain the global leadership
that in 2014 saw 1 in 4 of all European electric vehicles built here, and keep the UK
on track for almost every car and van to be effectively zero emission by 2050. This
investment will save 65 million tonnes of carbon and help deliver the long term
answer on urban air quality.
2.4. UK record in tackling air pollution
18. We have achieved significant improvements in air quality across a range of pollutants
over the last five decades (Figure 2) through the successful introduction by
Government and others of a range of measures in the UK. Emissions of nitrogen
oxides alone have fallen by 62% since 1970.
9
The Office for Low Emission Vehicles has considered ultra low emission vehicles to be new cars or vans
that emit less than 75 grams of CO2 from the tailpipe per kilometre driven.
419. This has been achieved through the regulatory frameworks we have put in place and
supported at local, national, European or international level, and through significant
investment by industry in cleaner processes. For example, we have driven
reductions in emissions from power stations through the use of improved combustion
technologies (such as low-NOx burners and retro-fitting coal-fired power stations),
through legislation including the Large Combustion Plant and Industrial Emissions
Directives and the shift in the UK fuel mix away from coal towards nuclear, gas and
renewables. The UK continues to meet international and European ceilings for
emissions of nitrogen oxides.
Figure 2: Trends in UK sulphur dioxide, nitrogen oxides, non-methane volatile organic
compounds, ammonia and particulate matter (PM10, PM2.5) emissions 1970 – 2013
20. We have also successfully reduced ambient concentrations of NO2. These have
decreased since 1990 (Annex 1, Figure 5) through stricter European vehicle emission
standards together with a wide range of measures and investment. If the most recent
standards had successfully been delivered by vehicle manufacturers to give the
reductions in emissions of nitrogen oxides anticipated, the UK would expect to have
seen further improvements in these trends. Since 2011 we have committed over £2bn
on greener transport measures. Table 1 provides a summary of some of the action we
have taken so far. Further background is included in Annex 2. Details on the range of
other measures we have taken, and will take in the future, are provided throughout this
plan.
5Table 1: Supporting National and Local Greener Transport
Ultra low £1000m Commitment between 2010-2020 to put the UK at the global
emission forefront of ultra low emission vehicle development,
vehicles manufacture and use: £400m in the last Parliament and a
further £600m to 2020.
Local £665m Over 2011-2015 £600m to support 96 project across 77 local
Sustainable authorities to increase the use of buses, cycling and walking.
Transport Fund An additional £65m to support 44 local authorities in 2015/16.
£580m Over 2015-2020 for a new ‘Access’ fund for sustainable travel,
building on the legacy of the Local Sustainable Transport Fund
and supporting growth in cycling and walking.
Buses £89m To bus operators and local authorities in England up to 2013 to
purchase over 1,200 new low emission buses.
£7m In 2015 to local authorities in England to support the retrofitting
of buses.
£7m In 2013-2014, to 18 local authorities to upgrade approximately
500 buses with pollution reducing technology.
£5m To upgrade, together with match funding, around 900 London
buses in in 2012-2013.
Cleaner Vehicle £8m In 2014 via the Clean Vehicle Technology Fund to 23 local
Technologies authorities for fitting cutting-edge, pollution reducing
technologies to over 1,200 vehicles.
National Road £100m Ring-fenced air quality fund for Highways England over 2015-
Network 2021 to address air pollution as part of the Road Investment
Strategy.
£100m For Highways England over 2015-2021 to improve cycling
conditions alongside and crossing the strategic road network.
Cycling and £593m On a variety of measures 2011-2020 to support cycling under
walking the Local Sustainable Transport Fund, Bikeability, the Cycle
Ambition Scheme, and Cycle Rail
2.5. Raising awareness
21. Access to data and information is essential to our ability to make informed choices to
tackle the sources of, and reduce exposure to, pollution. We aim to reach people
both routinely and during periods of poor air quality in the way they commonly access
information, whether through social, local, national or other media. The Government
is committed to making air quality data publically available and to work with others to
6develop innovative tools to help the public understand what this information means
for their health.
22. Up to date and accessible information about current and forecast air quality levels
helps everyone to take action to mitigate the short-term effects of air pollution on their
health. It enables, for example, people to change their own driving behaviour where
necessary to reduce their contribution to pollution. It can also help people avoid
areas during episodes of high pollution. This is particularly important for those who
may be vulnerable because of, for example, heart or lung conditions. In the longer
term this information also helps raise wider awareness of the problem and the
development of solutions.
23. The UK is providing near real time monitoring information for a range of pollutants on
the UK-Air website 10. Separate sites are also provided by the Devolved
Governments 11. The UK Government provides 5-day pollution forecasts which are
updated daily and allow the public to look ahead and plan if pollution levels are likely
to rise.
24. The information available includes hourly mean NO2 levels, and health advice for the
general public, including children and other vulnerable groups. This information is
presented using a Daily Air Quality Index (DAQI) of 5 pollutants, including NO2, and
provides a clear 10-point scale of pollution from low to very high. Each DAQI banding
is accompanied by health messages for at-risk individuals, and for the general
population. Our monitoring information is made publically available so that it can be
widely used.
25. We will continue to examine and develop how best to reach those who may be
affected by poor air quality, including examining the potential for introducing a formal
air quality warning system alongside the current processes. Such a warning system,
to inform the public about the potential risk of pollution, may work along the lines of
those used, for example, during severe weather alerts.
26. We are using local channels to encourage action to mitigate air pollution, including
local authorities, elected officials and Directors of Public Health, so that air quality is
appropriately prioritised in areas where it is an issue. We have published a toolkit 12 to
assist local decision makers in engaging with their communities. This includes
information on the evidence to help them argue the case for action and advice on
communicating with the public and others.
27. We are continuing to develop advice and guidance for local authorities and
communities. Public Health England has developed a programme in support of
National and Local Government to reduce mortality in England attributable to air
pollution. The programme focuses on helping raise awareness of the health effects
of air pollution and further developing and synthesising the evidence on the health
10
uk-air.defra.gov.uk
11
Scotland: http://www.scottishairquality.co.uk/ Wales: http://www.welshairquality.co.uk/ Northern Ireland:
http://www.airqualityni.co.uk/
12
Directors of Public Health Air Quality toolkit
http://randd.defra.gov.uk/Default.aspx?Menu=Menu&Module=More&Location=None&Completed=0&ProjectI
D=18580#Description
7effects of air pollutants, including NO2, PM and ozone. Public Health England will
focus its efforts on promoting actions that can bring a range of health benefits.
28. We use social and other media to communicate and highlight episodes of high or
forecast high air pollution. We also work with health Non-Governmental
Organisations who have agreed to use their networks and media channels to help
reach vulnerable groups and individuals during episodes.
29. Local authorities, Non-Governmental Organisations and other stakeholders can also
play a role in helping disseminate advice and guidance. Using information provided
they can help people understand the health impacts, steps they can take to reduce
exposure to air pollution and how to reduce the impacts and causes. We will
encourage these organisations to work with us to help identify the wide range of
information resources available, target these appropriately and disseminate
information.
30. Together these measures will help ensure that we raise public awareness of both the
challenge we face and the opportunities for personal action.
2.6. Quantifying the ambition
31. Given the health impacts on individuals we need to make further improvements for
the benefit of people living and working in our cities. To do this, and to support both
our domestic ambition and international negotiations, we need to be able to measure
and define air quality to a consistent, logical and internationally recognised approach.
32. The Air Quality Directive helps to achieve this by setting out how air quality should be
measured and also setting limit values that should be met to protect health and the
environment.
2.6.1. The Air Quality Directive standards
33. The Air Quality Directive takes account of guidelines from the World Health
Organisation. It sets certain limits and information requirements for a number of
pollutants, including nitrogen dioxide (NO2), to help countries address and prioritise
the harmful effects of pollution.
34. For NO2 the Air Quality Directive sets two limit values 13 for the protection of human
health. These require Member States to ensure that:
• annual mean concentration levels of NO2 do not exceed 40μg/m3; and
• hourly mean concentration levels of NO2 do not exceed 200μg/m3 more than
18 times a calendar year.
13
Limit values are expressed in terms of μg/m3 (micrograms per cubic metre). This may also be written as
μgm-3
835. Member States were required to meet these limits by 1 January 2010 unless an
extension was granted for up to 5 years to 1 January 2015. The UK was granted an
extension in 12 of the 43 air quality zones and agglomerations.
36. The UK assesses progress against these limits through a UK wide system of over
145 air quality monitoring stations, known as the Automatic Urban and Rural Network
(AURN), together with a Pollution Climate Mapping (PCM) model 14.
Air quality reporting
37. The UK reports air quality data on an annual basis. In 2013 five zones met the limit
value for annual mean NO2 concentrations, with an additional 7 zones meeting the
Directive requirements within a margin of tolerance as part of an agreed time
extension 15 (Table 2). The remaining 31 zones had measured or modelled NO2
levels over the limit and had no time extension.
Table 2: UK zones and agglomerations meeting limit values in 2013
Zones meeting the annual mean limit Blackpool Urban Area
value for NO2 in 2013: Preston Urban Area
Highland
Scottish Borders
Northern Ireland
Zones exceeding the annual mean Portsmouth Urban Area
limit value, but within the annual mean Birkenhead Urban Area
limit value plus margin of tolerance
Southend Urban Area
Edinburgh Urban Area
Swansea Urban Area
Central Scotland
North Wales
38. In 2013 the UK met the limit value for hourly mean NO2 in all zones except for
Greater London.
2.6.2. Future air quality
39. As part of our commitment to addressing the health impact of air pollution, the UK is
determined to meet the requirements set out in the Air Quality Directive and to do so
in the shortest time possible. Our evaluation of the measures we will put in place to
14
For details of the PCM model and monitoring approach see the Technical Report
15
Where a time extension applies the UK is required to provide the Commission with data indicating that the
annual mean NO2 concentrations in these zones have remained at or below the annual limit value plus the
maximum margin of tolerance to 60 μg/m3
9achieve this, and assessment to ensure they are focused on the right areas and
issues, is based on the most up to date information available.
40. We have used our Pollution Climate Mapping model to project future NO2
concentrations, and provide projected dates for when each UK zone will meet the
requirements of the Air Quality Directive.
41. These projections look at five year intervals going forward with a baseline year of
2013. The quantifiable impacts of measures implemented and planned since we last
submitted plans in 2011 have been included in these baselines. The projections
show that through existing measures (set out in this plan) which we have taken to
reduce NO2 and other pollutants in the UK, 35 zones are expected to meet the
required levels by 2020. This will lead to significant benefits for the UK, including
helping to avoid health impacts.
42. Table 3 summarises both the projected dates by when the required levels will be
achieved in individual zones if we rely only on these existing actions, and the impact
of the additional measures in this plan in bringing those dates forward. Eight zones
are projected to not meet the limit values in 2020 without this further additional
action.
10Table 3: Summary of 2013 exceedance of NO2 limit values and projected dates of compliance
2013 assessment 16 Baseline projections for 2020 Compliance
Zone/Agglomeration Maximum Km of road Maximum Hourly limit Km of road Maximum Compliance with Compliance
annual mean exceeding annual value exceeding annual mean NO2 limit values estimate
3
limit value limit value mean exceedance annual limit (µg/m ) projected with no based on this
exceedance (µg/m3) value new measures plan
Greater London Urban Area Y 1078.5 126 Y 240.3 71 2030 2025
West Midlands Urban Area Y 189.9 70 N 4.3 47 2025 2020
Greater Manchester Urban Area Y 170.3 61 N 0.0 38 2020 2020
West Yorkshire Urban Area Y 82.7 74 N 2.7 47 2025 2020
Tyneside Y 47.2 65 N 0.0 39 2020 2020
Liverpool Urban Area Y 38.6 57 N 0.0 36 2020 2020
Sheffield Urban Area Y 34.9 57 N 0.0 38 2020 2020
Nottingham Urban Area Y 33.6 65 N 0.8 42 2025 2020
Bristol Urban Area Y 18.3 53 N 0.0 35 2020 2020
17
Brighton/Worthing/Littlehampton Y 0.8 41 N 0.0 27 2015 2015
Leicester Urban Area Y 19.4 53 N 0.0 39 2020 2020
Portsmouth Urban Area Y 10.0 53 N 0.0 37 2020 2020
Teesside Urban Area Y 9.7 65 N 0.0 39 2020 2020
The Potteries Y 19.9 58 N 0.0 35 2020 2020
Bournemouth Urban Area Y 11.2 49 N 0.0 34 2020 2020
Reading/Wokingham Urban Area Y 6.9 49 N 0.0 36 2020 2020
Coventry/Bedworth Y 15.0 52 N 0.0 34 2020 2020
Kingston upon Hull Y 21.1 54 N 0.0 31 2020 2020
16
Note this assessment differs from data submitted to the Commission in September 2013. To ensure we use best available evidence the 2013 assessment has
been updated to take account of latest emission factors. This data has been resubmitted to the Commission.
17
This is still a projected date until the full year of data is analysed for the 2015 compliance assessment
112013 assessment 16 Baseline projections for 2020 Compliance
Southampton Urban Area Y 18.4 68 N 0.3 41 2025 2020
Birkenhead Urban Area Y 5.3 47 N 0.0 31 2020 2020
Southend Urban Area Y 7.1 56 N 0.0 37 2020 2020
Blackpool Urban Area N 0.0 34 N 0.0 22 Compliant Compliant
Preston Urban Area N 0.0 40 N 0.0 28 Compliant Compliant
Glasgow Urban Area Y 76.2 68 N 0.0 38 2020 2020
Edinburgh Urban Area Y 8.8 50 N 0.0 34 2020 2020
Cardiff Urban Area Y 19.8 54 N 0.0 37 2020 2020
Swansea Urban Area Y 2.7 48 N 0.0 33 2020 2020
Belfast Metropolitan Urban Area Y 51.8 64 N 0.0 37 2020 2020
Eastern Y 39.9 70 N 0.8 41 2025 2020
South West Y 31.8 52 N 0.0 35 2020 2020
South East Y 107.4 59 N 0.0 37 2020 2020
East Midlands Y 65.3 64 N 0.9 43 2025 2020
North West & Merseyside Y 60.7 72 N 0.0 40 2020 2020
Yorkshire & Humberside Y 49.8 57 N 0.0 37 2020 2020
West Midlands Y 43.3 60 N 0.0 39 2020 2020
North East Y 47.2 65 N 0.0 39 2020 2020
Central Scotland Y 21.4 51 N 0.0 34 2020 2020
North East Scotland Y 7.9 52 N 0.0 34 2020 2020
Highland N 0.0 32 N 0.0 19 Compliant Compliant
Scottish Borders N 0.0 26 N 0.0 17 Compliant Compliant
South Wales Y 30.3 66 N 2.1 41 2025 2020
North Wales Y 7.7 55 N 0.0 35 2020 2020
Northern Ireland N 0.0 37 N 0.0 22 Compliant Compliant
1243. The latest projections are a significant improvement from the projections published in
July 2014 which indicated that 28 zones would still exceed the limits in 2020. This
improvement is mainly due to the incorporation in the Pollution Climate Mapping
model of updated information on vehicle emissions factors. This is provided by
COPERT 18, the recommended method for calculating vehicle emissions by the
European Monitoring and Evaluation Programme and the European Environment
Agency Emissions Inventory Guidebook; other Member States use a similar
approach. The most significant changes affecting the projection are a revised
assessment of the performance of both Euro 5 and Euro 6 light duty diesel vehicles
and a significant drop in the expected emissions from Euro VI heavy duty vehicles 19;
early independent evidence has already demonstrated that the newest lorries and
buses are emitting significantly less NOx. There are also other factors such as
changes in fleet composition.
44. The UK has been pushing strongly for action to ensure that emissions testing works
in practice for light duty vehicles. In October 2015, an agreement was reached
between Member States and the European Commission on the implementation of
new procedures for real driving emissions (RDE) tests for cars and vans. The
agreement reached requires manufacturers to ensure new cars and vans meet strict
emissions limits in normal real-world use as well as during the laboratory test. This
will be introduced in a staged approach with the first stage applying to all new model
types in September 2017 and all vehicle registrations in September 2019. This will be
followed by a second stage bringing further reductions that will apply from January
2020.
45. The European Parliament and the Council now have a period of 3 months in which to
object to the agreement after which it is expected to be formally adopted in early
2016.
46. The recent discovery of the use of so-called ‘defeat devices’ places even greater
importance on the introduction of real world driving emissions testing.
47. The current differences between laboratory testing and real world emissions are
unacceptable. We need to be ambitious and bold so that vehicle emissions tests
enable proper control of urban pollution and consumers can be confident with the
published results and information provided to them.
48. The Vehicle Certification Agency (VCA) is already working with vehicle
manufacturers to ensure that this issue is not industry wide. The Government has
announced a UK programme to retest vehicles. The VCA is running laboratory tests
starting with those VW Group vehicles for which it has provided approvals. The UK
has also begun a wider testing programme to understand the real world emissions of
18
COPERT 4v11 Computer Programme to Calculate Emissions from Road Transport:
http://emisia.com/copert
19
Successive emissions standards have been set by the European Commission for certain types of vehicle.
There are separate standards for light vehicles (cars and vans) and heavy vehicles (HGVs, buses etc.). The
standards for light vehicles are indicated with a number e.g. Euro 6, while those for heavy vehicles are
indicated with a roman numeral e.g. Euro VI. The most recent standards are Euro 6 for light-duty vehicles
and Euro VI for heavy-duty vehicles. See: http://ec.europa.eu/growth/sectors/automotive/environment-
protection/emissions/index_en.htm and http://europa.eu/rapid/press-release_MEMO-15-5705_en.htm
13other vehicles on the market, including a sample of the newest and the UK’s top
selling vehicles. These tests will compare real world driving emissions against
laboratory performance. The UK is taking steps to ensure independence; neither the
cars nor the testing facilities will be provided by the vehicle industry themselves. As
COPERT emissions factors include an element of real world testing they take into
account the difference between the emissions standard and real world performance.
49. We want to see, as already agreed, real driving emissions tests implemented as
quickly as possible. Longer term, we want European policy on road transport’s
contribution to air quality and climate change to be more joined up. We see real world
vehicle testing as an essential part of this. The UK Government will continue to press
the Commission for a comprehensive approach to emissions testing to restore
consumer confidence and deliver our wider air quality, and climate change,
objectives.
50. The impact of this agreement on real driving emissions is not included in the baseline
projections set out in Table 3. However, we have taken it into account in certain
scenarios, as part of assessing the impact of additional measures we are introducing,
as set out in Section 4. In general the improved real world performance will provide
additional benefits to the measures the UK is taking to achieve compliance and in
many zones may bring compliance forward.
51. Due to the sensitivity of the modelling to the delivery of real world emissions
improvements from the Euro 6 and upcoming Euro 6d standards, it will be important
to monitor the performance of Euro 6 vehicles as they come to market. This plan has
been developed based on the best available evidence. We will continue to monitor
the emergence of new evidence and any potential impact on these plans.
52. Alongside the baseline projections from our modelling, Table 3 shows the projected
dates for meeting our obligations on NO2. These are based on the measures being
taken in this plan, including the introduction of Clean Air Zones. Additional local
measures, while not quantified in this assessment, are likely to bring these dates
forward more generally across all zones. Earlier delivery will be further supported by
the introduction of RDE.
143. National action to improve air quality
53. Responsibility for meeting air quality limit values in the UK is devolved to the national
administrations in Scotland, Wales and Northern Ireland. The Secretary of State for
Environment, Food and Rural Affairs has responsibility for meeting the limit values in
England and the Department for Environment, Food and Rural Affairs (Defra) co-
ordinates assessment and air quality plans for the UK as a whole.
3.1. England
54. Our projections show that due to the measures already implemented since our 2011
plans, alongside natural vehicle fleet turnover, we will have much reduced
concentrations of NO2 compared to the 2013 baseline and be at or below the limit
values in all but six 20 cities in 2020.
55. The most significant challenge relates to these six cities in England that are projected
to exceed the limit values in 2020. In these cities - London, Birmingham, Leeds,
Nottingham, Derby and Southampton - additional measures will be required to
address the particular issues, and areas, that are causing the exceedance.
56. For the five cities outside London, Government will require the introduction of Clean
Air Zones, as set out below in Sections 3.5 and 3.6, along with additional measures
in Leeds and Birmingham. In London the Mayor has already agreed to introduce a
range of measures including the introduction of the Ultra Low Emission Zone (ULEZ).
3.2. Scotland
57. Four out of six zones and agglomerations in Scotland exceeded the limit values in
2013. Our projections indicate that by 2020, with measures presently in place, all
zones in Scotland should be compliant with NO2 limit levels.
58. In November 2015, The Scottish Government published ‘Cleaner Air for Scotland –
The Road to a Healthier Future’ 21 which sets out in detail how Scotland intends to
deliver further improvements to air quality over the coming years, including full
compliance with Directive requirements in Scotland by 2020.
59. The Cleaner Air for Scotland strategy sets out a national approach to improving air
quality. There are three main areas of the strategy to deliver this national approach:
• the National Modelling Framework (NMF), which promotes a standard
approach to assessing and evaluating air quality. The NMF provides evidence
to support the actions and decision making process around land use and
traffic management to improve local air quality;
20
There are seven air quality zones but the exceedance in the Eastern zone falls within the greater London
area and is addressed by London action
21
http://www.gov.scot/Publications/2015/11/5671
15• the National Low Emission Framework (NLEF) which is designed to enable
local authorities to appraise, justify the business case for, and implement a
range of, air quality improvement options. The NLEF will be supported by the
analysis and evidence from the NMF; and
• communications to convey the health effects of poor air quality.
60. The approach taken in the Cleaner Air For Scotland Strategy is consistent with and
complementary to this UK plan and will support the individual Scottish zone plans.
61. In Scotland, £0.5million of funding is available annually to local authorities to assist
them with air quality monitoring. In addition, £1million is available annually for
supporting action plan measures in Scotland.
3.3. Wales
62. Controlling air pollution in Wales is a high priority for the Welsh Government. The
driver is not only meeting the requirements of European legislation, but a
commitment to protect human health and the environment. The Welsh Government
takes very seriously the fact that our assessment shows four zones and
agglomerations in Wales were in exceedance of the limit values in 2013 and will
continue to work with stakeholders towards further improvement and to develop
additional measures to achieve nationwide compliance in the shortest possible time.
63. The projections show that in 2020 three out of four of the zones will be compliant. In
the South Wales zone a section of road, not more than 500 metres in length, remains
the only location within Wales which is predicted to exceed the limit value beyond
2020.
64. The Welsh Government is committed to achieving compliance for the South Wales
zone in the shortest possible time and at the latest by 2020. Working with
stakeholders, the Welsh Government will look at a range of measures to meet limit
values, including exploring with the local transport authority traffic management,
measures to improve traffic flow, and noting that it is predicted that a targeted bus
improvement scheme would bring this zone into compliance by 2020 at the latest.
Further modelling undertaken for the South Wales zone, (section 4.1.1), indicates
that improvements in vehicle emissions alone, following the agreement for real world
emissions testing, will bring this zone into compliance by 2020.
65. In 2012 the Welsh Government launched a grant scheme for local authority-led
projects to improve air quality, noise and the provision of tranquil urban green space,
with an annual budget of £500,000. This was combined with other funding streams in
2015 to make a single local authority revenue grant for environment and sustainable
development work. Action to improve air quality (over and above statutory duties
under local air quality management) remains a stated purpose of this ongoing Welsh
Government funding stream for local authorities.
66. In 2015, the purposes to which Welsh Government core funding for NGOs and small-
scale project funding for community groups could be put were broadened to include
16action to improve air quality. Prior to 2015, these funding streams could not be used
for air quality work.
67. Reducing the contribution of transport to air pollution and other harmful emissions is
one important objective of the Welsh Government’s Transport Strategy 22. The Welsh
Government published a National Transport Finance Plan in July 2015 setting out
investment priorities for transport focusing on the next five years and beyond.
68. The interventions identified seek to improve air quality by promoting a shift from
private motor vehicle use to active travel and integrated public transport, and
supporting highway schemes designed to reduce traffic congestion. Key transport
investments and proposals that will have a positive impact on air quality include:
• taking forward the Cardiff Capital Region Metro project – an integrated public
and active travel system for South Wales focused on joining up and improving
rail infrastructure, rail stations, park and ride schemes, bus routes and walking
and cycling schemes;
• intelligent transport systems and other innovative technical solutions to reduce
congestion on our strategic road network;
• continuing to support the shift of freight from road transport through grant
support schemes;
• reflecting the introduction of the Active Travel (Wales) Act, directing funding at
a local level for walking and cycling infrastructure and delivering travel routes
in the urban nodes of Cardiff, Newport, Merthyr and Bridgend;
• improvements to the trunk road network designed to reduce congestion such
as relief roads and bypasses;
• continuing to invest in the Bus Service Operators Grant and looking to include
broader outcomes, including bus priority routes and reducing emissions;
• working with local authorities and bus operators to identify and resolve
congestion and pinch points on the network that affect bus reliability, with a
view to developing a package of bus priority measures along key strategic
corridors; and
• railway improvements, including electrification of the Great Western Mainline
and improvements to the Valleys Line in South Wales.
3.4. Northern Ireland
69. Of the two zones and agglomerations in Northern Ireland only the Belfast
Metropolitan Urban Area exceeded the limit values in 2013. Our projections show
that this zone should be compliant by 2020 as a consequence of measures currently
in place. The Department of the Environment for Northern Ireland intends to start a
22
http://gov.wales/topics/transport/planning-strategies/?lang=en .
17comprehensive review of Northern Ireland’s clean air and air quality policy and
legislation in 2016. The review will take account of ongoing research into pollution
from residential emissions, as well as current problems with air pollution resulting
from road transport emissions. The Department will work with local authorities in
Northern Ireland to review the Local Air Quality Management regime, so that funding
support is shifted away from monitoring and onto specific outcome-based measures
which will improve air quality in problem areas.
70. Northern Ireland remains committed to the principle of sustainable development and
improved air quality through the setting and implementation of new national policies
which guide local planning including development plans and infrastructure
investments. The Regional Development Strategy for Northern Ireland 2035
provides a spatial development framework and aims to reduce carbon emissions and
enable adaptation to the effects of climate change, while improving air quality. A
New Approach to Regional Transportation Strategy 2012 – A Sustainable Transport
Future includes the high level aim: “To reduce the environmental impact of
Transport.”
71. Transport plans and local development plans are now being developed in line with
the new national policies highlighted above. In the interim, a number of initiatives are
already in place that will reduce private car use and tail-pipe emissions, including:
• the Active Travel Strategy for Northern Ireland 2011–20 which is aimed at
increasing walking and cycling and includes four demonstration projects in
regional towns and cities;
• the development of the Northern Ireland Strategic Transport Model – a
forecast model to test the change in travel behaviour likely to arise from
possible changes in land use (new development), transport policy (e.g. public
transport fares) or new infrastructure (e.g. increased road capacity or more
frequent rail services);
• the Active School Travel Programme 2013–16 which is focused on long term
behavioural change to reduce car dependency and increase use of active
travel modes;
• E-car charging infrastructure. This project has installed over 350 charging
points across Northern Ireland and provided grants for home charging
equipment to encourage the purchase and use of electric vehicles with zero
tail-pipe emissions; and
• the Bicycle Strategy 2015–40 was published in August 2015, and will be
followed by a Delivery Plan including capital schemes.
• provision of around 2,000 additional park and ride spaces over the last 2 years
at strategic locations across Northern Ireland to encourage use of public
transport for onward travel to congested urban centres.
72. There are a number of relevant major infrastructure schemes that are planned for
delivery during the 2016-2020 period, including:
18• Belfast Rapid Transit – an urban public transport system with two primary
arterial routes forecast to result in a significant shift from private car use;
• Railway track improvements between Coleraine and Derry – to facilitate
further growth in rail passenger numbers and transfer from private cars;
• York Street Interchange Belfast - providing full grade separation of the three
roads with the highest volume traffic in Northern Ireland and removing traffic
queues that contribute to poor local air quality; and
• Belfast Transport Hub – a flagship project to develop and construct a new
modern public transport facility integrating rail and coach services with new
commercial developments and car-parking, to provide public transport access
to the city centre.
3.5. Clean Air Zones
73. Clean air is essential for making sure our cities are welcoming places for people to
live and work, now and in the future. To realise our ambition for the UK to have some
of the very best air quality in the world we must start with some of the most difficult
challenges in our cities. Clean Air Zones are designed to help deliver this ambition.
74. Clean Air Zones are areas where only the cleanest vehicles are encouraged (through
the use of vehicle emission standards) and action is focussed to improve air quality.
They are geographically defined areas allowing action and resources to be targeted
to deliver the greatest health benefits.
75. Clean Air Zones are grouped into classes covering different vehicle types as set out
in Table 4 below.
Table 4: Clean Air Zone Classes
Clean Air Zone class Vehicles included
A Buses, coaches and taxis 23
B Buses, coaches, taxis and heavy goods vehicles
(HGVs)
C Buses, coaches, taxis, HGVs and light goods
vehicles (LGVs)
D Buses, coaches, taxis, HGVs, LGVs and cars
23
Taxis will generally also include private hire vehicles
1976. Vehicle owners will be required to pay a charge if they enter a Clean Air Zone which
has a standard for their type of vehicle and it does not meet that standard. In this
plan, no cities will be required to charge cars to enter a Clean Air Zone.
77. Clean Air Zones will be clearly signposted on access routes in a similar way to the
current low emission zone in London. Any cities with Clean Air Zones other than
Class A are likely to use cameras 24 to ensure that those vehicle owners that are
required to pay a charge do so.
78. In England Government will legislate to require the implementation of Clean Air
Zones in five cities (Birmingham, Leeds, Nottingham, Southampton and Derby) as
set out in Section 3.6 below. London already has plans in place to bring in their Ultra
Low Emission Zone (broadly equivalent to a Class D Clean Air Zone) in 2020. Other
local authorities can also adopt Clean Air Zones as a way to focus their action to
improve air quality.
79. A number of authorities are already considering action to restrict polluting vehicles
from city centres and several have already implemented schemes for buses.
However, as industry and local authorities have made clear, different approaches in
different cities can make it difficult for businesses and individuals that travel across a
number of cities to make straightforward, economic and operational decisions about
the vehicles they buy.
80. To address this uncertainty the Government will set out a clear Framework for Clean
Air Zones which will include the important principles that need to be consistent from
city to city, for example which vehicle standards to apply, to ensure Clean Air Zones
are implemented in the same way by local authorities across England.
81. Setting out the principles in this way will support both those authorities required by
Government to implement a Clean Air Zone and those who, after analysing their own
situation, consider a Clean Air Zone to be an appropriate measure to bring in. Those
authorities that have already implemented schemes which restrict polluting vehicles
could transition these into a Clean Air Zone using the same principles. Any local
authority choosing to implement a Clean Air Zone will normally decide which class of
zone is appropriate for their situation and the type of vehicles which will be subject to
control, based on their understanding of local conditions, underpinned by national
and local modelling and monitoring.
82. As a consistent network of Clean Air Zones develops across the country, businesses
and individuals will be able to purchase vehicles which they can be confident will be
able to enter any Clean Air Zone without charge.
83. In 2016 we will consult on the detail of the proposal for Clean Air Zones and set out
the approach through which we will impose duties on the five cities (Birmingham,
Leeds, Nottingham, Derby and Southampton) to deliver them. We will also publish a
full impact assessment. We will work closely with local authorities and other
24
Class A Clean Air Zones will be enforced through licencing and operating restrictions on buses and taxis
or similar measures
20You can also read