Retail Market Analysis - Downtown & Grand River Avenue City of Brighton, Michigan
←
→
Page content transcription
If your browser does not render page correctly, please read the page content below
Downtown & Grand River Avenue
Retail Market Analysis
                      City of Brighton, Michigan

                                       Prepared For:
City of Brighton Downtown Development Authority
                                        Prepared By:
                          Gibbs Planning Group

                                  03 June 2021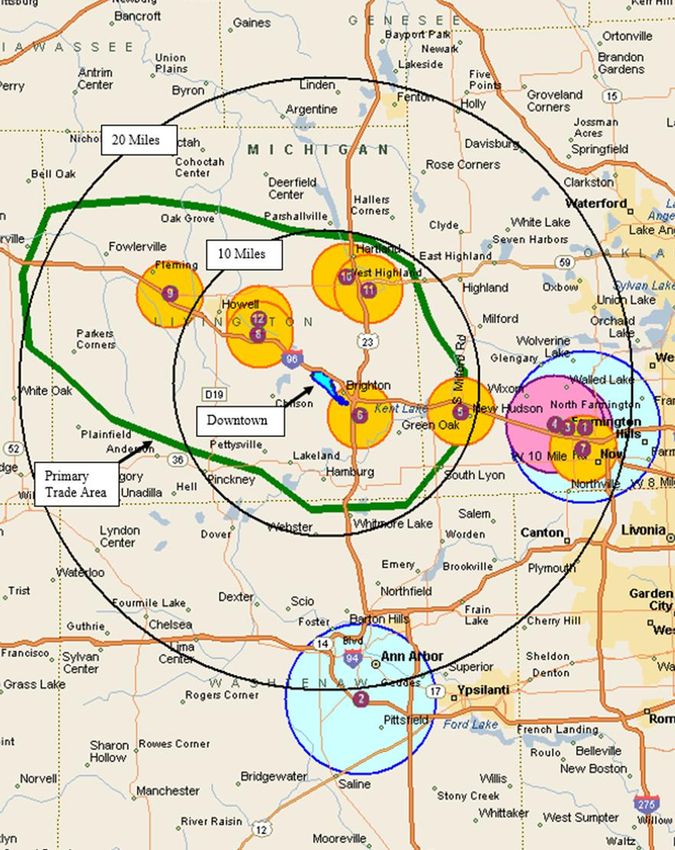
Blank Page
TABLE OF CONTENTS

INTRODUCTION ...............................................................................................................                 1
Executive Summary .............................................................................................................              1
Background ..........................................................................................................................        3
Methodology ........................................................................................................................         4

PRIMARY TRADE AREA .................................................................................................                         5

LIFESTYLE TAPESTRY DEMOGRAPHICS ...................................................................                                          7

EMPLOYMENT BASE ....................................................................................................... 12

DOWNTOWN BRIGHTON AREA CHARACTERISTICS ..............................................                                                       15
Location ...............................................................................................................................    15
Access ..................................................................................................................................   15
General Retail Market Conditions .......................................................................................                    16
New Residential Development ............................................................................................                    16
City of Brighton Streetscape Plan ........................................................................................                  17
Downtown Brighton Shopping Centers ...............................................................................                          19

COMPETING SHOPPING CENTERS ............................................................................... 21

ANALYSIS ASSUMPTIONS .............................................................................................. 27

RETAIL AND RESTAURANT DEMAND ......................................................................... 27
Supportable Retail Table....................................................................................................... 28

RATIONALE........................................................................................................................ 38

DEFINITIONS ...................................................................................................................... 38
Retail Category Definitions .................................................................................................. 38
Shopping Center Definitions................................................................................................. 41

LIMITS OF STUDY ............................................................................................................. 42

APPENDIX ...........................................................................................................................        45
Exhibit A: Primary Trade Area Business Summary .............................................................                                45
Exhibit B: Primary Trade Area Community Profile .............................................................                               47
Exhibit C: Primary Trade Area Housing Profile ..................................................................                            54
Exhibit D: Primary Trade Area Dominant Tapestry Descriptions ........................................                                       56
Blank Page
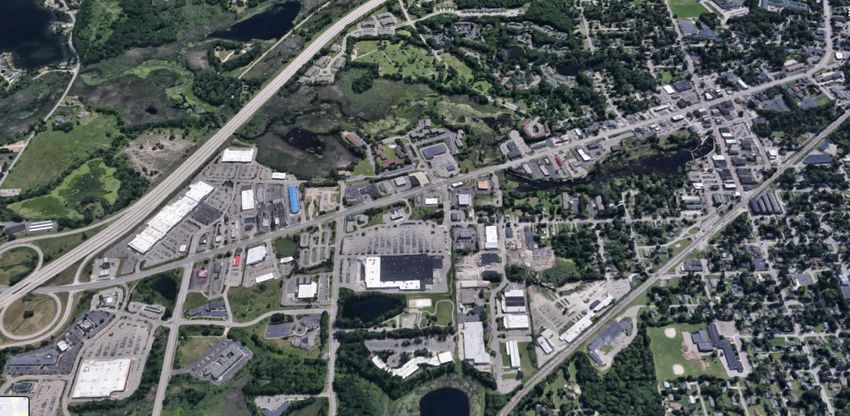
INTRODUCTION

Figure 1: The City of Brighton’s DDA area includes a broad range of commercial and residential development
clusters located along the Grand River Avenue corridor and the downtown Main Street (View looking east).

Executive Summary
This study analyzes the retail market potential for the Brighton DDA study area (“downtown
Brighton”). Downtown Brighton offers an attractive, walkable and historic downtown that is
unique to Livingston County and the western Oakland County region. The downtown’s stores
and restaurants greatly benefit from its prime location near the intersection of two major
highways and being at the crossroads of Oakland, Livingston and Washtenaw counties. Several
residential developments in the area are nearing completion, and as a result over 1,500 upscale
young professionals and empty nesters will soon be moving into 750 new multi-family dwellings
in the heart of downtown. The infusion of these new residents, as well as the downtown’s new
streetscape plan, will help make downtown Brighton an even more competitive shopping and
dining destination

Downtown Brighton’s existing retail and restaurant variety, building stock, public realm, parking
and management is meeting or exceeding the shopping and dining expectations of approximately
60 percent of its trade area’s households. Under existing conditions, downtown Brighton’s
retailers and restaurants can capture up to $16.8 million annually in additional sales, potentially
increasing to up to $17.6 million in new annual sales by 2026. If achieved, this growth could
support 35,000 square feet (sf) of new retailers and 15,000 sf of new restaurants, for a total of
50,000 sf. This growth could be absorbed with the opening of 15 to 19 new businesses or by
existing stores and restaurants through expanded operations.

Downtown Brighton Retail Market Study                                                                        1.
Gibbs Planning Group, Inc.
03 June 2021
Additionally, the existing larger shopping centers situated along Grand River Avenue will
represent future opportunities for redevelopment in the event they become aged or close as a
result of the post-pandemic shift to on-line shopping. With progressive form-based codes and
modern zoning, these older commercial properties can be repurposed into walkable mixed-use
villages or employment centers that could attract more residents and corporations seeking to
relocate their regional headquarters to rural, emerging areas near walkable downtowns.
Figure 2: Under existing conditions, downtown Brighton’s customer base comprises of roughly 60 percent of trade
area households.
▪ Market Potential – Best Practices
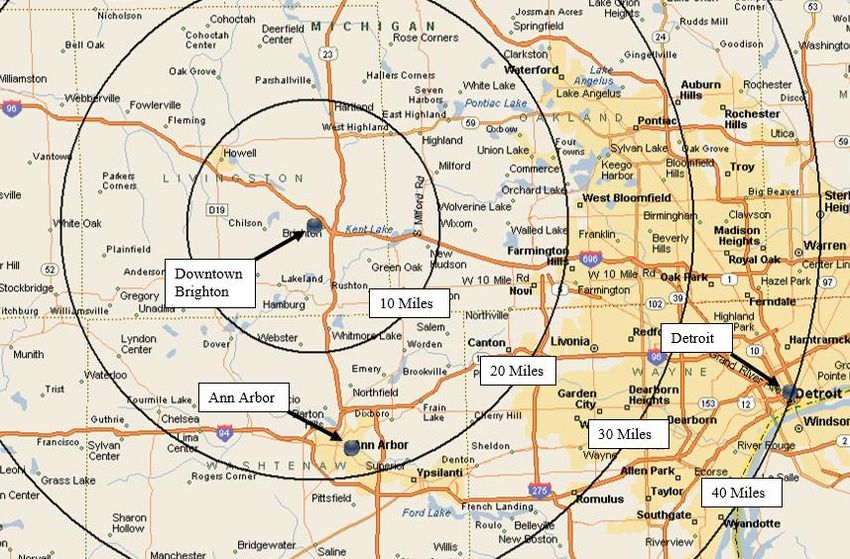
This study has found an opportunity for downtown Brighton to widen its appeal to over 27,000
additional moderate to high income/wealth households that seek designer brands, upscale
merchandise and healthy, upscale dining. Currently, these families are regularly traveling to Ann
Arbor, Birmingham, Chelsea, Fenton, the Twelve Oaks Mall, Somerset Mall, Royal Oak and in
some cases Detroit for many of their shopping and dining experiences. These destinations are
inconvenient and 20 to 40 miles from downtown Brighton
Downtown Brighton retailers and restaurants can capture more of this affluent group’s spending
by upgrading their businesses to meet the quality and maintenance standards that this group is
accustomed to in their homes, neighborhoods, work environments, vacation destinations and in
some cases, their country clubs. To achieve this, stores and restaurants must update their
fixturing, furnishings, hours and brands to meet the industry’s best practices. Additionally, the
City of Brighton’s marketing, management, parking, wayfinding, streetscape and general public
realm will require some modifications and investment to meet the expectations of these roughly
27,000 households and out of town visitors.
2. Downtown Brighton Retail Market Study
Gibbs Planning Group, Inc.
02 June 2021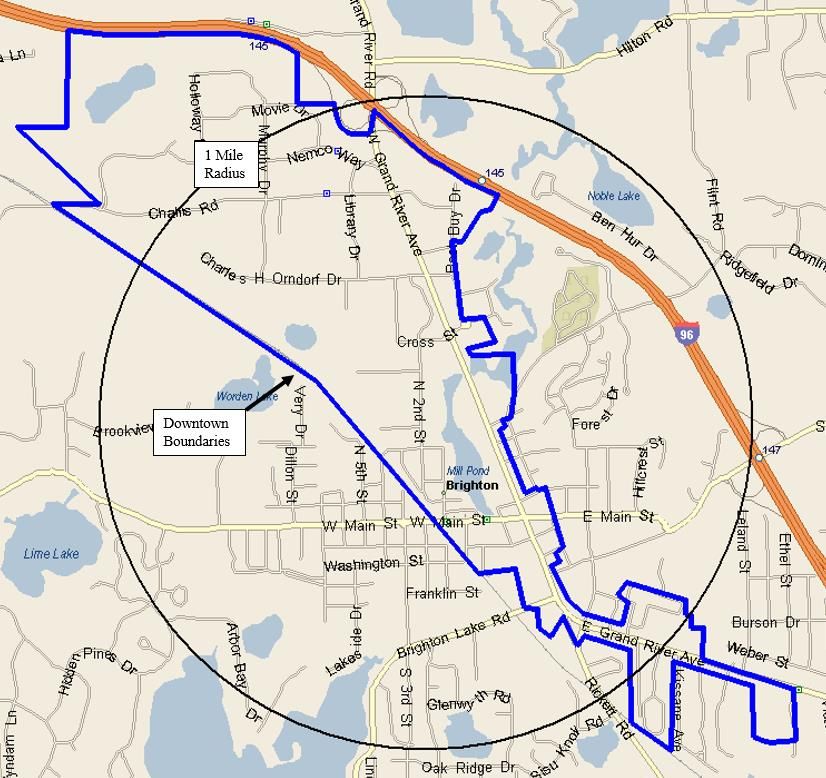
This study also finds that if industry best practices are implemented, then as much as $48.2
million in new annual sales could be captured by downtown Brighton retailers and restaurants by
2026. This demand could support up to 100,000 square feet (sf) of new retailers and 20,000 sf of
new restaurants. This growth could be absorbed with the opening of 25 – 40 new businesses or
by existing stores and restaurants through expanded operations and marketing. The 120,000 sf of
additional supportable retail and restaurant space represents a 6.7 percent increase in the
downtown’s existing 1.8 million sf of first floor commercial area. Furthermore, it is equivalent to
55 percent of the existing 220,000 sf of commercial space along West Main Street in downtown.
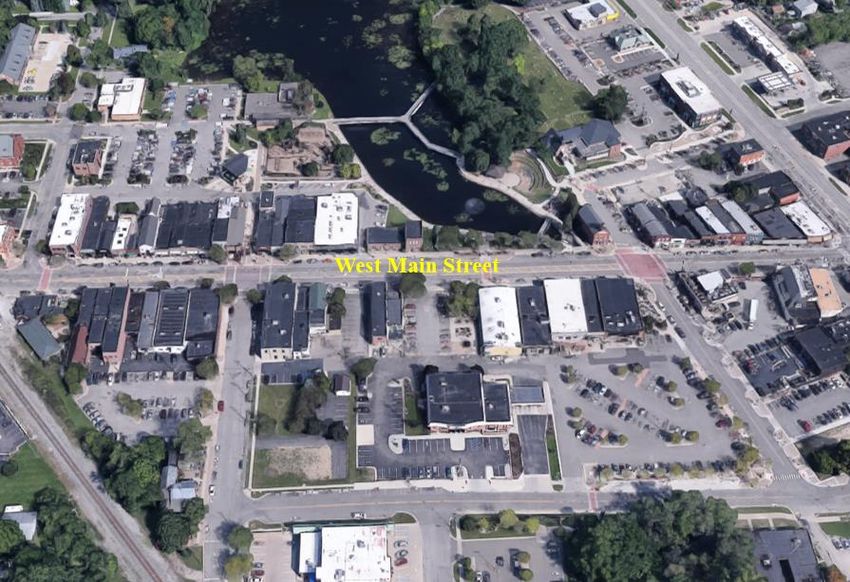
Figure 3: Birdseye view looking west of West Main Street in downtown Brighton.
Background
Gibbs Planning Group, Inc. (GPG) has been retained by the Brighton Downtown Development
Authority (DDA) to conduct a retail feasibility analysis to determine how much additional retail
and restaurant development (if any) is supportable within the downtown Brighton area.
GPG addressed the following issues in this study:
• What is the existing and planned retail market for downtown Brighton and surrounding
areas?
• What are the potential trade areas for downtown Brighton?
• What are the population, demographic and lifestyle characteristics of downtown
Brighton’s primary trade area currently and projected for 2026?
• What is the current and projected growth for retail expenditures in the area, now and in
2026?
Downtown Brighton Retail Market Study 3.
Gibbs Planning Group, Inc.
02 June 2021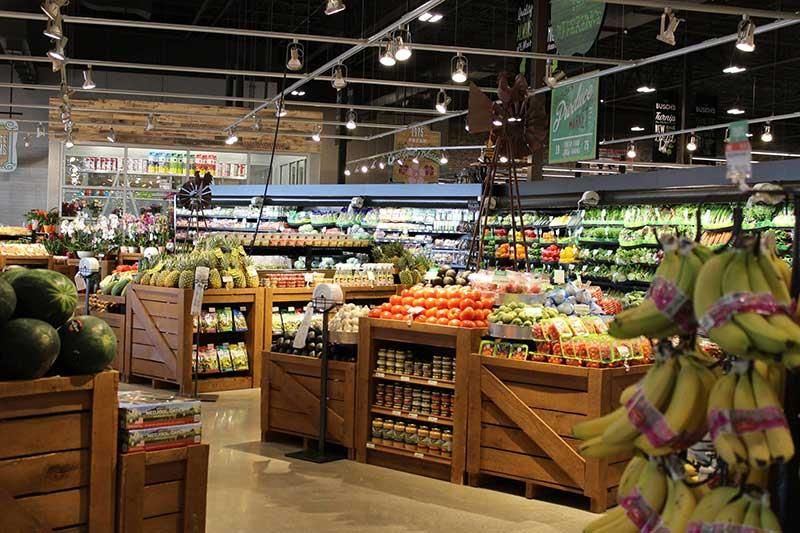
•   How much additional retail square footage is supportable in downtown Brighton and
         what retailers may seek to deploy a new business there?
     •   What retail sales volumes can potentially be achieved in downtown Brighton by these
         new businesses?

Methodology
To address the above issues, GPG defined a trade area that would likely serve the existing and
new retail development in downtown Brighton based on geographic and topographic
considerations, traffic access/flow in the area, relative retail strengths, concentrations of daytime
employment and the retail gravitation in the market, as well as our experience defining trade areas
for similar markets. Population, consumer expenditure and demographic characteristics of trade
area residents were collected by census tracts from the U.S. Bureau of the Census, U.S. Bureau of
Labor Statistics and Environmental Systems Research Institute (ESRI).

Figure 4: Downtown Brighton is in southeast Michigan, approximately 18 miles north of Ann Arbor and 40 miles
northwest of Detroit.

Finally, based on the projected consumer expenditure capture (demand) in the primary trade area
of the gross consumer expenditure by retail category, less the current existing retail sales (supply)
by retail category, GPG projects the potential net consumer expenditure (gap) available to support
existing and new commercial development. The projected net consumer expenditure capture is
based on household expenditure and demographic characteristics of the trade area, existing and
planned retail competition, traffic and retail gravitational patterns and GPG’s qualitative
assessment of downtown Brighton.

4.                                                                          Downtown Brighton Retail Market Study
                                                                                      Gibbs Planning Group, Inc.
                                                                                                    02 June 2021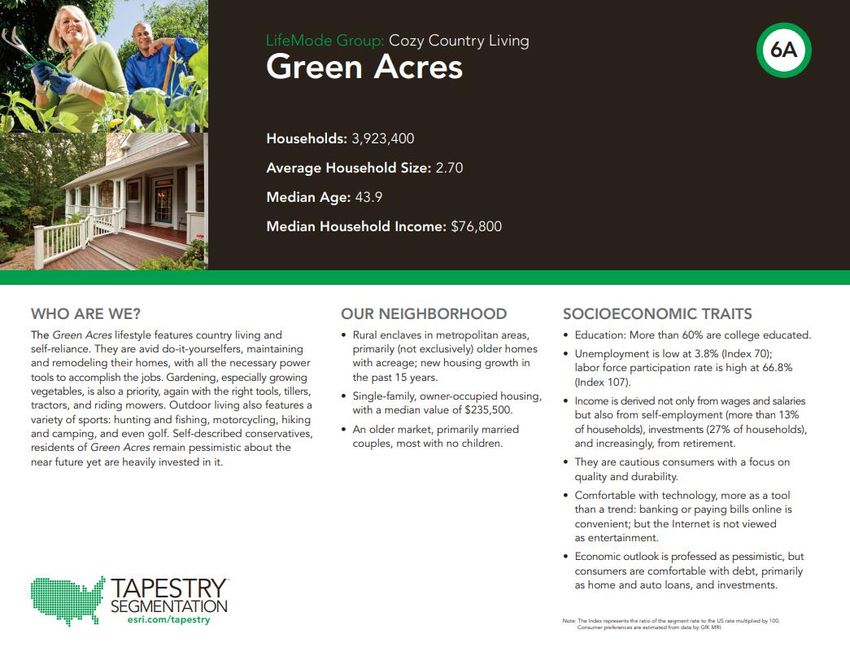
Net potential captured consumer expenditure (gap) is equated to potential retail development
square footage, with the help of retail sales per square foot data provided by Dollars and Cents of
Shopping Centers (Urban Land Institute and International Council of Shopping Centers),
qualitatively adjusted to fit the urbanism and demographics of the study area.

Figure 5: Map illustrating the geographic boundaries of downtown Brighton.

PRIMARY TRADE AREA
This study estimates a primary trade area for downtown Brighton based on GPG’s analysis of
existing commercial centers, population clusters, employment, visitors, highway access and the
retail gravitation in the market. Using data from ESRI and the U.S. Census Bureau, GPG obtained
the most recent population and demographic characteristics (2021) and those projected for 2026
for the primary trade area, 5-mile radius surrounding the middle of downtown, City of Brighton,
Livingston County and the State of Michigan.

Downtown Brighton Retail Market Study                                                            5.
Gibbs Planning Group, Inc.
02 June 2021
The primary trade area is the consumer market where the downtown has a significant competitive
advantage because of access, design, lack of quality competition and traffic and commute patterns.
Downtown Brighton’s primary retail trade area includes 178,300 year-round residents and covers
roughly 415 square miles of area. By 2026, the primary trade area’s population is estimated to
grow by 7,700 people, or 0.85 percent annually. This growth rate is higher than that for the 5-mile
radius surrounding the center of downtown, City of Brighton and State of Michigan. Over the next
five years, the number of households in the primary trade area will increase from 68,000 to 71,300
and will include an average of 2.60 people per household.

Figure 6: Downtown Brighton’s estimated primary trade area is shown above inside the green line and the 15-minute
drive time inside the red line

The median household income in downtown Brighton’s primary trade area is $83,400 and is
expected to increase to $88,700 by 2026. Its average household income is $106,700, and over 55
percent of households earn over $75,000 per year – higher than that for the City of Brighton and
State of Michigan, but lower than for the 5-mile radius surrounding the center of downtown and
Livingston County. Over 38 percent of the trade area’s residents over the age of 25 have earned a
bachelor’s degree or higher, which is a higher graduation rate than for the county and state.
Residents living in the primary trade area have a median age of 42.5, which is 1.9 years older than
the median age of the state.
Approximately 93.3 percent of the primary trade area homes are occupied, and the median home
value is estimated to be $246,700. Of all the primary trade area’s housing units, 79.7 percent are
owner-occupied, a number that has increased 1.8 percent since 2010 and is expected to remain

 6.                                                                          Downtown Brighton Retail Market Study
                                                                                       Gibbs Planning Group, Inc.
                                                                                                     02 June 2021
constant through 2026. Renter-occupied households have decreased from 14.9 percent in 2010 to
13.7 percent in 2020 and are expected to remain constant through 2026.
The primary trade area’s current residential vacancy rate is 6.7 percent, a number that has
decreased 0.5 percent since 2010 and is projected to remain constant through 2026. The percentage
of housing units valued at over $250,000 is expected to increase from 48.7 percent to 55.7 percent
– coinciding with an increase in the median home value to $265,600 by 2026.
The following borders approximately delineate downtown Brighton’s primary trade area (See
Figure 6):
▪ North – Chase Lake Road, Hazard Road & Clyde Road
▪ South – Whitmore Lake, Bass Lake, Putnam Lake & Wasson Road
▪ East – Durham Lake, Camp Dearborn & Milford Road
▪ West – Searls Road & Herrington Road North
Figure 7: Downtown Brighton Demographic Comparisons
Primary 5-Mile City of Livingston State of
Demographic Characteristics
Trade Area Radius Brighton County Michigan
2021 Population 178,300 54,000 8,100 195,700 10,115,000
2026 Population 186,000 56,000 8,800 203,800 10,238,500
2021-26 Projected Annual Growth
0.85% 0.75% 1.55% 0.81% 0.24%
Rate
2021 Households 68,000 21,100 4,000 73,900 4,002,100
2026 Households 71,300 22,100 4,400 77,400 4,063,000
2021-2026 Projected Annual HH
0.94% 0.90% 1.83% 0.91% 0.30%
Growth Rate
Persons Per Household 2021 2.60 2.54 1.99 2.63 2.47
Median Age 42.5 45.8 46.0 43.2 40.6
2021 Median Household Income $83,400 $92,700 $66,500 $83,800 $57,100
2021 Average Household Income $106,700 $121,300 $87,400 $106,300 $79,800
2026 Median Household Income $88,700 $97,100 $69,500 $88,900 $61,200
2026 Average Household Income $117,200 $131,800 $91,200 $116,400 $88,400
% Households w. incomes $75,000+ 56.3% 61.7% 45.7% 56.9% 38.5%
% Bachelor’s Degree or higher 38.4% 46.5% 42.5% 36.5% 30.1%
Figure 7: This side-by-side table compares the primary trade area demographic statistics with those of the 5-mile radius
surrounding the middle of downtown Brighton, City of Brighton, Livingston County and the State of Michigan.
LIFESTYLE TAPESTRY DEMOGRAPHICS
As a part of this analysis, GPG has purchased third-party demographic research prepared by ESRI.
The ESRI data includes tapestry lifestyles, which creates 65 classifications, or lifestyle segments,
that help determine purchasing patterns. These segments are broken down to the U.S. Census
Block Group level and used by many national retailers to help determine future potential locations.
The most prevalent ESRI lifestyle groups in downtown Brighton’s primary trade area are Green
Acres, Soccer Moms, Savvy Suburbanites, Middleburg and Rustbelt Traditions. With the
Downtown Brighton Retail Market Study 7.
Gibbs Planning Group, Inc.
02 June 2021implementation of best practices, downtown Brighton will become more appealing to the rather
affluent Soccer Moms and Savvy Suburbanites lifestyle groups.
Green Acres: The primary trade area’s most prominent lifestyle group is “Green Acres,” which
represent 26.1 percent of primary trade area households. This is an older market, primarily
composed of married couples without children. Green Acres residents are found in rural enclaves
in metropolitan areas. They live in single-family, owner-occupied homes that tend to have
substantial acreage. The median home value for Green Acres homes is $235,500.
More than 60 percent of Green Acres residents are college educated. Their unemployment rate is
low at 3.8 percent and labor force participation rate is high at 66.8 percent. Both their median
household income ($76,800) and median net worth ($267,700) are higher than the national figures.
Their income is derived not only from wages and salaries but also from self-employment (more
than 13 percent of households), investments (27 percent of households) and retirement.
Figure 8: The relative proportions of the Tapestry Lifestyle groups found in the primary trade area.
Green Acres are cautious consumers who focus on quality and durability. Their purchasing
choices reflect their country life, including a variety of vehicles from trucks and SUVs to ATVs
and motorcycles (preferably late models). Although they have a rather pessimistic economic
outlook, as consumers Green Acres are comfortable with debt, primarily as home and auto loans.
8. Downtown Brighton Retail Market Study
Gibbs Planning Group, Inc.
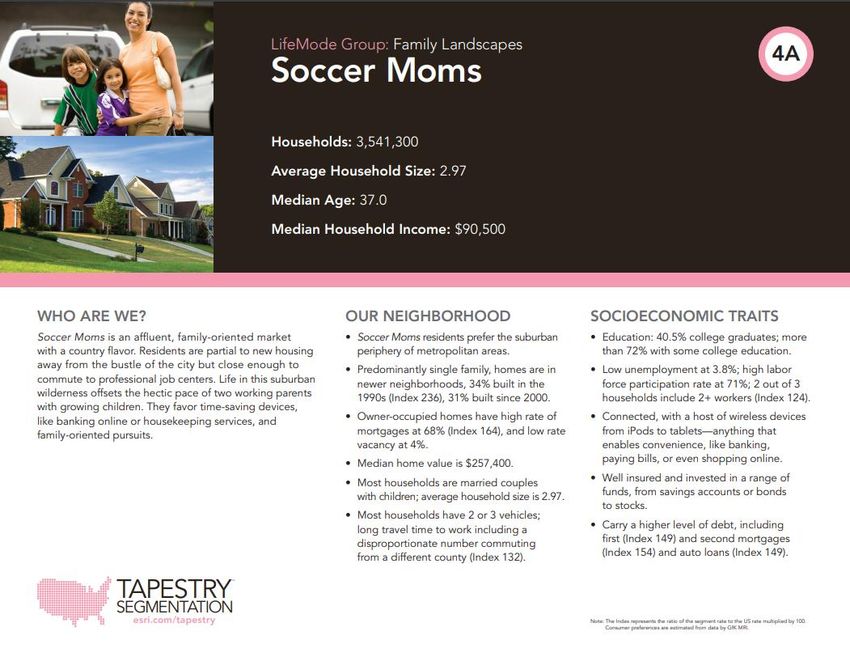
02 June 2021Soccer Moms: Roughly 14.8 percent (or 10,000) of primary trade area households are classified as Soccer Moms. These residents primarily live in single-family homes in newer neighborhoods. As their name implies, Soccer Moms households are composed of married couples with children. Most of these households also have 2 or 3 vehicles, as long travel times to work are common. In terms of education, 40.5 percent are college graduates and more than 72 percent have some college education. Soccer Moms have a high labor participation rate (71 percent) and 2 out of 3 of these households include 2+ workers. Family-oriented purchases and activities dominate their spending, like 4+ televisions, movie purchases, children’s apparel and toys, and visits to theme parks or zoos. While home maintenance services are frequently contracted, these families also like their gardens and own the tools for minor upkeep, like lawn mowers, trimmers and blowers. Figure 8: Map showing the median incomes around downtown Brighton. Census blocks colored in dark green have median incomes above $100,000 a year. Downtown Brighton retailers and restaurants will be able to attract more consumers from these higher income areas if best practices are implemented. Savvy Suburbanites: Approximately 13.1 percent (or 2,800) of primary trade area households are defined as Savvy Suburbanites. These residents are married couples with no children or older children. They live in established neighborhoods (most built between 1970 and 1990) in the suburban periphery of large metropolitan markets. Ninety-one percent live in single-family owner-occupied homes, with a median value of $362,900. Downtown Brighton Retail Market Study 9. Gibbs Planning Group, Inc. 02 June 2021
Savvy Suburbanites are well educated, as 51 percent are college graduates and 77.6 have some
college education. These residents have a median household income of $108,700 and median net
worth of $518,100, both significantly above the national average. They have a low unemployment
rate of 3.5 percent and above average labor force participation rate of 67.9 percent. Savvy
Suburbanites are informed shoppers that do their research prior to purchasing, and they make
liberal use of technology for everything from shopping and banking to staying current and
communicating. Their suburban lifestyle includes home remodeling and gardening plus the active
pursuit of sports and exercise.
Middleburg: Approximately 6.9 percent (or 4,700) of primary trade area households are defined
as Middleburg. These households, which consist of young families, are located in semirural
locales within metropolitan areas. Their neighborhoods have changed rapidly in the previous
decade with the addition of new single-family homes. In terms of education, 65 percent of these
residents have a high school diploma or some college education. Both their median household
income ($59,800) and median net worth ($115,300) are above national figures. The
unemployment rate for this group is below average at 4.7 percent and their labor force
participation rate (at 66.7 percent) is typical for a younger population.
Middleburg residents have traditional values and prefer to buy American and for a good price.
Their favorite sports include hunting, fishing, bowling and baseball. They are partial to domestic
vehicles; they like to drive trucks, SUVs or motorcycles. Their preferred entertainment is
primarily family-oriented (such as TV, theme parks or family restaurants) or home DIY projects.
These consumers are comfortable with technology for convenience and entertainment.
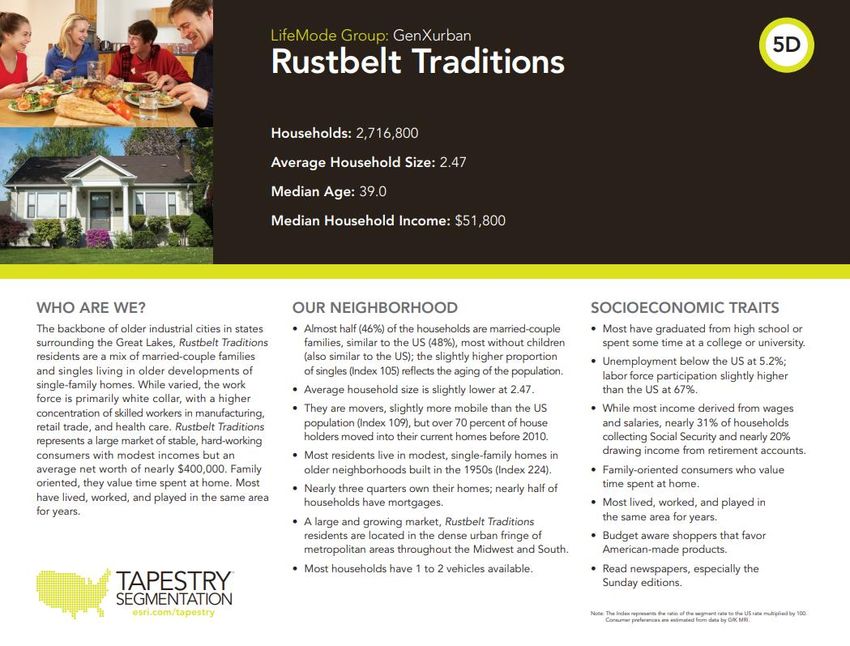
Rustbelt Traditions: Nearly 3.7 percent (or 2,500) of primary trade area households are classified
as Rustbelt Traditions. A large and growing market, Rustbelt Traditions resident are located I the
dense urban fringe of metropolitan areas throughout the Midwest and South. Most of them live in
modest, single-family homes (which they own) in older neighborhoods built in the 1950s. While
most Rustbelt Traditions households derive their income from wages and salaries, nearly 31
percent of their households collect Social Security and nearly 20 percent are drawing income from
retirement accounts. This group has a median household income of $51,800 and median net worth
of $98,100. The occupations with the highest number of workers in this market are office and
administrative support, sales and related and production.
Rustbelt Traditions residents are family-oriented consumers who value time spent at home. Most
of them have lived, worked and played in the same area for years. They are also budget aware
shoppers that favor American-made products. Their favorite family restaurants include
Applebee’s, Arby’s and Texas Roadhouse, and they take advantage of convenience stores for
fueling up and picking up incidentals.
Figure 9: Downtown Brighton Primary Trade Area Tapestry Lifestyles
10. Downtown Brighton Retail Market Study
Gibbs Planning Group, Inc.
02 June 2021Downtown Brighton
Lifestyle Group Primary Trade Area Lifestyle Summary
Statistics
Households The Green Acres lifestyle features country living
17,800 and self-reliance. They are avid do-it-yourselfers,
maintaining and remodeling their homes, with all
Population the necessary power tools to accomplish the jobs.
38,000 Gardening, especially growing vegetables, is also a
priority, again with the right tools, tillers, tractors,
Median HH Income and riding mowers.
$76,800
Outdoor living also features a variety of sports:
Household Percentage
hunting and fishing, motorcycling, hiking and
camping, and even golf. Self-described
26.1 % conservatives, residents of Green Acres remain
pessimistic about the near future yet are heavily
Green Acres US Market Share invested in it.
3.2 %
Households Soccer Moms is an affluent, family-oriented market
10,000 with a country flavor. Residents are partial to new
housing away from the bustle of the city but close
Population enough to commute to professional job centers. Life
21,800 in this suburban wilderness offsets the hectic pace
of two working parents with growing children. They
Median HH Income favor time-saving devices, like banking online or
$90,500 housekeeping services, and family-oriented
pursuits.
Household Percentage
14.8 % This group is well insured and invested in a range of
Soccer Moms funds, from savings accounts or bonds to stocks.
US Market Share Soccer Moms also carry a high level of debt,
including first and second mortgages and auto
3.0 %
loans.
Households Savvy Suburbanites residents are well educated,
8,900 well read, and well capitalized. Families include
empty nesters and empty nester wannabes, who still
Population have adult children at home.
19,900
Located in older neighborhoods outside the urban
Median HH Income core, their suburban lifestyle includes home
$108,700 remodeling and gardening plus the active pursuit of
sports and exercise. They enjoy good food and
Household Percentage wine, plus the amenities of the city’s cultural
events.
13.1 %
US Market Share
Savvy Suburbanites 3.0 %
Downtown Brighton Retail Market Study 11.
Gibbs Planning Group, Inc.
02 June 2021Downtown Brighton
Lifestyle Group Primary Trade Area Lifestyle Summary
Statistics
Households Middleburg neighborhoods transformed from the
4,700 easy pace of country living to semirural
subdivisions in the last decade, when the housing
Population boom reached out. Residents are conservative,
9,500 family-oriented consumers. Still more country than
rock and roll, they are thrifty but willing to carry
Median HH Income some debt and are already investing in their futures.
$59,800
They rely on their smartphones and mobile devices
Household Percentage to stay in touch and pride themselves on their
expertise. They prefer to buy American and travel
6.9 %
in the US. This market is younger but growing in
size and assets.
Middleburg US Market Share
2.9 %
Households The backbone of older industrial cities in states
2,500 surrounding the Great Lakes, Rustbelt Traditions
residents are a mix of married-couple families and
Population singles living in older developments of single-
4,700 family homes. While varied, the work force is
primarily white collar, with a higher concentration
Median HH Income of skilled workers in manufacturing, retail trade,
$51,800 and health care.
Household Percentage Rustbelt Traditions represents a large market of
3.7 % stable, hard-working consumers with modest
incomes but an average net worth of nearly
US Market Share $400,000. Family oriented, they value time spent at
Rustbelt Traditions home. Most have lived, worked, and played in the
2.2 %
same area for years.
Figure 9: The top five Tapestry Lifestyle groups profiled above portray an eclectic population living a suburban
lifestyle.
EMPLOYMENT BASE
The employment picture found in downtown Brighton’s primary trade area reflects a concentrated
services and retail sector foundation, comprising 60.1 percent of total employment. Compared to
the City of Brighton and Livingston County, the concentration of construction and government
workers in the primary trade area is high and finance, insurance and real estate (FIRE) workers is
low. As shown in Figure 10, the services sector employs the single largest percentage (36.7
percent) of people in downtown Brighton’s primary trade area. Within the primary trade area’s
services sector, the largest percentage (15.3 percent of total employment in the primary trade area)
work in other services, followed by 8.3 percent in health services and 6.5 percent in educational
institutions & libraries.
12. Downtown Brighton Retail Market Study
Gibbs Planning Group, Inc.
02 June 2021As the second leading category of employment, retail workers account for 23.4 percent of
employment within the primary trade area. Within this category, eating and drinking places is the
leading subcategory of employment comprising 9.0 percent of total employment, followed by
miscellaneous retail (3.6 percent) and food stores (3.0 percent). However, the fact that retail is the
second largest employment sector in the primary trade area does not necessarily mean that there is
an oversupply of retail in the area; the size and scale of retailers may require a certain number of
workers, but this is not indicative of how well these retailers are supplying goods and services to
the surrounding community.
Figure 10: Employment Comparison by Sector (SIC)
Primary Trade City of Livingston State of
Employment Sector
Area Brighton County Michigan
Agriculture and Mining 1.8% 0.6% 1.9% 1.4%
Construction 5.4% 3.0% 6.0% 3.2%
Manufacturing 13.2% 14.5% 13.7% 11.5%
Transportation 2.0% 1.8% 1.3% 2.2%
Communication 0.3% 0.3% 0.3% 0.6%
Utility 0.6% 0.4% 0.6% 0.5%
Wholesale Trade 3.6% 2.3% 3.3% 6.3%
Retail Trade 23.4% 35.4% 24.8% 20.9%
Finance, Insurance & Real Estate 7.6% 9.6% 8.0% 5.6%
Services 36.7% 30.3% 34.2% 42.7%
Government 5.0% 1.9% 5.4% 4.6%
Unclassified 0.4% 0% 0.5% 0.5%
Figure 10: Services and retail trade comprise the bulk of primary trade area employment.
Daytime employment plays a large role in supporting retail. The primary trade area is estimated to
have 64,720 employees; an estimated 18,000 of them are office employees who are known to
spend at much higher rates, often eating out for lunch and shopping on the way to and from work.
The mix of employees throughout the ten-minute drive time varies from the primary trade area
most noticeably in the services industry sector, with an additional 15,920 employees in the primary
trade area compared to the 10-minute drive time. Services, retail and finance, insurance & real
estate (FIRE) employ the most people by industry inside the ten-minute drivetime with 7,850,
6,470 and 2,550 jobs, respectively. With nearly 23,000 workers within a ten-minute drive time,
there is a large daytime consumer base close to downtown Brighton.
Consumer expenditure from daytime employment complements that captured in the evenings and
on weekends by households in the trade area. “Office Worker Retail Spending in a Digital Age,”
published by the International Council of Shopping Centers in 2012, provides insight into the
Downtown Brighton Retail Market Study 13.
Gibbs Planning Group, Inc.
02 June 2021impact of office worker employment. Weekly office worker expenditure, adjusted for 2021 dollars,
is estimated at $180. Weekly non-office worker expenditure is estimated at 37 percent of office
workers.
Figure 11: Drive Time and Trade Area Employment by Industry Sector
5-Minute 10-Minute Primary
Employment Sector
Drive Time Drive Time Trade Area
Agriculture & Mining 70 260 1,180
Construction 340 1,010 3,520
Manufacturing 1,180 2,380 8,540
Transportation 170 250 1,270
Communication 40 90 190
Utility 40 80 370
Wholesale Trade 260 750 2,360
Retail Trade 3,510 6,470 15,110
Home Improvement 210 410 1,030
General Merchandise Stores 100 440 1,110
Food Stores 570 710 1,930
Auto Dealers, Gas Stations, Auto Aftermarket 260 860 1,750
Apparel & Accessory Stores 50 200 490
Furniture & Home Furnishings 340 450 630
Eating & Drinking Places 1,510 2,570 5,830
Miscellaneous Retail 470 830 2,340
Finance, Insurance & Real Estate 1,330 2,550 4,900
Banks, Savings, & Lending Institutions 630 780 1,080
Securities Brokers 80 140 230
Insurance Carriers & Agents 210 340 1,360
Real Estate, Holding, Other Investment Offices 410 1,290 2,230
Services 4,080 7,850 23,770
Hotels & Lodging 400 580 950
Automotive Services 150 330 810
Motion Pictures & Amusements 630 1,040 2,130
Health Services 870 2,190 5,380
Legal Services 80 180 390
Education Institutions & Libraries 480 860 4,200
Other Services 1,470 2,670 9,910
Government 170 1,120 3,260
Unclassified Establishments 10 100 250
Total Employment 11,200 22,910 64,720
Figure 11: Downtown Brighton primary trade area’s employment by sector.
Non-office workers are estimated to have slightly less disposable income, to have multiple work
locations including at home, and typically are on the road more during their work-week. Retail
purchases (general merchandise, apparel, home furnishings, electronics, grocery and convenience
14. Downtown Brighton Retail Market Study
Gibbs Planning Group, Inc.
02 June 2021items) make up most of the office worker dollars, at $120 per week. Restaurant expenditures (full
service, limited service and drinking places) account for the balance at $40 per week. Annualized,
each office worker expends $9,400 before, during and after work.
Figure 12: Ten Minute Drive-Time Worker Expenditure
Non-Office
Weekly Annual Office Worker
Category Worker Total Expenditure
Expenditure Expenditure Expenditure
Expenditure
Prepared Food & Beverage
Limited & Full-Service
$40 $2,300 $16,100,000 $13,616,000 $29,716,000
Restaurants
Drinking Places $20 $900 $6,300,000 $5,328,000 $11,628,000
Retail Goods
General Merchandise, Apparel,
$70 $3,600 $25,200,000 $21,312,000 $46,512,000
Home Furnishings, Electronics
Grocery $30 $1,600 $11,200,000 $9,472,000 $20,672,000
Convenience Items $20 $1,000 $7,000,000 $5,920,000 $12,920,000
Total $180 $9,400 $65,800,000 $55,648,000 $121,448,000
Figure 12: Employees within ten minutes of the center of downtown Brighton expend $121.4 million dollars annually.
The annual impact of 22,910 workers within ten minutes of the center of downtown Brighton is
$121.4 million. This expenditure breaks down to include $41.3 million in prepared food and
beverage establishments, $20.7 million in grocery purchases, $46.5 million in retail sales and
$12.9 million in convenience items.
DOWNTOWN BRIGHTON AREA CHARACTERISTICS
Location
Downtown Brighton is in southeast Michigan, approximately 18 miles north of Ann Arbor and 20
miles northwest of Detroit. The downtown covers roughly 840 acres or 1.3 square miles. It
extends north to I-96, west and south to the CSX Plymouth Subdivision Railway and east around
the commercial development on the east side of Grand River Avenue. This area encompasses the
shopping centers of Brighton Town Square and Brighton Mall in the north, as well as the Grand
Crossing shopping center in the south. A large segment of South Ore Creek is situated in the
middle of the downtown, immediately north of Main Street. Moreover, Grand River Avenue
extends north-south through the downtown. Downtown Brighton has a Walk Score of 71 (out of
100) which classifies it as “very walkable.”
Access
Since downtown Brighton is situated near the major intersection of I-96 and U.S. Route 23, it is
easily accessible from surrounding cities. The downtown can be reached from Ann Arbor, which
lies 18 miles to the south, via U.S. Route 23. It is also easily accessible from the cities of
Farmington (21 miles east), Novi (16 miles east) and Lansing (40 miles northwest) via I-96.
Downtown Brighton Retail Market Study 15.
Gibbs Planning Group, Inc.
02 June 2021Figure 13: Traffic Counts
Road AADT (Year)
I-96 between Grand River Avenue & Flint Road 97,700 (2019)
Grand River Avenue between Hilton Road & Nemco Way 28,600 (2020)
East Grand River Avenue between Appian Way & Victor Street 20,600 (2019)
South Old US Hwy. 23 south of Victor Street 18,900 (2018)
Spencer Road between Oak Street & Spencer Court 17,800 (2019)
Brighton Road between Hollywood Court & Don Leith Drive 13,500 (2019)
Challis Road between Shana Drive & Liberty Drive 11,200 (2019)
Rickett Road between Barnstable Drive & Meyer Avenue 10,700 (2020)
Hilton Road between Oak Knoll Drive & Grand River Avenue 7,600 (2019)
Figure 13: The traffic chart above shows the heaviest traffic on I-96 and Grand River Avenue (source: Livingston
County Road Commission and Michigan Department of Transportation).
Figure 13 shows the thoroughfares within and immediately surrounding downtown Brighton that
have the highest traffic volumes: the main commuting routes of I-96, Grand River Avenue and
East Grand River Avenue. Furthermore, there is a dense network of local roads surrounding
downtown Brighton that makes it easily accessible. In particular, significant traffic enters
downtown Brighton from the north via Grand River Avenue, from the south via Rickett Road,
Grand River Avenue and Brighton Lake Road, from the west via Brighton Road and from the east
via Spencer Road and Hilton Road.
General Retail Market Conditions
According to CoStar, downtown Brighton has a total of 1.8 million sf of retail space. Its current
retail market rent is $16.81/sf, a figure that has decreased 0.5 percent from one year ago. The
current retail vacancy rate is 1.8 percent, which has increased by 0.4 percent over the past year but
is below the area’s 10-year average retail vacancy rate of 2.9 percent. A total of 10,000 sf of retail
space was delivered over the past year but no retail space is currently under construction. The
twelve-month retail sales volume was $1.6 million and properties sold at an average of $106/sf.
New Residential Development
Several residential development projects are currently planned or under construction in the
downtown Brighton area. The largest of these are Conley Square, Bluffs at Spring Hill, West
Village of Brighton and Vista at Uptown.
Conley Square, which is currently under construction, is a $20 million development that will
consist of 85 townhomes. Located at Flint Road and Temple Street on Brighton’s northeast side, it
is being developed by Robertson Brothers. Conley Square will feature 1,200 sf townhomes with
two bedrooms and one-car garages, as well as larger 1,500 sf townhomes with three bedrooms and
two-car garages. Prices for these townhomes start at $254,990 or $1,150 per month to rent.
16. Downtown Brighton Retail Market Study
Gibbs Planning Group, Inc.
02 June 2021Bluffs at Spring Hill will feature 70 single-family homes. Developed by Pulte, this project is located on 29 acres of land between I-96 and the Hamilton Farms condominiums. The homes at Bluffs at Spring Hill range from 1,680 sf to 1,880 sf and are listed for $340,000 to $378,000. This development gained final approval in June 2020 and construction broke ground earlier this year. Figure 14: Conley Square (left); Bluffs at Spring Hill (right) West Village of Brighton is to consist of 140 for-rent luxury townhomes. Located on the former Lindom School site on the west end of downtown Brighton, this project will be developed by SR Jacobson Development Corporation. The townhomes will consist of 2-and-3-bedroom units ranging from 1,280 sf to 1,550 sf. Each unit will have an open floor plan with high (9 foot) ceilings on the first floor, granite countertops, a master suite with walk-in closets and an in-unit full size washer and dryer. The larger units will also have 2-car attached garages. This project has received preliminary planning approval and final approval is expected in late April 2021. Figure 15: Vista at Uptown (left); West Village of Brighton (right) Vista at Uptown is located on about four acres between North Second Street and the Mill Pond. This $40 million luxury apartment complex, which is being constructed by Lansing-based DTN Development Group, will include r200 units. The apartments will range in size from 600 sf for a one-bedroom unit to 1,350 sf for a three-bedroom unit, with rents ranging from $1,200 to $2,400 per month. The apartments will have high-end amenities such as stainless-steel appliances, quartz countertops, tile and in-unit washers and dryers. City of Brighton Streetscape Plan In July 2020, the civil engineering and community planning firm Giffels Webster developed a streetscape plan for the City of Brighton. The plan acknowledges that although Brighton has a Downtown Brighton Retail Market Study 17. Gibbs Planning Group, Inc. 02 June 2021
vibrant Main Street, its streets and sidewalks are in need of repair. The plan makes several
recommendations to improve downtown Brighton’s public realm, such as:
      • narrowing vehicular street widths while widening sidewalks
      • removing curbs on Main Street near Mill Pond

Figure 16: Removing curbs on Main Street near Mill Pond, while maintaining on-street parking, will offer flexibility for
downtown events and festivals (images taken from City of Brighton, Michigan Streetscape Plan).

       •    adding landscape amenities such as planter pots and landscape beds

Figure 17: Landscape amenities will add seasonal colors and help enliven the downtown (images taken from City of
Brighton, Michigan Streetscape Plan).

       •    adding accent lighting, art and places for people to gather

Figure 18: Other streetscape features such as art and accent lighting will help downtown Brighton distinguish itself as
a unique shopping destination (images taken from City of Brighton, Michigan Streetscape Plan).

These enhancements to downtown Brighton’s streetscape are planned to be implemented by 2023.

 18.                                                                             Downtown Brighton Retail Market Study
                                                                                           Gibbs Planning Group, Inc.
                                                                                                         02 June 2021
Downtown Brighton Shopping Centers
Retail
Retail Center Name Shopping Center Type
Size (sf)
1. Brighton Towne Square Power Center 440,000
2. Brighton Mall Power Center 290,000
3. Meijer N/A 240,000
4. Grand Crossing Neighborhood Center 90,000
Figure 19: Map and table of the major shopping centers within downtown Brighton.
1. Brighton Towne Square
This 440,000 sf power center is located at the Grand River Avenue interchange off I-96 in the City
of Brighton. Built in 1997, Brighton Towne Square stretches over 75 acres. Currently, its largest
tenants by square footage are Target, Home Depot and MJR Theatres. Additionally, this center is
home to a 40,000 sf University of Michigan Health Center. Brighton Towne Square features other
tenants such as Staples, Party City, Sky Zone Trampoline Park, Starbucks, Chili’s and IHOP.
Brighton Towne Square is located 1 mile north of Main Street.
Downtown Brighton Retail Market Study 19.
Gibbs Planning Group, Inc.
02 June 2021Figure 20: In terms of square footage, the largest tenants at Brighton Towne Square are Home Depot (90,000 sf) and
Target (120,000 sf).
2. Brighton Mall
The Brighton Mall originally opened in 1970 as an enclosed mall with an A&P supermarket, Grant
City department store and twenty-five inline tenants. However, in 1996 the entire indoor mall was
demolished and rebuilt as a series of big box tenants. Today, the Brighton Mall is a 290,000 sf
power center that is home to Marshalls, Bed Bath & Beyond, Jo-Ann Fabrics and Crafts, Michaels,
Aldi, Best Buy and PetSmart. This power center also includes outparcels with restaurants such as
Panera Bread, McDonalds and Starbucks. The Brighton Mall benefits from excellent visibility as
it is exposed to vehicles along I-96 and Grand River Avenue. The Brighton Mall is located 1 mile
north of Main Street.
3. Meijer
There is a 240,000 sf Meijer location at 8650 West Grand River Avenue in downtown Brighton.
Originally opened in 1982, this was Livingston County’s first large department store.
4. Grand Crossing
Figure 21: Busch’s Fresh Food Market opened at the Grand Crossing shopping center in 2019.
Grand Crossing is a 90,000 sf neighborhood shopping center in the City of Brighton. It was
originally built in 1972 and most recently renovated in 2005. This 90,000 sf center is anchored by
a Busch’s Fresh Food Market, which houses a Starbucks. Other tenants at Grand Crossing include
Ace Hardware, Mancino’s Pizza & Grinders, GNC, Soccer World, Fantastic Sam’s and Citizens
20. Downtown Brighton Retail Market Study
Gibbs Planning Group, Inc.
02 June 2021Bank. Additionally, it is shadow anchored by Kroger. Grand Crossing is owned by Brixmor
Property Group and is 1 mile southeast of Main Street.
COMPETING SHOPPING CENTERS
Figure 22: Competing Shopping Centers
Downtown Brighton Retail Market Study 21.
Gibbs Planning Group, Inc.
02 June 2021Retail Distance to Downtown
Retail Center Name Shopping Center Type
Size (sf) Brighton
1. Twelve Oaks Mall Regional Center 1.5 million 16.0 miles
2. Briarwood Mall Regional Center 980,000 20.0 miles
3. West Oaks I & II Power Center 840,000 16.0 miles
4. Twelve Mile Crossing at Lifestyle center 740,000 15.5 miles
Fountain Walk
5. Lyon Towne Center Power Center 520,000 9.0 miles
6. Green Oak Village Place Community Center 500,000 2.0 miles
7. Novi Town Center Power Center 450,000 16.0 miles
8. Livingston Commons Power Center 370,000 6.0 miles
9. Tanger Outlets Howell Outlet Center 350,000 12.5 miles
10. The Shops at Waldenwoods Community Center 250,000 7.0 miles
11. Hartland Plaza Power Center 250,000 7.0 miles
12. Grand River Plaza Community Center 230,000 6.0 miles
Figure 22: Map and table of the competing regional, power, lifestyle, community and neighborhood shopping centers.
1. Twelve Oaks Mall
Figure 23: In terms of gross leasable area and total stores, the Twelve Oaks Mall is one of the largest shopping centers
in the State of Michigan.
Twelve Oaks Mall was developed in 1977 as a joint venture between A. Alfred Taubman, Homart
Development and the Dayton-Hudson Corporation. Twelve Oaks Mall is one of four regional
Taubman malls built in Metro Detroit during the late 1970s, the other three being Lakeside Mall,
Briarwood Mall and the Fairlane Town Center. Initially only anchored by Hudson’s, Sears opened
shortly thereafter, followed by Lord & Taylor and JCPenney.
Today, Twelve Oaks Mall features 1.5 million sf of retail space and over 180 stores. Currently, the
anchor tenants of the Twelve Oaks Mall are JC Penney, Nordstrom and Macy’s. Some of its other
notable retailers and restaurants are Abercrombie & Fitch, Apple, Banana Republic, Coach, H&M,
California Pizza Kitchen, lulemon athletica, Pottery Barn, Sephora, Talbots, Fossil, Johnston &
Murphy, Victoria’s Secret, Starbucks, Kerby’s Coney Island and Pinkberry. The Twelve Oaks
Mall is located 16 miles east of downtown Brighton.
22. Downtown Brighton Retail Market Study
Gibbs Planning Group, Inc.
02 June 20212. Briarwood Mall Figure 24: On November 15, 2020, downtown Ann Arbor’s iconic Urban Outfitters closed its store on State Street (pictured on left with its entrance under the State Theatre’s marque) and opened at the Briarwood Mall (pictured on right). The Briarwood Mall was developed by A. Alfred Taubman in 1973. Its inaugural anchor tenants were JCPenney and Sears, and Hudson’s opened one year later. Today, the Briarwood mall is a regional shopping center that features 980,000 sf of retail and restaurant space. Owned and managed by Simon Property Group, it is currently anchored by Macy’s, Von Maur and JCPenney. Some of Briarwood Mall’s other shops and restaurants are The Apple Store, Victoria’s Secret, Sephora, Pottery Barn, American Eagle Outfitters, Bath and Body Works M Den, PF Chang’s, California Pizza Kitchen, Panda Express, Pinkberry, Romano’s Macaroni Grill, Starbucks and Wetzel’s Pretzels. Briarwood Mall is 20 miles south of downtown Brighton. 3. West Oaks I & II Figure 25: West Oaks I (left) and II (right) add to the agglomeration of retail by Twelve Oaks Mall in Novi. Located directly across from Twelve Oaks Mall, West Oaks is composed of two adjacent power centers: West Oaks I and West Oaks II, both of which are owned by RPT Realty. West Oaks I was built in 1979 and features 340,000 sf of retail space. Its major tenants are Gardner White, Nordstrom Rack, Michaels, HomeGoods, The Container Store, Old Navy, DSW, Party City, David’s Bridal and Carrabba’s Italian Grill. On the other hand, West Oaks II was built in 1986 and has 500,000 sf of retail space. Some of its current tenants are Kohl’s, JOANN Fabrics & Crafts, Bob’s Discount Furniture, Bed Bath & Beyond, Marshalls, Kirkland’s, Five Below, Starbucks and Lands’ End. West Oaks I and II are situated 16 miles east of downtown Brighton. Downtown Brighton Retail Market Study 23. Gibbs Planning Group, Inc. 02 June 2021
4. Twelve Mile Crossing at Fountain Walk

Figure 26: Emagine Novi Theatre (which has Michigan’s largest movie screen) and Airtime Trampoline are only two of
the many entertainment options at Twelve Mile Crossing at Fountain Walk.

Built in 2002, Twelve Mile Crossing at Fountain Walk is a 740,000 sf lifestyle center situated
across from Twelve Oaks Mall in the City of Novi. Its shopping options include Dick’s Sporting
Goods, Floor & Décor, American Home Fitness, Rocket Fizz and the Family Puppy. This center
is also home to many restaurants, such as Bar Louie, Beerhead Bar & Eatery, Blackrock Bar &
Grill, Buddy’s Pizza, Buffalo Wild Wings, Cold Stone Creamery, Kung Fu Tea and Noodletopia.
However, Twelve Mile Crossing at Fountain Walk is perhaps best known as a regional
entertainment destination. Indeed, it is home to the 18-screen Emagine Novi Theatre, Airtime
Trampoline, Aqua Tots, The Backyard Axe Throwing League (BATL), Chuck E. Cheese’s,
Escape Room, Full Throttle Adrenaline Park and Putting Edge. Currently owned and managed by
Spigel Properties, Twelve Mile Crossing at Fountain Walk is located 15.5 miles east of downtown
Brighton.

5. Lyon Towne Center
Sprawling over 78 acres, Lyon Towne Center is a 520,000 sf power center that contains a 230,000
sf Walmart Supercenter and 150,000 sf Lowe’s Home Improvement. This center also includes
several outparcels with restaurants such as Starbucks, Applebee’s, McDonalds, Jet’s Pizza and
Leo’s Coney Island. Lyon Towne Center benefits from excellent visibility and accessibility, as it
is visible from I-96 and located right off the I-96 Milford Road exit. It is located in the City of
New Hudson, 9 miles east of downtown Brighton.

6. Green Oak Village Place
The recipient for three years running of the “People Choice Award” for shopping in Livingston
County, Green Oak Village Place is a large 500,000 sf community shopping center. Located in the
City of Brighton, this $100 million center opened in stages between 2006 and 2008. It was
developed by Lormax Stern and REDICO and currently spans 68-acres. Today, Green Oak
Village Place has six anchor stores: Dick’s Sporting Goods, JCPenney, Homegoods, DSW Shoe
Warehouse, Barnes & Noble and T.J. Maxx. Additionally, it features over fifty inline tenants,
such as Bath & Body Works, Ulta, Chico’s, Torrid, Victoria’s Secret, Claire’s, Dover Saddlery,
Five Below, Lumber Liquidators, Wild Birds Unlimited, Men’s Warehouse, Don Juan Mexican
Restaurant, Rollin Stone Wood Fire Pizza, Honey Baked Ham Company and Kerby’s Coney
Island. Green Oak Village Place is 2 miles southeast of downtown Brighton.
 24.                                                                         Downtown Brighton Retail Market Study
                                                                                       Gibbs Planning Group, Inc.
                                                                                                     02 June 2021
Figure 27: Earlier this year, Massachusetts-based Dover Saddlery opened a 6,000 sf store at Green Oak Village Place. Dover Saddlery sells a variety of equestrian products such as clothing, saddles, horse health products, blankets and other stable items. 7. Novi Town Center Developed by Trammell Crow in 1987, Novi Town Center is a 450,000 sf power center. Its retailers include Walmart Supercenter, TJ Maxx, Hobby Lobby, ULTA Beauty, Sierra Trading Post and Pure Hockey. Novi Town Center is also home to several restaurants, such as Jim Brady’s, Chipotle, Primanti Bros., Potbelly, Bonefish Grille, Pei Wei and Sweetwaters Coffee & Tea. This center reports average annual sales of $100 million and is currently managed by CBRE. Novi Town Center is situated across I-96 from Twelve Oaks Mall and 16 miles east of downtown Brighton. Figure 28: In terms of square footage, the two largest anchor tenants at the Novi Town Center are Walmart (150,000 sf) and Hobby Lobby (55,000 sf). 8. Livingston Commons Shopping Center This 370,000 sf power center is directly across Grand River Avenue from the Grand River Plaza shopping center. Livingston Commons benefits from being in one of the strongest retail corridors of Livingston County, as there is over 1.5 million sf of retail space within a 0.75-mile radius. Furthermore, Livingston Commons benefits from being situated just off of the newly constructed full access Latson Road exit on I-96, allowing for easy access for consumers in all directions. The current tenants at Livingston Commons are Walmart Supercenter, Lowe’s Home Improvement, PetSmart and restaurants KFC, White Castle, Bob Evans, Culver’s and Panera Bread. Livingston Commons is 6 miles northwest of downtown Brighton. Downtown Brighton Retail Market Study 25. Gibbs Planning Group, Inc. 02 June 2021
9. Tanger Outlets Howell
What is now Tanger Outlets Howell originally opened in 1996 as the Kensington Valley Factory
Shops. The outlet mall was renamed in 2002 when it was bought by the Tanger REIT (Real Estate
Investment Trust) for $37.5 million. For years, Tanger Outlets Howell has been the number one
attraction in Livingston County, as it draws an average of over 2 million visitors each year. It
consists of 60 outlet stores that total 350,000 sf. These stores include apparel, accessories &
jewelry, home furnishings and specialty stores such as Banana Republic Factory, Polo Ralph
Lauren Factory Store, H&M, Kay Jewelers Outlet, Ann Taylor Factory Store, Claire’s, Coach and
Pandora. Tanger Outlets Howell is located 12.5 miles northwest of downtown Brighton.

10. The Shops at Waldenwoods
The Shops at Waldenwoods is located in the City of Hartland at the busy intersection of U.S. 23
and M-59. It was built in 2002 and is owned and managed by Robert B. Aikens & Associates.
Today it is a 250,000 sf community shopping center anchored by Target and Kroger. Other
current retailers and restaurants at this center include CVS Pharmacy, Starbucks, Hallmark, Tony
Sacco’s Coal Oven Pizza, Subway and Pizza Hut. The Shops at Waldenwoods is 7 miles north of
downtown Brighton.

11. Hartland Plaza

Figure 29: The 175,000 sf building at Hartland Plaza that used to house Walmart is now occupied by Rural King and
Noble Appliance.

Built in 1980, Hartland Plaza is a 250,000 sf power center. It is located in the City of Hartland, 7
miles north of downtown Brighton. Previously home to a 175,000 sf Walmart Supercenter, which
closed in 2017, Hartland Plaza is now anchored by a 100,000 sf Rural King and 75,000 sf Noble
Appliance. Today, Hartland Plaza is also home to Dollar Tree, Rally’s, Red Olive Restaurant,
McDonald’s and Great Clips, among others. However, 75,000 sf of space at Hartland Plaza is
currently vacant.

12. Grand River Plaza
Located in the City of Howell across from the Livingston Commons shopping center, Grand River
Plaza is a 230,000 sf community center. It was built in 1990 and today it is home to Dunham’s
Sports, Big Lots, Family Farm & Home, Perfect Edge Hockey, Oceanside Seafood, Kolt Jewelers,
Wendy’s, Arby’s, Taco Bell, GNC and Sally Beauty Supply, among others. In the summer of

 26.                                                                          Downtown Brighton Retail Market Study
                                                                                        Gibbs Planning Group, Inc.
                                                                                                      02 June 2021
2018, Carson’s closed its 75,000 sf store at this center and its former spot still sits vacant. Grand
River Plaza is owned by Northeast Capital Group and is situated 6 miles northwest of downtown
Brighton.
ANALYSIS ASSUMPTIONS
Gibbs Planning Group, Inc. has assumed the following factors in the completion of this
commercial market analysis:
• No major regional retail centers will be developed within the defined downtown Brighton
primary trade area through 2026.
• The region’s economy will continue at normal or above normal ranges of employment,
inflation, retail demand and growth.
• Properties within downtown Brighton will be properly zoned and have the necessary
infrastructure to support new commercial development.
• Annual population growth for the primary trade area is estimated to be 0.85 percent from
2021 to 2026.
• Any new commercial development in downtown Brighton will be planned, designed, built
and managed to the best practices of the American Institute of Architects, American
Planning Association, American Society of Landscape Architects, Congress for New
Urbanism, International Council of Shopping Centers and the ULI.
RETAIL & RESTAURANT DEMAND
This study estimates that if best practices are implemented, then an additional $45.9 million in new
annual sales can currently be captured by downtown Brighton retailers and restaurants, growing to
$48.2 million annually by 2026. If achieved, this growth could support 100,000 sf of new retailers
and 20,000 sf of new restaurants, for a total of 120,000 sf. This growth could be absorbed with the
opening of 25 - 40 new businesses or by existing stores and restaurants through expanded
operations and marketing. If managed per industry best practices, these stores could generate
above average sales of $354 per square foot per year.
Downtown Brighton can presently support additional stores that could generate up to $38.7 million
in new annual sales, growing to $40.5 million annually by 2026. The market can also support
brew pubs, full-service, limited-service and specialty food restaurants producing $7.3 million in
annual sales, growing to $7.7 million annually by 2026.
See below GPG’s supportable retail table, Figure 30. Note, these supportable numbers are in
addition to existing downtown Brighton businesses and only reflect potential new demand.
Downtown Brighton Retail Market Study 27.
Gibbs Planning Group, Inc.
02 June 2021You can also read