Study of Assam Tea Value Chains - OCTOBER 2019 - Le Basic
←
→
Page content transcription
If your browser does not render page correctly, please read the page content below
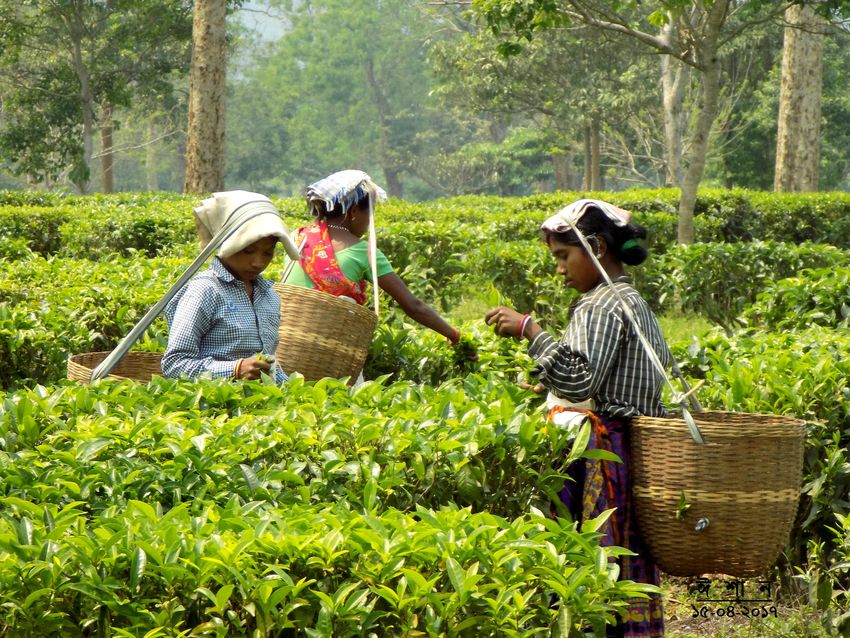
Credit : Female workers at a tea Garden of Assam, Wikimedia Commons/Picasa

                                                                                            Research Report
                                                                                                              Study of Assam Tea Value Chains

OCTOBER 2019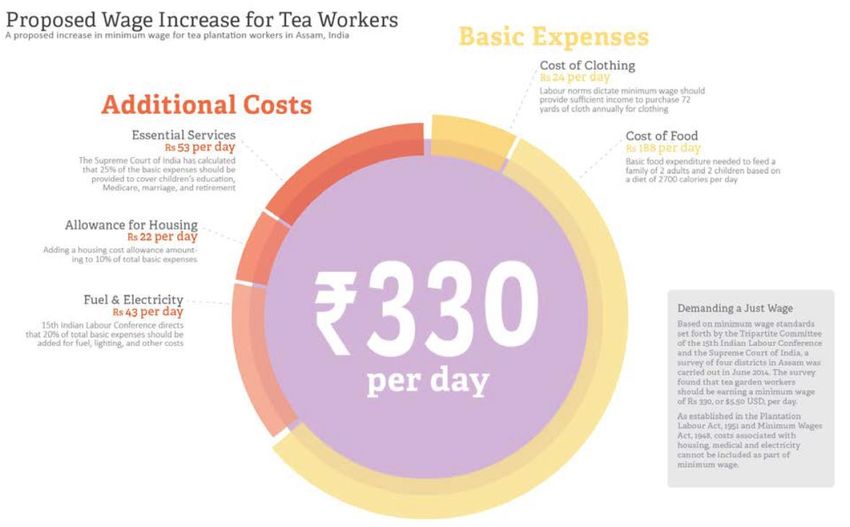
Acknowledgements

This report has been commissioned by Oxfam Germany and supported by Oxfam Germany and the
German Ministry for Economic Cooperation and Development (BMZ).
It has been authored by the Bureau for the Analysis of Societal Impacts for Citizen information (BASIC).

Study of Assam tea value chains                                                                       Page 2
1. Introduction

Tea is the second most consumed beverage after water at the global level. Today, world tea consumption
is estimated at 5.5 million tonnes and expands at an average rate of 4.5% per year1. In Europe, the tea
market is mature and per capita consumption has declined over the past decade as competition from
other beverages has intensified (particularly bottled water and soft drinks). In contrast, demand has
increased significantly in most emerging economies, underpinned by the rapid growth in income levels
and the promotion of tea for its health benefits.

India is at the same time the 2nd biggest consumer market with 1.05 million tonnes per year (20% of
global sales)2, the 2nd largest producer with a production of 1.27 million tonnes per year and the 4th
largest exporter of tea in the world3. Assam is the largest tea producing state of India and the largest tea
producing region of the world (producing approximately 51% of India’s tea, and nearly 11% of the world’s
tea) 4. The sector is structured by private tea plantations which have pursued the working system put in
place by the British colonials, with a high degree of inequality and little qualitative change in the working
and the living condition of the millions of workers employed. This situation is further associated with a
highly unequal distribution of value along the tea chain, from workers in plantations down to consumers
in the different markets. However, the opacity and lack of objective numbers on the distribution of value
prevents from understanding the economic dynamics between tea plantations, exporters, importers,
brands and supermarkets, and the correlation with the pressure exercised on workers at the beginning of
the chain.

In this context, this investigation conducted by BASIC (www.lebasic.com/en/) aims at examining how value
is shared along the tea value chain, more specifically estimating historical and projected share of value
received by tea workers in Assam compared to the other actors along the value chain (down to the
consumer) in major foreign consumer markets, with comparisons with the domestic Indian market.

1 FAO, Intergovernmental Group on Tea, Current market situation and medium term outlook, 2018
2 Ibid.
3 Ibid.
4 http://www.teaboard.gov.in/pdf/Press_Release_on_Exports_pdf9752.pdf accessed on 28 March 2019

Study of Assam tea value chains                                                                            Page 3
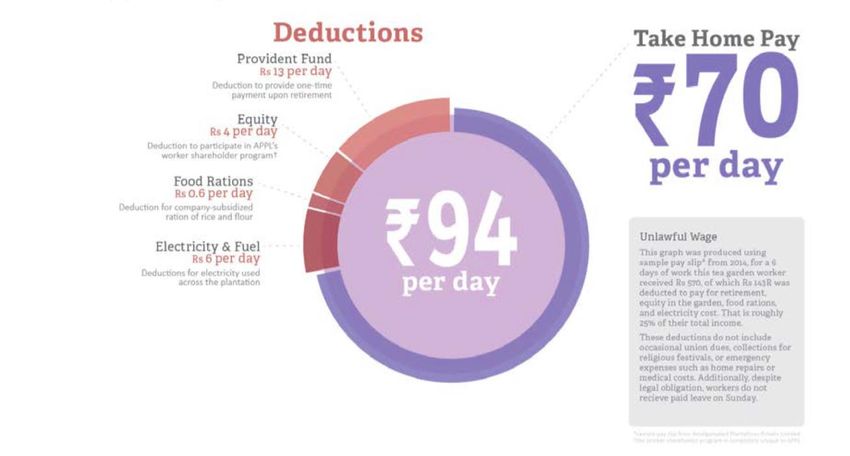
Table of contents

1. Introduction                                                                                3
2. Global tea value chains                                                                     5
   a) The global tea market                                                                    6
        Tea consumption and production                                                         6
   b) The global tea value chains                                                              8
3. Assam tea value chains in India                                                            12
   a) Tea production in Assam                                                                 12
        The Indian Tea industry                                                               12
        Specificities of the Tea sector in Assam                                              18
   b) Domestic Tea value chains                                                               23
        Indian food retail sector                                                             23
        Tea consumption in India                                                              24
        Distribution of value from production in Assam to consumption in India                25
        Leverage for paying living wages/income in the Indian tea sector                      28
   c) Exported tea value chains                                                               29
        Indian tea export market                                                              29
        Distribution of value from production in Assam to export from India                   29
4. International Assam tea value chains                                                       31
   a) Germany                                                                                 31
        German Food retail sector                                                             31
        Tea consumption and imports in Germany                                                32
        Distribution of value from production in Assam to consumption in Germany              33
        Leverage for paying living wages/income in the German tea sector                      35
   b) Netherlands                                                                             36
        Dutch Food retail sector                                                              36
        Tea consumption and imports in the Netherlands                                        37
        Distribution of value from production in Assam to consumption in the Netherlands      37
        Leverage for paying living wages/income in the Dutch tea sector                       39
   c) United Kingdom                                                                          40
        UK Food retail sector                                                                 40
        Tea consumption in the UK                                                             41
        Distribution of value from production in Assam to consumption in the UK               42
        Leverage for paying living wages/income in the UK tea sector                          44
   d) France                                                                                  45
        French Food retail sector                                                             45
        Tea consumption in France                                                             46
        Distribution of value from production in Assam to consumption in France               47
        Leverage for paying living wages/income in the French tea sector                      48
   e) USA                                                                                     49
        US Food retail sector                                                                 49
        Tea consumption in the US                                                             50
        Distribution of value from production in Assam to consumption in the US               51
        Leverage for paying living wages/income in the US tea sector                          53
5. Appendix: Objectives, perimeter & methodology                                              54
   a) Objectives                                                                              54
   b) Research questions & countries                                                          54
   c) Methodological approach                                                                 54
        Conceptual framework                                                                  54
        Operational framework                                                                 56
   d) Limitations                                                                             57
   e) Reading guide for estimates                                                             58

Study of Assam tea value chains                                                            Page 4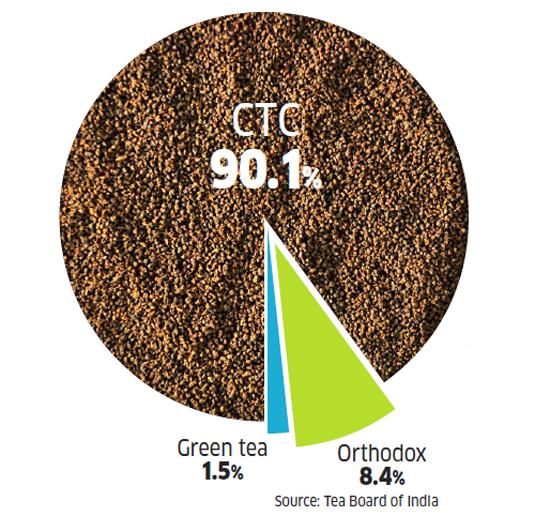
Abbreviations

APPL           Amalgamated Plantations Private Limited
BLF            Bought leaf factory
CTC            Cut, Tear and Curl
GBP            Great Britain Pound Sterling
Ha             Hectare
HUL            Hindustan Lever Limited
ITA            Indian Tea Association
STG            Small Tea Grower
TBI            Tea Board of India
USD            United States Dollar

Study of Assam tea value chains                          Page 5

2. Global tea value chains

                a) The global tea market

                     Tea consumption and production

Tea drinking originated in China and can be traced back to the mythical Chinese emperor Shen Nung who
supposedly discovered the plant in 2737 BC (and the use was spread during the 3 Kingdoms epoch in 222
AD)5. The Japanese discovered it in the 8th century and it only reached Europe as late as the 16th
century6. Breaking the Chinese monopoly on tea, the British and the Dutch established tea plantations
respectively in India & Sri Lanka, and on Java and Sumatra.7

                              Fig. 1 World consumption of beverages and tea per capita (2017)
                                    Source: BASIC, based on data from H. Nalwala and FAO

Today, tea is the second most consumed beverage after water at the global level, reaching 35.2 litres per
person and per year in 20178. More than three billion cups of tea are consumed every day, in all types of
varieties. The Turkish are the biggest consumers per capita, followed by Moroccans, Irish, Mauritanians
and British consumers9.

Consumption habits differ greatly from country to country: black tea accounts for 98% of all tea consumed
in India compared to only 58% in the USA (due to the strong position of fruit and herbal teas), while China
and Japan have a much higher intake of green tea and a preference for loose-leaf tea10.

Internationally, the global tea market is valued at around 44 billion euros (49.4 billion USD) in 2017 and is
expected to reach approximately 65 billion euros (73 Billion USD) by 202411. Tea is the most domestically-
consumed hot beverage: 69% of tea production is consumed in the countries that produce it12.

5 S. Pashova, K. Nikolova, G. Dimitrov, Study of The Quality of “Twinings” Tea, International Journal of Economic Practices and
Theories, Vol. 3, No. 1, January 2013
6 C. K. Magar and B. K. Kar, Tea Plantations and Socio-Cultural Transformation: The Case of Assam, India Space and Culture, Volume 4,
Number 1, 2016
7 P. Rogers, A short history of tea, 2004 and M. Groosman, Tea Sector Overview, IDH, 2011
8 https://worldteanews.com/tea-industry-news-and-features/tea-consumption-second-only-to-packaged-water accessed on 23 March
2019
9https://ipfs.io/ipfs/QmXoypizjW3WknFiJnKLwHCnL72vedxjQkDDP1mXWo6uco/wiki/List_of_countries_by_tea_consumption_per_cap
ita.html accessed on 23 March 2019
10 https://effectivedesign.org.uk/sites/default/files/BrandOpus_DBA_Platinum_Discovery_Published.pdf accessed on 23 March 2019
11 https://www.globenewswire.com/news-release/2018/08/08/1549020/0/en/Global-Tea-Market-Will-Reach-USD-49-456-52-Million-
by-2024-Zion-Market-Research.html accessed on 29 March 2019
12 Duraiarasi Balasundaram, Case Study on the Global Strategies of Tata Tea Ltd (‘Make in India’ Realistic), September 2015, Number
2, Volume 2

Study of Assam tea value chains                                                                                                    Page 6
Fig. 2 Main world tea consumer and producer countries
Source: BASIC, based on FAO and Comtrade data (2017)
In terms of volume, world tea consumption has reached 5.5 million tonnes in 2016, a 50% increase since
200613. China is by far the largest tea consumer country (2.1 million tonnes in 2016) and represents 39% of
global market, with an outstanding growth rate of 10% per year. It is followed by India with 1.05 million
tonnes in 2016, which makes up 19% of the global market14.
In the rest of the world, the European and Russian tea markets, which represent each 4% of world
consumption, have been declining over the past decade as competition from other beverages has
intensified (particularly bottled water and soft drinks), whereas demand has increased significantly in
emerging economies from Asia, Latin America and Africa, underpinned by the rapid growth in income
levels and the promotion of tea for its health benefits. More recently, worldwide consumer demand is on
the rise for non-traditional tea products such as lemon-tea, iced-tea or herbal infusions seen as “healthier”
alternatives to soft drinks15.
World tea production has kept pace with this increase and remains slightly above demand at 5.7 million
tonnes in 201616. Black tea is most produced (56% of volumes) followed by green tea (30%), but the latter
is growing 3 times more rapidly and is expected to match black tea production by 203017.
China is responsible for this growth in total output, as its production more than doubled over the past
decade (from 1.17 million tonnes in 2007 to 2.44 million tonnes in 2016, mainly green tea), underpinned
by the country’s economy, increased consumer health consciousness and the rapid development of herbal
tea. It now accounts for 43% of world production. India is the 2nd largest producer, but only increased its
production from 0.95 to 1.33 million tonnes over the same period. Other major tea producers, such as
Kenya and Sri Lanka, are much smaller in size (respectively 0.47 and 0.29 million tonnes).18
13 FAO, Intergovernmental Group on Tea, Current market situation and medium term outlook, 2018
14 Ibid.
15 Ibid.
16 Ibid.
17 Ibid.
18 FAO, Intergovernmental Group on Tea, 2018 op. cit.
Study of Assam tea value chains Page 7Tea exports and imports
Fig. 3 Main world tea export and import countries
Source: BASIC, based on FAO data (2017)
Only 31% of world tea production is traded internationally, reaching 1.75 million tonnes in 2016, a 14%
increased – only – compared with 10 years ago. Kenya is the largest exporter followed by China, Sri Lanka,
India, Vietnam, Indonesia, Malawi and Uganda. On the import side, Pakistan ranks first, followed by
Russia, the USA, the UK, Egypt, Morocco, Iran and Germany (these countries are the main port of entry of
globally-traded tea and are not always the final destination of tea).
b) The global tea value chains
All types of tea (black, green, white, Trade between producers and
Tea comes from an evergreen Tea companies (also
Oolong…) are produced from the buyers usually takes place at Once packed, tea is
bush (Camellia Sinensis) that called packers /
same plant; difference is in the auctions, facilitated by brokers delivered to
grows in altitude. It takes 5-7 blenders) buy the tea
processing. After plucking, tea who indirectly determine the regional
years to become suitable for through brokers. Upon
leaves are delivered to estates’ price of tea. 70% of the global distribution centres
commercial exploitation. Tea arrival at their factories,
factories within 5-7 hours to secure tea production is sold through of retailers &
is very labour intensive: it is tea is blended, packed
quality. Then they are dried, auctions. Main actors: J. Thomas wholesalers, then
harvested by hand all year and then marketed.
fermented, crushed or cut-torn- & co, Eastern Tea sent to stores, cafes
round with peak seasons. Main actors: Unilever,
curled (CTC). In parallel, 30% of tea is and restaurants.
Main actors: Mc Leod Russel, Tata, Twinings, James
Main actors: Mc Leod Russel, Tata, purchased through direct buying
James Finlay, John Keells Finlay, Teekanne
Unilever, James Finlay, John Keells by tea packers and brands;
Fig. 4 Technical description of the tea chain - Source: BASIC
At the consumer end, the market is divided into black tea (fully fermented), oolong tea (semi-fermented),
green tea (unfermented), fruit & herbal tea, and other teas (such as pu-erh). It is sold in loose tea packets
and tea bags (the two most popular packaging formats), as well as aluminium tins and plastic containers.
The main channel for packaged tea is supermarkets and hypermarkets, followed by specialty stores, online
retail and convenience stores19.
19 https://www.globenewswire.com/news-release/2018/08/08/1549020/0/en/Global-Tea-Market-Will-Reach-USD-49-456-52-Million-
by-2024-Zion-Market-Research.html accessed on 29 March 2019
Study of Assam tea value chains Page 8Fig. 5 Market shares of largest tee companies at global level (including traded tea and domestically-consumed tea)
Source: BASIC, based on FIAN (2014) and IDH (2011)
The most popular products (e.g. Lipton yellow label) can contain up to 36 types of tea blended in the
consuming country, so as to keep their taste constant (exact composition is a guarded commercial
secret)20.
The four leading companies almost account for 20% of the market at international level21:
- Unilever (12% global market share). This is the world’s largest supplier of tea, owner of the Lipton
Yellow Label which is the world’s most popular tea brand and Lipton Ice Tea which is the world’s
most popular ready-to-drink tea brand. In Kenya, its subsidiary Brooke Bond Kenya owns the
largest plantation with 11% of the country’s output, and in India, Hindustan Lever is the largest
Indian brand and Indian exporter of bulk tea, as well as the world’s largest packet tea marketer22.
- Tata Global Beverages (4%, owner of the Tetley brand). A subsidiary of the Tata Group producing
a range of products from cars to t-shirts, it controls several plantations in India and Sri Lanka, as
well as 10 blending and packaging factories in India alone, including the world’s largest orthodox
tea factory in Munnar. Tata is the second largest brand on the Indian tea market and owns Tetley,
the second biggest tea brand worldwide23.
- James Finlay (3%). Involved in every stage of tea production, the company, it is the largest instant
tea producer in the world. It has a major presence in large tea producing countries: Kenya (where
it owns the second largest plantation company and Africa’s only orthodox factory), Sri Lanka and
Argentina (where it owns the largest tea estate, Casa Fuentes)24.
- Twinings (3%, owned by Associated British Foods)25. The company does not own any plantations
and never has done. It does not own either tea processing factories, only packing factories. It
sources its tea from 160 gardens in India, Sri Lanka, China, Indonesia, Kenya, Malawi and
Argentina (countries where it owns tea factories).
Market concentration appears to be much higher when analysed on a regional basis:
7 companies are estimated to make up 90% of the tea sold in European and North American markets
(Unilever, Van Rees, James Finlay, Tata Tetley, Twinings, Teekanne, Ostfriesische Tee Gesellschaft)26.
20 M. Groosman, Tea Sector Overview, IDH, 2011
21 M. Groosman, Tea Sector Overview, IDH, 2011 and IUF-FIAN-Misereor, Harvesting Hunger: Plantation Workers and the Right to
Food, 2014
22 Institute of Policy and Strategy for Agriculture and Rural Development, The Tea Market – a background study, 2002
23 Ibid.
24 Ibid.
25 Ibid.
26 M. N. Larsen, Sustaining Upgrading in Agricultural Value Chains? State-Led Value Chain Interventions and Emerging Bifurcation of
the South Indian Smallholder Tea Sector, 2016
Study of Assam tea value chains Page 9In Hamburg, which has been the main European entry point for tea since the 19th century and which
accounts today for 70% of the Europe-wide traded tea27, the German companies specialized in tea
blending, flavouring and packaging have a strong presence28. The two biggest players, Ostfriesische Tee
Gesellschaft and Teekanne, hold a combined share of 42%, followed by Hälssen & Lyon, Teekante, J Fr
Scheibler GbmH, and H & S Tee-Gesellschaft29. These actors re-export tea to the rest of Europe supplying
all types of actors, from small specialized tea brands to retailers (for their private label tea) and
international brands30.
Historically, the supply chains of leading global brands have been vertically integrated from their own tea
plantations all the way to the branded tea on the retailers’ shelves. In recent years, they have started to
outsource part of their production and processing capacity to focus instead on downstream activities,
notably blending, packing, marketing and product innovation which are the most lucrative parts of the tea
value chain31.
Unlike for other major agricultural commodities, there is no stock or futures market for tea. Almost 70% of
global tea harvest is sold through auctions, the 3 biggest centres being the major references for the world
market price (Kolkata, India; Colombo, Sri Lanka; Mombasa, Kenya). In all producing countries, local
auction centres are key nodes in the chain. They enable producers to receive payment faster and to lower
the uncertainty of prices and sales, while guaranteeing faster delivery and quality test for buyers32.
India's largest tea brokers
J. Thomas & co.;
40%
Eastern Tea;
Others; 39% 13%
Contemporary
Brokers; 8%
Fig. 6 Market share of Indian tea brokers
Source: BASIC, based on FAO (2018), FIAN (2014) and IDH (2011)
As for downstream stages of the chain, it is highly concentrated and the number of brokers registered by
national Tea Boards in each country is quite limited: 11 in Kenya, and only 4 in Kolkata. The three largest
Indian tea brokers, J. Thomas & Co. handles 40% of all tea auctioned in India, followed by Eastern Tea and
Contemporary Brokers which channel respectively 13% and 8%. 33
27 One of the reasons for Hamburg importance in the European tea trade used to be the tea tax that had been levied between 1953
and 1993, which was not incurred if tea storage and processing remained in the free trade zone of Hamburg’s port. Today, many
service providers like laboratories, logistical specialists, and suppliers, as well as the German Tea Association and the European Tea
Committee are located in this city. https://marketing.hamburg.de/its-tea-time.html accessed on 27 March 2019
28 https://marketing.hamburg.de/its-tea-time.html accessed on 27 March 2019
29 Export Opportunity Surveys, The Market for Organic Black Tea in Germany and the United States, TH Köln - University of Applied
Sciences and University of Wisconsin-Whitewater, EOS Research Paper 2/2016, May 2016
30 Ibid.
31 M. N. Larsen, Sustaining Upgrading in Agricultural Value Chains?, 2016 op. cit.
32 Cividep India, Tainted Tea: Slave Labour in your Cuppa?, May 2016
33 K. Hazarika, Tea Auction Market, With a special reference to Guwahati Auction Centre, 2013
Study of Assam tea value chains Page 10Fig. 7 Tea prices at Colombo, Kolkata & Mombasa auctions 1960-2010 in US cents per kg
Source: R. M. Henderson and F. Nelleman, Harvard Business School, based on World Bank data (GEM Commodities)
As a result, the main drivers of international tea prices are not only pests and diseases or weather
conditions, but also market access and the influence of dominant buyers in the chain which have even
greater impacts 34. This is especially the case at auctions where brokers have the upper hand on
negotiations, in close coordination with big brands35. Over the past decades, they have exerted a strong
price pressure on the global tea market, which has been exacerbated by the high degree of
commoditization and the perishability of the product (which meant prices have often been cut to clear
stocks) 36. This is best illustrated by the evolution of the average prices of tea at Colombo, Kolkata and
Mombasa auctions which have been almost divided by 3 between the 1960’s and the 2005 (see previous
graph).
Fig. 8 FAO Tea Composite Price 2000-2017 in US dollars per kg
Source: BASIC, based on FAO (2018)
Since 2005, the prices have partially recovered as demonstrated by the FAO Tea Composite Price (a
weighted average of the prices of black tea sold in the main auction centres in the world, which include
Colombo, Kolkata and Mombasa but also Jakarta, Limbe…). This pprice has almost doubled (see above)
but remains 40% lower than in 1960 (the latest increase of tea prices in 2017 being mainly correlated with
rising domestic and foreign demand as well as tighter supplies)37.
At the beginning of the chain, there are on estimate 13 million people involved in tea production
worldwide, of which 9 million are smallholders. While large estates with integrated processing factories
dominate in India (53% of production), smallholders are most prevalent in China (90% of production), Viet
34 FAO, Intergovernmental Group on Tea, 2018 op. cit.
35 K. Hazarika, Changing Market Scenario for Indian Tea, International Journal of Trade, Economics and Finance, Vol. 2, No. 4, August
2011
36 R. M. Henderson and F. Nelleman, Sustainable Tea at Unilever, Harvard Business School, December 2011
37 FAO, Intergovernmental Group on Tea, 2018 op. cit.
Study of Assam tea value chains Page 11Nam (80%), Kenya and Sri Lanka (close to 70%)38. Since processing has to start within 5-7 hours after
harvesting, small growers are in a very weak bargaining position vis-à-vis the nearby processing units of
independent Bought Leaf Factories (BLFs) and tea estates which purchase their green leaves. The major
players at this stage: Mc Leod Russel which belongs to the Williamson Magor Group, the biggest owner of
tea estates in the world (100 000 tonnes of annual production capacity), James Finlay, Tata Tea, Unilever
and John Keells.39
3. Assam tea value chains in India
a) Tea production in Assam
The Indian Tea industry
History and current status of the Indian Tea industry
Local tribes in Assam had been drinking a brew made of a local tea plant for a long time when Robert
Bruce, a Scottish botanist and adventurer, came to the region in 1823. He managed to get samples of it
which were sent for testing in Kolkata and officially identified as a new variety of tea (Camellia sinensis
var. assamica), different from the original Chinese variety (Camellia sinensis var. sinensis) which Bruce had
managed to smuggle into West Bengal.40
Fig. 9 Map of tea producing regions in India. Source: Tea Source (www.teassource.com)
Following the success of the first experimental tea estate established in Chabua (Asssam), the first tea
company, the Assam Company, was set up in 1839 which monopolized tea planting, cultivating and
processing until 1860. It put an end to the Chinese monopoly over the commodity. Over the following
decades until the end of the 19th century, a flow of independent tea estates and companies were created
first in Assam and Darjeeling, then in the Nilgiri Hills of South India41, thanks to the forced and continuing
displacement of cheap labour force, rising demand of British consumers for Indian tea, easy availability of
large portions of cheap virgin lands and opening up of auction centres in different parts of India.42
38 FAO, Intergovernmental Group on Tea, 2018 op. cit.
39 Tropical Commodity Coalition, Tea Barometer, 2010
40 The World is a Tea Party, Your guide to Assam Tea & Gardens, 2014
41 Roy, Achinto 2013, An Institution based insight into India’s Tea Industry, Academy of Taiwan Business Management Review, vol. 9,
no. 3, pp. 20-24
42 C. K. Magar and B. K. Kar, Tea Plantations and Socio-Cultural Transformation: The Case of Assam, India Space and Culture, Volume
4, Number 1, 2016
Study of Assam tea value chains Page 12A new (export-oriented) industry was born out of strong and forceful intervention of the British
administration, which in turn created a chain of activities that involved planting, plucking, withering,
fermenting, curing, processing, packing, transporting and auctioning of tea controlled by British companies
that continued to operate even after India gained independence in 194743. During this period, tea drinking
was promoted in Great Britain by the nascent tea industry, highlighting the health benefits of consuming
tea through promotional campaigns that have left a permanent mark for generations of tea drinkers in
both countries that continue to provide a market for the industry even today44.
After independence, the Indian government realised the potential of tea, both in terms of domestic
market and export earnings, but also that this potential could not be realised since the industry was
largely in the hands of British companies and agents. As a result, the government subjected the industry to
heavy regulations through the creation of the “Tea Board of India”. It is a statutory body set up under the
Tea Act, 1953, to promote the Indian tea industry which comes under the administrative control of the
Ministry of Commerce and Industry, Department of Commerce. It comprises of 31 members drawn from
parliamentarians, planters, tea companies, exporters and trade union representatives. It has certain
regulatory functions such as issue of Exporters’ License, Tea Waste License and Tea Warehousing License.
The Tea Board takes many initiatives to promote tea market, tea production and improve the quality of
green leaves and made tea, including through subsidies to tea cultivation. 45
Today, the industry employs three million people and contributes around 3% of Indian GDP46. In 2017-18,
the Indian tea industry recorded its highest ever production as well as export figures:
- the total tea production was 1.325 million tonnes, an increase of 74,500 tonnes (+6%) compared
to the previous year47.
- The total quantity of tea exported stood at 256,000 tonnes (an increase of 13% compared to
2016-17), corresponding to a value of 786 million USD48.
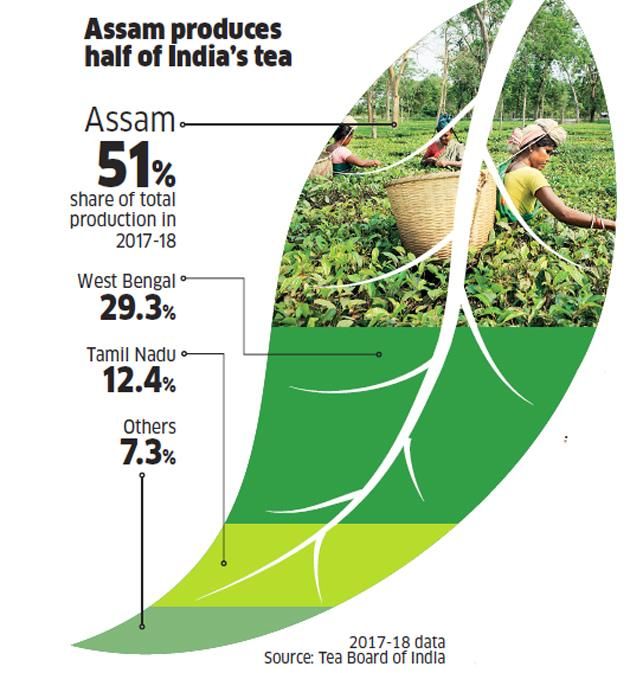
Fig. 10 Tea production per region in India
Source: Economic Times of India, based on data from Tea Board of India
43 Roy, Achinto 2013, An Institution based insight into India’s Tea Industry, Academy of Taiwan Business Management Review, vol. 9,
no. 3, pp. 20-24
44 Ibid.
45 Ibid.
46 U. Talukdar and C. Hazarika, Production and Export of Value-Added tea in India and its Global Competitiveness, Economic Affairs,
Vol. 62, No. 4, pp. 705-710, December 2017
47 http://www.teaboard.gov.in/pdf/Press_Release_on_Exports_pdf9752.pdf accessed on 28 March 2019
48 Ibid.
Study of Assam tea value chains Page 13India produces some of the world’s finest teas thanks to the diversity of its microclimates. Due to soil and
climatic requirements, tea cultivation is confined to certain parts of the country, mainly in the states of
Assam, West Bengal, Tamil Nadu and Kerala (80% of total harvest is accounted by Assam & West Bengal).
In these regions, tea farm ownership is fragmented: large-size plantations account for roughly 20% of the
total number of tea producers while some 80% of the farms have less than 8 hectares49. These small tea
growers have seen their contribution rising in recent years: between 2014-15 and 2017-18, their share of
India’s tea production has risen from 34% to 47%50.
The plantation sector (all privately owned) takes its roots in the British colonial period and constitutes a
strong network of capital assets. It relies on the Plantation Labour Act for its operation and regulation.
Each plantation manages internally on its own the quality of green leaves, the production of ‘made tea’, as
well as its economic and social responsibilities towards workers in the field51. The sector comprises both:
- large branded tea companies such as Hindustan Lever and Tata Global Beverages, who used to
vertically integrate the whole chain, from owned estates to branding, packaging and marketing.
In recent years, they have decided to focus on downstream activities and sell their plantations to
large groups which focus on tea cultivation and first processing such as Mc Leod Russel. 52
- medium-size, independent tea plantations who have historically been excluded from compulsory
sale through the auction system and allowed to trade their tea “under the garden name” directly
to the buyers’ blending and packing factories in consuming countries. 53
The rest of the production is made by small tea growers who have been operating in India since the 1970s,
thanks to government programmes encouraging smallholders to convert from vegetable production for
domestic markets to tea cultivation especially for export. But it is the crisis of tea prices on the world
market in the 2000’s that has spurred their development54. The resulting development of new value
chains involving small tea growers selling to Bought Leaf Factories (BLF) is one of the most important
changes in the history of the tea industry in India. Their integration into tea markets through a loosely
coordinated value chain of the “arm’s length” kind has started to create a new paradigm by putting
forward low cost of production in terms of workforce and technology55.
In parallel, the old colonial model of production has been called into question following the crisis of tea
prices in 2005, and the failure of tea estates to meet yield targets and maintain the quality of produced
tea,: some estates were closed and abandoned, triggering a withdrawal of major companies from tea
production, and their concentration on downstream market operations56. In particular, Tata and
Hindustan Lever who used to be among the largest owners of tea plantations in India sold most of their
estates in North India – especially in Assam - to McLeod Russel which became the largest tea producer in
the world57 (it currently owns 32 estates in India, following a strong move of disinvestment whereby it
sold 20 estates in the year 201858). As a consequence, it is estimated that Tata and Hindustan laid off
24,000 and 12,000 workers respectively who lost their jobs59. In parallel to this transformation, a specific
participatory management in tea cultivation was put in place in South India60.
49 K. B. Vijaybhai, P. D. Jayeshkumar et al., Analysis on Indian Tea Industry, V.M.Patel Institute of Management. Ganpat Univ., 2014
50 https://economictimes.indiatimes.com/industry/cons-products/food/indias-tea-industry-is-struggling-to-move-up-the-value-
chain/articleshow/65456045.cms?from=mdr accessed on 30 March 2019
51 Saji M Kadavil, Indian Tea Research, 2007
52 Marianne Nylandsted Larsen, Sustaining Upgrading in Agricultural Value Chains? State-Led Value Chain Interventions and Emerging
Bifurcation of the South Indian Smallholder Tea Sector, Sustainability 2016, 8, 1102
53 Ibid.
54 Saji M Kadavil, Indian Tea Research, 2007
55 Marianne Nylandsted Larsen, Sustaining Upgrading in Agricultural Value Chains? State-Led Value Chain Interventions and Emerging
Bifurcation of the South Indian Smallholder Tea Sector, Sustainability 2016, 8, 1102
56 Ibid.
57 Ibid.
58 https://www.thehindubusinessline.com/companies/after-selling-6-tea-estates-for-23232-crore-mcleod-russel-halts-its-asset-sale-
plan/article25030751.ece accessed on 30 March 2019
59 M. Groosman, Tea Sector Overview, IDH, 2011 and IUF-FIAN-Misereor, Harvesting Hunger: Plantation Workers and the Right to
Food, 2014
60 Saji M Kadavil, Indian Tea Research, 2007
Study of Assam tea value chains Page 14At the processing stage, the 2 main operators are Hindustan Lever (subsidiary of Unilever) and Tata Global
Beverages Ltd (TGBL) which both account for almost 60% of all tea sales in the country. As disposable
incomes have risen in both urban and rural parts, more Indian consumers were able to make the switch
from unbranded products to the brands owned by these two operators: Tata, Brooke Bond and Lipton. 61
Fig. 11 Tea production per grade of processing.
Source: Economic Times of India, based on data from Tea Board of India
The bulk of today’s Indian manufactured tea is of granular grade: 90% is made through the machine-based
Crush-Tear-Curl (CTC) process62. The tea obtained from this CTC manufacturing is less costly to process
and sold in the mass market. It has a stronger flavour tending toward the bitter side and is usually
consumed with milk63. On the higher end, the more expensive Orthodox varieties are whole-leaf teas
which are hand-processed to wither and roll tea leaves which account only for 8.4% of Indian
production64. Teas of such higher grades emanate more subtle and multi-layered flavours are usually had
without adding milk65. The rest of Indian production is green tea, which represents a mere 1.5% of the
volume produced.66
Prices vary greatly, depending on the grade of tea and region of production: Assam CTC tea is only valued
at around Rs 150 per kg while Orthodox tea from Assam can on an average fetch at Rs 500 per kg, and
prime Darjeeling orthodox commands prices that can reach three times higher, i.e. Rs 1500 per kg and
above.67
Trade and labour relations in the India tea sector, and related challenges
The British colonial tea plantation model has been established based on scientific and economic devised
methods for the ‘improvement’ of India’s landscapes and populations68. Calculating and translating labour
costs across space were central to this colonial project. The Indian tea plantation complex was thus
61 https://economictimes.indiatimes.com/industry/cons-products/food/now-more-indians-prefer-to-have-tea-with-small-brands-like-
wagh-bakri-amar-tea/articleshow/59260789.cms?from=mdr accessed on 28 March 2019
62 https://economictimes.indiatimes.com/industry/cons-products/food/indias-tea-industry-is-struggling-to-move-up-the-value-
chain/articleshow/65456045.cms?from=mdr accessed on 30 March 2019
63 Ibid.
64 https://economictimes.indiatimes.com/industry/cons-products/food/indias-tea-industry-is-struggling-to-move-up-the-value-
chain/articleshow/65456045.cms?from=mdr accessed on 30 March 2019
65 Ibid.
66 https://economictimes.indiatimes.com/industry/cons-products/food/indias-tea-industry-is-struggling-to-move-up-the-value-
chain/articleshow/65456045.cms?from=mdr accessed on 30 March 2019
67 https://economictimes.indiatimes.com/industry/cons-products/food/indias-tea-industry-is-struggling-to-move-up-the-value-
chain/articleshow/65456045.cms?from=mdr accessed on 23 March 2019
68 Sarah Besky, Tea as Hero Crop? Embodied Algorithms and Industrial, Reform in India, Science as Culture, 2016
Study of Assam tea value chains Page 15developed through the careful classification of people, plants, taste and landscapes into neat and
supposedly natural categories, represented in numbers69.
The creation of these standardized systems was paralleled by the establishment of brokerage procedures
in centralized auctions which channel 2/3 of Indian tea production70. Their functioning is based on a
complex method for preparing, smelling, touching, and tasting tea: from weighting tea samples with a
bronze balance to arranging ceramic cups on long, narrow, tea-stained tables, then smelling each tea with
the nose before tasting the tea through partial ingestion and finally describing the tea’s qualities using a
pre-set array of adjectives not unlike those used by wine sommeliers71. Each broker has a tasting specialty.
Some focus on malty Assams, others on muscatel Darjeelings, and others on the tannic cut–tear–curl teas
produced throughout the Northeast and drunk across Indian homes72.
But regardless of region, the embodied method for tea’s valuation takes the same form. These brokers are
very concentrated as they must be registered with the Tea Board which has historically limited the
number of auction houses where tea can be sold. This is best illustrated by the 4 registered brokers at
Calcutta: J. Thomas & Co. (the world’s largest tea broker, which handles 40% of all tea auctioned in India),
Contemporary Brokers and Eastern Tea73. As a result of this concentration, there is a strong assumption
that brokers often push down the price in the auction, in coordination with large buyers (tea
manufacturers and brands) 74.
Whereas the work of determining price is one of product differentiation, the work of determining labour
costs on tea plantations has always been one of standardization75. Labour costs include:
- workers’ daily monetary wages, which are a matter of state-by-state concern. They are
determined through tripartite negotiations (and sometimes bipartite in the past) between
workers (represented by unions), planters (represented by guild-like regional associations), and
the government (represented by the Labour Department of each Indian state). By law, planters
cannot pay less than the state-set wage. 76
- the ‘social costs’ associated with tea production as outlined in the national-level Plantations
Labour Act of 1951, which include housing, food rations, medical facilities, latrines, and primary
schooling for laborers’ children. 77
Through the combination of these monetary and in-kind payments, the living condition of each worker is
thus accounted for in a uniform fashion, although brokers and tasters at auctions make fine gradations
between flavours, ages, and provenances of the tea they produce. 78
Whereas tea has played a vital role in the national economy, providing sectoral employment in remote
and poor rural areas, yet tea plantation labour wages are the lowest of the organised sector in the
country79. Cash wages are still typically determined based on piece-rates, i.e. calculated by the amount
plucked, instead of working time (with a minimum volume to be picked which is related to a defined daily
wage). In addition, most tea workers are not employed upon a long-term labour contract, but on less
stable conditions: to a large degree, casual work is the norm in tea production today (on estimate, about
69 Ibid.
70 Ibid.
71 Ibid.
72 Ibid.
73 https://web.facebook.com/236193093072118/posts/j-thomas-courl-wwwjthomasindiacomif-you-look-up-the-internet-or-read-
about-jthom/1106178979406854/?_rdc=1&_rdr and
https://finalstepmarketing.com/wp-content/uploads/2015/07/UK_TEA_market.pdf accessed on 24 March 2019
74 Saji M Kadavil, Indian Tea Research, 2007
75 Sarah Besky, Tea as Hero Crop? Embodied Algorithms and Industrial, Reform in India, Science as Culture, 2016
76 Ibid.
77 Ibid.
78 Ibid.
79 E. M. Biggs et al., The tea landscape of Assam: Multi-stakeholder insights into sustainable livelihoods under a changing climate,
Environmental Science and Policy 82 (2018) 9–18
Study of Assam tea value chains Page 1650% of workers are casual in the Indian tea sector)80. The majority of these employees are women (harvesting, generally referred to as plucking, is carried out almost exclusively by female workers, while male workers are employed for pruning, applying agrochemicals and hauling heavy loads)81, because women are perceived as more able to engage in “quality” picking of tea leaves and have historically be seen as central to the need to “populate” the tea plantation workforce82. Furthermore, tea plantations are not just economic production units, but rather social institutions, controlling the lives of their resident work force to a large extent. Low cash wages supplemented by “social benefits” are one of the enduring legacies of the colonial system, which has defined many aspects of plantation work and life83. 70 years after India’s independence, tea workers are still dependent on tea plantations for their basic needs (food, water, housing…) as they live and work in an enclave84. Despite generations having lived in the same estate and same house for generations, most tea workers have still not been given any right to their homestead. They can be evicted at any moment by the management from their houses if they protest about their conditions of work or wages85. Thus, while men may migrate to better paid jobs, one or more of the women continue to work on the estate, just to retain possession of the house, which can be described as bonded labour86. Outside tea plantations, small tea growers which are on the rise. While a small minority of smallholders has been integrated into high-margin markets through prominent BLFs, a mass of “others” lay outside these opportunities, being trapped in tightly coordinated tea value chains87. They are most often economically and socially vulnerable as they are marginal farmers, Dalits or from tribal communities. Many of them do not possess rights over the land they cultivate88. Though the quantity of tea produced by small tea growers has increased over time, the profit accruing to them is very limited, because of their inability to access the market directly and their low price-realisation due to poor quality and inefficient production structures89. In some states like Assam, a minimum price for green leaves has been defined per district. It provides some sort of safety net to the small tea growers, but does not take into account the costs of production and their evolution, as it is calculated as a percentage of the auctioned price In this context, a new vision called “Tea 2030” has started to emerge, mainly promoted by major tea brands and manufacturers such as Tata Global Beverages and Hindustan Lever90. They consider the plantation and auction system as inefficient anachronisms and purport to replace this ‘linear supply chain’ (on which bodies are hierarchically arranged) with a ‘value network’ based on a model of worker empowerment – especially women - in which workers become part-owners of plantations and smallholders selling green leaf to centralized factories gradually become the norm91. However, the capacity of this new dynamic to address the social challenges faced by the Indian tea industry is questioned as it does not aim to balance the high asymmetries in negotiation power along the tea chain in India which have been perpetuated since the creation of this industry in the country92. 80 IUF-FIAN-Misereor, Harvesting Hunger: Plantation Workers and the Right to Food, 2014 op. cit. 81 K. B. Vijaybhai, P. D. Jayeshkumar et al., Analysis on Indian Tea Industry, V.M.Patel Institute of Management. Ganpat University, 2014 82 Ibid. 83 IUF-FIAN-Misereor, Harvesting Hunger: Plantation Workers and the Right to Food, 2014 op. cit. 84 Global Network for the Right to Food and Nutrition, A life without dignity – the price of your cup of tea, Abuses and violations of human rights in tea plantations in India, Fact-finding mission report, May 2016 85 Ibid. 86 Ibid. 87 Marianne Nylandsted Larsen, Sustaining Upgrading in Agricultural Value Chains? State-Led Value Chain Interventions and Emerging Bifurcation of the South Indian Smallholder Tea Sector, Sustainability 2016, 8, 1102 88 Ibid. 89 Ibid. 90 Sarah Besky, Tea as Hero Crop? Embodied Algorithms and Industrial, Reform in India, Science as Culture, 2016 91 Ibid. 92 Ibid. Study of Assam tea value chains Page 17
Specificities of the Tea sector in Assam

Tea production in Assam and related challenges
As described earlier, Assam is home to the Indian native variety of tea and is the largest tea producing
region in the country. The total area under tea cultivation is roughly 312, 000 hectares, mainly situated in
the regions of Cachar, North Bank, South Bank and Upper Assam (see map below) 93. The volume produced
was almost 676,000 tonnes in 2017-18, accounting for more than 50% of the total national production.

                                      Fig. 12 Main tea producing regions in Assam
                 Source: J.M.A. Duncan et al. Observing climate impacts on tea yield in Assam, India, 2016

Assam is one of Indian’s states facing the biggest social challenges: it has a largely rural population (almost
86% of inhabitants) which suffers from a high unemployment rate of 12.6% (compared to roughly 4% at
national level) and a growing casualization of labour conditions94.

In this context, tea has always played a pivotal role in state livelihood security, particularly since the
industry is largely non-mechanized. Historically, tea plantations were very large (over 100 hectares in size)
and restricted only to British entrepreneurs, local Assamese people being forbidden from engaging in tea
cultivation, except as workers95. In the early 1970s, both the Government of India and the Assam State
Government abolished barriers to entry: Soneswar Bora (State Minister for Agriculture in 1978), is
credited with efforts to popularize small tea holdings to make use of the state’s fallow land and provide
employment opportunities for the rural youth96. Since then, the number of small tea growers – i.e. with
farms smaller than 10.2 Ha – has jumped from 657 in 1990 to over 84,000 today (compared to 850 tea
estates)97.

93 Global Network for the Right to Food and Nutrition, A life without dignity – the price of your cup of tea, May 2016
94 C. Idicheria, Okapi and Mercy Corps, Risk and resilience in Assam’s tea industry, October 2017
95 Ibid.
96 Ibid.
97 Global Network for the Right to Food and Nutrition, A life without dignity – the price of your cup of tea, May 2016 and C. Idicheria,
Okapi and Mercy Corps, Risk and resilience in Assam’s tea industry, October 2017

Study of Assam tea value chains                                                                                                     Page 18
PROCESS ACTORS
1. Tea planting
Small Tea
Workers
Growers
2. Plucking/harvesting
Large Tea
3. Collection/transport Estates
Agents
of green tea leaves
Bought Leaf
4. Processing Factories
5. Sale or auction Brokers/intermediaries
Fig. 13 Tea production process in Assam
Source: C. Idicheria, Okapi and Mercy Corps, Risk and resilience in Assam’s tea industry, October 2017
The rapid emergence of small tea growers in Assam has transformed the ways in which the sector is
organized: processes that used to be exclusively housed in single large tea estates are now disaggregated
between small tea growers (STG) who supply green leaves through agents to “Bought Leaf Factories” (BLF)
and tea estates which consolidate volumes from a (large) number of STGs and take in charge the
processing and marketing of the product (see previous graph)98. Quality assurance is hard to control in this
process of mass collection and transportation, which has pushed several private institutions to develop
training programs to help small tea growers improve their cultivation practices and regulate the use of
chemicals to meet industry standards99.
In economic terms, the Assamese small tea growers (STGs) are significantly more exposed to the high
price fluctuations on the tea market, with severe consequences on the income and living conditions of
their families100. Indeed, only a few large estates have sufficient financial reserves to produce in-house
high-quality orthodox tea, leaving STGs as the main providers of green leaves for low-quality CTC-
processed tea which floods domestic markets at prices which are directly affected by those of CTC-tea
auctioned in Mombasa (Kenya) at much lower production costs (India exhibiting the highest costs of tea
production in the world)101. A worsening factor, auction and market prices of tea have not kept up with
the rising costs of inputs which have been hard for small tea growers to shoulder (Over the last 10 years,
they have increased at a compounded annual growth rate of more than 10%, while the price of tea has
only increased by 6 to 7%)102.
This profound transformation was further accelerated by the two leading players of the tea sector. In
2005, Hindustan Lever sold all of its plantations in Assam, primarily to McLeod Russel (making it the
largest producer of tea leaf in India but with no retail operation) 103. This sudden and distorted departure
highly questioned its main competitor, Tata Global Beverages which feared it would become
uncompetitive in the face of this move. The company also decided to leave the tea plantation sector, but
its reputational stakes didn’t allow it to cut down operations the way Unilever did104. Instead, Tata opted
for a “voluntary scheme” whereby it granted early retirement to part of the workers and transferred to
the remaining employees a partial ownership of plantations through the sale of shares105. As Tata
plantations in Assam were noticeably expensive and profitable, it brought outside investors to ensure the
viability of the restructuring106. As a result, 21 Tata estates were integrated in a new company called
Amalgamated Plantations Private Limited (APPL) of which Tata owns 19% of shares107.
98 C. Idicheria, Okapi and Mercy Corps, Risk and resilience in Assam’s tea industry, October 2017
99 Ibid.
100 Ibid.
101 Ibid.
102 Ibid.
103 Human Rights Institute of Columbia Law School, The More Things Change ..., January 2014
104 Ibid.
105 Ibid.
106 Ibid.
107 M. Rao, A Bitter Brew: Business Accountability for Human Rights Violations in the Assam Tea Supply Chain, Wageningen University,
February 2018
Study of Assam tea value chains Page 19Whereas these transformations have strongly impacted the business dynamics within the Assamese tea
sector, it made little difference to the situation of workers. Indeed, labour practices in Assam have
remained almost the same for the past two centuries108. Their origin lies in the British colonial times when
permanent tea workers were forcibly brought in Assam at the end of the 19th century from other states,
primarily from tribal communities in central India, because they posed fewer risks of conflicts to
employers than native Assamese workers109. They found themselves immobilized within the spatial
confines of plantation enclaves. As a result, today’s workers on large tea estates are mostly descendants
of these migrant families, and collectively referred to as “coolies” or members of “tea tribes” 110. This is
further combined with a strict hierarchy among employees based on ethnic, linguistic and caste
differences: workers are almost invariably Adivasi (indigenous who don’t get recognition nor entitlements
as per the Scheduled Tribes provisions as they were brought away from their original States), staff are
Ahom locals (upper caste), and managers come from outside the region (often West Bengal or Punjab)111.
In this context, numerous researches document the widespread nature of labour rights violations on tea
estates in Assam. In September 2015, a BBC investigation on Assamese tea estates revealed severe
working and living conditions on several of plantations, among which estates owned by McLeod Russel112.
On the research side, two recent extensive studies conducted in Assam, one by the Human Rights Institute
of Columbia Law School (published in 2014113) and another by the Global Network for the Right to Food
and Nutrition’s (published in 2016114) revealed the extent of rights violations on Assamese tea estates, as
reported by the hundreds of workers interviewed:
- Insecurity of tenure, housing and living conditions: cases of land dispossession by the
management of tea estates, lack of access to electricity, lack of maintenance of living quarters,
ceilings rotting and flooding of houses115
- Low wages and bas working conditions: cases of no resting time during working hours, time of
travel not taken into account, increase of the quantity of tea to be picked to achieve the
minimum wage, wage deductions, lack of equipment116
- Breach of maternity rights: infringement of maternity leave duration, inadequate prenatal and
postnatal care as well as access to day-nurseries117
- Exposure to pesticides: absence of pesticide labels or instructions for use (all the more than most
workers are illiterate), absence of storage precautions, absence of training on pesticides use
apart from supervisors, absence, inadequacy and lack of repair of personal protective equipment,
pesticide spillage, water pollution. These infringements were associated with health problems
reported by workers: skin irritation, nausea, vomiting, headache, eye burns, muscle pain…118
- Lack of essential services: lack of access to quality health care throughout the sector (especially
for temporary workers), high costs of medical services, low quality of education services,
insufficient food rations, cases of malnutrition and anaemia among workers’ children, lack of
drinkable water (quantity & quality), cases of diarrhoea and cholera…119
A worsening factor is the increasing incidence of informal or casual workers in an industry that has
historically been formal120. These informal workers do not receive the same legal entitlements, suffer from
irregular sources of income, face higher risks of being laid off and are less unionized, thereby widening
inequality gaps among workers who are engaged in the same tasks and have similar livelihood concerns121.
108 Human Rights Institute of Columbia Law School, The More Things Change ..., January 2014
109 M. Rao, A Bitter Brew: Business Accountability for Human Rights Violations in the Assam Tea Supply Chain, Wageningen Uni, 2018
110 Ibid.
111 Human Rights Institute of Columbia Law School, The More Things Change ..., January 2014
112 Cividep India, Tainted Tea: Slave Labour in your Cuppa?, May 2016
113 Human Rights Institute of Columbia Law School, The More Things Change ..., January 2014
114 Global Network for the Right to Food and Nutrition, A life without dignity – the price of your cup of tea, May 2016
115 Ibid.
116 Ibid.
117 Ibid.
118 Ibid.
119 Ibid.
120 C. Idicheria, Okapi and Mercy Corps, Risk and resilience in Assam’s tea industry, October 2017
121 Ibid.
Study of Assam tea value chains Page 20Even the progressive initiative taken by Tata in partnership with the International Finance Corporation
(IFC, member of the World Bank Group) is not immune to these social challenges: the model of tea
plantation with shared-ownership of workers they installed through the creation of APPL has also been
the subject of serious allegations of wages below the minimum wage, inadequate living conditions,
obstruction to freedom of association and lack of risk prevention regarding the use of pesticides as
documented by the World Bank’s CAO (Office of the Compliance Advisor Ombudsman). 122
Finally, on the environmental side too, the stakes are high. Tea in Assam being closely linked to
environmental and climatic conditions, it is hence vulnerable to climate. According to the Tocklai Tea
Research Institute, Assam recorded a 1.3˚C increase in temperatures over the last century, and more
recently a steady increase in the number of days with temperatures above 30˚C, erratic rainfall patterns
and increased periods of drought123. These changes in climate creates conditions that usher in new pests
like Heliopeltis thievora or mosquito bugs which destroy tea shoots, and ultimately reduce crop
productivity. In recent years, tea gardens have reported an alarming increase in pest attacks, with existing
pesticides proving to be increasingly ineffective124. As a result, tea growing areas in Assam could drastically
reduce by 2050 if certain climate mitigation or adaptation strategies are not implemented (tea production
could decline of up to 40% by 2050 due to climate change)125.
Ability of workers and small farmers to earn a living wage/income
Fig. 14 Income breakdown of tea workers in Assam
Source: Department of Economics of the Indian Institute of Technology in Guwahati, June 2014
A study commissioned by Oxfam and Ethical Tea Partnership demonstrated that the net wage earned by
tea pluckers in Assam in 2013 fell just above the World Bank extreme poverty line of 1.25 USD per day,
corresponding to 73 INR per day126. The following year, two PhD candidates from the Department of
Economics of the Indian Institute of Technology in Guwahati analysed pay slips from tea workers from
APPL in Assam (a specific case where there are deductions for equity from the workers) which showed
that their gross wage was 90 INR per day, and their net wage was lowered down to only 70 INR per day
122 CAO, « Investigation of IFC environmental and Social Performance in relation to: Amalgamated Plantations Private Limited (APPL),
India », 2016.
123 Ibid.
124 Ibid.
125 Ibid.
126 Oxfam-ETI, Understanding wage issues in the tea industry, 2013
Study of Assam tea value chains Page 21after company deductions for electricity and fuel, food rations, equity and provident fund127. This salary is
significantly below the minimum wage of 177 INR per day (2.67 USD), a situation which has been
challenged in court by tea growers’ associations. According to the study commissioned by Oxfam, workers
also receive additional in-kind benefits128 that equal to roughly 80% of the net cash wage they receive129.
Based on this work of the Department of Economics of the Indian Institute of Technology, we consider
that a conservative estimate of the total wage earned by workers in Assam is 126 INR per day in 2013,
including both cash pay and in-kind entitlements. This corresponds to 153 INR per day in 2017 when
taking into account the Indian inflation since 2013.
Fig. 15 Income breakdown of tea workers in Assam
Source: Department of Economics of the Indian Institute of Technology in Guwahati, June 2014
Still in 2014, two PhD candidates from the Department of Economics of the Indian Institute of Technology
also calculated the fair living wage for tea plantation workers per day, based on wage calculation
standards established by the Tripartite Committee of the 15th Indian Labour Conference in 1957 and in
later directives from the Supreme Court of India130. This baseline estimate conducted in 4 districts in
Assam calculated the living wage that would enable tea workers to meet the fundamental needs of their
family based on the costs to purchase essential goods and services on the market, i.e.:
- food needed to feed a family of 2 adults and 2 children based on a diet of 2700 calories per day
and per person
- clothing based on 72 yards of cloth per person and per year
- fuel and electricity
- housing
- essential services, i.e. children’s education, medicare, marriage and retirement
127 Cividep India, Tainted Tea: Slave Labour in your Cuppa?, May 2016
128 The Plantations Labour Act, 1951 is a national act applicable to all plantations in India and is administered by State Governments It
specifies a number of health and welfare benefits that plantations must provide: housing, medical facilities, canteens, creches,
education, rations & dry tea, firewood & fuel
129 Ibid.
130 Cividep India, Tainted Tea: Slave Labour in your Cuppa?, May 2016
Study of Assam tea value chains Page 22You can also read