Retail Sector Market Entry Guide - Vietnam - Prepared by Dezan Shira & Associates - Enterprise ...
←
→
Page content transcription
If your browser does not render page correctly, please read the page content below
0.787401570.78740157

Retail Sector
Market Entry Guide -
Vietnam
Prepared by Dezan Shira & Associates

Information accurate as of March 2018
0.787401570.78740157

Executive Summary ...................................................................................................................................... 3
1. Vietnam Overview..................................................................................................................................... 5
   1.1 Key facts and figures about Vietnam .................................................................................................. 5
   1.2 Regional overview ............................................................................................................................... 8
   1.3 Country Profile .................................................................................................................................. 10
   1.4 Consumption ..................................................................................................................................... 13
2. Market Overview of Retail sector ............................................................................................................ 17
   2.1 Introduction ....................................................................................................................................... 17
   2.2 Size of the sector .............................................................................................................................. 18
   2.3 Specificities of the sector .................................................................................................................. 20
   2.4 Market Trends ................................................................................................................................... 24
   2.5 Key Growth Drivers – Future Outlook ............................................................................................... 28
3. Market Entry Models ............................................................................................................................... 31
   3.1 Market Entry Channels – Profile ....................................................................................................... 31
   3.2 Market Entry Channels ..................................................................................................................... 32
   3.2 Partner Selection............................................................................................................................... 33
   3.3 Locating Partners in Vietnam ............................................................................................................ 34
   3.4 Enterprise Singapore’s Plug and Play Network ................................................................................ 35
4. Regulatory and Legal framework ............................................................................................................ 36
   4.1 Introduction ....................................................................................................................................... 36
   4.2 Regulatory & Legal environment of the sector .................................................................................. 36
   4.3 Relevance of Free Trade Agreements (TPP, ASEAN) for the sector ............................................... 40
   4.4 Different retail market entry forms for Singapore SME’s: ................................................................. 49
5. Market Conditions for SMEs ................................................................................................................... 51
   5.1 Potential challenges/trade barriers for SME’s in the specific sector ................................................. 51
   5.2 Opportunities for SME’s in the specific sector .................................................................................. 52
6. Market Entry Checklist ............................................................................................................................ 55
7. Contact Information……………………………………………………………………………………………...
0.787401570.78740157

Executive Summary
One of Southeast Asia’s fastest growing consumer markets, Vietnam has all the favorable conditions for the
expansion and growth of the retail sector: an impressive GDP growth rate, political stability, a young population,
a rising middle class, increasing disposable incomes, fast-paced urbanization, rising living standards, a high
literacy rate, and a strategic location.

Fuelled by a rapid economic growth and increased FDI, 2017 emerged as one of the strongest years for
Vietnam. With GDP growing at 6.81 percent, record high foreign direct investment (FDI), and trade volume
reaching an all-time high of US$400 billion, the country is forecast to continue growth into 2018 and beyond. In
the retail sector, the wholesale and retail segment grew by over eight percent in 2017, driven by a growing
middle class, young population, and rise in disposable incomes. Geographically speaking, South Vietnam,
which has one of the highest income per capita in the country, will continue to lead among other regions,
contributing the most to the national economy.

Last year, retail industry sales reached US$129 billion, growing by 10.9 percent, compared to 2016. This rise
has largely been attributed to the entry of foreign retailers, easing of investment regulations, and a rise in
consumer spending. Vietnam continues to remain among the top 10 destinations for retail investment, and will
continue to retain its rankings in the next decade. Traditional retail channels continue to lead by the number of
stores and sales contribution, however, modern retail channels, especially mini-marts and convenience stores
have grown rapidly in the last five years. Modern retail channels are predicted to account for almost half of the
market by 2020. In addition, e-commerce retailing which is at a nascent stage as of now has shown remarkable
growth in the 2017, growing by 25 percent. By 2020, the e-commerce channel is forecast to account for 5
percent of the total market.

As for the government - numerous investor-friendly reforms were implemented in 2017, in areas such as
market-entry regulations, establishment procedures, and development of intermediary payment systems. These
reforms has not only benefitted the existing players in the markets, but also made it easier for retailers who are
planning to invest in Vietnam, one of the most attractive retail markets in the world.
0.787401570.78740157

List of Abbreviations
AANZFTA     ASEAN-Australia-New Zealand Free Trade Area
ACFTA       ASEAN China Free Trade Area
AFTA        ASEAN Free Trade Area
AIFTA       ASEAN–India Free Trade Area
AJCEP       ASEAN – Japan Comprehensive Economic Partnership
AKFTA       ASEAN Korea Free Trade Area
ASEAN       Association of Southeast Asian Nations
ATIGA       ASEAN Trade in Goods Agreement
CBD         Central Business District
CPTPP       Comprehensive and Progressive Agreement for Trans-Pacific Partnership
DPI         Department of Planning and Investment
ENT         Economic Need Test
EU          European Union
EVFTA       EU-Vietnam Free Trade Agreement
FDI         Foreign Direct Investment
FMCG        Fast-Moving Consumer Goods
FOE         Foreign Owned enterprises
FTA         Free Trade Agreement
GDC         General Department of Customs of Vietnam
GDP         Gross Domestic Product
GRDI        Global Retail Development Index
GSO         General Statistics Office of Vietnam
IP          Intellectual Property
JSC         Joint Stock Company
JVE         Joint Venture enterprises
LLC         Limited Liability Company
LOE         Law on Enterprise
LOI         Law on Investment
MIGA        Multilateral Investment Guarantee Agency
MOIT        Ministry of Industry and Trade
MPAC        Master Plan on ASEAN
RCEP        Regional Comprehensive Economic Partnership
SME         Small and medium-sized enterprises
TPP         Trans-Pacific Partnership
TRIPS       Trade-Related Aspects of Intellectual Property Rights
VND         Vietnamese Dong
WFOE        Wholly Foreign Owned Enterprise
WTO         World Trade Organization
0.787401570.78740157

1. Vietnam Overview
In the last 10 years, Vietnam has emerged as one of the fastest growing global economy. Largely driven by
investor-friendly government policies, young demographic, rise in urbanization, growing consumer spending,
and foreign investment, Vietnam’s is projected to grow annually around seven percent in the next few years.
However, the country has seen economic development only in a few provinces and cities, and the government
is trying to introduce investment policies focusing on less developed areas.

Sector wise, agriculture continues to dominate the country’s employment share, however services and
industry/construction sectors have increased their share in the country’s GDP. In terms of employment,
Vietnam’s employment rate has steadily dropped in the last few years, which highlights the growing need for
workforce in the economy.

Being a single party country, Vietnam has managed to maintain its political stability, which has hugely benefited
the economy, especially with regards to policy implementation, expanding diplomatic relations, and attracting
foreign investments. However, more needs to be done with respect to policy development as foreign investors,
especially from Asia continue to see Vietnam as one of the best investment destinations.

1.1 Key facts and figures about Vietnam
Population
Size
According to the General Statistics Office (GSO) of Vietnam, Vietnam’s population was estimated at 93.7 million
in 2017.1

Male population was 46.2 million, accounting for 49.3 percent; female population was 47.5 million, accounting
for 50.7 percent.

Employed laborers aged 15 years and above in 2017 in urban areas accounted for 31.9 percent and those in
rural areas held 68.1 percent.

Growth rate
In 2017, Vietnam’s population grew by 1.07 percent as compared to 2016 to 93.7 million.
From 2014 to 2017, the average population growth was 1.075 percent.

Age structure

    Age Group2              Share in total             Male                       Female
                            population (2017 est.)
    0-14 years              23.55%                     11,909,326                 10,735,324
    15-24 years             16.22%                     8,098,019                  7,509,021
    25-54 years             45.56%                     22,087,095                 21,719,615
    55-64 years             8.55%                      3,798,928                  4,419,837
    65 years and over       6.12%                      2,281,923                  3,601,075

Urbanization
Urban population stood at 32.9 million, accounting for 35.1 percent, while rural population stood at 60.8 percent,
accounting for 64.9 percent.

1   www.gso.gov.vn
2   https://www.indexmundi.com/vietnam/demographics_profile.html
0.787401570.78740157

GDP

Growth rate
In 2017, Vietnam’s GDP grew by 6.81 percent. It increased by 5.15 percent in the first quarter; 6.28 percent in
the second quarter; 7.46 percent in the third quarter; and 7.65 percent in the fourth quarter. 1
For 2018, the government is targeting a GDP of 6.7 percent.

Per Capita
The 2017 nominal GDP stood at VND 5,008 trillion (US$221 billion).
GDP per capita was estimated at 53.5 million VND dongs, equivalent to US$2,385, an increase of US$ 170
compared to that in 2016.1

Sector contribution
In 2017, the services sector contributed the highest to the GDP, accounting for 41.32 percent, followed by
industry and construction at 33.34 percent, and agriculture, forestry, and fisheries at 15.34 percent.

In 2017, the fishery gained the highest growth rate of 5.54 percent, while forestry industry grew by 5.14 percent.
The agriculture sector grew by 2.07 percent.

In the industrial and construction sector, the industrial sector grew by 7.85 percent. Manufacturing sector grew
the fastest in seven years at 14.40 percent. The mining and quarrying industry declined by 7.10 percent. The
construction sector maintained its growth at 8.70 percent

In the services sector, wholesale and retail sales increased by 8.36 percent in 2017. Accommodation and
catering services grew by 8.98 percent, while financial, banking and insurance activities rose by 8.14 percent.
Finally, the real estate sector grew by 4.07 percent, the highest increase since 2011. 3

FDI

Vietnam’s market ownership structure3

             23.8%
                          35.7%

              40.5%

          State      Non-State    FDI

Total FDI inflows

Total value of newly and additionally registered capital, capital contributed and shares purchased in 2017
reached US$35.88 billion, up 44.4 percent compared to 2016.

3   www.gso.gov.vn
0.787401570.78740157

In 2017, 2,591 new projects attracted registered capital of US$21.27 billion, up 42.3 per cent against last year.
Another US$8.41 billion was added to 1,188 existing projects, 49.2 per cent higher than last year. The
remaining US$6.19 billion was in the form of capital contribution and share purchases, an increase of 45.1
percent compared to 2016.

The disbursed capital hit US$17.5 billion, a 10-year high. The registered FDI capital and disbursed FDI grew by
44.4 percent and 10.8 percent respectively, compared with 2016.3

Top Five Investment Sources

In total, 115 counties and territories invested in Vietnam in 2017. 4

    Top five country and         Registered capital for January 01 to
    geographical territory       December 20, 2017 (US$ million)
    Japan                        7745.8
    South Korea                  3973.3
    Singapore                    3771.8
    China                        1409.7
    Hong Kong                    740.4

Industries for investment

A total of 19 industries and sectors attracted FDI in 2017. The manufacturing-processing industry received the
highest at US$15.87 billion, accounting for 44.2 percent of the total registered FDI.

The electricity production and distribution sector ranked second with US$8.37 billion, representing 23.3 per cent
of the total FDI. The real estate sector was in third place with US$3.05 billion, totaling 8.5 per cent.

Locations for FDI

Ho Chi Minh City attracted the most of FDI with a total registered capital of US$6.5 billion, capturing 18.1
percent of total investment capital. Bac Ninh ranked second with a total registered capital of US$3.4 billion,
accounting for 9.5 percent of total investment capital.

Thanh Hoa ranked third with a total registered capital of US$3.17 billion, accounting for 8.8 percent of the total
investment capital.

4   www.gso.gov.vn
0.787401570.78740157
1.2 Regional overview
Regional Vietnam
The General Statistics Office of Vietnam groups their provinces and cities into eight regions, listed
below:
1. NORTH
a. Red River Delta
b. Northeast
c. Northwest
2. CENTRAL
a. North Central Coast
b. South Central Coast
c. Central Highlands
3. SOUTH
a. Southeast
b. Mekong River Delta
North Central South
Population 33.1 million 25.5 million 34.1 million
(2016)5
GDP growth 8.68% 8.31% 7.25%
GDP
Contribution 31.7% 17.1% 51.2%
(2016)
Number of FDI
Projects (2016) 975 192 1445
Heavy manufacturing Manufacturing Food and
Type of FDI Petrochemicals Seafood, food Beverage
investments processing Retail
IT Pharmaceuticals
Telecommunications Luxury goods
Electronics Manufacturing
Garments Electronics
Employment
rate (2016) 59% 59.3% 56%
Average income
per capita in 2821 (US$ 124.12) 2497 (US$ 109.87) 3641 (US$ 160.20)
Thousand VND
(2016 monthly
est.)6
5 www.gso.gov.vn
6 Exchange rate – 1US$ = 22727.27 VND0.787401570.78740157
Economic Structure (2016)
North (average of 25 provinces and cities)
Agricultur
e, forestry
and
fisheries
Service 20.84%
39.72%
Industry-
Constructio
n 39.03%
Central (average of 19 provinces and cities)
Agriculture,
forestry
and
fisheries
Service 22.46%
40.59%
Industry-
Constructio
n 32.97%
South (average of 19 provinces and cities)
Agriculture,
Service forestry and
33.86% fisheries
34.72%
Industry-
Construction
28.89%0.787401570.78740157 1.3 Country Profile Political situation & outlook Domestic and regional political stability Vietnam is a one-party state run by the Communist Party, which decides all major policy issues. It is one of the more politically stable countries in South East Asia. However, there are strict restrictions on freedom of speech, which can affect the use of internet, particularly social media and blogs. Most official media outlets and news publications are also under the control of the government. In the region, Vietnam along with Singapore, Brunei, Laos, and Cambodia are one of the most politically stable countries. According to the World Bank’s 2016 “Worldwide Governance Indicators,”7 Vietnam ranks the fifth most politically stable country amongst all the ASEAN countries. Diplomatic relations Vietnam is a friendly and reliable partner of all countries in the international community, actively taking part in international and regional cooperation processes. Vietnam foreign policy focuses on developing relations in the principles of respect for each other's independence, sovereignty and territorial integrity, non-interference in each other's international affairs; non-use or threat of force; settlement of disagreements and disputes by means of peaceful negotiations; mutual respect, equality and mutual benefit. As of September 2016, Vietnam maintains diplomatic relationships with 188 nations worldwide. Since the last few years, Vietnam’s foreign policy has been multidirectional, which focuses on expanding diplomatic relations for economic development. This strategy has emerged due to the growing issues of sovereignty and territorial integrity in the region faced by numerous countries, including Vietnam In addition, amid a growth of trade protectionism, Vietnam actively promotes economic, trade and investments across nations in both bilateral and multilateral aspects. Noticeably, Vietnam is one of a few emerging markets to joint CPTPP; and one of two ASEAN members, along with Singapore that have finished FTA negotiations with the EU which is expected to come into force shortly in mid of 2018. 7 http://info.worldbank.org/governance/WGI/#home
0.787401570.78740157

List of FTAs of Vietnam (As of 2017)
 FTAs                                                    Effectiveness status
 RCEP                                                    Under negotiation
 CP-TPP                                                  Under negotiation
 AFTA                                                    Signed and effective
 ASEAN Free Trade area                                   Signed and effective
 ASEAN-China FTA                                         Signed and effective
 ASEAN-Hong Kong, China FTA                              Under negotiation
 ASEAN- Australia & New Zealand FTA                      Signed and effective
 ASEAN- South Korea FTA                                  Signed and effective
 ASEAN- Japan FTA                                        Signed and effective
 ASEAN- India FTA                                        Signed and effective
 Vietnam-EU FTA                                          End of negotiation and Expect to be effective in
                                                         mid-2018
 Vietnam-Chile FTA                                       Signed and effective
 Vietnam-Japan FTA                                       Signed and effective
 Vietnam-South Korea FTA                                 Signed and effective
 Vietnam- Israel FTA                                     Under negotiation
 Vietnam-EFTA                                            Under negotiation
 Vietnam-Eurasian Economic Union                         Signed and effective

Cultural and social peculiarities

Understanding cultural and social peculiarities of a country is key to establish and maintain a strong, mutually
beneficial, and long-term business relationship with the local partners.

Face to face meeting

One of the integral components of the business process in Vietnam is meetings. Unlike Western business
people, Vietnamese counterparts are less dependent on emails and prefer to meet potential partners face-to-
face since this kind of meeting show an appropriate level of respect to the partners. In addition, it is very
important to keep in mind the timeline of making meeting appointments in Vietnam, are as follow:

    o   Making appointments well in advance is not usual, especially for SMEs and high-ranking officials who
        prefer to confirm their attendance to a meeting solely one or two days prior to it.
    o   Business activities slow down for weeks around the Tet holiday. This period is a time to finish all
        business activities incurred during the year and to prepare for Tet, which is the most important
        celebration in Vietnamese culture and often lasts up to 10 to 14 days. Therefore, meetings during this
        period are easily canceled.

Business card exchange

In Vietnam, it is very common to have a business card printed in both Vietnamese and English. Cards should be
given to the oldest person first by both hands with Vietnamese side facing upwards. A brief examination on a
received card before putting it away is also recommended to capture basic information of the card providers.
0.787401570.78740157
Legal framework
To encourage foreign investments, the Vietnamese government has issued several laws to protect foreign
investors including Law on Investment and Law on Enterprise. Generally, foreign enterprises must obtain two
fundamental certificates to do business in Vietnam:
o An Investment Certificate applied to the Department of Planning and Investment in relevant
province/city (Law on Investment No.67/2014/QH13)
o A Business Certificate applied to the Department of Planning and Investment in relevant province/city
(Law on Enterprises No.68/2014)
Additional to that, businesses engaging in goods trading activities and directly related activities must seek a
license from the Ministry of Trade (Decree No.23/2007/ND-CP)
Case 1: With retail establishment Case 2: Without retail establishment
Solely one retail store: Investors are Investors must apply for an approval from
allowed to set up one retail establishment the Ministry of Industry and Trade to set
if they have received an Investment up sales e-commerce websites if
Certificate (Decree No.08/2013/TT-BCT) investors want do conduct sales activities
via e-commerce platforms without retail
establishment (Decree No.52/2013/ND-
Multiple retail establishments: Investors CP on E-commerce and Decree
must apply for a license to set up retail No.08/2018/ND-CP)
establishments to the Ministry of Industry
and Trade (Decree No.08/2013/TT-BCT)
The Law on Investment regulates investment activities for business purposes, the rights and obligations of
investors, the guarantee of lawful rights and interests of investors, encouragement of investment and investment
incentives, State administration of investment activities in Vietnam, and offshore investment from Vietnam. It is
applicable for domestic and foreign investors as well as organizations and individuals carrying out investment
activities within the territory of Vietnam or offshore investments made from Vietnam.
The Law on Enterprises regulates the establishment, management organization, re-organization, dissolution,
and related activities of enterprises, such as limited liability companies, shareholding companies, partnerships,
and private enterprises. It is applicable for enterprises, agencies, organizations, and individuals involved in the
establishment, organization of management, re-organization, dissolution and related activities of enterprises.0.787401570.78740157
1.4 Consumption
Household income bands
Average monthly average income per capita in Thousand VND (2016) at current prices by income quintile.8
Country Quintile 1 Quintile 2 Quintile 3 Quintile 4 Quintile 5
Average
3,049 791 1,535 2,322 3,356 7,755
(US$134.16) (US$34.80) (US$ 67.54) (US$ 102.17) (US$ 147.66) (US$ 341.22)
Disposal household income
The median disposable income per household was about US$3,822 in 2016, or about US$320 a month. 9
Consumption expenditures
Average monthly living expenditure per capita in Thousand VND (2016) at current prices by income
quintile.Error! Bookmark not defined.
Country Quintile 1 Quintile 2 Quintile 3 Quintile 4 Quintile 5
Average
2,016 896 1,318 1,685 2,204 3,534
(US$ 88.70) (US$ 39.42) (US$ 57.99) (US$ 74.14) (US$ 96.98) (US$ 155.50)
Average monthly expenditure per capita in Thousand VND (2016) at current prices by type of expenditure.Error!
Bookmark not defined.
Total Living Eating drinking & Non eating drinking Others
expenditure expenditure smoking & smoking
expenditure expenditure
2,157 2,016 1,027 989 141
(US$ 94.91) (US$ 88.70) (US$ 45.19) (US$ 43.52) (US$ 6.20)
8 www.gso.gov.vn
9 hktdc.com0.787401570.78740157
Employment sectors
Population share (2016)10
Age Group Population in million Population Share
Total 53.3 57.5%
15-19 2.2 2.4%
20-24 4.8 5.2%
25-29 6.2 6.7%
30-34 6.8 7.3%
35-39 6.5 7.1%
40-44 6.5 7.1%
45-49 5.9 6.4%
50+ 14.4 15.5%
Annual employed population and annual employed population at 15 years of age and above by kinds of
economic activity.10
Population in Population
Industries million share
(percent)
TOTAL 53.3 100
Agriculture, forestry and fishing 22.3 41.9
Mining and quarrying 0.24 0.4
Manufacturing 8.9 16.6
Electricity, gas, stream and air conditioning supply 0.16 0.30
Water supply, sewerage, waste management and remediation 0.14 0.30
activities
Construction 3.8 7.10
Wholesale and retail trade; repair of motor vehicles and motorcycles 6.7 12.60
Transportation and storage 1.6 3.00
Accommodation and food service activities 2.5 4.70
Information and communication 0.34 0.60
Financial, banking and insurance activities 0.38 0.70
Real estate activities 0.18 0.30
Professional, scientific and technical activities 0.25 0.50
Administrative and support service activities 0.29 0.50
Activities of Communist Party, socio-political organizations; public 1.7 3.20
administration and defense; compulsory security
Education and training 1.9 3.60
Human health and social work activities 0.57 1.10
Arts, entertainment and recreation 0.3 0.60
Other service activities 0.89 1.60
Activities of households as employers; undifferentiated goods and 0.19 0.40
services producing activities of households for own use
Activities of extraterritorial organizations and bodies 0.002 0.00
10 www.gso.gov.vn0.787401570.78740157
Employment rate
Unemployment and underemployment rate of labour force (2016) 11
Unemployment rate (%) Underemployment rate (%)
General 15-24 25-49 50+ General 15-24 25-49 50+
2.30 7.43 1.46 0.84 1.66 2.57 1.58 1.21
Percentage of trained employed workers at 15 years of age and above by kinds of economic activity
(2016)11
Trained employed workers
Industries (percent)
TOTAL 20.6
Agriculture, forestry and fishing 4.1
Mining and quarrying 50.4
Manufacturing 18.5
Electricity, gas, stream and air conditioning supply 78.7
Water supply, sewerage, waste management and remediation activities 43.4
Construction 14.0
Wholesale and retail trade; repair of motor vehicles and motorcycles 21.6
Transportation and storage 55.2
Accommodation and food service activities 13.3
Information and communication 80.8
Financial, banking and insurance activities 83.1
Real estate activities 41.9
Professional, scientific and technical activities 81.5
Administrative and support service activities 43.5
Activities of Communist Party, socio-political organizations; public 83.0
administration and defense; compulsory security
Education and training 92.2
Human health and social work activities 88.0
Arts, entertainment and recreation 25.4
Other service activities 20.2
Activities of households as employers; undifferentiated goods and 3.0
services producing activities of households for own use
Activities of extraterritorial organizations and bodies 75.1
11 www.gso.gov.vn0.787401570.78740157
Average income
Gross Average Monthly Salary (VND)12
Industries Minimum Average Maximum Average
Human Resources 47.8 million 77.5 million
Legal 57 million 103.3 million
Banking 77 million 121.5 million
Finance & 32.5 million 43.6 million
Accounting
IT 36.5 million 54.5 million
Sales Marketing 33.2 million 49 million
Retail 29.8 million 37.6 million
FMCG 43.6 million 58.6 million
Engineering and 28.2 million 51.1 million
Technical
Logistics and Supply 29.7 million 41.7 million
Chain
Medical & Life 31.5 million 48 million
Sciences
Skilled workforce for Primary, Secondary and Tertiary sector
Skilled Workers in Vietnam by Level of Education (2016). 13
Education level Workers (millions) Percentage of workforce
Primary Vocational 1.7 3.1
Secondary Vocational 0.8 1.4
Secondary School 2.1 3.7
Vocational College 0.2 0.3
Professional College 1.5 2.7
University and Higher 4.9 9.1
TOTAL 11.2 20.3
12 www.adecco.com.vn
13 www.gso.gov.vn0.787401570.78740157 2. Market Overview of Retail sector The share of foreign invested enterprises in Vietnam’s economy has rapidly grown in the last decade. Investor friendly policies have led to the easing of business conditions and entry of foreign players especially from Southeast Asia, Japan, and South Korea. This has allowed foreign firms to flourish in Vietnam in almost all major sectors including retail, where most domestic firms and State owned enterprises continue to suffer from mismanagement, lack of funds, and access to global supply chains. In addition to the entry of foreign players in retail sector, the rise in consumer spending, lifestyle changes and urbanization has made Vietnam one of the most attractive retail markets in the world. Retail spending continues to grow not only in the traditional and modern retail segments, but also in e-commerce, which is largely driven by the rise in the number of smartphone users as well as internet penetration. The fast food and apparel sector has attracted major international retailers in the last 10 years. The sector has also seen the emergence of domestic players that are vying for a share in the consumer market. Going forward, as the market gets more competitive, existing brands in the market will continue to expand, while late entrants will find it hard to establish a presence. 2.1 Introduction Overview of the retail sector In 2017, Vietnam’s retail industry sales reached US$129.6 billion rising 10.9 percent from the year before. As of 2016, Vietnam has 4,765 modern trade stores, including 4,194 minimarts and convenience stores, and 571 supermarkets. Traditional retail has around 1.4 million stores in Vietnam. The retail sector’s growth has largely been driven by the entry of foreign retailers, easing of investment regulations, and a rise in consumer spending and urbanization. In the last 10 years, the market has attracted numerous foreign retailers such as Lotte, CircleK, Aeon, BigC, and FamilyMart to name a few. In terms of investment attraction, Vietnam ranked as the sixth best destination for retail investment according to the 2017 A.T. Kearney’s Global Retail Development Index (GRDI). According to the report, convenience stores and mini-marts are the fastest-growing segment in the industry. By 2020, the retail market size is expected to reach US$ 179 billion. Traditional Traditional retail channels account for 72 percent 14 of the market but this number is forecasted to decline to just 60 percent in 2020. In 2016, the traditional retail segment grew only by two percent. 15 Modern In 2016, the modern retail segment grew by 61 percent as compared to the previous year. Modern retail channels like supermarkets and shopping centers account for almost a quarter of total retail sales in Vietnam. By 2020, the proportion of modern retail channels is forecast to rise to 40 to 45 percent. 15 E-commerce Vietnam’s value of e-commerce market in 2016 was close to US$ 1.8 billion. The e-commerce retail sales grew by 25 percent in 201716. The annual retail sales growth for 2016-2020 is estimated at 20 percent, with the market forecasted to reach US$ 10 billion by 2020. 14 http://www.moit.gov.vn/ 15 Nielsen Vietnam 16 http://www.vecita.gov.vn
0.787401570.78740157

2.2 Size of the sector
Retail market numbers
Product Categories17

                                                 Total revenue (Billion
 Year 2016                                       VND)                            Growth
 Retail Sales                                    2,668,413.30                    11.10%
 Accommodation, food and beverage                442,240.90                      10.60%
 service

 Service and tourism                             457,495.30                      9%

Luxury Goods

The appetite for luxury goods is more in the country’s capital Hanoi and Ho Chi Minh City, the country’s largest
commercial center. However, newer markets for luxury goods are emerging in fast urbanizing population
centers such as Haiphong, Da Nang, Hue, and Can Tho. These cities are where the majority of the country’s
young and well-educated professional class lives. The growth of Vietnam’s retail sector also provides many
opportunities for luxury brands to enter the market.18

Cosmetics
Both nominal spending and the percentage of consumer spending allocated to cosmetics have grown
significantly in recent years. By 2020, total value of cosmetics imports are projected to reach US$ 2.23 billion—
representing over 1.2 percent of total consumer spending.

Automobile
By 2020, total value of automobile imports are projected to be around US$0.62 billion — representing around
0.5 percent of total consumer spending.

Alcoholic Beverages
The total value of alcoholic beverages import by 2020 is projected to reach US$5.5 billion, accounting for
around 2.4 percent of total consumer spending.

Fashion and Accessories
The total value of fashion and accessories import by 2020 is projected to reach US$1 billion, accounting for
slightly more than 1 percent of total consumer spending.

Hotel and Gastronomy

By 2020, total value of tourism and hotel/gastronomy spending are projected to be around US$45 billion —
representing around 18 percent of total consumer spending.

17   www.gso.gov.vn
18   https://evbn.org/vietnam-market-trends-in-the-luxury-goods-sector-report/
0.787401570.78740157
Retail Stores19
Types of retail stores Number of Growth (2017) Spending
establishments (2017)
Supermarkets 930 7%
25% of total retail
Shopping 179 5%
spending
Malls/Commercial Centers
Convenience Stores 1,765 13.3% (est.)
Traditional Markets 9,000 5.7% 73.8% of the total
Household-run stalls 2.2 million N/A retail spending
1.2% of total retail
E-commerce N/A 22% spending
Regions19
Retail sales of goods and services in 2016
For 2016 Total revenue (Billion VND) Growth
North 967,918.50 9.30%
Central 743,809 10.80%
South 1,856,422 11.4%
19 www.gso.gov.vn0.787401570.78740157 2.3 Specificities of the sector The popularity of young Vietnamese internet retailers or e-commerce retailers Lazada, Singapore based firm continues to lead amongst Vietnamese e-commerce retailers. However, eight out of the 10 most visited e-commerce sites are locally based firms. Preference for local online retailers has grown steadily in Vietnam, with only two foreign retailers featuring in the top 10, Alibaba-owned Lazada and Singapore-based Shopee. In Q4 2017 Lazada had around 50.4 million visitors per month, followed by Vietnamese giant Thế Giới Di, Sendo, and Shopee at 39 million, 24 million, and 18 million visitors per month, according to iPrice, an online shopping aggregator. According to a recent survey in January 2018 by the Association of High-Quality Vietnamese Goods Producers, 2.7 percent of respondents said they shop online, three times higher as compared to last year. As per the survey, respondents mostly purchased electronic products, toys, sports equipment, cosmetics, beauty products, blankets, pillows, curtains, stationery, and fashion products with most being young consumers residing in major cities. In rural areas, apparel and cosmetics were the major products bought online. Obsession with foreign products Vietnamese consumers shopping patterns have evolved in the last few years, driven by a growing GDP and increase in purchasing power. Apart from the increase in consumer spending, preference for foreign goods have increased steadily in Vietnam, especially for products from Thailand, South Korea, and Japan. According to a recent survey by the Association of High-Quality Vietnamese Goods Producers, domestic products do dominate the market with 51 percent of respondents preferring local products and 60 percent of respondents consuming local goods. However, this rate has fallen by 27 and 32 percent as compared to last year.
0.787401570.78740157

Prevalence of distributors and franchising models in Vietnam
Distribution model

As per Vietnam’s WTO Commitments, 100 percent foreign-owned companies may engage in distribution
services (including wholesale or retail sales) of most legally imported or domestically produced products.
Distribution services include commission agent sales, wholesaling, retailing, and franchising.

Some products are excluded from Vietnam’s commitment to open distribution services, such as cigarettes and
cigars, books, newspapers and magazines, video recordings, precious metals and stones, pharmaceutical
products and drugs, explosives, processed oil and crude oil, rice, cane, and beet sugar.

Foreign companies engaging wholesalers in Vietnam should examine the investment certificate or business
registration certificate of each reseller or distributor to make sure that they are properly licensed to engage in
wholesaling or retailing of the products.

Foreign businesses without equity limitation have been able to engage in retailing activities since 2009. As per
Vietnamese law, “retailing” means the activity of selling goods directly to the end-user. If they have a license to
engage in retail services, the foreign-invested company can sell directly to end users, without having to go
through a licensed local distributor. A company licensed to engage in retail activities has the right to establish a
single retail outlet. Subsequent outlets are subject to approval from the relevant local Department of Planning
and Investment (DPI).

Manufacturing companies can warehouse their processed products. Trading companies, importing their own
brand products, are considered rendering a service to their parent companies. As of 2014, warehousing service
(as part of the logistics industry) is now fully opened to a 100 percent foreign ownership.

Franchising model

The franchising model is well suited to a developing economy like Vietnam. Franchising provides investors with
a relatively rapid avenue of entering business with controlled levels of investment and at a reduced risk. Rising
incomes and an emerging middle class are generating an increase in this consumer-driven sector.

Franchising began in the 1990’s with the introduction of fast food chains like KFC, Lotteria, and Jollibee. In July
2016, per the Vietnam Ministry of Industry and Trade (MoIT), 148 foreign brands had registered their franchising
businesses in Vietnam. This includes fast food, bakery, coffee, drinks, and restaurants, which accounted for
43.7 percent of total franchise contracts signed. Most franchisors are from the U.S., Australia, South Korea,
Singapore, Thailand, Japan, Hong Kong, Canada, and the Philippines.

In 2016, franchise deals rose 15 to 20 percent compared to 2015. Along with a growing interest in western-style
food and beverage, there is a considerable demand for lifestyle-oriented products and services.
0.787401570.78740157
Top Franchises in Vietnam
Food & Beverage Retail Apparel and Education and
accessories training
Lotteria Carl’s Jr Tea Leaf FamilyMart Inditex Mathnasium
McDonald's Dunkin’ Donuts Costa Circle K Miss Selfridge Crestcom
Baskin Robbins Pepper Lunch Jumbo B’s Mart Dorothy Perkins Dale Carnegie
Seafood
Haagen-Dazs Subway Hard Rock Ministop Fossil Cleverlearn
Limited
Pizza Hut Gloria Jean's Highlands GS25 Marks & Spencer Cherie Hearts
Coffee Coffee
Kentucky Fried Ding Tea Pho 24 7-Eleven Charles & Keith ActionCOACH
Chicken
Burger King Trung Nguyen King BBQ Shop n Go Bottega Veneta Daekyo
Coffee
Jollibee Kinh Do Bakery Huy Vietnam Lotte Mart Moschino Pearson
Education
Starbucks Wrap and Roll Sumo BBQ Vinmart Debenhams Etonhouse
Domino’s Pizza Café Cong Cong Café Citimart Body Shop Hamleys
Popeye’s Coffee Bean Fivimart Topshop FasTracKids
Chicken
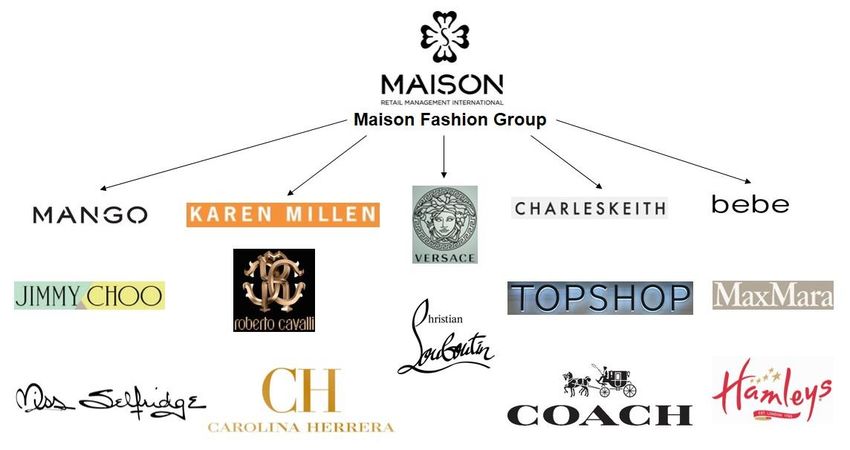
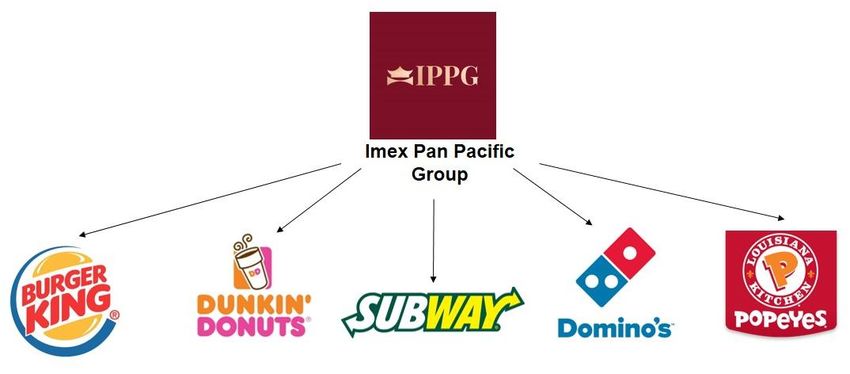
Top Franchise and Distribution Partners0.787401570.78740157
0.787401570.78740157

2.4 Market Trends
Comparing traditional retailing and modern retailing
Traditional Retail
Traditional trade is the largest channel in Vietnam both by number of stores and by sales contribution.
Traditional sales channels account for 75 percent of the market share. In 2016, traditional retail had 1.4 million
stores, but the store growth rate slowed down to only two percent.

Modern Retail
Vietnam is home to 4,765 modern trade stores in 2016, including 4,194 minimarts and convenience stores, and
571 supermarkets. By 2020, Vietnam will have an estimated 1,300 hypermarkets and supermarkets, and 337
trade centers according to government figures.

The modern trade channels achieved a store growth rate of 61 per cent year-on-year in 2016, but accounted for
only 25 percent of the market share. By 2020, the share of modern retail is forecast to rise to 45 percent.

Comparing internet retailing/e-commerce and non-e-commerce

In 2016, Vietnam’s e-commerce market was valued around US$ 1.8 billion. The e-commerce retail sales grew
by 25 percent in 2017. The annual e-commerce retail sales growth for 2016-2020 is estimated to reach 20
percent, with the market forecasted to reach US$ 10 billion by 2020, accounting for 5 percent of the country’s
retail market.20

In the online retail sector, e-commerce companies witnessed a revenue growth of 35 percent in 2017. An
indirect survey of certain delivery companies showed a 62-200 percent growth in delivery service revenues. 20

According to one estimate, about 30 percent of the population will be buying goods and services over the
internet in 2020, with each shopper spending an average of US$350 per year.

20   www.vecita.gov.vn
0.787401570.78740157

FMCG in terms of sales growth and demand growth
Traditional Channels

The nationwide FMCG sales, measured in traditional trade channels in 2017, increased 5.4 percent year-on-
year compared to 4.9 percent in 2016. As for the FMCG performance in rural and urban areas, the report shows
that the growth observed in rural areas was higher than that in urban regions but it was more fluctuated. Total
rural FMCG growth increased 6.1 percent year-on-year while total urban FMCG growth rate was flat at 4.0
percent year-on-year.21

Brands

In Vietnam, FMCG market share held by Vietnamese brands are superior to global brands in both rural and
urban markets. In rural areas, Vietnamese brands hold 78 percent of market share, or 3.5 times higher than
global brands. In large cities, the figures are 71 percent and 29 percent, respectively. 22

According to Nielsen, multi-national brands gained a 2 percent growth rate in value in 2016 (5 percent in 2014),
while Vietnamese brands gained a growth rate of 7 percent (5 percent in 2014). Vietnamese manufacturers
made up to 42 percent of total revenue of the whole FMCG sector.

In the food & beverage segment, Vietnamese enterprises hold the upper hand with market share of 69 percent
and 45 percent, respectively. In home care and personal care segments, multinational brands have advantages,
but their growth rates were lower than domestic ones.

Online Sales

Online FMCG sales in 2017 reached 0.5 percent share in Vietnam, an increase of 69 percent compared to
2016. Vietnam e-commerce specifically, is expected to expand from 0.5 percent to 2.2 percent share in 2025
coupled with the rise of digitization23.

21 http://www.nielsen.com
22 https://www.kantarworldpanel.com/vn
23 http://www.nielsen.com
0.787401570.78740157
Consumer and Lifestyle trends prevalent
Consumer expenditure has been increasing steadily in Vietnam, in particular due to rising incomes amid
strengthening economic activity. During 2010-2016, the median disposable income rose by about 46 percent to
an estimated US$3,822 per household from US$2,613. As per a 2017 study by Nielsen, Vietnam achieved a 5-
year record high in terms of the Consumer Confidence Index, ranking fifth worldwide. This index shows the
potential of the retail market as well as the optimism and willingness to spend of Vietnamese consumers.
Total consumer expenditure increased to an estimated US$146 billion in 2016 to US$163 billion by 2020.
Spending on housing, food items, and transportation accounted for almost 60 percent of consumer expenditure.
As the Vietnamese economy opens up, consumers are coveting quality products and luxury items. In major
cities such as Ho Chi Minh City, Hanoi and Da Nang, where most households of higher income reside,
consumers can enjoy a wide variety of choice for products of both local and foreign brands. According to a
survey conducted in 2014 by Y&R Vietnam on people aged from 20 to 65 years in four major cities in Vietnam,
14 percent of them bought luxury goods at least once.
The top factors influencing the purchasing intentions of Vietnamese consumers are high-quality products (79
percent) health and wellness benefits (77 percent) and products made with fresh, natural, and/or organic
ingredients (77 percent).23
There is also a shift in buying preferences in the retail segment. According to a 2016 Nielsen study, Vietnamese
consumers are moving slowly towards modern retailers due to numerous reasons such as
Low prices
Deals and promotional offers
Convenience
Wide variety of products
Availability of products, especially organic and healthy
Store environment0.787401570.78740157 Commercial real estate trends and outlook Ho Chi Minh City - Central Business District (CBD) With big brands preferring to open their retail stores in city center, the total supply in Central Business District (CBD) area was limited in 2017 with less than 100,000 m2 Net Leasable Area (NLA), just 2.7 percent of which was vacant. The average rent in 2017 was US$115.4/m2/month. Average occupancy from 2012 to 2016 was 91 percent. 2018 Outlook There will be no new supply in the CBD in 2018. In 2019 and 2020, 124,000 m2 of new supply will come online from the podiums of luxury mixed-use projects such as Golden Hill, Tax Plaza, and The Spirit of Saigon. Due to solid demand, rents of CBD retail property will continue to rise during the next three years and vacancy will remain under 5 percent. Any available space is expected to be quickly filled up. Ho Chi Minh City – Non-CBD In non-CBD areas, a total NLA of 74,183 m2 were introduced to the HCMC retail market. The average rent in 2017 was US$37.8/m2/month. Average occupancy from 2012 to 2016 was 88.7 percent. 2018 Outlook In the next three years, an additional of 430,000 m2 NLA will be available. With rising competition, rents in non- CBD areas are constrained while the vacancy rate is expected to increase to 20 percent by 2020. 24 Hanoi – Central Business District (CBD) In Hanoi, only 7 percent of total retail supply in Hanoi is located in the CBD. Due to limited land bank, there has been no new supply since 2013, causing retailers to find alternatives in shop houses. Currently there is still no expected future supply. The average rent in 2017 was US$85/m2/month. 2018 Outlook The CBD is predicted to continue to perform well with a low vacancy rate and strong asking rental rates. Currently, there is no expected future supply. Hanoi – Non-CBD The majority of current supply is located in different clusters in Non-CBD areas, in residential areas or other areas with good access to population centers. The average rent in 2017 was US$28/m2/month. 2018 Outlook The areas along Ring Road 3 and the two under-construction metro lines including the West, South West, and South will be hot-spots with nearly 375,000 m2 of retail space coming online over the next three years. The area covering Cau Giay, Tu Liem, and Thanh Xuan district is currently the largest retail cluster in Non-CBD, accounted for 41 percent of total supply. It will continue to remain its position in the next few years with 83,300 m2 future supply in the pipeline. In 2018, a total of 157,000 m2 area will be available from eight under-development projects. This is the largest number of new projects ever planned for a single year and is only surpassed by 2013 in terms of scale. Despite this new supply causing pressure on the vacancy rate, the average market rent is still expected to remain relatively stable or even to slightly improve.24 24 CBRE Vietnam
0.787401570.78740157

2.5 Key Growth Drivers – Future Outlook
Demographics: Review of young and growing population
Vietnam has a growing educated workforce and is now in a period of golden population structure, where 70
percent of the population aged between 15 and 64. Nearly 45 percent is under 30 years of age, and only 10.5
percent is aged 60 and over. With a median age of 30.7 years, Vietnam has a relatively young population. In
comparison, China has a population with a median age of 36 years.

Vietnam’s golden population is estimated to last about 30 years from 2010 to 2040. However, due to a lower
birthrate and longer life expectancy, Vietnam is aging rapidly and the working-age population is shrinking.
Vietnam’s working-age population will shrink so quickly that by 2030, one in six Vietnamese will be over 60
years old, and one in four of the population will be 60 or older by 2060.

Improvements to standards of living and consumer spending power
Living Standards

Spending on food items, housing, and transportation, account for around 60 percent of the total expenditure of a
consumer. Price levels of health-care products and medicine increased by 45.6 percent in 2013 and 42.3
percent in 2017, pushing up spending on health goods and medical services. 25

                         CPI (all categories)                                           Medical and Healthcare (CPI)
               118.6
                                                                                                                 145.6                                142.29

      109.2             109.2
                                106.6                                                                                                              128.52
                                        104.09
                                                          102.66 103.53
                                                 100.63
                                                                                                  116.3
                                                                                                                            105.36
                                                                                         105.7                                           102.14
                                                                              103.4

      2010      2011    2012    2013    2014     2015     2016      2017      2010    2011       2012     2013      2014          2015      2016      2017

                       Textile, Footwear (CPI)                                        Family appliances and tools (CPI)
                                                                                      108.8
              112.1
                                                                                                  107.6

                       110      107.9
                                                                                                            105
                                                                              105.4
 106.9                                    104.33                                                                         102.96
                                                                                                                                   102.02
                                                           102.11
                                               103.29                101.07                                                                 101.13     101.02

     2010     2011      2012    2013    2014       2015    2016      2017     2010    2011    2012        2013      2014          2015      2016      2017

25   gso.gov.vn/
0.787401570.78740157
Food and foodstuffs Education CPI
126.5 123.2
117.1
108.1 114.2
110.7
104 102.36
109.1
102.7 101.48 110.2
98.92 110.4 106.5 106.31
2010 2011 2012 2013 2014 2015 2016 2017 2010 2011 2012 2013 2014 2015 2016 2017
Home Ownership
Distribution of households with urban/rural location and ownership until 1/4/2014. 26
Ownership Rate
Whole Country 100.0%
Own home 90.8%
Rent/borrow 8.7%
Unclear ownership 0.5%
Without dwelling 0.0%
Urban 100%
Own home 81.2%
Rent/borrow 18.1%
Unclear ownership 0.8%
Without dwelling 0.0%
Rural 100.0%
Own home 95.8%
Rent/borrow 3.9%
Unclear ownership 0.3%
Without dwelling 0.0%
Housing in Vietnam is divided into four types:
Permanent
Permanent housing includes dwellings for which the three main structural elements: supporting
columns, roof and walls all consist of sturdy types;
Semi-permanent
Semi-permanent housing indicates that two out of three structural elements are made of sturdy
categories;
Temporary
26 1/4/2014 Vietnam Intercensal Population and Housing Survey0.787401570.78740157
Temporary structures only have one of the three structural elements belonging to the sturdy category;
Simple
Simple structures are those for which all three structural elements are classified as flimsy.
Percentage of households having house by type of house and region (2016). 27
Permanent Semi-permanent Temporary Simple
Whole Country 49.7 42.5 5.2 2.6
Urban 47.8 49.9 1.7 0.6
Rural 50.6 39.0 6.9 3.5
Consumer Spending Power
Consumer expenditures continue to rise in Vietnam, in particular due to rising incomes driven by a growing
economy. During 2010-2016, the median disposable income rose by about 46 percent to an estimated
US$3,822 per household from US$2,613.28 Almost two-thirds of the country’s population live in rural areas, and
their consumer expenditure accounts for about 58 percent of the country’s total. During 2010-2016, rural
consumer expenditure rose by about 94 percent, more than the 69 percent increase of urban consumer
expenditure in that period. However, the average spending by urban residents is still higher than that of rural
dwellers, as they account for only one-third of the population but spend 42percent of the country’s consumer
expenditure.28
Vietnam Consumer Expenditure
109.3
103.6
97.4
91.1 Rural Consumer Expenditure (US$
84.8
79.4
67.5
73.8 billion)
60.2
52.6 Urban Consumer Expenditure (US$
43.8
75.5 80.3 billion)
57.8 61.6 66.1 70.7
41.3 45.3 50.1 54.1
36.4
2010 2011 2012 2013 2014 2015 2016 2017 2018 2019 2020
27 www.gso.gov.vn/
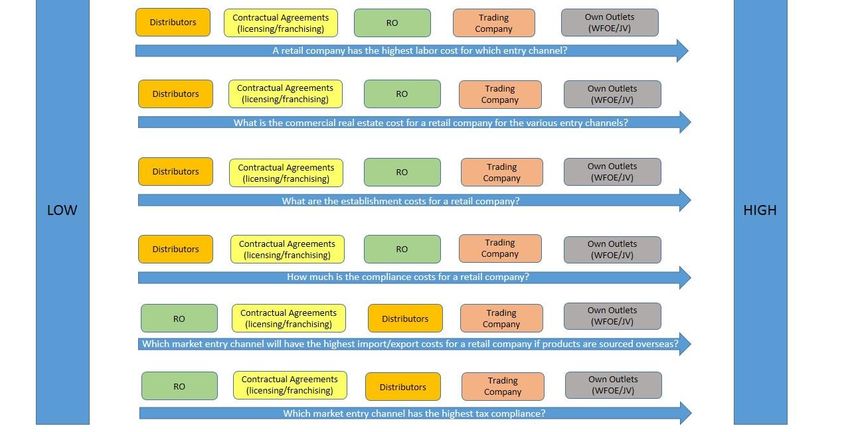
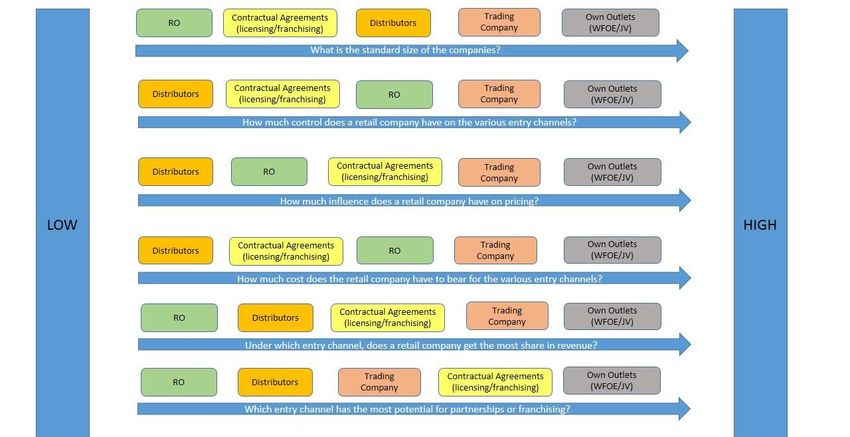
28 hktdc.com0.787401570.78740157 3. Market Entry Models With the retail sector slowly getting crowded by the emergence of domestic players, as well as the entry of international retailers, future investors not only need to understand the market dynamics, but also ensure that they select the appropriate market-entry strategy to minimize risks. There are numerous modes of market entry, and there is no one strategy that fits all retailers. Market entry strategies depend on various factors that need to be considered by investors such as product demand, pricing, market dynamics, and regulations. In addition, once an investor plans to enter Vietnam, working with domestic firms is inevitable. Find a local partner is not that hard, but gauging the partner’s capability is crucial and a degree of uncertainty always surrounds such partnerships. In this section, we highlight the different market entry channels and compare them with each other on various parameters. We also focus on the major attributes a local partner should have in Vietnam. 3.1 Market Entry Channels – Profile This chart profiles the retail channels Representative Office (RO), Contractual Agreement (Licensing/Franchising), Distributors, Trading Company, and Retail outlets (WFOE/JV) on various parameters such as operational characteristics, cost, and price.
0.787401570.78740157

3.2 Market Entry Channels
Distributor
The distributor will buy the products from the retail company and then sell them to customers through a third
party or directly. They earn their profits from the difference between the buying and selling prices. A distributor is
a cost-effective method and one of the easiest way to enter a market. However, for a market like Vietnam will
major retail markets spread across the country, a retail company has to engage with multiple distributors or with
one distributor having a national presence.

Representative Office
The representative office (RO) is an effective tool for foreign traders to monitor Vietnamese market trends and
engage in cooperation with local companies. However, an RO offers much more limited functions compared to a
fully-fledged company. It is typically a dependent unit of its parent company, forbidden to generate its own
profits and enter directly into contracts unless a legally authorized power of attorney is granted. ROs are
forbidden to issue invoices, easing the accounting and tax compliance burden for foreign traders.

An RO is permitted to recruit local and foreign employees directly or through an agency, lease office space –
restricted to only one office in a province or city, equip itself with facilities necessary for its operation, obtain its
own company seal, and open its local bank accounts for operational purposes.

Trading Company
If a business wishes to engage in import and export activities as well as domestic distribution (i.e., retail,
wholesale, and franchising trade activities) in Vietnam, the most common method chosen is establishing a
trading company.
0.787401570.78740157

Generally, a trading company is inexpensive to establish and can be of great assistance to foreign investors by
combining both sourcing and quality control activities with purchasing and export facilities, thus providing more
control and quicker reaction times compared to sourcing purely while based overseas.

Contractual Agreements (Licensing/Franchising)
Licensing is a legal permission granted by an owner of Intellectual Property (such as trademarks, copyrights,
patents) to another entity, so that the entity can use it on agreed terms and the owner receives the royalties for
such use. Franchising allows one to distribute its products or services through a franchisee who pays a royalty
allowing him to use the franchisor's (retail company) brands.

Both these channels provide a low entry cost and help the retail companies to know about the local market
through the franchisee.

Own retail outlets (WFOEs/JV)
There are two main types of vehicles for foreign investment in Vietnam; a 100 percent foreign-owned enterprise
(FOEs) and Joint venture enterprises (JVEs).

One or more foreign investors, in either the form of a limited liability company (LLC) or a joint - stock company
(JSC), can establish a 100 percent FOE. JVEs can be established as an LLC, a JSC, or a partnership, and the
profits and risks in a JVE are distributed among the parties in proportion to their charter capital contributions.

3.2 Partner Selection
Foreign investors that are hoping to enter the Vietnamese market will find that working with or partnering with
local companies is almost inevitable. The benefits of cooperation or formal partnership can be beneficial, but
there is often a degree of uncertainty that surrounds the initial stages of market entry. For most investors, the
process of finding and then vetting potential partners can be a complex process.

New entrants to the Vietnamese market should pay close attention to the following areas when considering
potential partners. Covering these issues prior to engaging with partners further will ensure expectations are
met, negotiations are concluded quickly, and operations can be carried out in a seamless manner.

Legal Capabilities
For companies considering a distribution model, confirming that distribution partners are licensed to import
goods and to sell the specific products in question will be very important. In some cases, distributors may not be
licensed for import directly but may have arrangements with customs clearance companies. In all cases,
understanding the legal capacity of a partner to carry out distribution and the impact of this on cost will allow
investors to assess the viability of distribution partners.

For investors that are considering a formal partnership with an existing company in Vietnam, it will be important
to confirm the specifics on the partner’s business license. This will determine what aspects of an investor’s
operations can start immediately and if any future work will be required in terms of additional licensing. In most
cases, additions of new business lines should be carried out before any merger or acquisition takes place as the
process for licensing can become more time consuming for entities with foreign ownership.

Logistic Capabilities
A partner’s logistic network in Vietnam is also a very important consideration. Even if a company is licensed to
import and retail goods, it may not be well positioned to target the type of customers that are optimal for these
goods. In other cases, the distribution capabilities of the company may not match its appetite to buy goods.
You can also read