Tough Love: Bottom-Line Quality Standards for Colleges
←
→
Page content transcription
If your browser does not render page correctly, please read the page content below

ED UCATION
Tough Love:
Bottom-Line Quality Standards for Colleges
HIGH ER
TO THE POINT
Roughly $180 billion in federal student aid and tax benefits are provided
each year to colleges and universities with virtually no consideration
of institution performance on low-income student access, degree-
completion, and post-enrollment success measures.
Some 600,000 undergraduates attend four-year colleges that fall below
JUNE 2014
the barest minimum standards of institutional success, including drop-
out rates in excess of 85 percent. Over $15 billion is distributed annually
to more than 300 colleges that qualify as engines of inequality, dropout
factories, or diploma mills.
Recommended is targeted assistance to persistently underperforming
public and nonprofit colleges and tough consequences, including
cutting off federal aid, for those institutions that fail to improve within a
reasonable period of time.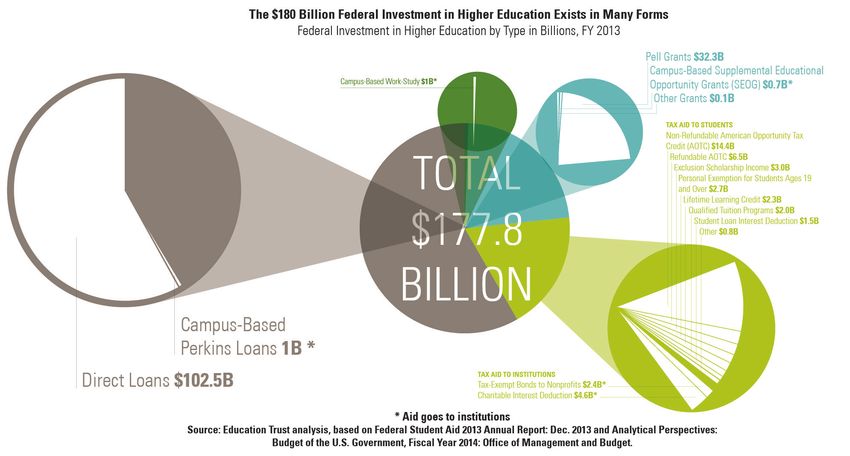
The federal government provides
                    roughly $180 billion in the form of
                    student financial aid and tax benefits
                    to American colleges and universities
                    in a typical year.

                    When the checks are written,
                    an institution’s performance on
                    access, completion, and
                    post-enrollment success
                    measures essentially doesn’t matter.

Copyright © 2014 The Education Trust. All rights reserved.
Tough Love:
Bottom-Line Quality Standards for Colleges
BY MICHAEL DANNENBERG AND MARY NGUYEN BARRY

The world is changing. Physical stamina and a
good work ethic are no longer enough to secure
a stable future. Obtaining a quality education,
especially a college education, is the surest way to
gain a lasting foothold in today’s economy.1 Most
Americans realize this, and as a result, college
aspiration and college-going rates are rising
among all demographic groups — rich, poor,
white, and students of color.2
But U.S. college graduation rates are among
the lowest in the developed world.3 Less than
two-thirds of students who start full time at a
four-year college earn a degree from any college
within six years of initial enrollment; among
those who start at two-year colleges, fewer than
a quarter earn a credential within three years of
initial enrollment.4 Moreover, the way federal
and state governments currently finance higher
education — mostly on the backs of students and
their families — leaves both those who finish
college and those who don’t with unprecedented
levels of debt. Just when they would normally be
ready to buy a house, car, or make another major
investment, many former students are struggling
to meet — if not outright defaulting on — their
student loan obligations.5
To make matters worse, college-going rates,
graduation rates and rates of high student loan
debt all track family income and race.6 While
roughly 8 out of 10 young people from families in
the top income quartile earn at least a bachelor’s
degree, only 1 in 9 young people from families
in the bottom income quartile do the same by
age 24 (Figure 1). Similar disparities exist by race:
Young white adults earn bachelor’s degrees at
nearly twice the rate of African Americans and
nearly three times the rate of Latinos (Figure 2).
Some would argue these troubling trends are
mostly about the students, many of whom arrive
                                                        Michael Dannenberg is director of higher education and education
at college underprepared. But it turns out that at      finance policy, and Mary Nguyen Barry is higher education research
                                                        and policy analyst at The Education Trust.

                                                                      THE EDUCATION TRUST | TOUGH LOVE | JUNE 2014           1
PROPOSAL AT A GLANCE THE EDUCATION TRUST’S PROPOSAL FOR MINIMUM INSTITUTION OF HIGHER EDUCATION PERFORMANCE STANDARDS Raise the Floor Above the Current Bottom 5 Percent Minimum Standards for Low-Income Student Access and Degree Completion Pell, full-time freshman enrollment: 17 percent Six-year, full-time freshman graduation rate: 15 percent Student loan repayment rate (optional interim proxy three-year cohort default rate: 28 percent) Time Frame for Improvement Fair notice of new minimum performance standards (at least one year) Opportunity to appeal designation for those institutions that may be the only option within a certain geo- graphic area or that overwhelmingly serve non-first-time, full-time students but perform better with those students than with first-time, full-time students Federal monetary and technical assistance for institutions below graduation and loan repayment standards Low-access colleges have three years to improve, succeeding if the average Pell enrollment rate over the next three years equals or exceeds 17 percent. Low-graduation colleges have four years to improve, with two additional years if they are on track to graduate at least 15 percent of students by the end of six years, succeeding if the average graduation rate during this time frame equals or exceeds 15 percent. Low-loan repayment colleges will also have time to improve. A specific time frame is to be determined upon availability of data, but should be, at a minimum, at least three years. Sanctions for No Improvement Low-access “Engines of Inequality” will be subject to losing institutional grant and tax benefits, including tax- exempt bonds to nonprofits and the charitable interest deduction to both the institution and affiliated founda- tions. Low-graduation “College Dropout Factories” and low-loan repayment “Diploma Mills” will be subject to losing institutional grant and tax benefits as well as all eligibility to receive federal student aid, including grant, loan, and tax aid. A Rolling Benchmark As institutions evolve and improve over time, a new 5 percent standard will be updated every three to six years to encourage continuous improvement. 2 THE EDUCATION TRUST | TOUGH LOVE | JUNE 2014

every level of preparation — from institutions           This policy framework might be acceptable if the
that serve only impeccably prepared students to          United States was still comfortably ahead of its
those that serve the most underprepared — some           competitors in educating the nation and its future
colleges consistently do a much better job than          workforce. But postsecondary attainment levels of
other institutions serving exactly the same kinds        U.S. young adults have dropped from first in the
of students.                                             world to middle of the pack.7
And yet, regardless of outcomes, nearly all colleges     If we are to return to being a global leader in the
continue to receive taxpayer dollars, year after         education levels of our workforce, no involved
year after year. Federal dollars flow to institutions    party — high schools, government, or institutions
that graduate almost all their students and those        themselves — can afford to sit idly by and watch
that graduate almost none; institutions that serve       while we fail to maximize our investment in the
their “fair share” of students from lower income         nation’s future.
families, and those that don’t; and institutions
                                                         Fortunately though, some promising work is
whose students graduate with manageable debt
                                                         already underway.
and are able to turn their degrees into decent
jobs that support loan repayment, as well as               • After years of academic standards that
institutions whose students carry too much debt              stopped well short of what colleges require
and leave with no degree or a worthless one.                 for entry, state leaders have adopted new K-12
In fact, the federal government provides roughly             standards that match the skills and knowl-
$180 billion in the form of student financial                edge necessary for students to be truly col-
aid and tax benefits to American colleges and                lege ready at the end of high school. These
universities in a typical year. (See “How Does the           standards require more of both students and
Money Flow?”) When the checks are written, an                teachers; as implementation efforts proceed,
institution’s performance on these three critical            college preparation levels are expected to rise.
measures — access, completion, and post-                   • States have also stepped up to adopt goals
enrollment success — essentially doesn’t matter.             and performance funding aimed at increas-
This hands-off approach stands in stark contrast             ing degree completion. Already, 33 states
to what the federal government asks in return for            have adopted college completion goals, and
a much smaller investment in elementary and                  27 have implemented or are in the process of
secondary (K-12) education. To qualify for federal           implementing state funding systems that re-
K-12 dollars each year, states and school districts          ward institutions for their performance with
have had to set improvement goals for every                  students.8
major demographic group of students they serve,            • Some colleges have shifted their focus away
and schools are held accountable for meeting                 from just access to access and success, making
those goals. Schools that consistently perform in
                                                             student success an institutionwide priority.
the bottom 5 percent are subject to much stronger
                                                             With strong campus leadership from univer-
interventions.
                                                             sity presidents and provosts and data systems
The theory of action in higher education has been            that track student progression and credit
different. In a country with what has been viewed            accumulation, colleges like Florida State,
as the best higher education system in the world,            Georgia State, and San Diego State have made
the primary role of the federal government has               major strides in graduating more of their
been to help students from low-income families               students — especially students of color and
afford the cost of attendance. Basically, all that has       low-income students — than peer institutions
been considered necessary to guarantee quality is            throughout the country.9
a peer-review process called accreditation.

                                                                    THE EDUCATION TRUST | TOUGH LOVE | JUNE 2014   3
HOW DOES THE MONEY FLOW?
A finer lens on the nature of federal investment in higher education shows that resources are distributed to two
main groups. There are: 1) resources that go directly to colleges, universities, and affiliated foundations in the
form of tax breaks and grants that provide institutional support and student financial aid; and 2) resources that
go directly to students and families in the form of tax credits and deductions, grants, and student loans. Some
of these resources, like Pell Grants, are direct expenditures of federal dollars. Other benefits, like student loans,
represent outflows of dollars, but do not equate to actual spending since the majority of these dollars will be paid
back. And finally, benefits like tax credits, deductions, and other tax breaks typically offset tax obligations or pro-
mote investment in the form of higher charitable giving and also do not count as direct expenditures.

Indeed, among all the major players, only the                 completion — and giving institutions several
federal government sits passively on the sidelines,           years to meet those standards.
writing check after check for higher education
                                                              The process should start with minimum
with almost no consideration of institutional
                                                              performance standards for four-year colleges.
performance. In continuing to do so, the federal
                                                              Their degree-oriented missions are clear, and
government undermines the message that results
                                                              publicly available data on completion are
matter — and that what individual colleges do
                                                              reasonably strong. Later, standards should also
makes a difference.
                                                              be set for two-year colleges. But because available
So, how could the federal government play a more              data are weaker and their missions more complex
productive role — one that reinforces work that               — including transfer to a four-year college,
is already underway while mobilizing institutions             short-term job training, and non-degree, lifelong
that lag behind? By establishing minimum                      learning opportunities — this will take additional
performance standards that align with its core                time.
purposes for investing in financial aid — low-
                                                              For K-12 education policy, both the executive
income student access and meaningful degree                   branch and members of Congress over time have

4   THE EDUCATION TRUST | TOUGH LOVE | JUNE 2014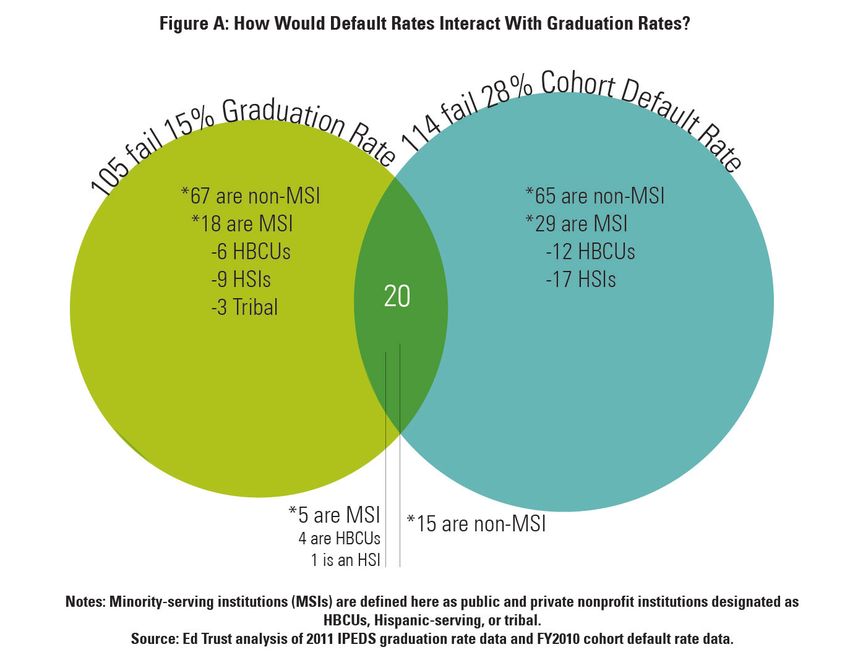
come to embrace a framework in which the focal                                              mark on access and success measures. (See
point for targeted attention and intervention                                               “Proposal At a Glance.”)
is chronically underperforming schools — the                                         But on this last point, the federal government
bottom 5 percent of all institutions.10 Following                                    must be clear: If, after receiving support and time
that example, we suggest identifying a bottom 5                                      to get better, exceptionally and persistently low-
percent threshold for four-year colleges on access                                   performing colleges do not improve, there must
and success metrics.i                                                                be consequences.
The basic idea is simple: Draw a line based                                          The goal should be to spur institutions to
on where the fifth percentile of institutional                                       improve, not to shrink or close them. If we as a
performance currently rests and make that                                            nation are to get the education of our workforce
the minimum standard all institutions should                                         where it needs to be, we need more higher
strive to surpass over the next several years.ii As                                  education capacity, not less. That said, experience
is true in K-12, our analyses of the institutions                                    teaches us that one more set of goals without
that currently fall below that bottom 5 percent                                      consequences for not meeting them won’t
threshold suggest that not only are they low-                                        do the job. It won’t galvanize the energy and
performers relative to other institutions like them,                                 resources necessary to make real improvements in
but they are objectively low-performers.                                             education institutions. And it won’t save students
To be clear and similar to K-12 precedent, we                                        from the lifetime consequences of debt with no
do not seek identification of exactly 5 percent                                      degree.
of institutions each year. We also do not suggest
immediately implementing sanctions for                                               THE COST OF FAILING COLLEGES
persistent underperformance. Rather, we propose:
                                                                                     Of the total $180 billion federal investment in
   • Fair notice of new minimum performance                                          higher education student aid made each year, over
     standards;                                                                      $100 billion is Title IV aid dispensed only to four-
   • Opportunity to appeal for those institutions                                    year colleges in the form of grant, work-study, and
     that may be the only option within a certain                                    student loan resources (i.e., non-tax benefits). Of
     geographic area or institutions that over-                                      that $100 billion, approximately $15 billion is
     whelmingly serve non-first-time, full-time                                      distributed to some 300 institutions that currently
     students and perform markedly better with                                       reside among the bottom 5 percent nationally in
     those students than with first-time, full-time                                  enrolling low-income students, graduating the
     students;                                                                       students they serve, or graduating students with
                                                                                     manageable debt and degrees that can support
   • Additional financial and technical assistance
                                                                                     that investment without default.iii
     for public and nonprofit private institutions
     struggling to meet success metrics to help                                      For students, the consequences of grossly
     them get up to par; and,                                                        underperforming colleges are severe. Currently,
   • Sanctions only for those that over three or                                     nearly 600,000 undergraduates attend four-year
     four years do not meet the minimum bench-                                       institutions that rest in the bottom 5 percent of
                                                                                     colleges nationally on student success metrics
i. The sample of institutions used for the analysis in this paper includes all
four-year schools that award bachelor’s degrees that have had a cohort of
                                                                                     that measure the likelihood of graduating and
first-time, full-time undergraduates within the last three years (N=2,220). The
bottom 5 percent threshold only applies to colleges without missing data and
                                                                                     repaying student loans.11 Of these students, an
that have at least 30 students in the given cohort (first-time, full-time freshmen
for graduation rates and freshman Pell enrollment rates). Note that this paper
uses data from the 2010-11 academic school year as the benchmark year to
establish initial thresholds for consideration.                                      iii. Low-graduation University of Phoenix campuses alone account for
                                                                                     over one-quarter ($4.1 billion) of the $15 billion federal student aid dollars
ii. After several years, a new bottom 5 percent threshold should be identified       distributed to colleges in the bottom 5 percent of access and success metrics.
to encourage continuous improvement. The minimum performance standard,               Source: Education Trust analysis of Title IV Program Volume Reports, from
therefore, represents a rolling benchmark.                                           Federal Student Aid, U.S. Department of Education.

                                                                                                      THE EDUCATION TRUST | TOUGH LOVE | JUNE 2014                    5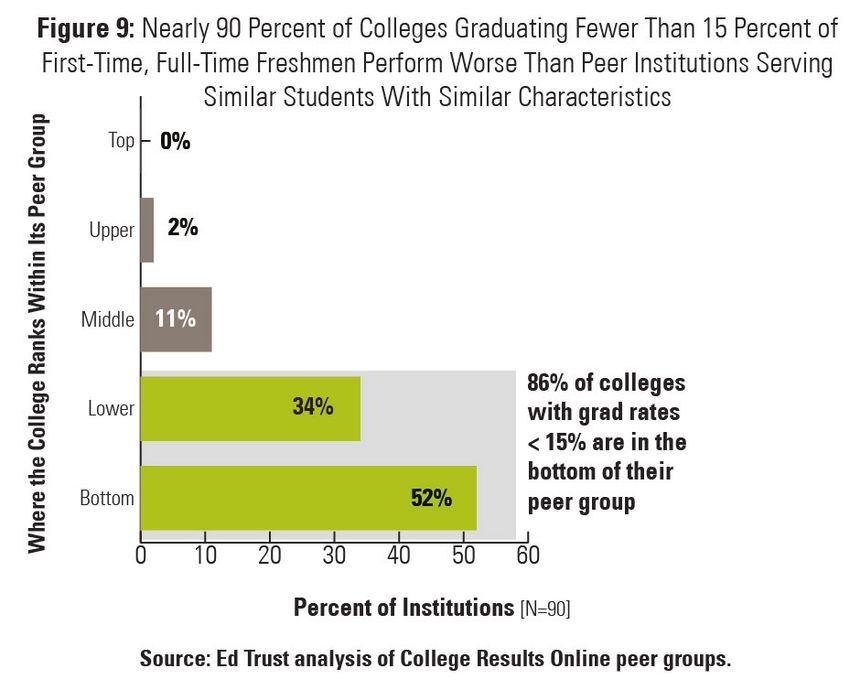
estimated 100,000 will default on their federal                      the necessary forms to receive a Pell Grant. But it’s
student loans within three years of exit.12                          a well-accepted measure of the enrollment of low-
                                                                     income students.20, iv
For first-time, full-time students attending one of
the bottom 5 percent of colleges on graduation                       Among all full-time freshmen enrolled at four-
rates, the chances of leaving school with no degree                  year colleges, roughly 4 in 10 (39 percent) are
are nearly six times greater than the chances of                     Pell Grant recipients. In colleges that fall in the
graduating.13 New full-time students attending                       bottom 5 percent, however, fewer than 17 percent
failing four-year colleges have only a 1-in-2 chance                 of freshmen are Pell students, making these
of making it to their second year. And the first-                    institutions engines of inequality in a country that
time, full-time freshmen we lose nationally after                    already has too much.v
attending just one year at one of these schools
                                                                     Universities falling below the 17 percent Pell
leave with nearly $40 million in student loan
                                                                     threshold are mostly selective, private, and
debt,14 which can have a tragic impact considering
                                                                     wealthy — some very wealthy — colleges (Figures
students who drop out with no degree face a
                                                                     3 & 4). There are a handful of public institutions
fourfold increase in their likelihood of defaulting
                                                                     as well. Together though, these institutions have
on their student loans.15
                                                                     some of the largest endowments in the country.
Likewise, there are serious consequences for                         If their leaders wanted to, they could invest more
talented students from low-income families
who don’t have a chance to attend the mostly
elite colleges that rank in the bottom 5 percent             Figure 3: Which Colleges Are the “Engines of Inequality”?
on low-income student access. Many of these                  What types of colleges are in the bottom 5 percent in Pell freshman
students will enroll in colleges of lesser quality,          enrollment?
if any at all, negatively affecting their chances of
earning a degree.16 Completion rates for students            # Public
                                                                                           #
                                                                                                                          # For-
                                                                            % of           Nonprofit,      % of                         % of
who “under match,” or enroll in less rigorous                Colleges
                                                                            Bottom         Private         Bottom
                                                                                                                          Profit
                                                                                                                                        Bottom
                                                                                                                                                       Barron’s          FY2012
                                                             (% of                                                        (% of                        Selectivity       Endowment
institutions than they are qualified for, are 15             Sector)
                                                                            Five           (% of           Five
                                                                                                                          Sector)
                                                                                                                                        Five
                                                                                           Sector)
percentage points lower than similarly well-
prepared peers.17 And students with some college                                                                                                                         Total:
but no degree have notably lower earnings than                                                                                                                           $168.8
                                                                                                                                                                         billion
those who complete a bachelor’s degree.18                                                                                                              80% in the
                                                                                                                                                                         Average:
                                                                                                                                                       top three
                                                             16 (3%)         15%           89 (7%)          83%            2 (1%)        2%                              $1.7
                                                                                                                                                       levels of
                                                                                                                                                                         billion
THREE PROPOSED STANDARDS                                                                                                                               selectivity
                                                                                                                                                                         Median:
                                                                                                                                                                         $550.3
                                                                                                                                                                         million
Standard #1. A Bottom 5 Percent Standard for Fair
                                                             Notes: Chart displays statistics for the 107 total colleges with Pell freshman enrollment rates below 17 percent. See
Access: At Least 17 Percent of Full-Time Freshmen Are Pell   Figure 4 for a sample listing of four-year colleges and universities that currently rank among the bottom 5 percent on
Grant-Eligible                                               low-income student college access and Appendix Table 1 for a full list.
                                                             Source: Ed Trust analysis of 2011 IPEDS data on Pell freshman enrollment, 2012 IPEDS data on endowment assets, and
                                                             2011 Barron’s data on selectivity.
Highly selective, low-Pell institutions can enroll more
low-income students without compromising admission                   iv. Note that we have made a deliberate choice for the four-year sector in
standards                                                            applying a threshold for the percentage of Pell students enrolled in the
                                                                     freshman class versus the percentage of Pell students enrolled among all
To judge an institution’s service to low-income                      undergraduates. This was meant to capture a measure of access alone and
                                                                     to remove the success component out of the picture because Pell students
student access, analysts traditionally have relied                   tend to have higher withdrawal rates and are less well-represented among
                                                                     upperclassmen.
on the percentage of full-time freshmen eligible
for a Pell Grant.19 It’s not a perfect measure,                      v. We recognize that while some colleges may enroll more than 17 percent
                                                                     of Pell students, they may still charge students very high net prices, which
because some lower income students — despite                         doesn’t make them paragons of socioeconomic mobility. Devising an
                                                                     affordability metric, however, is outside the scope of this paper. We will further
the best efforts of their colleges — don’t fill out                  investigate recommendations around a minimum affordability standard in a
                                                                     separate publication.

6   THE EDUCATION TRUST | TOUGH LOVE | JUNE 2014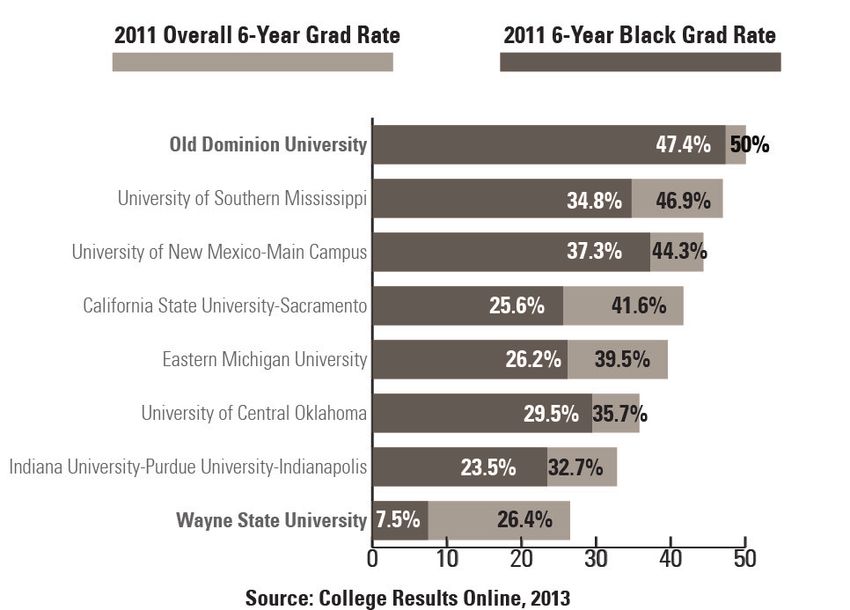
Figure 4: Sample Listing of Colleges Enrolling Fewer                                              UNC–Chapel Hill and Binghamton University
 Than 17 Percent Pell Students in Fall 2010                                                        have comparable admissions standards to U.Va.
                                    % Pell Among 2010                                              and fewer financial resources. In fact, U.Va. is
                                                                       FY2012 Endowment
 College Name                       Entering Class (2011
                                                                       Funds                       twice as wealthy as UNC–Chapel Hill and over 75
                                    Benchmark Year)
                                                                                                   times as wealthy as Binghamton.22
 Washington University in
                                    6%                                 $5.3 billion
 St. Louis (MO)                                                                                    More and more research on the “under matching”
                                                                                                   phenomenon indicates that higher Pell
 Princeton University (NJ)          11%                                $17.4 billion               enrollments at some highly selective universities
                                                                                                   as compared with others are not a fluke: There
 Yale University (CT)               13%                                $19.3 billion               are high-achieving, low-income students whose
                                                                                                   academic credentials place them well within
 University of Chicago (IL)         15%                                $5.7 billion                the band of elite colleges’ current admission
                                                                                                   standards but who for a variety of reasons do not
 University of Virginia (VA)        13%                                $4.7 billion
                                                                                                   apply to or enroll in these selective institutions.
                                                                                                   Nearly two-thirds of low-income students with
 Notes: Full listing of colleges falling in bottom 5 percent in 2011 is in Appendix Table 1. All   high grades and SAT scores do not attend the
 institutions serve at least 30 first-time, full-time students.
                                                                                                   most selective institutions for which they are
                                                                                                   qualified, compared with just over one-quarter
in identifying, recruiting, and enrolling more                                                     of high-income students with similar academic
talented students from low-income families.                                                        credentials.23
When pressed, leaders in these institutions                                                        Our own analysis of ACT data suggests the same
typically argue they can’t find more low-income                                                    — that if highly selective, low-Pell enrollment
students or cannot admit them without lowering                                                     colleges really tried to become engines of
institutional academic standards. But an                                                           opportunity instead of inequality, there are more
examination of national college admissions test                                                    than enough high-achieving, low-income students
data and the actions of individual institutions                                                    who already meet their admission standard of
indicate otherwise. The evidence suggests there                                                    drawing freshmen from the top 10 percent of
are many more very high achieving young people                                                     test-takers nationwide.vi Among ACT test-takers
from low-income families than currently enrolled                                                   over the past three years, 20 percent of students
in highly selective colleges.21 Some institutions                                                  scoring in the top 10 percent came from low-
work at finding and supporting those students,                                                     income families (self-identified as coming from
while other institutions do not.                                                                   families with incomes below $50,000, the rough
Middlebury College in Vermont, for example, in                                                     threshold for Pell eligibility), making surpassing
2011 fell in the bottom 5 percent of all colleges in                                               a 17 percent standard readily attainable without
its enrollment of low-income students: 10 percent.                                                 dramatically compromising admissions standards
Yet equally selective institutions like Amherst                                                    (Figure 5).
College and Vassar College enrolled more than
twice as many low-income students, 23 and 27
percent respectively. We see the same variation
in the public sector. The University of Virginia,
which ranks in the bottom 5 percent on service
to low-income students, enrolled only 13 percent
                                                                                                   vi. The median SAT/ACT score equivalent among colleges in the bottom 5
Pell students in 2011, whereas the University                                                      percent was 1300 (out of 1600), which represents the top 10 percent of scorers
of North Carolina–Chapel Hill and the State                                                        according to College Board. While data was only available to us for ACT test-
                                                                                                   takers, that income data is more complete and reliable than the data available
University of New York at Binghamton enrolled                                                      from College Board for the SAT. Moreover, if 20 percent of ACT test-takers are
                                                                                                   low-income, that suggests that a similar proportion — and larger pool of high-
20 and 26 percent Pell students, respectively.                                                     achieving, low-income students overall — should exist among SAT test-takers
                                                                                                   as well.

                                                                                                                   THE EDUCATION TRUST | TOUGH LOVE | JUNE 2014                 7
Figure 5: 20 Percent of Students Scoring Among the Top
    10 Percent on the ACT Are Low-Income                                                 Standard #2: A Bottom 5 Percent Standard for Education
                                               Percent of Test-Takers Who Are
                                                                                         Success: Graduation Rates of at Least 15 Percent
    ACT Percentile Rank and Score
                                               Low-Income (
and many are weakly prepared for college, with to say, many other for-profit peers have higher
a median SAT score of 800 out of 1600 and an graduation rates.
average high school GPA of 2.7. But so too are the
Indeed, when viewed as a group, the performance
students at Tennessee State University and North
of nearly all colleges with overall graduation rates
Carolina Central University, yet they graduate
of less than 15 percent — such as Texas Southern,
at rates more than three times as high (35.5
Truett-McConnell, and Western International
percent and 38.4 percent, respectively). In fact,
— are concentrated near the bottom of their
Texas Southern performs at the very bottom of its
respective peer groups. These college dropout
closest 15 peer institutions and has for many years
factories typically and markedly underperform
(Figure 8). (See "How Does Ed Trust Define Peer
peer institutions serving similar students —
Groups?”)
almost 9 out of 10 fall in the bottom two quintiles
of their “most similar” institutional peers (Figure
9). (See “Applying the Graduation Standard at the
Subgroup Level.”)
Standard #3. A Bottom 5 Percent Standard Indicating
Preparation for Post-Enrollment Success: Student Loan
Repayment Rates
Institutions can protect students’ debt investment by
helping them graduate with meaningful degrees
So far, we’ve proposed minimum standards for
access and completion. What about a minimum
standard for quality? Might some schools grant
degrees that aren’t worth the paper on which
they are printed? Would the absence of a quality
standard encourage institutions to try to improve
their completion rates by diluting degree-
granting standards and simply passing through
to graduation students who do not exhibit
the knowledge and skills warranting a degree,
effectively serving as “diploma mills”?
These same differences are clear when we Frankly, we’re not so worried because for years
compare graduation rates of other bottom we have studied institutions that have vastly
performers with institutions that are most like improved their levels of student success, and
them. Truett-McConnell College, for example, a virtually all agree that the key is raising standards,
small private university in Georgia, had one of the not lowering them. Nevertheless, our experience
lowest graduation rates among its peer group — with existing diploma mills — many of them
graduating only 13.6 percent of students within for-profit institutions — convinces us that a post-
six years of initial enrollment. Meanwhile, peers enrollment success metric would be a valuable
like Averett University in Virginia and Cazenovia addition in any high-stakes environment.
College in New York serve similar students yet
graduate them at much higher rates (41 percent But unlike in K-12 education, where states
and 49.5 percent respectively). Or take Western regularly assess student learning, there are no
common, widely used assessments in higher
International University, a for-profit college
education. Moreover, post-graduation earnings
located in Phoenix. In 2011, it graduated only
2 percent of all full-time freshmen. Needless
THE EDUCATION TRUST | TOUGH LOVE | JUNE 2014 9institutional exit cohort were able to reduce the
balance on their loans by at least a single dollar
during the previous year.24 Given that the federal
role in higher education revolves so heavily
around student financial aid and student loans in
particular, this makes sense as a minimum quality
standard, both from a student perspective and
that of the taxpayer.
Student loans are by far the riskiest form of
federal financial aid. Students who cannot meet
their debt obligations either because they earn
a degree with little economic value or because
they earn no degree at all will confront life-
damaging consequences of bad credit, including
the inability to take on future debt — like a home
data — which certainly could help identify mortgage or a car loan — and possibly even wage
diploma mills — are still spotty. and tax garnishment.
If it chose to, however, the federal government Students whom colleges encourage to take on
could readily collect institution-level data that debt should have some minimal chance of
would serve as a reasonable basis for establishing graduating with a meaningful degree to support
a minimum college quality standard: student loan that investment. This is especially true for low-
repayment rates. Simply put, these rates would income students whose families do not have
measure what percentage of the students in each resources to help with education-related debt.
ARE IPEDS GRADUATION RATES VALID TO USE?
In order to receive federal financial aid, four-year institutions of higher education must calculate six-year graduation
rates for all first-time, full-time students. This so-called “IPEDS graduation rate,” like the Pell Grant-eligible freshman
enrollment rate, isn’t a perfect measure. It ignores the success of part-time and transfer students, and treats all stu-
dents who leave school as dropouts even if they re-enroll elsewhere. Graduation rates would be a better performance
metric if these problems were fixed in the IPEDS data collection, and we have long supported such efforts.1
It’s important to note, however, that institution graduation rates typically remain the same, or even decrease, with the
inclusion of transfer and part-time students. Including transfer students can nudge overall institution numbers up, but
generally only by a percentage point or two.2 But, because part-time students necessarily take longer to complete
and complete at substantially lower rates, including such students generally reduces institution graduation rates.3 On
balance then, we submit the current IPEDS graduation rate metric is adequate to use — at least until we have more
comprehensive data.
1
See Ed Trust comments to the federal comment request on the Integrated Postsecondary Education Data System (IPEDS) 2013-2016.
2
Ed Trust analysis of transfer graduation rates from our Access to Success Initiative. The Access to Success Initiative is a project of
The Education Trust and the National Association of System Heads that works with 19 state public higher education systems to cut the
college-going and graduation rate gaps for low-income and minority students in half by 2015. The 300 two-year and four-year campuses
enroll more than 3.5 million students, nearly 900,000 students of color and over a million Pell Grant recipients.
3
Ed Trust analysis of part-time graduation rates from our Access to Success Initiative. Also, Alexandria Walton Radford, et al., Persistence
and Attainment of 2003-04 Beginning Postsecondary Students: After 6 Years (NCES 2011-151) (Table 1).
10 THE EDUCATION TRUST | TOUGH LOVE | JUNE 2014These students — a majority of federal student available, a bottom 5 percent threshold applicable
loan borrowers in a given year — need at least to this new metric should be set.viii (See “In the
some basic level of protection from rip-off schools Meantime: Using the Cohort Default Rate to Identify
that are unusually likely to damage their futures.25 the Bottom 5 Percent.”)
A minimum standard based on student loan
repayment rates can serve that protective role,
while also helping to quantify the success of the
TIME AND SUPPORT FOR LOW-
federal investment. PERFORMING COLLEGES TO IMPROVE
Some might argue that the current cohort default Colleges that are low-performers on any of these
rate standard the U.S. Department of Education three minimum benchmarks need fair notice
uses is more than adequate as a protection of the new requirements (at least one year), an
against diluted degrees. We disagree. While three- opportunity to appeal, and time to improve.
year cohort default rates are currently the only Examples of successful appeals may include
quantitative metric the federal government uses colleges that are the only postsecondary education
to measure institutional quality, it’s important to option within a certain geographic area, or
be clear about three of the measure’s limitations: colleges that overwhelmingly serve non-first-time,
(1) default represents the final stage of financial full-time students and can provide evidence that
distress; (2) the current institution eligibility they perform markedly better with those students
threshold attached to the cohort default rate than with first-time, full-time students.
metric is arbitrary and fixed; and (3) if institutions
Recognizing that low-performing colleges,
have sufficient resources, they can fairly easily
especially nonprofit private and public
manipulate their cohort default rates. Some
institutions, are sometimes under-resourced, the
for-profit college corporations, for example,
federal government should be prepared — as it
artificially keep their default rates low by pushing
has been for the bottom-performing K-12 schools
students into forbearance and deferment, thereby
— to provide resources to support improvement
delaying defaults until after the time frame during
efforts. For-profit institutions should not,
which schools are held accountable for results.
however, receive additional federal funds under
Student loan repayment rates would be a much this proposal because the majority already receive
better measure of minimum institutional quality, 75 percent or more of their revenues from the
because they reflect an ongoing record of whether federal government and because their explicit
former students have been able to make at least business model allows them to access capital
a single payment to reduce their federal student needed to support student success.
loan principal balance in the previous year.
Many of the problems underperforming
Colleges that have extremely low repayment rates
institutions confront, however, likely transcend
are likely to have both unusually high dropout
monetary issues. As has been true in K-12
rates and unusually low employment rates, which
education, it may take structural change and
are clear measures of quality problems.
unorthodox authority for new leaders: Simply
A student loan repayment measure would protect sending a new president into a low-performing
against some of the limitations in using cohort college, but then tying his or her hands with
default rates, since repayment rates are not as easy archaic personnel or budget rules won’t be
to manipulate and do not represent only the final sufficient.
stage of financial distress. Currently, however,
repayment rates are not available by institution.
We strongly encourage the Department of viii. We recommend this until the day comes when an invalidating percentage
of students are enrolled in income-based repayment, at which point a new
Education to collect and aggregate repayment metric for post-enrollment success should be determined. With 11 percent of
rate data at the institution level; once that data is borrowers enrolled in income-based repayment currently, we are far from that
day.
THE EDUCATION TRUST | TOUGH LOVE | JUNE 2014 11IN THE MEANTIME: USING THE COHORT improve with a combination of attention and support.
DEFAULT RATE TO IDENTIFY THE BOTTOM Institutions can improve their default rates not only
by raising their graduation rates, but also by imple-
5 PERCENT menting concrete strategies to lower defaults, such
Until overall loan repayment rates are made available as providing individual counseling on loan repayment
by institution, one option to consider is to establish options before and after students leave campus.
a bottom 5 percent threshold based on three-year In the past, we have seen a number of institutions,
cohort default rates. A bottom 5 percent threshold minority-serving institutions in particular, take seri-
applied to fiscal year 2010 three-year cohort default ous, genuine, and coordinated action to work with
rate data would yield a 28 percent benchmark,1 their students in these ways, resulting in a significant
meaning more than 1 in 4 former students are strug- reduction in school cohort default rates.2
gling to find a job with an adequate income to make
student loan payments within three years of exit. Although graduation rates and default rates are cor-
related, among the bottom 5 percent of institutions
WHAT TYPES OF COLLEGES ARE IN THE BOTTOM 5 on graduation rates and default rates, separately
PERCENT IN COHORT DEFAULT RATES? considered, only 20 colleges underperform on both
# Publics % of
#
% of
# For-
% of measures, indicating that default rates do indeed
Nonprofits Profits
(% of
Sector)
Bottom
Five
(% of
Bottom
Five
(% of
Bottom
Five
point out something different than the graduation rate
Sector) Sector)
metric (Figure A).
5 (1%) 4% 34 (3%) 30% 75 (19%) 66%
# HBCUs % of # HSIs % of # Tribals % of
(% of Bottom (% of Bottom (% of Bottom 1. In addition to reducing the current cohort default rate
Sector) Five Sector) Five Sector) Five threshold from 30 percent to 28 percent under this option,
we would also propose that institutions must maintain a
16 (19%) 14% 18 (14%) 16% 0 (0%) 0% three-year average default rate below 28 percent. Under
current law, institutions are “safe” if they can keep their
Notes: Chart displays statistics for the 114 total colleges that have default rates default rate below 30 percent in any given year. Moving to
exceeding 28 percent. Hispanic-serving institutions (HSIs) are defined here as public and a three-year average would make institutions attend to the
nonprofit private institutions whose Hispanic FTE undergraduate enrollment comprises ability of their students to repay loans on a more consistent
at least 25 percent of total FTE undergraduate enrollment. Twenty of these colleges also basis. Regardless, the 28 percent threshold could and should
do not meet our proposed graduation rate benchmark of 15 percent. See Appendix Table be regularly updated every few years, as we propose with
3 for a full listing of four-year colleges and universities that currently rank among the
our access and success metrics, to encourage continuous
bottom 5 percent on default rates.
improvement.
Source: Ed Trust analysis of official FY2010 three-year cohort default rate data from the 2. Dillon, E. and Smiles, R. Lowering Student Loan Default
Department of Education, and 2011 IPEDS data.
Rates: What One Consortium of Historically Black Institutions
Did to Succeed, Education Sector: 2010.
This difficulty may be a reflection of two major fac-
tors: 1) Either a college produces many dropouts with
significant debt and no degree from which to reap
increased earnings; or 2) a college produces gradu-
ates with high debt and degrees with scant economic
meaning or value in the labor market. In either case,
these institutions are not a good bet either for stu-
dents or for federal dollars.
Similar to graduation rates — and as has happened
in the past with cohort default rates — we expect
that most of the institutions that initially fall below
our recommended cohort default rate threshold will
12 THE EDUCATION TRUST | TOUGH LOVE | JUNE 2014THE EDUCATION TRUST | TOUGH LOVE | JUNE 2014 13
During a period of initial notice of                  three-year improvement time frame is at least
underperformance, the federal government should       17 percent. Averaging three years of enrollment
support contracts between entities that have been     information will help guard against any natural
successful in guiding institutional improvement       data fluctuations as well as deter an unintended
and leaders (governing boards, state officials,       consequence where institutions may enroll more
and campus leaders) of public and nonprofit           low-income students only in one of three years to
private institutions with low graduation and low      avoid sanctions (Figure 10).
loan repayment rates that show a commitment
                                                      Four Years to Improve College Graduation Rates
to improvement. Outside groups can help
assess institutional challenges and provide           When and where leaders are truly intentional
recommendations for improvement, technical            about all matters related to student success,
assistance, and support. Institution leaders can      colleges can change completion and post-
and should facilitate a campuswide culture of         enrollment success patterns even for students
inquiry into student success and improvement.26       who are well into the undergraduate experience.27
Department of Education leaders should use            However, in order to provide institutions with a
their influence to broker assistance from major       fair amount of time to intervene with an entire
national foundations and corporations. The goal       cohort of students and form practices that will
should be to improve institutions, not close them.    permanently affect graduation rates, we propose
(See “It Can Be Done: Salish Kootenai College.”)      providing institutions graduating less than 15
                                                      percent of first-time, full-time students at least four
But all this support needs to be accompanied by       years to improve.
clear deadlines and real consequences. Without
those, state and institutional leaders won’t have     Moreover, at the end of four years, if an institution
the leverage they need to bring about change fast     can furnish data showing that they are on track to
enough to make a difference.                          graduate at least 15 percent of its students over the
                                                      next two years (to align with a six-year graduation
Three Years to Improve Pell Enrollment Rates          rate), the secretary of education should be able
Colleges without at least 17 percent Pell student     to grant those institutions an additional two-year
freshman enrollment will have three years to raise
their enrollment of low-income students. This
                                                      Figure 10: Timeline for Improvement
is a sufficient period of time for the admissions
staff, enrollment management team, and other                                          YEAR     YEAR        YEAR   YEAR   YEAR     YEAR
                                                                        1 YEAR
                                                                                        1        2           3      4      5        6
school administrators to adjust recruiting and        ACCESS:
financial aid practices to increase Pell enrollment   17% Pell                        3 years to improve
                                                      Enrollment
in the freshman class. Consider the success of                                                                           2-year grace
institutions like Franklin & Marshall College:        SUCCESS:
                                                                                                                         period if
                                                                                                                         on track to
Despite being in the bottom 5 percent of low-         15% 6-Year                      4 years to improve
                                                                                                                         graduate
                                                      Graduation Rate
access colleges in 2011, Franklin & Marshall has                                                                         15+% of
                                                                                                                         students
since markedly improved low-income student
                                                                        RECEIVE
enrollment, and did so quickly following a                              NOTICE OF
commitment by institution leadership. (See “It                          UNDER-
                                                      POST-             PERFORMANCE
Can Be Done: Franklin & Marshall College.”)           ENROLLMENT
                                                      SUCCESS:
Based on the Franklin & Marshall example and          Loan Repayment                  3 years to improve
                                                      Rates or
our analysis of ACT data, we submit that a three-     Revised CDR in
year improvement window provides institutions         Interim
with sufficient time to exhibit meaningful growth;
colleges will be deemed successful only if the
average Pell freshman enrollment during the

14   THE EDUCATION TRUST | TOUGH LOVE | JUNE 2014
grace period. To ensure meaningful, consistent students, first and foremost, and a finite public
improvement and provide some flexibility investment ultimately must be protected from
for natural data fluctuations, colleges will be continued harm.
considered successful if their average graduation
In the case of chronically and dramatically
rate during this improvement time frame is at least
low-performing colleges, the two categories of
15 percent.
federal aid — (1) tax breaks and grants that go to
Three Years to Improve Student Loan Repayment Rates colleges, universities, and affiliated foundations;
When student loan repayment rates become and (2) tax benefits, grants, and loans that go to
available at the institutional level and a bottom students and families — do little to promote the
5 percent threshold is established, colleges with primary purposes of federal investment in higher
low loan repayment rates should also receive time education: low-income student access and degree
to improve. We suggest not making a decision completion. Indeed it could be argued that they
on the specific time frame for improvement until serve instead to protect and even enhance the
the data becomes available, in order to determine attractiveness of weak institutions, many of whose
a time period most appropriate to this metric. students would be better served elsewhere. We
But we would suggest institutions should have suggest federal resources be leveraged differently
at least three years to improve their repayment to better serve the national interest in improving
rates, and that upon notice of underperformance, postsecondary outcomes, especially for low-
institutions have to evidence at least a three-year income students (Figure 11).
average repayment rate that is above the threshold Figure 11: Summary Chart of Ultimate Consequences
to demonstrate meaningful improvement.
Institutional Institutional Student Student
The bottom 5 percent threshold suggested for each Tax Grants Tax Grants
& Loans
metric is meant to be updated and recalculated
Charitable TRIO AOTC Pell
regularly to represent the evolution (and expected deductions for
Campus- Lifetime Stafford loans
improvement) in the field on the whole. We institutions
based aid learning
and their PLUS loans
recommend new bottom 5 percent thresholds affiliated Competitive
credit
be recalculated at the end of each improvement foundations federal-state Student loan
money interest
time frame: every three years for Pell freshman deduction
enrollment and repayment rates or cohort default Personal
rates, and every six years for graduation rates. exemption
for students
These thresholds will continue to be updated over age 19 and
time until they are no longer needed, such as if over
all institutions enroll a proportion of low-income Qualified
tuition
students that equals a high percentage of the programs
national average of such students. Access:
Pell
Enrollment X X
ULTIMATE CONSEQUENCES FOR CHRONIC “Engines of
Inequality”
LOW-PERFORMERS Success:
Graduation
Rates X X X X
If at the end of multi-year grace periods for “Dropout
improvement, relevant colleges still are not rising Factories”
above the bottom 5 percent threshold established Post-
Enrollment
years prior, the federal government has to take Success:
the next step: reduce if not eliminate its financial Loan
X X X X
Repayment
investment in institutions that consistently fail Rates
to serve their students and the nation. Vulnerable “Diploma
Mills”
THE EDUCATION TRUST | TOUGH LOVE | JUNE 2014 15Engines of Inequality — Bottom Performers in Enrolling To be clear, we recommend these colleges lose
Students From Low-Income Families access only to institution-based aid, not that
Colleges that effectively and repeatedly choose to their students lose access to direct student-based
operate as engines of inequality, failing to enroll financial aid. Our goal is to protect and help
a bare minimum percentage of low-income needy students. Low-income and hard-pressed,
students, should lose access to institution-based middle-income students who currently attend
federal aid. If there is to be a shared responsibility these low-access colleges will still maintain
for college access and success, then at some point access to Pell Grants, federal student loans, and
the federal government should no longer permit student tax benefits — particularly the American
low-access institutions of higher education — or Opportunity Tax Credit — ensuring that they are
their affiliated foundations — to take advantage able to continue to attend and complete their
of the tax code to receive tax-deductible charitable studies.
donations or institutional campus-based aid
in the form of the Supplemental Education College Dropout Factories and Diploma Mills — Colleges
Opportunity Grant and federal work-study, or Failing to Improve on Completion or Success
competitive federal dollars, including those Postsecondary education institutions that
awarded through the TRIO and GEAR UP continue to operate as college dropout factories
programs and any future federal-state partnership after four-to-six years of consistent failure or
initiative.28 continue to operate as diploma mills whose
The mostly selective, private, and fairly wealthy students cannot earn enough post-graduation
colleges that might be affected by this proposal to repay their loans without default should face
may argue that their services — to teach, conduct serious consequences: They should be subject to
research, and provide public service — are critical losing not only institutional-based aid, but also
to the overall well-being of a democratic society; eligibility to receive all forms of federal student-
as such, they are fulfilling their mission as public based aid, including federal student loans.ix
charities and should continue to receive some Why such a seemingly draconian step? Because
federal tax relief. But colleges that receive their prospective students should not enroll in these
tax-exempt status on the basis of their educational poor-performing institutions on the taxpayers’
mission have a primary responsibility to serve dime. It’s neither an efficient nor effective use of
the public good through education. By not finite public resources. And the virtual absence
supporting even a minimum number of qualified, of institutional accountability makes the federal
low-income students, they fail the public interest government complicit in harming vulnerable
in a crucial way — by calcifying rather than students who are highly likely to be financially
ameliorating societal inequities. injured by these institutions or at the very least
For institutional grants, the federal government lose ability to access time-restricted Pell Grant
originally provided TRIO and campus-based aid funds.
as supplemental funds to help institutions of In the end, taking away all federal aid is the only
higher education and others provide outreach way to send an unequivocal message to students
and support to students from disadvantaged
backgrounds. But it’s clear that those dollars ix. There is, of course, the concern that if we cut off all federal aid, students still
wanting to go to these schools will have to turn to private loans, which carry
are not achieving their intended impact at these higher interest rates and less borrower protection. While that is a theoretical
possibility, we think it’s unlikely a private bank will lend to students to attend
colleges, if after repeated years, they still do not an institution labeled a college dropout factory or diploma mill. In fact, given
enroll a bare-minimum percentage of low-income how risky an investment these institutions of higher education are, it would
make sense for the Consumer Financial Protection Bureau — a supervisor of
students. These scarce funds would be better spent private lending institutions — and/or bank regulators to consider regulating
how much of a private lender’s portfolio may be tied up in dropout factories
elsewhere, i.e., at institutions that do prioritize and diploma mills.
needy students and contribute to the public good.
16 THE EDUCATION TRUST | TOUGH LOVE | JUNE 2014APPLYING THE GRADUATION STANDARD AT THE SUBGROUP LEVEL
Should we apply the graduation standard to demographic subgroups? Graduation rate data make it very clear
that at the aggregate level and at most institutions, there are significant differences in the rates at which differ-
ent subgroups of students complete. On average, black, Latino and American Indian freshmen complete their
degrees at rates far below those of white and Asian students.1 The pattern is the same for Pell students.2 But
these gaps are not inevitable: At institutions that work hard to support their students, there are often small or no
gaps between student groups.
Given that low-income students and students of color now constitute a majority of the young people in this
country, it is important for the federal government to signal its concern about these gaps and the need for them
to be closed.
Metrics to this effect could be included in any overall postsecondary accountability system. But there is no
reason to wait for a comprehensive system to be developed, tested, and put into place. Instead, the federal gov-
ernment could send a powerful signal of its concern by applying a minimum graduation rate standard not just
at the institution level, but also separately for every significant group of students. For example, while an institu-
tion might have an overall six-year graduation rate of 32 percent, if its graduation rate for, say, black or Latino
students fell consistently below the 15 percent standard, that institution would have to work hard to improve
its record. (See Appendix Table 2B for a listing of colleges that serve one or more subgroups of students inad-
equately.)
Consider, for example, Wayne State University.
Wayne State’s overall six-year graduation rate
in 2011 was 26 percent — nothing to write home
about for sure. But the university did a particularly
abysmal job serving African American students,
over 90 percent of whom fail to complete a degree
within six years of initial enrollment. That’s right;
Wayne State graduated less than 10 percent (7.5
percent in fact) of its African American students in
2011. It doesn’t have to be this way: Old Dominion
University in Virginia — a Wayne State peer serv-
ing a similar student body — graduated African
American students at a rate nearly 40 percentage
points higher (47.4 percent).
Clearly, Wayne State needs a push to address
the needs of its black students more seriously. Its
black-white graduation rate gap of 31 points is considerably larger than the national average of 23 points.3 Yet
Wayne State is not alone. Some institutions are clearly more vigilant than others at making sure all their stu-
dents have the best possible chance of success.
Interestingly though, institutions like Wayne State may need a push for an even bigger reason. When we ex-
amined the subset of colleges with graduation rates below 15 percent for a particular subgroup(s), the majority
of these institutions also have overall graduation rates that are substantially lower than their peer institutions.
More than 8 in 10 fall toward the bottom of their peer groups. The median college within this group of institu-
tions graduates only 23 percent of all students. So while these colleges may have overall graduation rates
exceeding 15 percent, their overall performance with students is still lacking.
_________________
1
National Center for Education Statistics (NCES), Enrollment in Postsecondary Institutions, Fall 2012; Financial Statistics, Fiscal
Year 2012; and Graduation Rates, Selected Cohorts, 2004-2009, First Look (Table 3).
2
Ed Trust analysis of 2003-04 Beginning Postsecondary Students survey, from the U.S. Department of Education.
3
NCES, Enrollment in Postsecondary Institutions, Fall 2012; Financial Statistics, Fiscal Year 2012; and Graduation Rates, Selected
Cohorts, 2004-2009, First Look (Table 3).
THE EDUCATION TRUST | TOUGH LOVE | JUNE 2014 17RESTRICTING CHOICE? ers may still be concerned that this proposal would
restrict student choice within particular sectors.
Some low-performing institutions on gradua-
tion rates or default rate metrics are for-profits or Let’s examine the numbers. Currently 600,000 un-
minority-serving institutions. While we expect most dergraduates — representing 6 percent of all un-
of these institutions to improve with the pressure dergraduates and just slightly over 10 percent of
and support provided in this proposal, some observ- African American, Hispanic, and American Indian
students — are concentrated in institutions that are
bottom performers on our proposed student success
measures.1 If these bottom performers don't improve
after time and support to do so, and tough sanctions
take effect, will new students seeking an education
at a for-profit, online, or minority-serving institution
continue to have options to receive a college educa-
tion at the same type of institution?
In every case, the answer is yes. Regardless of
institution type, only a small percentage of seats are
affected. The only exception is tribal colleges, and
many of these are likely to be exempted based on
geographic isolation.
1. This includes first-time, returning, full-time, and part-time students attending
the 199 colleges that fall in the bottom 5 percent on graduation rates and
student loan default rates. Student loan default rates are a proxy for those
institutions that might underperform on a loan repayment metric.
HOW DOES ED TRUST DEFINE Carnegie classification
PEER GROUPS? Percent of degrees awarded in STEM
For the past 10 years, The Education Trust, through Student Characteristics
its College Results Online Web tool, has established
a methodology to identify each college’s group of Estimated median SAT or ACT equivalent of fresh-
peer or “similar” institutions. Our algorithm is public man class
and has been vetted by a series of outside technical Average high school GPA among college freshmen
experts over the years. Percent of Pell recipients among full-time freshman
For public and private nonprofit institutions, we have class
identified 12 institutional and student-related charac- Percent of undergraduates enrolled part-time
teristics that significantly predict six-year graduation Percent of Full-Time Equivalent undergraduate stu-
rates. Our 2011 peer groups, for example, were based dents age 25 and over
on the following variables:
The same algorithm can’t be used for for-profit institu-
Institutional Characteristics tions because certain variables are not available and/
or applicable to this sector (e.g., SAT, Barron’s, GPA).
Sector (public vs. private) Instead, we use filters on the same characteristics to
Size (number of Full-Time Equivalent undergradu- ensure similar colleges are compared to each other.
ates)
Status as a commuter campus See our Frequently Asked Questions section at www.
collegeresults.org for more information, including
Barron’s admission selectivity weights associated with each characteristic utilized in
Student-related expenditures per Full-Time Equiva- identifying peer groups.
lent undergraduate
18 THE EDUCATION TRUST | TOUGH LOVE | JUNE 2014You can also read