CHAPTER 8: BENIN'S INFORMAL TRADING WITH NIGERIA - Economic Development ...
←
→
Page content transcription
If your browser does not render page correctly, please read the page content below
BENIN INSTITUTIONAL DIAGNOSTIC       WP19/BID09

CHAPTER 8:
BENIN’S INFORMAL
TRADING WITH NIGERIA

Stephen S. Golub
Swarthmore College
Ahmadou Aly Mbaye
University Cheikh Anta Diop of
Dakar

With discussion by
John O. Igué
Laboratoire d'analyse régionale et
d'expertise sociale (LARES)

August 2019
Benin’s Informal Trading with Nigeria

Table of contents

Acknowledgements                                                                         1
1         Introduction                                                                   2
2         Historical economic relations between Benin and Nigeria                        4
3        Causes of informal trade: Nigeria’s pervasive distortions incentivise smuggling 8
     3.1    Import protection in Nigeria                                                  8
     3.2    Macroeconomic and exchange rate policies in Nigeria                          10
     3.3    Subsidised fuel prices                                                       10
     3.4    Port efficiency                                                              11
4         Magnitude of entrepôt trade between Benin and Nigeria                          13
5        The institutional structure of ICBT in Benin: highly organised informal trade   20
     5.1    Customs regimes                                                              20
     5.2    Social organisation of informal trade                                        22
6        The effects of informal trade on Benin                                          28
     6.1    Effects on national income and employment                                    28
     6.2    Effects on government revenues                                               29
7         Summary and policy conclusions                                                 33
References                                                                               36
Discussion of ‘Benin’s informal trading with Nigeria’                                    38

© Economic Development & Institutions                                                         i
Benin’s Informal Trading with Nigeria Acknowledgements We thank the participants of the Benin diagnostics workshops held in Brussels in September 2018 and in Cotonou in March 2019 for their comments. We also thank Justin Clohounto and Serge Dejinou for helpful research assistance in Benin and Togo. © Economic Development & Institutions 1
Benin’s Informal Trading with Nigeria

1            Introduction
Benin’s approximately 800 km north–south border with Nigeria plays a critical role in Benin’s
economy. Nigeria’s population of around 190 million is nearly 20 times larger than Benin’s
and the differential in gross domestic product (GDP) is even larger, with Nigeria’s output
equal to nearly 40 times Benin’s, reflecting Nigeria’s oil wealth rather than a higher standard
of living. Thus, the economic relationship between the two countries is necessarily
asymmetric, with Nigeria’s influence on Benin much more powerful than vice versa.
Moreover, Nigeria’s combination of massive oil wealth, interventionist economic policies, and
high levels of corruption has led to pervasive distortions and inefficiencies.

It is in this context, during the first oil shock in 1973, that Benin adopted a development
policy centred on serving as an ‘entrepôt state’ vis-à-vis its neighbours, particularly Nigeria
(Igué and Soulé, 1992). That is, Benin aimed to expand its role as a trading hub, importing
goods and re-exporting them to Nigeria, thus profiting from the distortions in Nigeria’s
economy. Heibrunn (1999) aptly described Benin as the ‘Flea on Nigeria’s Back’.

Benin’s dependence on Nigeria is not apparent from official trade statistics, with Benin’s
reported trade with Nigeria accounting for only about 6% of Benin’s exports and 2% of
Benin’s imports in 2015–171. These official statistics are very misleading, however, as they
ignore the huge unrecorded informal trade between the two countries (Benjamin, Golub, and
Mbaye, 2015). As we discuss in detail below, Benin imports very large quantities of
consumer goods that are subject to high import protection in Nigeria and then transships
them to Nigeria through elaborate institutional mechanisms. Conversely, Benin illegally
imports a large proportion of its petroleum products from Nigeria, where consumer prices are
highly subsidised. This two-way informal cross-border trade (ICBT) has in the past
accounted for a large share of Benin’s income, employment and fiscal revenues. Recently,
however, the volume of this trade has dropped considerably due to a recession in Nigeria,
revealing its fragile foundations. This chapter will analyse the nature, institutional
foundations, and consequences of ICBT between the two countries, and it will draw out
policy implications.

ICBT is pervasive in sub-Saharan Africa, reflecting a confluence of historical and institutional
factors: artificial national borders established in the colonial era and maintained after
independence; porous borders between contiguous nations; a long history of regional trade
predating the colonial era; kinship groups that transcend national borders; weak border
enforcement capabilities; corruption of high- and low-level officials who profit from collusion
with traders; and perhaps most importantly lack of coordination of economic policies among
countries sharing these borders (Golub, 2015). We will show how these factors play out in a
particularly dramatic way in Benin.

An interesting dimension of regional ICBT is the intense competition between Benin and
Togo for informal access to the Nigerian market. Togo is less well situated geographically
than Benin for transshipping to Nigeria, since goods coming from Togo must go through
Benin or Niger, but Togo compensates in part through lower taxes and fees (Golub, 2012).

1   Based on data from International Monetary Fund (IMF) Direction of Trade Statistics online.

© Economic Development & Institutions                                                             2
Benin’s Informal Trading with Nigeria

Although land-locked, Niger is also heavily involved in smuggling to Nigeria (Hashim and
Meagher, 1999); so too is Cameroon, though to a lesser extent (Golub and Kobou, 2019).

Benin has developed elaborate institutional mechanisms to support ICBT, notably through
specific customs procedures. In some respects these mechanisms are quite efficacious,
belying the notion that institutions in Benin are dysfunctional. At the same time, however, the
national priority placed on promoting unofficial trade is not a viable long-run strategy for
development. The recent downturn in the re-export trade starkly reveals Benin’s vulnerability
to shocks in Nigeria. Even more so than for other countries of the region, Benin’s economy is
dominated by the informal sector, which provides a dubious foundation for sustainable long-
term development (Benjamin and Mbaye, 2012; Mbaye, Golub, and Gueye, 2019).

Despite the vulnerability to shocks in Nigeria and the questionable sustainability of informal
trade, Benin’s heavy dependence on this trade for government revenues and the numerous
beneficiaries among both formal and informal operators explains the government’s
reluctance to crack down on smuggling. Furthermore, even if the government were
determined to shut down informal trade with Nigeria, it would be difficult to do so as long as
the underlying incentives created by Nigeria’s distortions remain. Large price differences
between adjacent countries with porous borders are an invitation to smuggling that ingenious
traders are bound to exploit. Thus, rather than focus on eradicating ICBT, the government
should pursue policies to diversify Benin’s economy to reduce its vulnerability to Nigeria’s
instability.

In this chapter, we focus on two of the main dimensions of Benin’s ICBT with Nigeria:
imports of goods subject to heavy protection in Nigeria, particularly used cars and rice, which
are then re-exported to Nigeria; and Benin’s imports of petroleum products, which are highly
subsidised in Nigeria. The remainder of the paper is organised as follows. Section 2 provides
historical background. Section 3 discusses the effect of divergent economic policies as a key
driver of informal trade between Benin and Nigeria, particularly Nigeria’s high import
protection and fuel subsidies. Section 4 provides evidence on the magnitude of informal
trade. Section 5 describes the institutional processes governing informal trade, particularly
the role of customs administration, with illustrations in the cases of used cars, rice, and
petroleum products. Section 6 analyses the effects of informal trade on Benin’s economy,
particularly fiscal revenues. Section 7 concludes.

© Economic Development & Institutions                                                         3
Benin’s Informal Trading with Nigeria

2           Historical economic relations between Benin and
            Nigeria
Benin and Nigeria have deep historical economic ties, reflecting their geographical and
cultural proximity. The two countries share several languages and ethnicities. Trade within
the region predates the colonial period, was altered by colonial economic and political
relations, and further adapted to post-colonial political and social developments, most
importantly divergent trade and other economic policies.

Yoruba, Hausa, and Ibo trading networks operated prior to the colonial era, but expanded in
response to the arrival of European traders in the 17th century (Igué and Soulé, 1992;
Hashim and Meagher, 1999). Long-distance caravan trade routes linking coastal West Africa
with the Sahara and the interior were based on artisanal and ecological comparative
advantages, but even in pre-colonial times trade patterns of taxation and tolls impinged on
trading routes. The kingdom of Dahomey, corresponding geographically to contemporary
Benin, had highly developed institutions that facilitated economic ties with Europe, notably
the slave trade centred around the town of Ouidah. English, Portuguese, Dutch, and French
ships arrived in Ouidah loaded with tobacco, liquor, guns, and miscellaneous items of cheap
junk much prized by the local population, which were exchanged for large numbers of
slaves. The slave trade was a major source of revenue for the kings of Abome, who
designated a special representative (‘Yovogan’ or ‘chief of whites’) to administer the trading
relationships between leading local merchants with European slave traders (Igué and Soulé,
1992).

In the second half of the 19th century, as the slave trade collapsed, traders switched from
slaves to palm oil, transacting with French trading firms from Marseille, which created trading
posts in Dahomey exporting palm nuts and oil in exchange for tobacco, guns, cloth, and
vegetables.

The official colonisation of Dahomey in 1894 by the French altered trading relationships for
several reasons. The French colonial government granted a monopoly to French trading
companies, spurring the creation of unofficial networks by displaced local businessmen. The
geographic situation of the new colony of Dahomey, sandwiched between German-
controlled Togo and English-controlled Nigeria, provided a corridor for French trade with
their land-locked colonies, Niger and Upper Volta (now Burkina Faso), creating a precursor
to Benin’s role as an entrepôt. Furthermore, Dahomey’s relatively advanced educational
system reinforced its advantage as a commercial hub. The Yoruba group’s spread provided
a network across the region along the Gulf of Guinea.

The colonial borders between Dahomey and Nigeria were largely retained as national
frontiers when the countries gained independence in the 1960s. These borders artificially
separated people sharing similar cultural backgrounds, who largely disregarded official
borders in their social relations. As Isyaku (2017, pp. 210–213) describes it: ‘The traditional
rulers have always refused to accept this situation [partition]...The socio-cultural relationship
between the two states is further fostered by the fact that Yoruba groups occupying the
contiguous localities claimed a common origin from Ile-Ife, spoke… dialects of the same
language and possessed similar political, social and religious institutions. Economic links,
particularly commercial routes and markets, contributes to this cultural uniformity.’

© Economic Development & Institutions                                                               4
Benin’s Informal Trading with Nigeria In the post-colonial period, kinship groups continued to play a major role in organising informal trade between Benin and Nigeria, notably the Yoruba (Igué and Soulé, 1992; Igué, 2003; Golub and Hansen-Lewis, 2012). Along the northern frontier between the two countries, the Hausa are dominant. Adherence to Islam is a source of solidarity and motivation for both the Hausa and Yoruba, providing security for transactions, mutual assistance, and credit, all based on trust rather than formal contracts (Sudarkasa, 1985). In recent years, however, there have been numerous clashes between Yoruba and Hausa traders over control of markets (Porter et al., 2010). Informal trade was boosted by the instability in Nigeria following the Biafra war in 1967, with an influx of Ibo refugee traders into Benin, and Benin supplying goods to sections of Nigeria cut off from supplies. During the war, Benin became a major cocoa exporter, despite non- existent production of this product, as Nigerian cocoa was diverted through Benin. Starting in 1973, Benin adopted low-tariff policies to facilitate the entrepôt role of Cotonou to take advantage of the oil boom in Nigeria following the first oil shock. Benin also took steps to expand access to credit to importers by opening up the banking system, and deregulated the importation of key products, such as rice, formerly monopolised by state-owned firms. The Marxist government of Benin deployed the nationalised banking system in favour of the re-export trade. These credits were limited to Beninese nationals, with defaults on these loans contributing to the banking crisis of the late 1980s (Hashim and Meagher, 1999). During the 1980s and 1990s, Benin took several further steps to liberalise its imports. Customs duties were waived on the two main items re-exported to Nigeria at that time: rice and cloth. In 1985, the state monopoly on imports was eliminated. In 1993, all remaining quantitative restrictions on imports were removed. In 1994, a simplified system of customs duties with a maximum rate of 20% was established, with rice and cloth still exempt (IMF, 1996). The West African Economic and Monetary Union (WAEMU), a group of mostly francophone countries of which Benin is a member (and of which anglophone Nigeria is not), established a common external tariff (CET) in 2001 that lowered import duties for most member countries but raised them for Benin (and Togo), particularly for cloth, rice, and other important re-export goods (Soulé, 2000, Table 7.3). Nevertheless, the WAEMU duties remained well below those in Nigeria. Moreover, Benin has found ways of circumventing WAEMU import taxes by exercising customs valuation with consideration discretion, and most importantly making greater use of special customs regimes for transit and re-exports, through which it imports at very low tax rates. These customs regimes are described in detail in Section 5 below. Both Benin and Nigeria are members of the larger regional group the Economic Community of West African States (ECOWAS), which encompasses both the francophone and Anglophone nations of West Africa. ECOWAS has progressed far less than WAEMU in regional integration. Some cooperative regional efforts have advanced, particularly in the political realm, but Nigeria is large enough that it has seen little need to coordinate with its much smaller neighbours, and it has sometimes obstructed or failed to implement ECOWAS harmonisation efforts (Hoffman and Melly, 2015). After numerous delays, ECOWAS agreed to a CET in 2013. Although Nigeria is among the countries that have adopted the CET in principle, in practice it has not fully implemented this regime or has availed itself of escape clause provisions that allow higher protection. Thus, a number of Nigerian imports face tariffs © Economic Development & Institutions 5
Benin’s Informal Trading with Nigeria

which exceed the ECOWAS maximum of 35%, and there remains a list of items facing
outright bans, as discussed below.

Nigeria has made repeated threats to eradicate smuggling, but with little lasting effect. The
borders have sometimes been closed due to other political tensions between the two
countries. From February 1984 to February 1986, Nigeria shut down the border with Benin in
an effort to curb smuggling of petroleum products out of Nigeria. During this time, Nigeria
closed down all service stations within 10 km of the border with Benin, in a futile attempt to
curb smuggling. Heilbrunn (1999) observes that the effects of the border closures were
short-lived at best and that the recession in Nigeria in 1985 had far larger effects on lowering
ICBT than the ineffectual measures of the Nigerian authorities.

In 1996, President Abacha of Nigeria closed the border in a political dispute with Benin’s
President Soglo, related to the latter’s military cooperation with the United States, which
Abacha viewed as a threat. The resulting dislocations in Benin, notably gasoline shortages,
contributed to Soglo’s loss in the 1996 presidential elections.

In August 2003, the border was closed for a week following a confrontation between the
Nigerian and Beninese governments precipitated by the harbouring of a suspected Nigerian
criminal in Cotonou.2 Only when he was turned over to the Nigerian authorities following a
meeting between Obasanjo and President Kerekou of Benin in Badagry, Nigeria, was the
border re-opened. Following the meeting, the two presidents issued the ‘Memorandum of
Badagry’, which committed the Benin and Nigerian governments to fostering formal trade
relations while curtailing smuggling and criminality. In March 2008, Nigeria initiated a
crackdown on imports of used cars, holding up car convoys at the usual crossing points such
a Kraké and Igolo3. More recently, President Buhari has taken a number of measures to curb
smuggling from Benin, notably prohibiting imports of rice and car imports through land
borders once again.

Notwithstanding these occasional border closings and frequent threats from Nigeria, the re-
export trade has always recovered as the enforcement of border controls reverts to its
normal laxity. A sharp downturn in informal trade in 2015–2017 for some products, notably
used cars, has yet to be fully reversed. As discussed below, this prolonged decline is likely
due more to the recession in Nigeria dampening demand than to border closures.
Regardless, these episodes reveal Benin’s acute vulnerability to economic shocks from
Nigeria.

Officials from Benin and Nigeria have recently announced joint efforts to curb smuggling.4
Further, the two governments have just opened a joint centre for customs control at the
largest official border crossing between the countries—the Seme-Kraké corridor. As
commentators have noted, however, most smuggling does not go through official border

2 The case involved the assassination of one of then-Nigerian President Obasanjo’s nieces in a carjacking in
Lagos. The carjacking ring stole cars in Nigeria and took them to Cotonou. The head of the carjacking ring,
Tidjani Hamani, a Niger national, was based in Cotonou, where he was released by the Benin judiciary after
having been arrested.
3 ‘Difficultés commerciales entre le Bénin et Le Nigeria: Embargo sur les véhicules d’occasion venues de

Cotonou,’ Le Matinal (Benin), 14 March 2008.
4 www.illicit-trade.com/2018/08/nigeria-niger-and-benin-to-hold-counter-rice-smuggling-summit/, 7 August 2018.

© Economic Development & Institutions                                                                            6
Benin’s Informal Trading with Nigeria

posts, so the utility of this initiative is questionable.5 More generally, the implementation of
anti-smuggling measures is likely to remain ineffectual given the disparate interests of the
countries involved, and, more importantly, given the beneficiaries of smuggling within them,
as described below.

5 www.jeuneafrique.com/depeches/654673/politique/entre-le-nigeria-et-le-benin-un-nouveau-poste-frontiere-sur-
la-route-de-lenfer/

© Economic Development & Institutions                                                                           7
Benin’s Informal Trading with Nigeria

3           Causes of informal trade: Nigeria’s pervasive
            distortions incentivise smuggling
The most important underlying source of Benin’s informal trade is Nigeria’s dysfunctional
economic policies, which provide incentives for traders to profit from circumventing them. It
is beyond the scope of this chapter to analyse in detail the reasons for Nigeria’s corruption
and mismanagement, but it surely reflects a combination of Nigeria’s size, ethnic
fractionalisation, and oil wealth. Indeed, Nigeria has been one of the starkest examples of
the ‘resource curse’, whereby natural resources such as oil contribute to inefficiencies and
corruption (Venables, 2016). Revenues from natural resources crowd out manufacturing and
agriculture. Nigeria has attempted to maintain its industrial and agricultural base through
import substitution, but this has largely fostered inefficiency and incentives for evasion.
Worse, large resource rents can provide an irresistible political temptation to engage in the
notorious wasteful spending and corruption that occur in Nigeria.

In effect, therefore, Nigeria’s resource curse and institutional weaknesses have been
transmitted to Benin. The distortions in Nigeria fuelled by oil and corruption provide
economic rents to smugglers in Benin, so much so that much of Benin’s institutions, both
formal and informal, have evolved to capture these rents.

The dominance of the informal sector and the artificial nature of national borders in West
Africa are also crucial underlying causes of the informalisation of trade. Throughout West
Africa, and particularly in Benin, the informal sector represents approximately 50% of GDP
and 90% of employment. The ascendency of the informal sector, including ICBT, is both the
cause and effect of the weakness of the formal sector. With the economic crisis and
subsequent structural adjustment programmes of the 1980s, government employment
dropped sharply in Benin as in other sub-Saharan countries and formal private sector
employment failed to pick up the slack as the business environment remained poor (Golub
and Hayat, 2015). The informal sector became the employer of last resort, particularly for
young people newly entering the labour market, even those with substantial education
(Benjamin and Mbaye, 2012; Mbaye, Golub, and Gueye, 2019). Many of the informal
gasoline transporters and retailers are young people with secondary education who are
unable to obtain formal jobs. The booming informal sector in turn contributes to the hostile
climate for formal business investment, creating a vicious cycle.

Moreover, contrary to common perceptions, the informal sector is in some respects better
organised than the formal sector, with large informal firms often rivalling formal firms in size,
and kinship groups linking together informal operators into networks that cross borders and
even continents. The Yoruba and Hausa are particularly important for Benin–Nigeria ICBT,
as previously noted.

3.1         Import protection in Nigeria
Nigeria has long had some of the most restrictive import barriers in the world, including very
high tariffs and import prohibitions, while Benin (and Togo) have deliberately maintained low
import taxes to foster their roles as entrepôts for Nigeria (Igué and Soulé, 1992). Recent
research has confirmed the importance of Nigeria’s import barriers in driving unofficial

© Economic Development & Institutions                                                               8
Benin’s Informal Trading with Nigeria
exports from Benin to Nigeria (Golub, 2012; Raballand and Mjekiqi, 2010; Bensassi, Jarreau,
and Mitaritonna, 2018).
Table 1 displays Nigeria’s import restrictions on some of the key products of the re-export
trade as they have evolved over time. Unlike Benin (and Togo), Nigeria has aggressively
promoted domestic manufacturing and agricultural industries through import substitution,
unfortunately usually resulting in highly inefficient production, with powerful interest groups
favouring continued protection. While Nigeria has liberalised some sectors as part of the
ECOWAS harmonisation efforts noted above, including reducing the number of goods that
are subject to import bans, progress has often been reversed. For example, in 2015 Nigeria
lifted its import ban on textile (cloth and clothing) imports but then raised the import tariff to
45% in 2016 and placed textiles on a list of goods that were ineligible to use the official
foreign exchange market, in effect raising transactions costs via a de facto additional tax on
imports to the extent that the unofficial exchange rate tends to be depreciated relative to the
official rate.
Import taxes on goods for domestic consumption have generally been lower in Benin than
Nigeria. With the advent of the ECOWAS CET in 2015, these differences have declined for
many goods but for goods on domestic consumption and others subject to special protection
in Nigeria large gaps remain. Furthermore, import duties in Benin are largely irrelevant for
unofficial trade to Nigeria as products destined for diversion to Nigeria are mostly imported
via special transit and re-export regimes with very low tax rates, rather than for domestic
consumption, where normal duties and value added taxes apply. In cases where Nigerian
protection is particularly elevated, it can still be advantageous to import goods for domestic
consumption and re-export to Nigeria, but clearly importing under transit and re-export status
is even more attractive. The extent to which imports intended for Nigeria enter under a
regime for transit rather than for domestic use varies considerably by product and over time,
as we discuss further below.
Table 1: Nigeria’s import barriers on selected products, import tax rates (%) and
import bans 1995–2018
1995 2001 2007 2013 2018
Beer Banned 100 Banned Banned Banned
Cloth and apparel Banned 55 Banned Banned 45/ Forex ban**
Poultry meat Banned 75 Banned Banned Banned
Rice 100 75 50 100 70***
Sugar 10 40 50 60 70
Cigarettes 90 80 50 50 95
Used cars* Banned Banned Banned Banned Banned / 70
Vegetable oil Banned 40 Banned Banned Banned
*The maximum age of cars banned from import has varied over time: it was more than eight years old in 1995,
and was more than five years old in 2001; it then moved back to more than eight years old in 2007 and is now
more than 15 years old. In addition, imports via land borders have been banned since 2016 .
**Banned from using the official foreign exchange market.
***Rice imports through land borders banned since 2013.
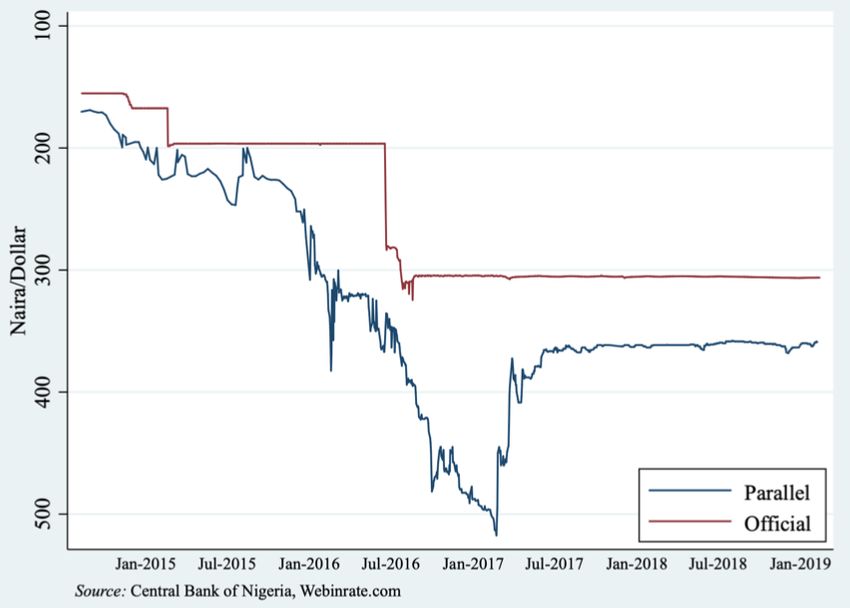
© Economic Development & Institutions 9Benin’s Informal Trading with Nigeria Sources: Soulé (2004), Nigerian customs data provided by the World Bank, Nigerian import prohibition list, online reports, World Trade Organization Nigeria Trade Policy Review 2017. 3.2 Macroeconomic and exchange rate policies in Nigeria Macroeconomic policies, particularly exchange rate policy, are another relevant factor driving cross-border trade, with Nigeria having a crawling peg to the US dollar but an inconvertible exchange rate regime, while Benin is a member of the WAEMU Communauté Financière en Afrique (CFA) franc single currency, formerly pegged to the French franc and now to the euro. Nigeria’s economy is highly dependent on oil, and thus subject to shocks from fluctuations in world oil prices. The recent recession in Nigeria in 2015–2017, associated with a sharp downturn in world oil prices, provides a clear example of the spillover effects of Nigerian macroeconomic developments on Benin. The Buhari administration resisted devaluing the Nigerian naira (NGN) despite severe balance of payments pressures. As a result, a shortage of foreign currency exacerbated the recession in Nigeria. Equally important, the black market exchange rate depreciated sharply while the official exchange rate remained fixed, as shown in Figure 1. With ICBT largely operating in the parallel foreign exchange market, the purchasing power of Nigerian consumers fell further as the black market exchange rate depreciated precipitously. At the end of 2014, Nigeria’s black market exchange rate was at less than a 10% discount under the official exchange rate of about NGN 180 per US dollar. As the foreign exchange shortage worsened, in early 2016 the black market rate had depreciated to about NGN 350 per US dollar. A 30% official devaluation in June 2016 temporarily eased pressures but the situation soon deteriorated again after the official exchange rate was repegged at NGN 300 per dollar. By February 2017, the black market exchange rate had tumbled again to about NGN 500 per dollar. Since mid-2017 the black market discount has declined considerably due to the recovery of the price of oil and Nigeria’s balance of payments. The recession in Nigeria and the depreciation of the black market exchange rate were major causes of the sharp downturn in Benin’s ICBT in 2016–17, as described in the following section. 3.3 Subsidised fuel prices The main underlying source of the pervasive informal trade in petroleum products is differential official pricing mechanisms between Nigeria and its francophone neighbours. Nigeria has long delinked domestic and world prices of fuel and set very low domestic prices, whereas Benin has largely aligned domestic prices to world prices. Figure 2 shows that official prices of gasoline in Benin have greatly exceeded those in Nigeria for the past three decades. Similar differentials exist for other petroleum products, although the gap for diesel is smaller. Consequently, Benin imports almost all its fuel informally. © Economic Development & Institutions 10
Benin’s Informal Trading with Nigeria

Figure 1: Nigeria’s official and black market exchange rates (NGN per US dollar)

Figure 2: Average official gasoline prices in Benin, Cameroon, and Nigeria, 1991–2016
(US dollars per litre)

 1.4
 1.2
   1
 0.8
                                                                                Benin
 0.6
                                                                                Nigeria
 0.4
 0.2
   0
        2001
        2002
        1991
        1992
        1993
        1994
        1995
        1996
        1997
        1998
        1999
        2000

        2003
        2004
        2005
        2006
        2007
        2008
        2009
        2010
        2011
        2012
        2013
        2014
        2015
        2016

Source: World Development Indicators and Globalpetrolprices.com

3.4         Port efficiency
Nigeria’s adverse business climate and particularly poorly functioning port and customs also
contribute to the attractiveness of Cotonou as an entrepôt. Table 2 compares Benin and
Nigeria on some of the measures of the ‘trading across borders’ category of the World Bank
Doing Business indicators.

© Economic Development & Institutions                                                      11
Benin’s Informal Trading with Nigeria
Table 2: Indicators of trade facilitation, Benin and Nigeria, 2018
Trading across Time to import: Time to import:
borders overall rank border compliance documentary
(190 countries) (hours) compliance (hours)
Benin 107 82 59
Nigeria 182 264 144
Source: World Bank Doing Business Indicators 2018.
Nigeria is ranked among the worst in the world by the World Bank as regards the ease of
trading across borders, at 182nd out of 190 countries, despite efforts to improve port
functioning. Benin’s ranking is mediocre, at 107th in the world, but far better than Nigeria.
Correspondingly, the time to comply with border and documentary procedures is about three
times longer in Nigeria and Benin. Various studies have documented the greater efficiency of
the Port of Cotonou relative to Nigeria (Hoffman and Melly, 2015; Hoffman and Melly, 2018;
Ezeoha et al., 2019), motivated in part by Benin’s efforts to boost its entrepôt status.
While Benin endeavours to maintain better trade facilitation than Nigeria, that is a low bar:
Benin is indeed superior to Nigeria in port functioning but the Port of Cotonou is still far from
global best practices. This is even more true for other aspects of the business environment,
where Benin is often ranked below Nigeria. Benin’s overall ranking in the Doing Business
indicators is 153rd, slightly worse than Nigeria’s 146th. Benin does particularly poorly on
important areas such as electricity provision and contract enforcement.
In short, Benin’s trade facilitation institutions function better than Nigeria’s, but Benin’s
overall business climate is poor.
© Economic Development & Institutions 12Benin’s Informal Trading with Nigeria
4 Magnitude of entrepôt trade between Benin and
Nigeria
This section provides estimates of the magnitude of ICBT between Benin and Nigeria for
Benin’s smuggling of imported goods into Nigeria and Benin’s informal imports of petroleum
products.
Smuggling is of course difficult to measure but can be estimated indirectly through the
magnitude of official imports per capita into Benin compared to Nigeria and other countries
(Benjamin, Golub, and Mbaye, 2015). Our previous work showed that imports per capita into
Benin of certain products that are heavily protected in Nigeria are far too large to be
explained by Benin’s domestic consumption. In this section we update our comparisons of
imports per capita in Benin, Togo, and Nigeria for some of the key products of the entrepôt
trade—namely those that are heavily protected in Nigeria. We confirm that imports into
Benin (and also Togo) are much too large to be explained by domestic consumption.
Recently, however, Benin’s imports of some of these key products have dropped off sharply.
Figures 3a–d show imports per capita for cars, rice, cotton cloth, and poultry, respectively,
for Benin, Togo, and Nigeria.6
While there is some domestic Nigerian production of these products, which is, after all, why
they are protected, it is typically low relative to domestic consumption, or not large enough to
explain the very large differences in import patterns displayed in these figures.
Cars. Nigeria has banned imports of used cars beyond a certain age in an effort to protect
its highly inefficient auto industry. While the permissible age of cars has gradually increased,
all imports through land borders were banned in 2016. Nigeria also recently implemented an
increase in tariffs. Despite this high protection, Nigerian automobile production has steadily
declined to very low levels7. No other countries in West Africa produce cars. Togo, and
especially Benin, have developed a car-import value chain largely to supply the Nigerian
market. Car imports in Benin grew rapidly to very high levels until 2015, after which they
dropped sharply. At their peak, car imports per capita in Benin reached about $80 in 2012–
2014, about eight times the ECOWAS average level of about $10 per person (Figure 3a).
Starting in 2015, however, car imports into Benin dropped dramatically. Togo’s per capita car
imports have also been well above Nigeria’s and average ECOWAS levels, although far
below Benin’s, due to Togo’s geographic disadvantage relative to Benin in supplying the
Nigerian market and the relatively high cost of transshipping cars. Box 1 in Section 5 below
describes Benin’s ICBT in cars in more detail.
Cloth. Perhaps no product is of more importance to low-income but fashion-conscious West
Africans than cotton cloth. Nigeria developed a highly inefficient and protected textile
industry and most firms have either disappeared or operate at very low capacity8. Imports of
cloth in Benin and Togo far exceed those in Nigeria (Figure 3b). Nigerian official imports are
almost non-existent. In Benin and Togo, imports have surged since the early 2000s, to over
6 Imports are from the UN Comtrade database online, measured as the US dollar value of world exports to the
respective country. Population is from World Bank World Development Indicators online.
7 ‘Nigeria’s Automobile Industry: A Shadow of Itself’, Vanguard, 13 April 2013,
www.proshareng.com/news/19796/Nigerias-Automobile-Industry-A-shadow-of-Itself-.
8 See ‘Nigeria: Reviving the Textile Industry’, http://wazobiajournal.com/index.php/nigeria-reviving-the-textile-
industry/ 10 March 2013.
© Economic Development & Institutions 13Benin’s Informal Trading with Nigeria
$100 per capita in 2008–2014, more than 10 times the average ECOWAS levels of about $7
per capita. Togo’s relative success in smuggling cloth, as compared to cars, reflects the fact
that cloth is easier to transport, as well as Togo’s historical role as a regional centre for the
textile industry. As in the case of cars, however, cloth imports dropped steeply in 2015–
2017.
Rice. Nigeria has prioritised the development of domestic rice production using stringent
import protection. Nigerian rice production remains far below domestic consumption, with the
market substantially supplied by Benin, and to a lesser extent Togo and Cameroon. Rice
imports into Benin exploded around 2012, while Togo’s imports rose more modestly (Figure
3c). A downturn in Benin’s rice imports occurred in 2015, as in the case of cars and cloth,
but unlike those two, rice imports recovered sharply in 2016–2017, despite continued efforts
by the Nigerian government to stifle smuggling, with a ban on imports of rice through land
borders in effect since 2013.
Almost all of Benin’s rice imports are of parboiled rice, the preferred type of rice in Nigeria
but not in Benin. This provides additional evidence that the large volume of rice imports in
Benin is intended primarily for Nigeria.9
Frozen poultry. Poultry has also been on the list of banned items in Nigeria since the early
2000s. Poultry imports into Benin have surged from a few dollars per person in the late
1990s to over $30 per person in 2014 (Figure 3d). Nearly all of Benin’s imports are intended
for Nigeria.10 Probably due to the high cost of transportation and refrigeration, Togo has not
imported much frozen poultry, but an uptick from the mid-2000s until 2015 can be seen.
Benin’s imports have dropped sharply since 2015.
Figure 3. Imports per capita in US dollars for Benin, Togo, and Nigeria
a. Cars
90
80
70
60
50 Benin
40 Togo
30
20 Nigeria
10
0
1998
2000
1990
1991
1992
1993
1994
1995
1996
1997
1999
2001
2002
2003
2004
2005
2006
2007
2008
2009
2010
2011
2012
2013
2014
2015
2016
2017
9 For example, see www.proshareng.com/news/Agriculture/Smuggling-of-Parboiled-Rice-from-Across-the-
Borders/37718, 19 December 2017.
10 ‘Nigeria: The Ban On Poultry Products’, by J.E. Oshiotse, This Day, 8 October 2002
http://allafrica.com/stories/200210080108.html
© Economic Development & Institutions 14Benin’s Informal Trading with Nigeria
b. Cotton cloth
140
120
100
80 Benin
60 Togo
40
Nigeria
20
0
1995
2003
2011
1990
1991
1992
1993
1994
1996
1997
1998
1999
2000
2001
2002
2004
2005
2006
2007
2008
2009
2010
2012
2013
2014
2015
2016
2017
c. Rice
120
100
80 Benin
60 Togo
40 Nigeria
20
0
1999
2004
2009
2014
1990
1991
1992
1993
1994
1995
1996
1997
1998
2000
2001
2002
2003
2005
2006
2007
2008
2010
2011
2012
2013
2015
2016
2017
d. Poultry
35
30
25
20 Benin
15 Togo
10
Nigeria
5
0
2004
2011
1990
1991
1992
1993
1994
1995
1996
1997
1998
1999
2000
2001
2002
2003
2005
2006
2007
2008
2009
2010
2012
2013
2014
2015
2016
2017
Source: Authors’ calculations using UN Comtrade, World Bank World Development Indicators.
Summary on entrepôt imports: Entrepôt imports into Benin are very large but also highly
volatile. The sharp downturn in entrepôt trade in 2016–2017 illustrated in Figure 3 is a case
in point. There are two main causes of this recent decline: the recession in Nigeria, with an
accompanying sharp depreciation of the naira, and President Buhari’s efforts to close the
border to smuggling from Benin. Of these two, there are several reasons why the recession
in Nigeria is likely to have been far more significant than the Nigerian government’s
crackdowns. First, the efforts to curb smuggling have a long history of ineffectiveness.
Traders are skilled in evading official detection and, more importantly, there are numerous
beneficiaries from smuggling in Nigeria, including customs officials. Furthermore, Figure 3
shows that imports into Nigeria also declined in 2016–2017, whereas they should have risen
if supply from Benin was cut off, given that Nigerian production did not rise during this period
for these products. In particular, car production in Nigeria remains minuscule. Also, the fact
that rice imports in Benin declined only briefly in 2016, before shooting back up in 2017, is
© Economic Development & Institutions 15Benin’s Informal Trading with Nigeria
consistent with the fact that rice is a basic necessity, more so than the other goods shown in
Figure 3. Thus, rice demand is likely to have fallen less as incomes plummeted in Nigeria. All
of this suggests that a fall of demand in Nigeria rather than the Buhari administration’s
hardened policies on smuggling is the primary cause of the decline in Benin’s entrepôt trade.
A sharp increase in Benin’s taxation of entrepôt imports of cars in 2012–2015 likely also
contributed, as discussed below.
The importance of the world oil price in driving Nigeria’s economy, and in turn Benin’s
imports of goods intended for transshipment to Nigeria, is illustrated dramatically in Figure 4.
The left axis shows the world oil price and the right axis the value of imports of nine products
that are subject to import protection in Nigeria (cars, rice, cotton cloth, new and used clothes,
poultry, sugar, and cigarettes) in millions of US dollars. Both series are deflated by the US
GDP deflator. Changes in the world price of oil are followed with a short lag by very similar
movements in Benin’s imports of key products. In 2011–2014, when world oil prices peaked,
imports of these nine products alone rose to about $4 billion, equivalent to about half of
Benin’s GDP. About 80% of these imports were likely destined for Nigeria. When the price of
oil collapsed in 2015–2017, Benin’s imports declined by around 50%. As seen in Figure 3,
individual products have some idiosyncratic variation but generally followed this general
pattern, illustrating their sensitivity to the world oil price due to its importance for the Nigerian
economy.
Import taxes and competition with Togo are also factors affecting the volume of entrepôt
imports in Benin, as described in more detail in Section 6. In particular, Benin raised transit
taxes on imported cars in 2012, leading to a dip in Benin’s imports and a rise in Togo’s. This
explains why Figure 4 and Table 3 show that Benin’s entrepôt imports dropped in 2012
despite the high price of oil at that time.
Figure 4: Benin’s imports of selected key products that are subject to protection in
Nigeria (right vertical axis, 2015 US$ millions) and the world price of oil (left vertical
axis, 2015 $US per barrel)a
140 4,500
4,000
120
3,500
100
3,000
80 2,500
60 2,000
1,500
40
1,000
20
500
0 0
2001
2016
1998
1999
2000
2002
2003
2004
2005
2006
2007
2008
2009
2010
2011
2012
2013
2014
2015
2017
Real Oil Price Benin Imports of Goods Protected in Nigeria
aThe products are cars, rice, cotton cloth, new and used clothes, poultry, sugar, and cigarettes.
Benin’s imports are measured by rest of world exports to Benin of these products, in millions of US
© Economic Development & Institutions 16Benin’s Informal Trading with Nigeria dollars. The oil price is the average annual Brent crude price in Europe. Both series are deflated by the US GDP deflator to remove common trends due to inflation. Source: United Nations Comtrade database, Saint Louis Federal Reserve Bank database. Benin informal imports from Nigeria. Petroleum products constitute by far the largest informal import from Nigeria (Bensassi, Jarreau, and Mitaritonna, 2018). While precise measures are difficult to obtain for petroleum product imports into Benin, informal imports are estimated to supply about 80% of Benin’s consumption (Mbaye, Golub, and Gueye, 2019). Box 2 provides a description of the trade in petroleum products. Benin also informally imports a variety of manufactured products from Nigeria, although the volumes are low relative to petroleum products (Golub, 2009). Comparison to other estimates. The overall magnitude of informal trade is difficult to measure precisely, but generalising from these sectors, as well as the evidence on imports by customs regime discussed in the following section, it is clear that informal trade is much larger than formal trade, perhaps double in size. These estimates are larger than those in most previous literature because, as noted in Golub (2009), previous studies have ignored the role of goods declared in transit regimes. The following paragraph shows that goods declared in transit and re-export regimes are about double the value of goods declared for domestic use. In 2011 Benin’s Institut National de la Statistique et de l’Analyse Economique (INSAE) carried out a large-scale survey of informal trade in Benin over a 10-day period, as described in Bensassi, Jarreau, and Mitaritonna (2018). The INSAE study involved thousands of interviews at unofficial border crossing posts on the Benin–Nigeria border. While the survey had some important limitations, such as only taking place during the daytime and the fact that the veracity of the answers provided by traders can be questioned, the survey provides the only available direct estimates of the composition and magnitude of informal trade. Bensassi, Jarreau, and Mitaritonna (2018) focused only on domestically produced goods but the INSAE dataset also surveyed trade in entrepôt regimes.11 An examination of the summary INSAE data by product and regime reveals that the key smuggled products identified above constitute the bulk of goods reported in entrepôt status. That is, cars, rice, cloth, clothing, poultry, vegetable oil, and cigarettes accounted for about 60% of the goods reported by traders as transit and 90% of the goods reported as re-export. The INSAE magnitudes, however, are well below those estimated indirectly, as the surveys undoubtedly did not cover many traders, particularly those crossing at night, when the largest traders generally operate. On the side of exports from Benin to Nigeria, the INSAE data report that over 90% of Benin’s informal exports to Nigeria consist of petroleum products. Thus, the INSAE data corroborate the focus of this chapter on a few key entrepôt goods subject to high levels of protection in Nigeria and petroleum products, which are heavily subsidised in Nigeria. It may also be of interest to compare our indicators of unofficial trade with officially reported Benin–Nigeria trade. As already noted, official bilateral trade is very low. Figures 5 and 6 show the composition of official Benin exports to and imports from Nigeria, in US dollars. Interestingly, the most important products in official trade are much the same as those that 11 We thank Joachim Jarreau for sharing the INSAE data. © Economic Development & Institutions 17
Benin’s Informal Trading with Nigeria

are smuggled, although official trade is much smaller, highly volatile, and three products
accounted for almost all of official Beninese exports to Nigeria over 2009–2017: poultry, rice,
and vegetable oil (in sharply varying proportions). Whereas total entrepôt trade approached
$5 billion at its peak, the vast majority of which was destined for Nigeria, official Benin
exports to Nigeria peaked at $200 million in 2010 and have since been below $100 million.
In 2009–2010, poultry and rice were the two largest of Benin’s official exports but these two
dropped sharply starting in 2011. Recently, vegetable oil has been the largest official Benin
export to Nigeria. These fluctuations likely reflect shifting degrees of enforcement of
Nigeria’s restrictions on informal trade for selected products, with these products sometimes
allowed to enter Nigeria officially.

Figure 5: Official Benin exports to Nigeria, principal products, in US$ millions
 220
 200
 180
 160
 140
 120
 100
  80
  60
  40
  20
   0
          2009     2010     2011        2012      2013      2014     2015     2016   2017   2018

                            Poultry        Rice          Vegetable oil      Other

Source: Data provided by Benin government and authors’ calculations

Figure 6 shows that reported imports to Benin from Nigeria are even smaller. Petroleum
products are usually the largest official import by far, although these official imports are
dwarfed by smuggling of gasoline and diesel.

In short, the composition of official trade between Benin and Nigeria seems roughly similar in
structure to that of unofficial trade, but it is much smaller and subject to erratic changes in
product composition.

© Economic Development & Institutions                                                              18
Benin’s Informal Trading with Nigeria
Figure 6: Official Benin imports from Nigeria, principal products, in US$ millions
60
50
40
30
20
10
0
2009 2010 2011 2012 2013 2014 2015 2016 2017 2018
Petroleum products Motorcycles Urea fertilizer Vegetable Oil Other
Source: Data provided by Benin government and authors’ calculations
© Economic Development & Institutions 19Benin’s Informal Trading with Nigeria
5 The institutional structure of ICBT in Benin: highly
organised informal trade
This section describes the institutional processes through which goods are transshipped to
Nigeria and fuel is smuggled into Benin.
5.1 Customs regimes
Goods imported into Benin are rarely ordered by the final consumers of these goods prior to
arrival in the port. Instead, large importing companies, both domestic and foreign-owned,
bring goods into the ports of Cotonou to sell to domestic and regional buyers. Only when the
goods are purchased are they declared under one of three main customs regimes:
a. mis à la consommation (for domestic use);
b. transit; and
c. re-export.
If declared for domestic use, the purchaser must clear all import taxes, including customs
duties, value added taxes, and several other smaller taxes. The import duty rates are set by
the ECOWAS CET. For final consumer goods the total tax rates are about 45%.
There are two main regimes for the transshipment of goods in Benin and Togo: transit and
re-exports. The classification of goods into these two categories is complex, with rather
minor differences often determining whether transactions are classified as re-exports or
transit. These two rubrics include a variety of sub-categories of transshipment based on
practices that have evolved over time. In any case, the differences between the two regimes
are quite small and the main point is that under both of these regimes imports are taxed
much more lightly than when they are declared for domestic use, as explained below. In
practice, the magnitude of transit trade is much higher than re-exports in almost all cases.
We will use the term ‘entrepôt imports’ to describe both transit and re-exports. Togo has very
similar regimes for imports.
Transshipped goods do not necessarily – or even usually – end up in the stated destination
country. Most goods in transit in Benin are declared for Niger, but everyone knows that most
of them end up in Nigeria. On-site visits by the authors to car parks in Benin confirmed that
the buyers of vehicles are overwhelmingly Nigerian. Numerous international and local press
reports also observe smuggling from Benin to Nigeria. As discussed below, entrepôt imports
are affected by Benin’s competition with Togo, as well as by events in Nigeria.
Table 3 displays Benin’s imports according to the three customs classifications noted earlier
– domestic use, transit, and re-exports – over 2002–2017 as a ratio of Benin’s GDP. These
data are reported by Benin’s customs, whereas the trade values in the previous section are
from the UN Comtrade database as reported exports from Benin’s trade partners. The
overall magnitudes of the Beninese data and the UN Comtrade data are similar. The
advantage of the Benin customs data is that they disaggregate by customs regime, but they
are not available on a consistent basis for as long a time period as the UN Comtrade data.
The Benin customs data importantly also include revenues collected, and thus enable a
computation of effective import tax rates for each customs regime.
© Economic Development & Institutions 20Benin’s Informal Trading with Nigeria
Benin’s entrepôt trade (transit and re-exports) is generally much larger and more volatile
than imports declared for domestic use. While imports for domestic use are stable at around
20% of GDP, entrepôt imports vary from 20% to 60% of GDP.
The composition of imports between domestic use and entrepôt trade may be affected by
differential taxation of the two regimes. Tax competition with Togo may also play a role, as
discussed in Section 6. Statutory taxes on entrepôt imports in Benin are generally very low,
with the notable exception of used cars. Statutory rates are largely irrelevant, however, as
there is substantial discretion in applying tax rates. In particular, tax rates are much lower if
goods are labelled for land-locked countries, usually Niger, but in reality the stated
destination is almost always modified from Niger to Nigeria once the goods leave the port.
Thus, in the analysis we use actually applied tax rates, measured by tax revenues divided by
value of imports, rather than statutory tax rates.
Table 3: Value of Benin’s imports by customs regime (percent of GDP), 2002–2017
Transit and
Domestic use Transit Re-exports Total imports
re-exports
2002 21% 53% 5% 79% 58%
2003 21% 20% 2% 44% 22%
2004 22% 23% 0% 45% 24%
2005 19% 28% 0% 47% 28%
2006 18% 41% 0% 59% 41%
2007 18% 44% 1% 63% 45%
2008 21% 53% 2% 75% 54%
2009 20% 58% 1% 79% 59%
2010 20% 70% 1% 91% 71%
2011 16% 50% 1% 67% 51%
2012 16% 28% 1% 45% 29%
2013 20% 39% 3% 62% 41%
2014 26% 41% 15% 83% 57%
2015 22% 33% 3% 58% 36%
2016 21% 24% 1% 46% 25%
2017 23% 31% 1% 54% 32%
Source: Authors’ calculations based on Benin customs data (imports), World Bank World Development Indicators
(GDP)
Figure 7 shows the share of entrepôt imports of total Benin imports for the three most
important products exported informally from Benin to Nigeria: cars, cotton cloth, and rice.
The figure shows that for cars, and until recently cloth, imports in entrepôt status constituted
about 90% of total declared imports, or, equivalently, imports declared for domestic use were
only 10% of total imports. The entrepôt share for cars and cloth dropped in 2016–17 to
around 70%, likely due to the general reduction of informal trade to Nigeria, most of which is
declared in transit or re-export. To the extent that domestic consumption in Benin did not fall
as much, the share of imports for domestic use rose. The share of imports of rice declared in
entrepôt regimes was lower than for cars and cloth, at about 50% from 2009 to 2013, and
then dropped quite sharply in 2014–2017 to about 25%. This was likely due to a reduction in
© Economic Development & Institutions 21Benin’s Informal Trading with Nigeria
taxes on rice imports for domestic use, from 33% prior to 2014 to 14% in 2014–2017. Thus,
for rice it became less advantageous to use transit status relative to importing through the
regular channel for distribution in Nigeria, and a sizeable share of imports of rice were
shifted from the transit regime to import for domestic use.
Figure 7: Share of Benin’s key imports declared in entrepôt regimes (transit and re-
export): cars, rice, and cloth (percent of total imports of respective products)
100%
90%
80%
70%
60%
50%
40%
30%
20%
10%
0%
2008 2009 2010 2011 2012 2013 2014 2015 2016 2017
Rice Cars Cloth
Source: Authors’ calculations based on Benin customs data
5.2 Social organisation of informal trade
Although goods are sometimes imported legally by formal firms, distribution is dominated by
informal or semi-formal operators, both foreign and domestic, once the goods are sold and
exit the port storage depots. Smuggling is largely controlled by sophisticated and well-
organised networks, with many small operators involved on the margins. The trust and
connections provided by these informal networks, often ethnic or religious in nature, facilitate
market transactions spanning continents, and enable the provision of credit and transfers of
funds.
In many cases, importers and distributors are large informal firms, as described in Benjamin
and Mbaye (2012) and Mbaye, Golub, and Gueye (2019). These firms have a large volume
of business yet in other respects operate in much the same way smaller informal firms do,
i.e. they are controlled by a single businessman, have falsified accounts, and do not pay
regular business income taxes. Their financing is sometimes through banks but more
typically from own or family savings and retained earnings. The fate of the firms is
inextricably linked to that of the owner, who often relies on political connections to maintain
his status as a large businessman operating outside of the legal and regulatory system.
For bulk items, such as rice, wheat, and sugar, importers purchase directly from international
brokers, with whom they are in regular contact. A few major importers dominate the rice
© Economic Development & Institutions 22You can also read