Proposals to Keep Older People in the Labor Force
←
→
Page content transcription
If your browser does not render page correctly, please read the page content below

JANUARY 2019

Proposals to Keep
Older People in the
Labor Force
______________________________________________________

Alicia H. Munnell
Center for Retirement Research at Boston College

Abigail N. Walters
Center for Retirement Research at Boston College

                                  This report is available online at: https://www.brookings.edu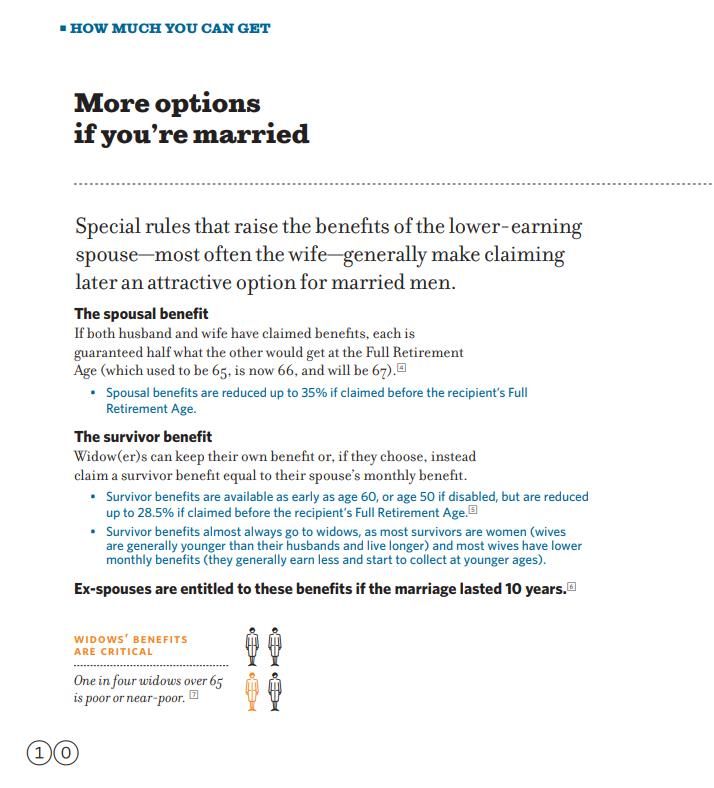
E C O N O M I C S T U D I E S AT B R O O K I N G S
Contents
Statement of Independence .................................................................................................. ii
Change the Return to Work for Older Workers: Expand the EITC ......................................2
Clarify the Picture about Working Longer ............................................................................ 5
Establish a National Retirement Age of 70........................................................................ 5
Report 401(k) Income Projections.....................................................................................9
Provide Materials for Employers and Others to Educate Their Workers ....................... 11
Increase the Appeal of Older Workers to Employers .......................................................... 12
Restore Mandatory Retirement ....................................................................................... 12
The Business Case for Older Workers ............................................................................. 13
Paths Not Taken ................................................................................................................... 14
U.S. Shows Little Interest in Strengthening Labor Market for Older Workers .............. 14
“Phased Retirement” Is a Diversion ................................................................................ 15
Conclusion............................................................................................................................ 16
References ............................................................................................................................ 18
Elevator Speech: Importance of Working Longer...............................................................22
PowerPoint Presentation on the Benefits of Working Longer ............................................24
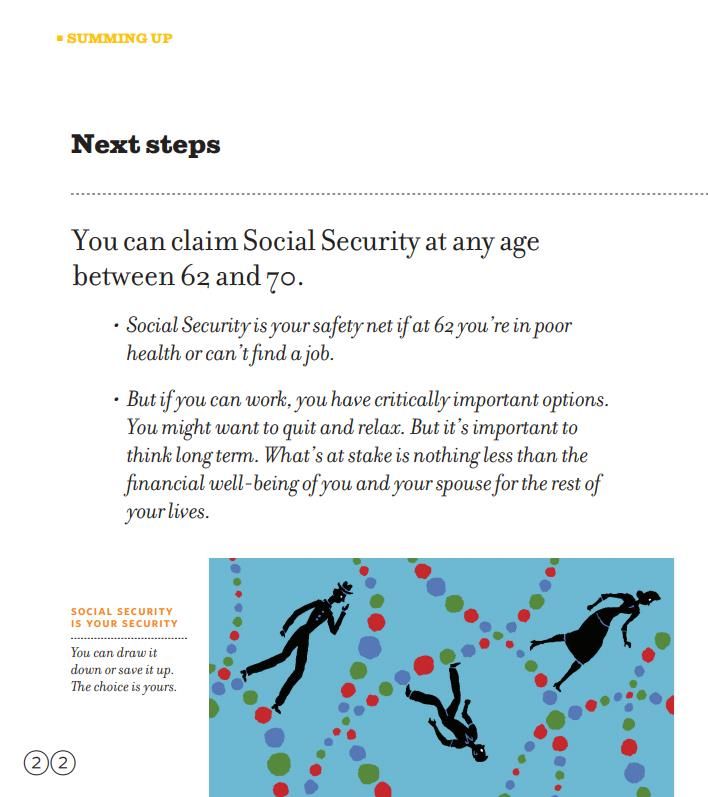
Social Security Claiming Guide ...........................................................................................33
The Business Case for Older Workers ................................................................................. 47
Older Workers Increasingly Look Like their Younger Counterparts ............................. 48
Health .......................................................................................................................... 48
Education ..................................................................................................................... 49
Comfort with Computers ............................................................................................. 50
Older Workers Bring a Lifetime of Experience to the Job ............................................. 50
Older Workers Stay with Their Employer Longer ........................................................... 52
The Issue of Costs.............................................................................................................56
Wages ............................................................................................................................56
Costs of Retirement Plans ............................................................................................58
Health care costs ..........................................................................................................59
Conclusion ....................................................................................................................... 60
References ........................................................................................................................62
Draft Brochure on the Value of Older Workers.................................................................. 64
i /// Proposals to Keep Older People in the Labor Force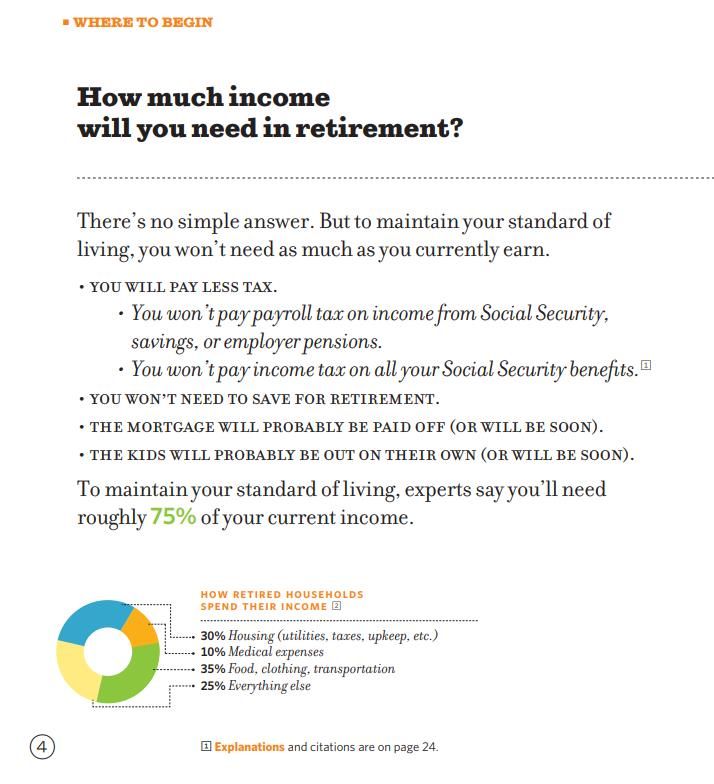
E C O N O M I C S T U D I E S AT B R O O K I N G S

STATEMENT OF INDEPEN DENCE

Alicia H. Munnell is a council member of the Massachusetts Governor’s Council to Address Aging and the director
of the Center for Retirement Research at Boston College. She is a board member of the Pension Research
Council, the Pension Rights Center, the National Bureau of Economic Research, and The Century Foundation.

Abigail N. Walters is a staff member of the Employment Workgroup of the Massachusetts Governor’s Council to
Address Aging and is a research associate at the Center for Retirement Research at Boston College.

Other than the aforementioned, the authors are currently not an officer, director, or board member of any organ-
ization with an interest in this article.

Munnell has received grants from the Prudential Insurance Company and the Social Security Administration re-
lated to past research.

Other than the aforementioned, the authors did not receive any financial support from any firm or person for this
article or from any firm or person with a financial or political interest in this article.

ii   /// Proposals to Keep Older People in the Labor Force
E C O N O M I C S T U D I E S AT B R O O K I N G S

Older people need to work longer in order to ensure a secure retirement. Social Security, the backbone of
the retirement system, will not replace as much preretirement income in the future as it does today. Em-
ployer-sponsored retirement plans also involve considerably more uncertainty, given the shift from defined
benefit plans to 401(k) plans. With these institutional saving arrangements on the decline, people could
decide to save more on their own. But personal saving outside employer plans is virtually nonexistent, with
the exception of home equity—an asset that retirees are reluctant to tap. Combine the retirement income
crunch with the dramatic increase in life expectancy and growing health care costs, and continued employ-
ment in later life is the best option for ensuring financial security. The challenge is to ensure that older
Americans plan to keep working and that employers retain and hire them. Other papers prepared for this
conference explore changes in Social Security and Medicare that would encourage more employment of
older people. This paper explores policy options outside those programs.

Any policy options need to be calibrated to the nature of the problem. Keeping older people in the labor
force requires more than bringing the matter to the public’s attention. Many are already getting the mes-
sage; the share of people planning to work past age 65 has tripled over the past three decades, from 16 to
48 percent.1 However, such intentions often go awry, as nearly two in five workers end up retiring earlier
than planned.2 The reasons for premature retirement involve a variety of factors that affect the choices
made by both employees and employers.

On the employee side, one disincentive to continued work is a high implicit tax on earnings due to Social
Security and Medicare provisions.3 Another issue is a lack of knowledge about Social Security’s financial
gain for delaying claiming until age 70, when monthly benefits are at their peak. In addition, workers with
401(k) plans approaching retirement may think that a typical asset balance of $100,000 for an individual
is sufficient, failing to realize that it translates into only a modest supplement to retirement income.

On the employer side, one barrier to hiring and retaining older workers is the uncertainty about how long
they will stay on the job and concern that their productivity may outweigh their costs well before they plan
to retire. This uncertainty may lead employers to circumvent rules against age discrimination in hiring by
devising policies that have the effect of shedding older workers. A more subtle barrier is the general mis-
perceptions employers may have about older workers’ abilities.

The discussion of the policy options to address these challenges proceeds as follows. The first section ad-
dresses the employee’s side by changing the financial incentives to work through expanding the Earned
Income Tax Credit (EITC) for individuals without dependent children. The second section explores three
initiatives to help people make better-informed work and retirement decisions: (1) establishing that age 70
is the nation’s full retirement age; (2) restating 401(k) balances as flows of retirement income; and (3) in-
stituting workplace seminars for employees in their 50s about the advantages of working longer. The third
section turns to the employer’s side with two proposals: (1) reintroducing mandatory retirement in the ex-
pectation that employers would be more willing to retain or take on older workers if they could dismiss
them at 70; and (2) undertaking a massive public education campaign to make the business case for older
workers. The fourth section looks at two popular suggestions—job training and phased retirement—that are
...
1.     Employee Benefit Research Institute (2018).

2.     Authors’ calculations from the Health and Retirement Study.

3.     Once an individual has 35 years of work history, Social Security benefits from additional years of work rise more slowly than earnings and taxes.
       And Medicare’s secondary payer provision requires employer-sponsored health insurance to continue to be the primary payer for workers age 65
       and over. See Goda, Shoven, and Slavov (2018).

1     /// Proposals to Keep Older People in the Labor Force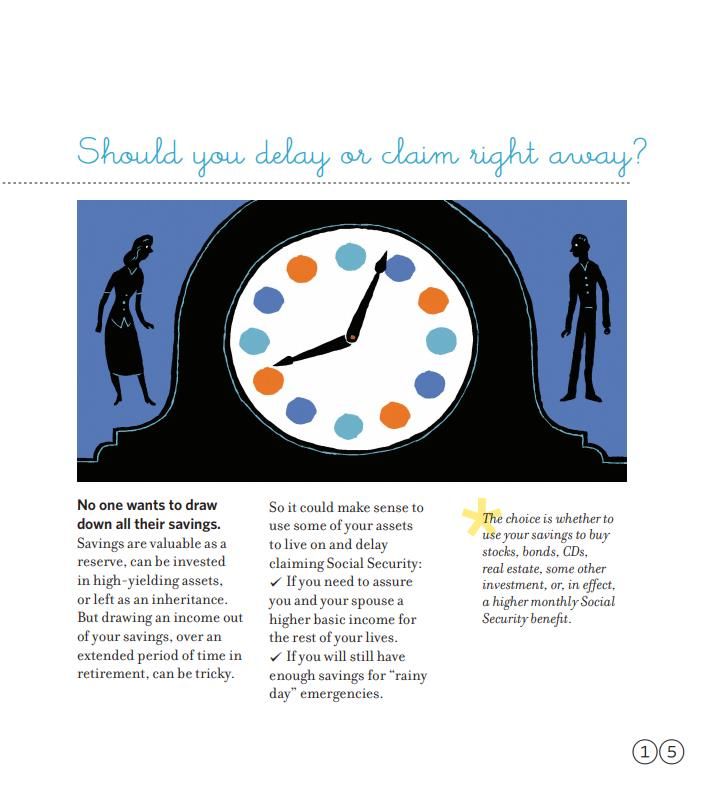
E C O N O M I C S T U D I E S AT B R O O K I N G S

not included among the recommended options. The final section concludes that the types of changes de-
scribed here are urgently needed to head off a looming retirement crisis in the United States.

Change the Return to Work for Older Workers:
Expand the EITC
The EITC was introduced in 1975 as a modest temporary refundable income tax credit for low-paid workers
to reduce the effects of a rising payroll tax. Congress made the credit permanent in 1978, expanded it sig-
nificantly in 1986 and again in 1990, and in 1993 doubled its size to ensure that full-time minimum wage
workers would not live in poverty. The EITC was designed primarily for workers with dependent children,
who might otherwise turn to public programs for assistance. A small credit for workers age 25–64 without
dependent children was added in 1993.4 In addition to the federal credit, 28 states and the District of Co-
lumbia have an EITC based on a percentage of the federal credit, and these state credits are generally re-
fundable.5

While the EITC has significantly increased labor force participation among mothers with children, it does
little for older workers for two reasons: (1) many older people do not have dependent children so their
maximum benefit in 2018 would be about $500—too small to be salient and affect behavior; and (2) the
EITC excludes workers age 65–70. The proposal is to significantly increase the amount of the credit and
extend eligibility to those age 65–70, helping older low-income workers earn a higher posttax wage, which
could encourage them to remain in the labor force longer by offsetting the disincentives to work from Social
Security and Medicare.

Table 1 shows the key EITC parameters in 2018 for individuals filing their taxes as either a single individual
or a head of household with 0 to 3 or more dependent children.6 The amount of the credit first increases
with earnings, reaches a plateau, and then falls as earnings increase. For example, in 2018 the credit for a
single taxpayer with one child is equal to 34 percent on the first $10,180 of income, reaching a maximum
of $3,461. The credit remains at this level for earnings between $10,180 and $18,660, at which point it is
phased out at a rate of 15.98 percent and reaches zero at $40,320.

...
4.     Congress set the eligibility age at 25 to avoid providing the EITC to college and graduate students from middle-income families who may cur-
       rently have low incomes but depend primarily on their parents for support. Although in 1993 the IRS had no way to identify tax filers who were
       students, today it does.

5.     Minnesota’s EITC is based on income, not the federal credit. For more detail on state EITCs, see Tax Policy Center (2018) and Center on Budget
       and Policy Priorities (2017).

6.     The parameters are the same for married individuals filing jointly, except that eligibility phases out at a higher income level—about $5,700 more
       than for taxpayers filing as single or head of household. In addition, regardless of filing status, a household’s annual investment income cannot
       exceed $3,500.

2     /// Proposals to Keep Older People in the Labor Force
E C O N O M I C S T U D I E S AT B R O O K I N G S

Table 1. Parameters of the Earned Income Tax Credit, 2018
                                             Minimum                                                              Phase-out range
                                              income
                                                for
                                                                                                            Beginning              Ending
      No. of                                 maximum              Maximum              Phase-out
                                                                                                             income                income
     children           Credit rate            credit              credit                rate
 0                          7.65%               $6,780                 $519                7.65%               $8,490               $15,270

 1                          34.00                10,180                3,461                15.98               18,660              40,320

 2                          40.00                14,290                5,716                21.06               18,660               45,802

 3 or more                  45.00                14,290                6,431                21.06               18,660               49,194

 Source: Center on Budget and Policy Priorities (2018).

For workers without dependent children, the EITC follows the same basic pattern, but the amount is con-
siderably smaller and phases out much more quickly. Specifically, the maximum credit for childless taxpay-
ers is $519 and the credit reaches zero at $15,270. Furthermore, unlike the EITC for individuals with de-
pendent children, which has no age restriction, the credit for childless adults is available only to those age
25–64. Given its small size and the age restriction, the EITC for childless individuals is seldom used, and
accounts for only 2 percent of total EITC benefits.7 In other words, the EITC does not serve as a meaningful
work incentive for older Americans.

Policymakers from both parties have recognized the EITC’s inadequacy for taxpayers without dependent
children and have proposed expanding the childless credit. In 2014, President Barack Obama and House
Speaker Paul Ryan each would have roughly doubled the amount of the credit. At about the same time,
Representative Richard Neal (D-MA), Senator Sherrod Brown (D-OH), and Senator Richard Durbin (D-IL)
proposed improving the EITC for childless taxpayers.8 These bills were reintroduced in 2015 and 2017. Also
in 2017, Senator Brown and Representative Ro Khanna (D-CA) introduced the most ambitious proposal to
date—doubling benefits for those with children and increasing benefits for childless individuals sixfold. Fi-
nally, Elaine Maag of the Tax Policy Center suggested doubling the phase-in and phase-out rates and the
maximum benefit for childless taxpayers.

The benefit side of all these proposals is captured in figure 1, which shows that—even under the most am-
bitious proposal—the benefit for a single earner without a child still falls far short of that for an individual
with a child. In terms of eligibility, only President Obama’s proposal extends the upper end of the eligibility
ages, specifically to those age 65 and 66.

...
7.     See Maag (2018).

8.     Representative Neal’s bill was the “Earned Income Tax Credit Improvement and Simplification Act” and the Brown-Durbin bill was the “Working
       Families Tax Relief Act.”

3     /// Proposals to Keep Older People in the Labor Force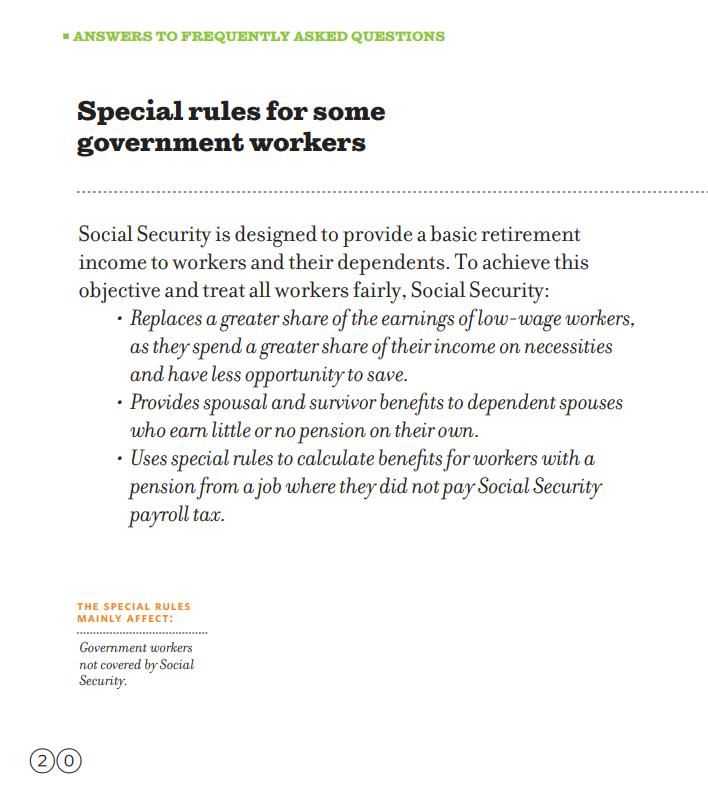
E C O N O M I C S T U D I E S AT B R O O K I N G S

Figure 1. Proposals to Expand Childless Workers’ Earned Income Tax Credit Amount

 $4,000                                                                        Current law - one child
                                                                               Brown and Khanna
 $3,500                                                                        Neal
                                                                               Brown and Durbin
                                                                               Maag
 $3,000                                                                        Obama and Ryan
                                                                               Current law- childless
 $2,500

 $2,000

 $1,500

 $1,000

      $500

         $0
               $0               $10,000             $20,000              $30,000              $40,000

Note: Assumes all income comes from earnings. Amounts are for taxpayers filing as single or head of
household.
Sources: Executive Office of the President and U.S. Treasury Department (2014); Neal (2017); Brown and
Durbin (2017); Brown and Khanna (2017); Maag (2018); authors’ calculations, based on IRS (2018).

The question is whether an increase in the amount of the EITC for childless low earners and an increase in
the eligibility age to 70 would increase labor force participation. The evidence to date, which pertains pri-
marily to the labor supply effects of the EITC on younger single mothers, generally concludes that it does
increase participation.9

Moreover, the increase in labor force participation occurred with little or no effect on hours worked. Chetty,
Friedman, and Saez (2013) find that workers with children increase their hours of work in the EITC phase-
in range, but do not substantially change their hours in the phase-out range. Among married women who
are already working, the EITC appears to have little effect on participation in the phase-in range and a small
negative effect on hours worked in the phase-out range.10

Because the current childless worker EITC is small and phases out at low incomes, researchers have not
explored the impact of the work effort among this group in the United States.11 But we were curious about
...
9.     See Hotz and Scholz (2003); Eissa and Hoynes (2006a); and Meyer (2010).

10.    Eissa and Hoynes (2006b); Heim (2010).

11.    A few international studies suggest that programs similar to the EITC increase the labor force participation of older workers. Estimates of the
       impact of an EITC in Germany show an increase in labor force participation for workers without dependent children age 40–65 (Haan and Prowse
       2010). Among older workers in Australia, a recent paper found that a targeted $500 EITC for older workers increased their labor force participa-
       tion rate by 0.5 percentage point (Breunig and Carter 2018). In Sweden, an EITC and payroll tax credit for older workers increased the likelihood
       of working at age 66 (Laun 2017; Laun and Palme 2018).

4     /// Proposals to Keep Older People in the Labor Force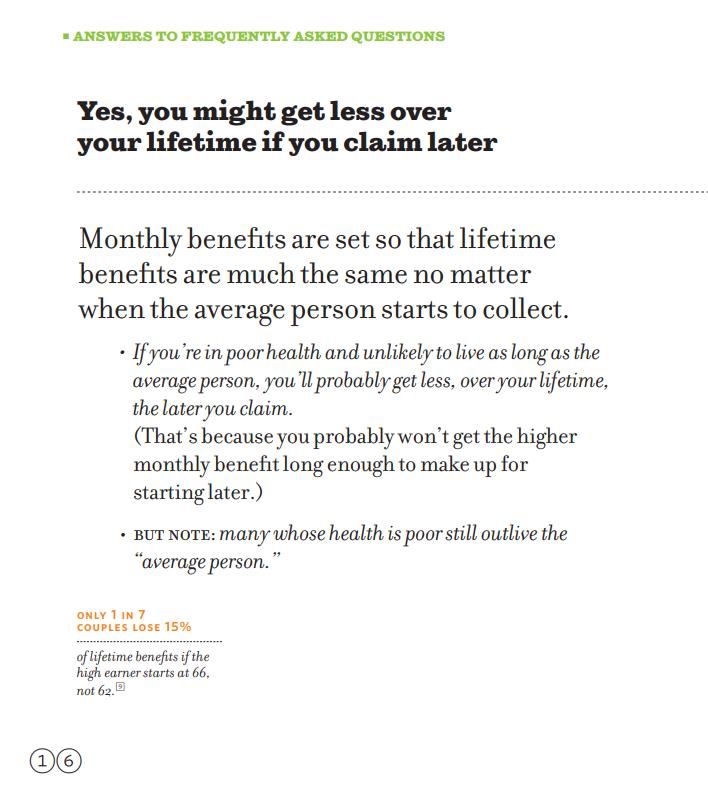
E C O N O M I C S T U D I E S AT B R O O K I N G S

whether older adults with children responded to the EITC similarly to their younger counterparts. To an-
swer this question, our colleague Geoff Sanzenbacher did a preliminary analysis based on variance in state-
level EITC programs.12 The results indicate that older Americans with children increased their labor force
participation by virtually the same amount as younger claimants. This finding suggests expanding the EITC
to childless older adults could increase their participation as well.13

To have an effect, however, the EITC benefit must be salient. A maximum benefit of $519 is not enough to
grab anyone’s attention. It is unclear whether doubling the benefit will suffice or whether a maximum ben-
efit in the $2,000 range would be necessary. Moreover, workers age 65 to 70 need to work longer for a
secure retirement, and so the eligibility age should be raised. The question is how much it would cost to
raise the maximum benefit to $2,000 for childless workers and expand the age to 21–24 for younger people
and to age 65–70 for older people. Given that the cost of doubling the benefit and adding the younger years
is estimated to be $95 billion over 10 years, the cost of the more ambitious proposal might be about $300
billion over 10 years.14 A recent study for the current EITC population suggests that much of the EITC cost
is largely offset by increasing payroll and sales taxes and by decreasing unemployment and the use of public
assistance programs.15 Some of those offsets would also be relevant to those without dependent children
early in their careers and those approaching retirement.

Clarify the Picture about Working Longer
While changes both inside and outside Social Security and Medicare can improve the return to work, some
relatively costless changes in framing the environment in which people make retirement decisions might
also encourage employees to stay in the labor force. Three options are described here: (1) clarify that 70 is
the nation’s retirement age; (2) report 401(k) balances in terms of monthly income; and (3) encourage em-
ployers to conduct seminars for older employees about the advantages of working longer.

Establish a National Retirement Age of 70
For many years, 65 was thought to be the nation’s retirement age—the age at which people were no longer
expected to work. It was the age at which people got full benefits under the Social Security program, and it
was the age used by many public and private employer retirement plans. But what is the national retirement

...
12.    In this analysis, workers with and without dependent children in states with their own EITCs were compared with those with and without kids in
       states without their own EITCs—similar to a difference-in-differences analysis. If the EITC has an effect, one would expect that those with kids in
       EITC states would be more likely to work than otherwise similar individuals: (1) with kids in non-EITC states; and (2) without kids in EITC states.
       The analysis showed that this relationship existed and was similar for younger households age 25–34 and older households ages 55–64.

13.    See Berlin (2009); Scholz (2007); Edelman et al. (2009); and Miller et al. (2017). The only direct evidence comes from the United Kingdom, which
       introduced a working tax credit for workers without children. Researchers at the British Treasury estimated that the credit increased the labor
       force participation rate for childless adults in their middle to late 20s by 2–3 percentage points; see Mulheirn and Pisani (2006).

14.    Maag (2018).

15.    Bastian and Jones (2018).

5     /// Proposals to Keep Older People in the Labor Force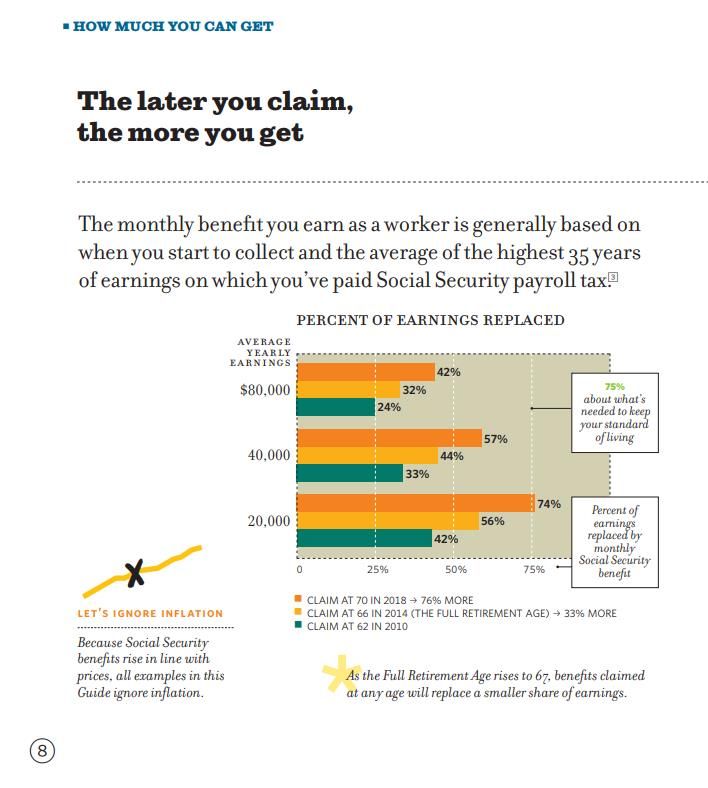
E C O N O M I C S T U D I E S AT B R O O K I N G S

age today? Social Security’s full retirement age—the age at which participants receive “full benefits”—is cur-
rently 66 and 2 months for people born in 1955. That age is not one that catches the national conscience.
Moreover, the FRA keeps changing; it will rise gradually to 67 for those born in 1960 or later.

Clarifying the nation’s retirement age would provide an anchor for retirement planning and help drive home
the sacrifices of retiring earlier. It could well change behavior, because, when faced with a complex financial
decision, many individuals default to an anchor. Experimental studies find that referencing higher ages is
associated with a significant increase in the expected Social Security claim age and expected retirement
age.16 Indeed, researchers have found that people have responded to an increase in the FRA and claimed
their Social Security benefit later than previous cohorts.17 A strong case can be made that age 70 is the
nation’s real retirement age.18 It is the age that maintains the same ratio of retirement to working years as
in 1940, the age at which Social Security provides solid replacement rates, and the age at which most people
are assured of retirement security.

Retains ratio of retirement to working years. If 65 were the “correct” retirement age in 1940, what would
be the comparable age today? The discussion here reports on two measures. The first measure is the age at
which the expected number of years in retirement remains unchanged, using 1940 as the base year. The
second measure identifies the age at which the ratio of the expected number of years spent in retirement to
the expected number of years working—from age 20 to retirement—remains constant. This ratio seems like
a better measure because it distributes gains in life expectancy into both working years and retirement
years. Table 2 shows that the option that distributes gains between work and leisure suggests age 69 and 9
months—very close to 70. So, a national retirement age of 70 would still allow for a reasonable period of
retirement.

...
16.    See Madrian (2014), Brown, Kapteyn, and Mitchell (2013); and Vermeer (2016).

17.    For more on how individuals responded to changes in the full retirement age, see Mastrobuoni (2006); Pingle (2006); Song and Manchester
       (2007); Kopczuck and Song (2008); Behagel and Blau (2010); Blau and Goodstein (2010); and Coe, Khan, and Rutledge (2013).

18.    The nation’s real retirement age became 70 with the maturation of Social Security’s delayed retirement credit. In the 1930s, the notion was that
       65 was the age at which people could no longer work and needed benefits to support themselves. No benefits were paid before that age, and no
       increments were added for claiming later. In 1956, Congress gave women the option to retire as early as age 62 on a reduced monthly benefit.
       That is how things remained for about a decade; actuarially reduced benefits were available at 62 and the maximum benefit at 65. In 1972, Con-
       gress introduced a 1 percent Delayed Retirement Credit as a bonus for claiming beyond 65, but the credit did not come close to compensating for
       the fact that late claimers would get benefits over fewer years. In 1983, the credit was raised to 3 percent and scheduled to increase gradually to
       8 percent for those turning 65 in 2008. At this point, the person with average life expectancy can claim at any time between 62 and 70 with the
       same lifetime benefits. The highest monthly benefits are paid at 70, with actuarial reductions for claiming early.

6     /// Proposals to Keep Older People in the Labor Force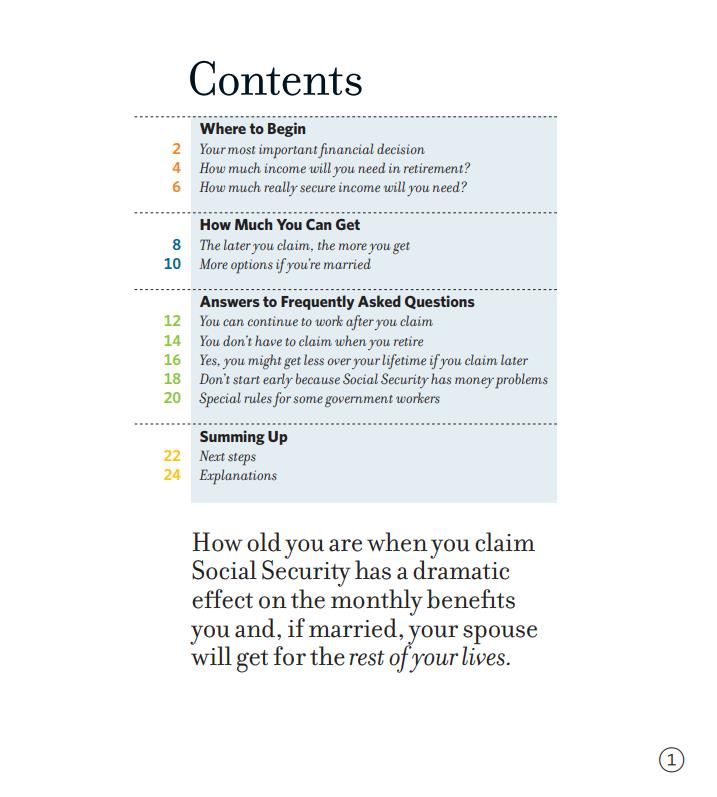
E C O N O M I C S T U D I E S AT B R O O K I N G S

Table 2. Retirement Age Equivalent to Age-65 Retirement in 1940, Based on Rising Life Ex-
pectancy (in years: months)

                                                                  Age at which:

                                  Expected retirement years remain                              Ratio of expected retirement to
 Year                                         constant                                          working years remains constant

 1940                                                     65:00                                                        65:00

 1960                                                     66:07                                                        66:01

 1980                                                     68:01                                                        67:01

 2000                                                     70:02                                                        68:07

 2020                                                      71:10                                                       69:09

 2040                                                     73:01                                                        70:07

 Note: For the ratio of expected retirement to working years, people are assumed to start work at age 20.
 Source: Calculations from U.S. Social Security Administration (2018).

Ensures adequate Social Security replacement rate. Another way to answer the question of whether age 70
is a sensible retirement age is to look at Social Security replacements rates in 2025 once the FRA reaches
67 for all cohorts. Social Security replacement rates for those with median earnings who claim at age 70 will
stabilize at about 50 percent. But the reported replacement rates overstate the amounts that retirees will
actually get in retirement, because premiums for Medicare Part B and Part D are automatically deducted
from Social Security benefits.19 Furthermore, out-of-pocket medical expenses consume much more of re-
tirees’ Social Security benefit over their retirement as they use more health care and as health care costs
rise faster than the Social Security cost-of-living adjustment.20 Figure 2 shows gross and net replacement
rates by claiming age in 2025. The net replacement rate at age 70 will equal 46 percent. It should also be
noted, however, that the full benefit will be taxed under the personal income tax for the medium household
beginning in about 2030.21 Nevertheless, the replacement rate at age 70 would provide a solid base on
which to add 401(k) savings and home equity for a secure retirement.

...
19.    Note that the full Social Security benefit is considered for tax purposes, even though the Medicare premiums are deducted before payment. See
       Centers for Medicare & Medicaid Services (2018) and U.S. Social Security Administration (2018).

20.    See Cubanski, Neuman, and Smith (2018); and McInerney, Rutledge, and King (2017).

21.    See Purcell (2015). Social Security benefits are taxed under the personal income tax. Individuals with more than $25,000 and married couples
       with more than $32,000 of “combined income” have to pay taxes on up to 85 percent of their Social Security benefits. Combined income is ad-
       justed gross income as reported on tax forms plus nontaxable interest income plus one half of Social Security benefits. Because the thresholds
       are not indexed for growth in average wages or even for inflation, the percentage of recipients whose benefits are subject to tax increases over
       time.

7     /// Proposals to Keep Older People in the Labor Force
E C O N O M I C S T U D I E S AT B R O O K I N G S
Figure 2. Replacement Rate for the Medium Worker, by Retirement Age, 2025
60% Social Security replacement rate
After SMI premium deductions
50.3%
50% 46.1%
39.7%
40% 35.4% 35.5%
31.2%
29.8%
30% 25.7%
20%
10%
0%
62 65 67 70
Source: Calculations from U.S. Social Security Administration (2018) and Centers for Medicare & Medi-
caid Services (2018).
Ensures retirement security. Finally, the National Retirement Risk Index can be adapted to determine the
age when most people would be financially secure. This index, which uses the Federal Reserve’s Survey of
Consumer Finances, compares today’s working households’ projected replacement rates with target re-
placement rates that smooth lifetime consumption and allow households to maintain their standard of liv-
ing. The percentage that fall short by more than 10 percent are deemed to be at risk; in 2016, that number
was 50 percent. The index can also be used to determine the age at which households can stop working and
maintain their preretirement living standard—that is, the age at which the household’s projected replace-
ment rate equals its target. The results of this exercise indicate that the vast majority of households—more
than 85 percent—would be prepared for retirement by age 70 (see figure 3).
8 /// Proposals to Keep Older People in the Labor ForceE C O N O M I C S T U D I E S AT B R O O K I N G S
Figure 3. Cumulative Readiness by Retirement Age
Source: Munnell et al. (2012).
So, if 70 is the age at which Social Security provides the highest benefits, the age which maintains the same
ratio of retirement to working years as in 1940, and the age at which people are assured of retirement secu-
rity, what does this mean for the existing FRA standard? Actually, the maturation of the delayed retirement
credit has rendered it a largely meaningless concept.22 It does not describe the age when benefits are first
available. That is age 62. It does not describe the age when monthly benefits are adequate. That is age 70.
Age 70 is the nation’s retirement age, and policymakers should announce it from the rooftops.23 People
will respond.
Report 401(k) Income Projections
Shifting the focus from 401(k) balances to the monthly income these balances would provide at retirement
gives participants a much better sense of the portion of required expenses that their 401(k) accumulations
can cover once they stop working. The concern is that 401(k)/IRA balances of, say, $135,000 (the median
balance for households approaching retirement in 2016) may give many a false sense of security and en-
courage them to retire earlier than they should.24 Showing participants that $135,000 provides only $630
...
22. A few specific provisions are linked to the FRA. An earnings test applies before age 66 (the FRA) but not thereafter. Widow and spousal benefits
are reduced if claimed before the FRA and not thereafter.
23. For a discussion of how to design an effective public education campaign to influence retirement behavior, see Gale and Harris (2013).
24. IRA balances are included, because most of the money in IRAs is rolled over from 401(k)s.
9 /// Proposals to Keep Older People in the Labor ForceE C O N O M I C S T U D I E S AT B R O O K I N G S
per month can help them recognize that they do not have enough and convince them to either boost their
savings rate or work longer.25
The Department of Labor (DOL) recognized the need for such information, and in 2013 it issued for com-
ment an advanced notice of proposed rulemaking that would encourage the sponsors of 401(k) plans to
project how much income a participant’s 401(k) balances would provide at retirement.26 More recently,
the Retirement Enhancement and Savings Act of 2018, a bundle of small changes aimed at increasing vol-
untary retirement savings, included a provision requiring disclosure at least once a year of the lifetime in-
come stream equivalent to the total assets accrued by the participant.27 DOL would issue assumptions that
plan administrators could use, without concern of liability under ERISA, to convert total accrued benefits
into lifetime income stream equivalents.
In its 2013 request for comment, DOL asked for suggestions on how best to estimate a stream of lifetime
income, and it also offered two suggestions. The first was the income that participants’ current account
balances would provide if they were now at the normal retirement age. The second was the income they
would receive at retirement assuming their current balance would grow with future contributions and in-
vestment returns. The assumption is that contributions would increase by 3 percent a year and earn a nom-
inal return of 7 percent. The projected balance would then be deflated by 3 percent a year to put it back into
today’s dollars. Eliminating inflation from the calculation is extremely important, or else everyone would
look like projected millionaires. Social Security’s online benefit statement calculations also present pro-
jected benefits in terms of today’s dollars.
Income projections for 401(k) balances are more difficult than for Social Security. Social Security has a
benefit formula that can be applied to the individual’s 35 highest years of average indexed monthly earnings.
In contrast, the projections for 401(k) balances require assumptions about how much that lump sum can
produce. In 2013, DOL seemed to suggest that participants use their money to buy an actuarially fair annu-
ity. This assumption may provide a somewhat optimistic estimate, for two reasons. First, people do not
purchase annuities with their 401(k) balances, and any rule of thumb for drawing down assets, such as the
“4-percent rule,” would produce smaller monthly amounts. A less important consideration is that any an-
nuity that individuals can actually purchase in the private sector will provide less income than an actuarially
fair annuity.
Unfortunately, only bits and pieces of evidence are available regarding how changing the presentation of
accumulation might affect outcomes. A couple of studies found that the provision of income information
increased saving. A 2012 field experiment, which tested the effect of retirement income projections on sav-
ing decisions for 17,000 employees of the University of Minnesota, showed that providing individuals with
retirement income projections, along with related material on retirement planning, modestly increased sav-
ing at a very low cost.28 Similarly, researchers exploring the impact of annual letters that include projected
public pension benefits issued by the German pension authority found sizable and persistent increases in
private retirement saving.29 On the other hand, the evidence on the impact of the Social Security Statement
...
25. The $630 is the estimate reported by Immediateannuities.com for a joint-and-survivor annuity for a man age 65 and his wife age 63.
26. A number of financial firms (Fidelity, TIAA, Blackrock, Vanguard, Voya, Bank of America Merrill Lynch, Principal Financial Group, T. Rowe Price,
Empower, and perhaps many others) provide publicly available calculators that include retirement income as an output. But most participants do
not take advantage of such options.
27. This bill (H. R. 2055) would amend the Employee Retirement Income Security Act of 1974 (ERISA) to require these disclosures in participant
benefit statements.
28. See Goda, Manchester, and Sojourner (2014).
29. See Dolls et al. (2016).
10 /// Proposals to Keep Older People in the Labor ForceE C O N O M I C S T U D I E S AT B R O O K I N G S
in the United States is mixed. One study found relatively little impact on workers’ retirement behavior,
whereas a recent study suggests that the Statement encouraged delayed claiming.30 Finally, the literature
on resistance to annuitization indicates that people overvalue a lump sum relative to a stream of income.
Clearly, providing information about the projected income from 401(k) balances will not single-handedly
encourage employees to work longer, but rather should be viewed as an inexpensive and feasible change
that might nudge people in the right direction. Another, more controversial, change would be to increase
the age at which participants can withdraw their 401(k) balance penalty free from 59½ to 62.
Provide Materials for Employers and Others to Educate
Their Workers
In 2017, Massachusetts Governor Charlie Baker established the Governor’s Council to Address Aging in
Massachusetts, and one of the council’s workgroups focused on keeping older people in the labor force in
order to ensure a secure retirement. This workgroup—which consisted of business people, academics, and
representatives from advocacy organizations—concluded that the necessary basic research has already been
done and that the challenge is to get the word out to employees about the advantages of working longer and
to employers about the value of older workers. One component of the educational effort would be a Power-
Point presentation that human resources professionals could provide to employees while they are in their
50s, or even younger, to help them make more informed decisions about how much longer they should
work.
The attached PowerPoint presentation is intended only as a starting point. The idea was to hire a profes-
sional designer to develop a suite of materials on the benefits of working longer, which would include a final
version of the PowerPoint and any supporting items, such as new booklets or infographics. The products
would be disseminated in three ways:
by requesting that the governor host an event on the importance of working longer;
by publishing the documents online at mass.gov (the state’s website); and
by distributing the presentation and accompanying materials through chambers of commerce, As-
sociated Industries of Massachusetts, human resources groups, libraries, community organiza-
tions, and other relevant organizations.
In summary, much of the analytical work has been done in terms of the desirability of working longer; the
remaining challenge is to educate employees about the importance and implications of their choice of re-
tirement dates. This effort falls to government and employers. The most important initiative for policymak-
ers is to clarify that age 70 is the national retirement age; it is the age that maintains the ratio of retirement
to work years, it is the age that produces adequate replacement rates, and it is the age that assures house-
holds have a secure retirement. This framing helps clarify that choosing to retire before 70 involves sacri-
ficing retirement income and security. Similarly, requiring 401(k) plans to report not only asset balances
but also the income those balances will provide drives home for many the inadequacy of their retirement
saving and the need to work longer. Finally, employers and other organizations can play an important role
in getting younger employees to start thinking about how long they will want to work. Employees’ decisions,
...
30. See Mastrobuoni (2011) and Smith (2018).
11 /// Proposals to Keep Older People in the Labor ForceE C O N O M I C S T U D I E S AT B R O O K I N G S
however, are only half the equation; the other half is employers’ willingness to retain and hire older workers.
The next section explores two possible ways to increase the attractiveness of older workers to employers.
Increase the Appeal of Older Workers to Employers
Two options for increasing the appeal of older workers are (1) to make the employer comfortable with the
decision to hire and retain; and (2) to eliminate misperceptions about older workers by producing a strong
business case for hiring and retaining them.
Restore Mandatory Retirement
The shift to 401(k) plans and the elimination of mandatory retirement mean that retirement is a much
messier process today than it was in the past. With mandatory retirement, both parties knew that as of a
certain age, the relationship would end. Employers also used traditional defined benefit plans to structure
an orderly departure, often before the mandatory retirement age. No such structure exists in a 401(k) envi-
ronment. As a result, employers face the prospect of workers with stagnating productivity and inadequate
401(k) balances hanging on much longer than desirable.
Employers will need tools to manage an older workforce, where the cost of compensation—particularly
health insurance—tends to outpace productivity as age rises. A recent study found that health insurance
tends to cost about $1,500 more a year for older workers than for younger ones, which may not be signifi-
cant for higher earners but constitutes a major portion of compensation for low-wage workers.31 Without
tools to ensure that compensation does not exceed productivity, employers will avoid older workers. Indeed,
studies show that older workers are less likely to be called back for an interview, even when they are as
qualified as younger workers.32 And they typically experience longer spells of unemployment than younger
workers.33 A small body of literature suggests that older workers are less likely to be hired in states with
stricter age discrimination laws, although the results are marginal and ambiguous across gender.34 Not
only do older workers face discrimination in the hiring process, they also can be pushed out of their existing
jobs, despite antidiscrimination protections.35
One tool could be the restoration of some form of mandatory retirement at age 70 (which is substantially
higher than mandatory retirement ages in the past), indexed to the age at which Social Security provides
the maximum benefit. While employers can dismiss older workers who can no longer do their job, the pro-
cess is unpleasant and employers worry about age discrimination lawsuits. But employers cannot legally
dismiss older workers whose health insurance premiums have risen too high or who have come down with
very expensive medical problems. Mandatory retirement would limit the employer’s exposure to the prob-
lem of compensation outpacing productivity that typically emerges as workers age. This limit could be key
...
31. See Burtless (2018).
32. See Neumark et al. (2016).
33. See Monge-Naranjo and Sohail (2015).
34. For age discrimination in hiring across states, see Adams (2004); Lahey (2008); Neumark and Button (2014); and Neumark, Song, and Button
(2017).
35. Gosselin and Tobin (2018) spotlight practices used by IBM to shrink its workforce that disproportionately affected older workers.
12 /// Proposals to Keep Older People in the Labor ForceE C O N O M I C S T U D I E S AT B R O O K I N G S
as, given the decline in career employment, hiring decisions have become more important. Putting a lid on
tenure could make hiring workers in their 50s and early 60s more attractive, especially for low- and average-
wage workers with employers that offer health insurance.
A proposal to reinstate mandatory retirement would certainly be controversial. One option would be to
create a default mandatory retirement age of 70 and allow firms to opt out or set a higher age.36 Those
firms that opt out would carry on as they do currently. Those employers that stick with the default would
be required to notify employees six months before the mandatory retirement age and consider employees’
requests to work beyond the mandatory retirement age.37
A default retirement age would have benefits for both retirement planning and workforce management. On
the employee side, it would provide a more formal process to enable workers to plan to work longer, begin
partial retirement, or enter into full retirement at age 70. On the employer side, a default retirement age
would give employers a way to separate from an employee whose compensation outpaces his or her produc-
tivity, increasing the attractiveness of hiring older workers.
The Business Case for Older Workers
Another approach is to convince employers of the value of older workers by presenting a hard-nosed busi-
ness case for hiring and retaining them. Several organizations have published materials that advocate for
older workers, but the discussion tends to be anecdotal and personal rather than grounded in broad-based
evidence. If employers’ reluctance to hire older workers is based on statistical, as opposed to taste-based,
discrimination, then information should help.
Older workers today are healthier, better educated, and more computer savvy than in the past and, in terms
of these basic characteristics, they look very much like younger workers. In addition, they bring more to the
job in skills, experience, and professional contacts. Finally, they are more likely to remain with their em-
ployer longer, and longer tenure can enhance productivity and increase profitability for the employer. These
benefits can help offset any remaining cost differentials between older and younger workers. In short, the
business case for older workers seems compelling.
The workgroup on employment of the Governor’s Council on Aging in Massachusetts prepared “The Busi-
ness Case for Older Workers,” which is attached. It also prepared a brochure based on this document (also
attached). The proposal was for the state to hire a professional designer to develop a suite of materials to be
shared with employers. These materials would include a final version of the brochure and any supporting
items, such as infographics. They would be developed using framing strategies designed to expand the way
that employers think about older workers. Testimonials from leading Massachusetts employers about the
value of older workers might also be included in the materials.
The key to the workgroup’s vision, however, was the involvement of the governor. The thought was that he
would use his bully pulpit both to inform employees about the merits of working longer and to educate
employers about the advantages of older workers. The campaign could begin with the governor hosting
...
36. For a short time, the United Kingdom had a default retirement age; see Sykes, Coleman, and Groom (2010).
37. Employees would also have an opportunity to appeal the employer’s decision. Employees would still be protected under antidiscrimination laws,
and would be able to file suit if their employer discriminates or does not follow the correct process for separating at the default retirement age.
13 /// Proposals to Keep Older People in the Labor ForceE C O N O M I C S T U D I E S AT B R O O K I N G S
business leaders to share “The Business Case for Older Workers” and encourage them to share the infor-
mation with their peers, creating a ripple effect. If employers are indeed incorrectly stereotyping older
workers, then a massive public relations campaign is needed to correct these misperceptions.
At the national level, DOL could support such an effort by launching a pilot program—to, say, five states—
to provide funding and to undertake an assessment to determine whether an educational campaign makes
a difference in the hiring and retention of older workers. Interested governors committed to supporting
older workers would partner with DOL to distribute an array of materials in a variety of ways to employers
in their state. Governors would thus have a relatively low-cost way to support their older workforce, and
DOL would be able to assess the program’s effectiveness for a potential rollout on a national scale.
Paths Not Taken
The proposals discussed above do not include two popular suggestions for older workers—training and flex-
ibility. The reasons for leaving out these options are uncertainty about the success of training programs in
the United States and concern that flexibility may be self-defeating.
U.S. Shows Little Interest in Strengthening Labor Market
for Older Workers
Many studies that review the prospects of older workers stress the importance of expanded training oppor-
tunities.38 In the United States, older workers who lose their job can access American Job Centers (also
known as One-Stop Centers). These centers, established under the Workforce Investment Act, and reau-
thorized in the Workforce Innovation and Opportunities Act of 2014, offer training referrals, career coun-
seling, job listings, and similar employment-related services. Customers can visit a center in person or
connect to the center's information online or through kiosk remote access. The publicly funded programs,
however, primarily focus on helping low-wage and disadvantaged groups enter the labor force. The Amer-
ican Job Centers also tend to direct older low-wage job-seekers to the Senior Community Service Employ-
ment Program, which offers graceful exits from the labor force via placements in subsidized minimum-wage
community service jobs.
This concentration on disadvantaged and low-wage workers is due to budget constraints and the need to
direct limited training funds to this high-priority need. A recent United Nations study found that the United
States spends a much smaller share of GDP on training than any of the 20 European and North American
countries surveyed (see Figure 4). The effectiveness of U.S. public training programs is also unclear, alt-
hough the general impression is that success has been quite modest.39 So as desirable as expanded and
effective training for older job-seekers might be, it seems unlikely to emerge any time soon.
...
38. For example, see OECD (2006).
39. See GAO (2011) for the uncertainty surrounding the effectiveness of U.S. public sector training programs; LaLonde (1995) for the consensus
view that success has been limited; and Osterman (2006) for a somewhat more optimistic appraisal.
14 /// Proposals to Keep Older People in the Labor ForceE C O N O M I C S T U D I E S AT B R O O K I N G S
Figure 4. Public Expenditures on Labor Market Programs as a Percentage of GDP, 2016
4
3.2
3 2.8
2.4 2.3 2.3
2 1.7 1.7 1.6
1.4 1.4 1.3
1.2 1.1
0.9 0.9 0.8
1 0.7 0.7 0.7 0.6 0.6 0.6 0.6 0.6
0.5 0.5
0.3 0.3
0
AUT
SWE
CHE
NOR
AUS
CAN
KOR
CHL
LTU
DNK
FIN
IRL
HUN
EST
NLD
BEL
PRT
DEU
LUX
POL
SVN
ISR
LVA
NZL
SVK
CZE
JPN
USA
Source: OECD (2016).
“Phased Retirement” Is a Diversion
Much of the discussion about working longer has focused on expanding opportunities for phased retirement
or part-time employment.40 Indeed, the majority of older workers say they would like to retire gradually,
cutting back their hours rather than retiring “cold turkey.” 41 This preference is understandable. These
workers have spent thirty or more years in the labor force and retirement represents a sharp social, physi-
ological, and economic break with life as they know it. So expanding opportunities for such workers to
reduce their hours has seemed a reasonable way for them to extend their careers. Policymakers have em-
braced the idea, and Congress included a provision in the Pension Protection Act of 2006 that would allow
workers to access a portion of their defined benefit pension at 62 and defer the rest until full retirement.
The problem is that, to ensure a secure retirement, most workers will need to remain in regular full-time
employment well into their sixties. And to be attractive as potential hires, workers need to assure employers
that they have enough of a “future” in the labor force that it makes sense to invest in skills and relationships
that will keep them productive.
While workers claim they want to retire gradually, phased retirement does not appear to improve workers’
happiness in retirement. A study using the Health and Retirement Study showed that the nature of the
transition—gradual or abrupt—had no effect on happiness.42 Other factors—such as health, the loss of a
...
40. The term “phased retirement” is sometimes limited to full-time workers reducing their hours in their current job. For example, see Hutchens and
Papps (2005) and Hutchens (2007). Our focus here is the broader concept of retirement in stages, not necessarily with the same employer.
41. In the Health and Retirement Study, older workers are asked the following question: “As I get older, I would prefer to gradually reduce the hours I
work on this job, keeping my pay per hour the same. Do you agree or disagree?” Almost 60 percent of workers “strongly agree” or “agree,” and
this percentage has remained steady over time.
42. See Calvo, Haverstick, and Sass (2009).
15 /// Proposals to Keep Older People in the Labor ForceE C O N O M I C S T U D I E S AT B R O O K I N G S
spouse, and the individual’s control over the retirement decision—influence happiness, but the results pro-
vided no evidence that those who retired gradually were any happier in the interview after retirement than
those who retired cold turkey.
Moreover, initiatives to expand part-time employment at the end of a worker’s career might not be espe-
cially fruitful. Relatively few types of production seem suited to part-time work. Most economic activity
seems far more efficient when done by teams of full-time workers who are continually present at the same
location.43 Part-time employment is also expensive, in the sense that the employer must spread the costs
of recruiting, training, scheduling, supervising, and evaluating workers over fewer hours of labor. The last
thing that policymakers should want is to make older workers more expensive than their younger counter-
parts.
Most importantly, a 2007 study by Gustman and Steinmeier finds that expanding part-time opportunities
might not result in increased employment. Yes, some workers would delay retirement and increase em-
ployment at older ages, but others would move to part-time work at younger ages, in lieu of full-time em-
ployment. The net result would be little change in either “full-time equivalent” employment or retirement
income security.
Of course, not everyone can work full time well into their sixties. Many of those who need most to work
longer—low-wage workers dependent on Social Security—will not be able to work. For example, disability-
free life expectancy at age 50 for men in the lowest quartile is only 15 years.44 It is difficult to argue that an
individual in this position should be expected to work full-time until age 67. Thus, the prescription to work
longer must be administered with care. But the vast majority of older Americans will be able to work longer,
and efforts should be focused on extending full-time work for the majority.
Conclusion
The single best way to ensure that today’s workers can enjoy a secure retirement is to persuade them to stay
in the labor force longer and convince employers to hire and retain them. Beyond program changes to Social
Security and Medicare, policymakers have several potential options for encouraging longer working lives.
To persuade workers, policymakers can start by improving their financial incentives through changes to the
Earned Income Tax Credit. Next, and more important, they can transform the conversation about when to
retire by launching a concerted educational campaign to establish 70 as the national retirement age. In
addition to direct outreach by government, the goals of this campaign would be supported by requiring
401(k) plans to report how asset balances translate into retirement income and by providing educational
materials for workers to be delivered through third parties, such as employers, advocacy groups, and com-
munity organizations.
To persuade employers, policymakers should consider restoring mandatory retirement—at age 70—while
retaining the flexibility for firms to employ people longer if desirable. By setting clear guidelines for when
...
43. Discrete, routine, and self-contained tasks are most amenable to part-time employment; industries that must accommodate uneven demand
across the workday, such as retailing, restaurants, and mass transit and those that deliver services directly to people, can benefit by employing
part-time workers. See Blank (1998); Nollen et al., (1977); Friedberg (1999); and Hutchens (2001).
44. Authors’ calculations for 2017 using data from the Centers for Disease Control’s National Health Interview Survey, the Social Security Administra-
tion’s Period Mortality Tables, and the Census Bureau’s American Community Survey.
16 /// Proposals to Keep Older People in the Labor ForceE C O N O M I C S T U D I E S AT B R O O K I N G S to anticipate the transition to retirement, such a policy would help workers engage in more deliberate plan- ning and assist employers in their workforce management policies. Another alternative is to make a clear and compelling case to employers of the value that older workers bring, a value that may currently be ob- scured by misperceptions about the abilities and commitment of such workers. The bottom line is that more research is not needed to understand the problem and potential solutions. We already know what needs to be done. The next step is to convince policymakers to actively and energetically support these types of initiatives. The payoff from success will be enormous: transforming the workforce, the economy, and the culture in a way that will ensure retirement security for today’s workers and future generations. 17 /// Proposals to Keep Older People in the Labor Force
You can also read