Great Zimbabwe Alternative prospects to 2040 Lily Welborn, Jakkie Cilliers and Stellah Kwasi - Africa Portal
←
→
Page content transcription
If your browser does not render page correctly, please read the page content below
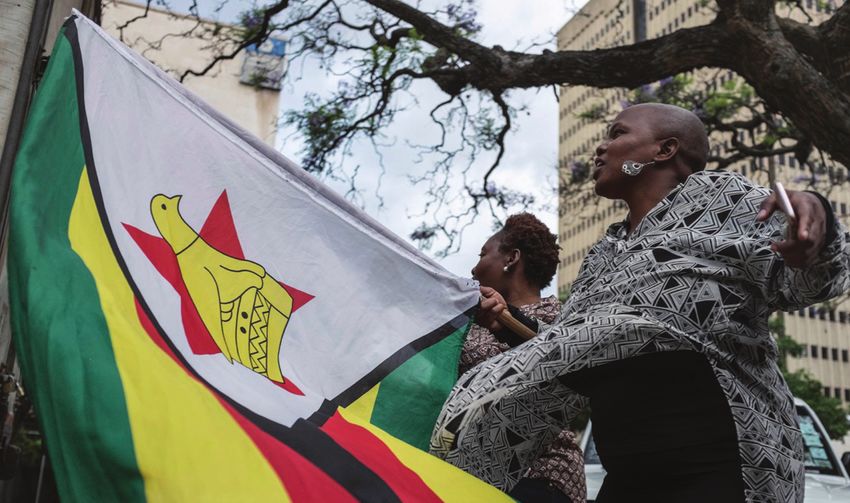
Great Zimbabwe
Alternative prospects to 2040
Lily Welborn, Jakkie Cilliers and Stellah Kwasi

  This report explores Zimbabwe’s prospects to 2040 under three scenarios. The Current Path
  presents Zimbabwe’s development trajectory given a continuation of current policies and
  practices, while two alternative scenarios, Great Zimbabwe and Things Fall Apart, help frame
  the uncertainty around the country’s future. Great Zimbabwe is an ambitious but reasonable
  scenario that shows the kind of development Zimbabwe may experience if pro-growth
  policies are implemented. In Things Fall Apart, insecurity and low-level conflict spread and
  human development outcomes decline dramatically.

                                                                     SOUTHERN AFRICA REPORT 23 | AUGUST 2019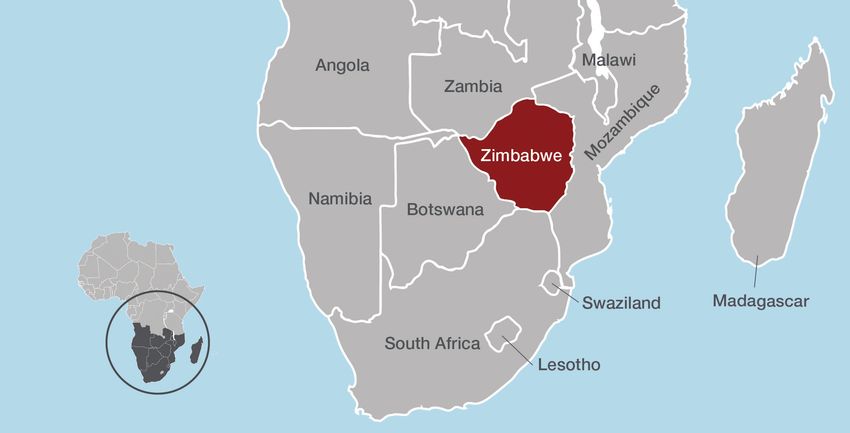
Key findings

           	Zimbabweans have endured recurring                    	Zimbabwe could potentially benefit from a
             economic and political crises and a dramatic            demographic dividend by the mid-2030s,
             deterioration of livelihoods that have intensified      but only if the provision of basic services,
             sharply since 2000.                                     healthcare and jobs improves.
           	These crises have been catastrophic for               	Zimbabwe’s dependence on food imports
             human development and caused humanitarian               is projected to worsen dramatically. On
             emergencies across the country.                         its current trajectory, Zimbabwe will be
           	Zimbabwe has the seventh highest                        dependent on imports for more than half the
             undernourishment rate in the world. On its              food needed to feed the population
             current trajectory, it will still be among the top      by 2040.
             10 by 2030 and the top 15 by 2040.                    	Making the agricultural sector more efficient
           	Zimbabwe benefits from a comparatively                  is the best strategy for improving human
             well-educated and growing working-                      development outcomes and growing the
             age population that is enthusiastic about               economy. Given the right policies, the
             democracy – an invaluable resource as the               agricultural sector has the potential to create
             government searches for solid political and             food security, improve health outcomes and
             economic footing.                                       bolster development.

         Recommendations

         The Government of Zimbabwe needs to:                        bureaucratic costs and administrative
                                                                     requirements of doing business.
           	Make land titles transferable to unlock
             investment in the agricultural sector and             	Invest and correct the causes of the low
             improve productivity.                                   transition rate from Form 4 to Form 5 or risk
           	Take advantage of the country’s arable land             significant declines in educational outcomes –
             and renewable internal water resources by               one of Zimbabwe’s greatest resources.
             rehabilitating damaged irrigation schemes and         	Allow local, regional and international monitoring
             equipping more land for irrigation.                     of elections.
           	Partner with the International Monetary              Neighbours and the international community should:
             Fund and consult with the broader public to
             implement the recommendations due from its            	Closely monitor the commitment of the
             Staff-Monitored Program in January 2020.                Government of Zimbabwe to the agreements as
                                                                     reflected in the IMF Staff-Monitored Program.
           	Respond positively to the general enthusiasm
             for democracy by committing to substantive            	Agree to long-term election observation that
             democratic accountability or risk heightened            includes the voter registration and
             levels of social unrest or internal conflict.           election process.

           	Improve economic freedom and attract                  	Reward progress in Zimbabwe with
             investment by decreasing the high                       development assistance and diplomatic support.

2   GREAT ZIMBABWE: ALTERNATIVE PROSPECTS TO 2040
Introduction                                                   victory to Robert Mugabe and the Zimbabwe African
                                                               National Union-Patriotic Front (ZANU-PF), which had
Zimbabweans have suffered recurring economic and
                                                               governed since 1980. The subsequent political crisis
political crises and a dramatic deterioration of livelihoods
                                                               led to external mediation efforts and an uncomfortable
that have intensified sharply since the turn of the
                                                               marriage of convenience in the form of the Government
century. These crises have been catastrophic for human
development and triggered humanitarian emergencies in          of National Unity (GNU), which included the MDC.
many parts of the country.                                     Shortly after, hyperinflation forced the government to
This deterioration was not generally foreseen. After           abandon the Zimbabwean dollar. Foreign currencies
achieving independence in 1980, the Government of              – particularly the US dollar and the South African rand –
Zimbabwe (GoZ) introduced a minimum wage and                   were now to be used as legal tender.
tripled spending on education and health. Expenditure          The termination of the GNU in 2013 sparked yet another
on public-sector employment increased exponentially,           economic crisis. Government debt surged and the ZANU-
however, as the size of the civil service (and debt)           PF government introduced a ‘new Zimbabwean dollar’
steadily ballooned and squeezed out more                       pegged against the US dollar. With limited reserves,
productive investments.                                        it almost immediately started trading at a significant
The GoZ eventually embarked on a poorly designed               discount to the US dollar. Money supply exploded and
and executed Economic Structural Adjustment                    inflation increased to a monthly rate of 77%.4 Monetary
Programme that included a 40% devaluation of the               stability has yet to be achieved.
Zimbabwean dollar and the removal of price and
wage controls, and introduced fees for previously free
education and health services.
                                                                  Zimbabweans have suffered recurring
                                                                  economic and political crises and a
Greater austerity had mixed results: inflation remained
high as did the budget deficit. More competition                  dramatic deterioration of livelihoods
(particularly from South Africa) forced many businesses to
close and Zimbabwe’s manufacturing sector to contract.1        In November 2017, vice president Emmerson
And during three years of severe drought (1992, 1993           Mnangagwa assumed the presidency in a surprise ouster
and 1995), average growth rates were some four                 of Mugabe and has since championed that Zimbabwe
percentage points below 1991, 1994 and 1996 while a            is now ‘open for business’. In spite of the raft of painful
global recession in 1991 and 1992 reduced raw material         reforms that followed, Zimbabwe is still in the throes of an
prices and export demand.2                                     economic and developmental crisis.
In November 1997, the GoZ agreed to a massive                  In light of these challenging decades, what kind of
unbudgeted payout to war veterans, causing the                 progress in human development can the country expect
Zimbabwean dollar to plunge by 70% and inflation to            to achieve over the next 20 years? How can Zimbabwe
spiral. The following year, the Zimbabwean army entered        improve its prospects for development?
the war in the Democratic Republic of the Congo,
                                                               The GoZ has put forth various development plans,
placing additional strain on an already burgeoning
                                                               all of which are based on the headline Vision 2030
budget deficit.3
                                                               goal of transforming Zimbabwe into an upper-middle-
Amid a deteriorating situation, the 2008 parliamentary         income economy by 2030.5 The latest is the Transitional
and presidential elections precipitated a political and        Stabilisation Programme (TSP), which runs until
economic crisis. The candidate for the Movement for            December 2020, when the first of Zimbabwe’s two
Democratic Change (MDC), Morgan Tsvangirai, won                five-year development strategies will begin. Considered
the first round for the presidency, but in the face of         ‘a comprehensive stabilization and reform effort’ by the
widespread violence, withdrew ahead of the second-             International Monetary Fund (IMF),6 the TSP aims to
round run-off on 27 June. Tsvangirai thus ceded the            restore macroeconomic stability, make the economy

                                                                                  SOUTHERN AFRICA REPORT 23 | AUGUST 2019     3
private-sector-led, fix infrastructure and stimulate        The report first assesses a baseline trajectory of
    economic growth with a number of ‘quick wins’.7             Zimbabwe’s development, referred to as the Current
                                                                Path (Box 1). The Current Path illustrates how economic
    On its current trajectory, Zimbabwe will not reach upper-
                                                                and human development are likely to unfold in Zimbabwe
    middle-income status by 2030. The current political and
                                                                to 2040 and informs the design of the alternative
    economic situation offers a challenging environment in
                                                                scenarios and recommendations for policymakers.
    which to achieve the GoZ’s ambitious development goals,
    and Zimbabwe would need to more than triple its gross       In addition to the Current Path, this report presents two
    national income per capita by 2030 in order to reach        alternative scenarios for Zimbabwe’s development: Great
    upper-middle-income status.8                                Zimbabwe and Things Fall Apart. Great Zimbabwe is
                                                                an ambitious but reasonable scenario that shows the
    However, Zimbabwe benefits from a set of factors that,
                                                                kind of development Zimbabwe could experience if pro-
    if harnessed, could set the country on a higher growth
                                                                growth policies were put in place. Conversely, in Things
    path. Doing so would require the GoZ to depart from
                                                                Fall Apart, insecurity and low-level conflict spread and
    its historically state-centred approach to developing the
                                                                push the country to the brink of civil war.
    country, and could result in dramatic improvements in
    human development and economic outcomes.

    Purpose and scope                                              On its current trajectory, Zimbabwe will
    This report explores Zimbabwe’s development prospects          not reach upper-middle-income status
    to 2040. It reviews the underlying structural trends that      by 2030
    are shaping Zimbabwe’s development and how they
    may change over the next two decades, and offers two
    alternative scenarios for the country’s future.             A concluding section offers recommendations primarily
                                                                intended for the GoZ, but that also may be useful for its
    The report uses the International Futures (IFs) model, an
                                                                partners and neighbours.
    integrated assessment model that projects hundreds of
    interacting variables across human, social and natural      The project is funded by the Hanns Seidel Foundation
    systems for 186 countries to the year 2100 (Box 1).         (HSF), the Department for International Development

    Box 1: The International Futures (IFs) model and the Current Path scenario

       IFs is an integrated assessment model hosted             of over 4 500 historical data series to identify trends
       and developed by the Frederick S Pardee Center           and produce a Current Path scenario from 2015 (the
       for International Futures at the Josef Korbel            current base year). The Current Path is a dynamic
       School at the University of Denver. The IFs              scenario that represents a continuation of current
       forecasting platform blends modelling techniques         policy choices and technological advancements. It
       from econometrics and systems dynamics and               assumes no major shocks or catastrophes but moves
       endogenises relationships across key systems             beyond a linear extrapolation of past and current
       including demographics, health, agriculture,             trends by using our available knowledge about how
       education, economics, infrastructure, energy             systems interact to produce a dynamic forecast.
       and governance.
                                                                IFs is free and open-source and is available
       IFs helps users to better understand how the world       for download at www.du.edu/ifs. Extensive
       around us is unfolding and allows us to identify         documentation on the IFs model, including its basic
       potential points of intervention to shape future         assumptions, is available through the IFs help system
       development. The model leverages its repository          at www.du.edu/ifs/help/.

4   GREAT ZIMBABWE: ALTERNATIVE PROSPECTS TO 2040
Box 2: Project notes
• All GDP values are at market exchange rates, • When comparing Zimbabwe to lower-middle-
while all GDP per capita values are at purchasing income countries in Africa and globally, we
power parity. exclude Zimbabwe, hence the use of ‘other
• All US$ values are in 2018 constant dollars. lower-middle-income Africa’ and ‘other
• All poverty threshold values are in 2011 constant lower-middle-income’.
dollars at purchasing power parity. • ‘Southern Africa’ comprises Angola, Botswana,
• The term ‘currently’ indicates the projected 2018 Lesotho, Malawi, Mozambique, Namibia, South
value from IFs with a 2015 base year. Africa and Swaziland.
(DFID) of the United Kingdom and the Swedish and infrastructure. It shows how Zimbabwe arrived at
International Development Cooperation Agency (SIDA). It where it is today and the kind of development it can
was implemented by the African Futures and Innovation expect to achieve in these sectors given no major
(AFI) programme at the Pretoria office of the Institute changes in policy or technological advancement or
for Security Studies (ISS) and included three review catastrophes (Box 1).
workshops to comment on the findings and data held in
Demographics
Pretoria and Harare during the first half of 2019.
Home to nearly 17 million people in 2018, Zimbabwe’s
Current Path prospects population is nearly as large as that of neighbouring
This section presents Zimbabwe’s historical and projected Zambia (estimated at 17.6 million) and less than one third
trends along the Current Path out to 2040 in the following the size of South Africa (estimated at 57 million) (Figure 1).
sectors: demographics, education, health, economics, Its population has grown more than five-fold since 1950,
migration and remittances, agriculture, climate change from only 2.8 million people.9
Map of Southern Africa
SOUTHERN AFRICA REPORT 23 | AUGUST 2019 5Figure 1: Population
80
70
60
50
Millions of people
40
30
20
10
0
1960 1965 1970 1975 1980 1985 1990 1995 2000 2005 2010 2015 2020 2025 2030 2035 2040
Zimbabwe Angola Botswana Malawi Mozambique South Africa Zambia
Source: Data from United Nations Population Division (UNPD); forecast from IFs v 7.36
Zimbabwe’s population is projected to reach This ratio is important for economic growth. A large
approximately 26 million by 2040, representing a more working-age population relative to the dependent
than 50% increase over 2018.10 Zambia and Malawi are population generally boosts economic growth at low
projected to grow slightly more rapidly, while Angola and levels of development and could, towards the end
Mozambique are expected to continue experiencing of the 2040 forecast horizon, provide a substantive
dramatic population growth. On the Current Path, the demographic dividend. However, the existence of a
respective populations of Mozambique and Angola will favourable age structure does not automatically generate
each be more than double that of Zimbabwe by 2040. economic growth. People must also have access to clean
water and sanitation facilities, sufficient food and quality
Zimbabwe’s youthful population will continue to
education and jobs.
constrain economic growth rates and pose a significant
challenge to political stability for the next 15 to 20 years. The health, infrastructure and economic data and
Presently, half of the population is under the age of 19, forecasts reviewed in this report suggest that on its
while 45% of the population is under the age of 15. This current trajectory, Zimbabwe may not benefit from the
translates into only 13 working-age people (aged 15–64) economic benefits of its demographic dividend. Chronic
for every 10 dependants, which is fairly average for food insecurity has resulted in high rates of hunger
Southern Africa. and malnutrition and rather than more rapid growth,
Zimbabwe may reap only the negative consequences of
This low ratio is, however, improving. By 2040,
its youthful population structure such as the instability
Zimbabwe is projected to have nearly 19 working-age
often associated with a large youth bulge.
people for every 10 dependants. This ratio is expected
to peak in 2060 at 22 working-age people for every 10 In addition to access to modern contraceptives and
dependants – several years ahead of its African low- improved basic healthcare, improving the accessibility
income and lower-middle-income peers. and quality of education for girls and women is among
6 GREAT ZIMBABWE: ALTERNATIVE PROSPECTS TO 2040Figure 2: Demographic dividend (working-age population divided by the dependent population)
2.4
Working-age population divided by dependent population
2.2
2
1.8
1.6
1.4
1.2
1
0.8
1980 1985 1990 1995 2000 2005 2010 2015 2020 2025 2030 2035 2040 2045 2050 2055 2060 2065 2070
Zimbabwe Low-income Africa Other low-middle-income Africa Upper-middle-income Africa
Source: Data from UNPD; forecast from IFs v 7.36
the most widely cited strategies in countries with The counter-urbanisation trend reflected in Figure 3,
large dependent youth populations to accelerate the however, simplifies multiple interacting dynamics. Urban-
demographic transition. rural migration has indeed taken place in Zimbabwe,
notably as a result of disruptive policies such as the 2000
This is because the higher a woman’s level of educational
Fast Track Land Reform Programme and Operation
attainment, the fewer children she is likely to have.
Murambatsvina five years later.
And, in general, fewer children per woman and delayed
childbearing and marriage translates into more resources However, some researchers attribute the scale of
available for education and health per child.11 Zimbabwe’s stalled urbanisation to the continued use
of old delineations of urban, peri-urban and rural areas,
asserting that sprawling populations around cities,
Poverty remains a pervasive currently classified as rural, should be considered
and chronic issue in Zimbabwe, urban.14 Thus, ‘boundaries in Zimbabwe have remained
especially in the rural provinces static while urban sprawl and urban populations in rural
jurisdictions have expanded’.15
Zimbabwe is also expected to remain a predominantly Urbanisation, if deliberate and planned, could provide
rural country to 2040.12 At present, an estimated seven Zimbabwe with many benefits including the potentially
out of 10 Zimbabweans live in rural areas – roughly five more rapid (and less costly) roll-out of services such as
percentage points more rural than would be expected healthcare. However, urban infrastructure urgently needs
based on its level of development (measured as GDP to be upgraded given the health risks that arise from
per capita).13 In fact, Zimbabwe appears to have abruptly these relatively densely populated areas.
stopped urbanising just after the turn of the century, when Poverty remains a pervasive and chronic issue
about two-thirds of the population lived in rural areas. in Zimbabwe, especially in the rural provinces.16
SOUTHERN AFRICA REPORT 23 | AUGUST 2019 7Figure 3: Rural and urban populations
90 20
80 18
16
70
14
60
Millions of people
12
% of population
50
10
40
8
30
6
20
4
10 2
0 0
1980 1985 1990 1995 2000 2005 2010 2015 2020 2025 2030 2035 2040
Rural population (millions) Urban population (millions) Rural population (%) Urban population (%)
Source: Data from UNPD; forecast from IFs v 7.36
IFs estimates that approximately one out of five In the Southern African Development Community
Zimbabweans (3.2 million people) live on less than the (SADC), only Botswana, South Africa, the Seychelles
international extreme poverty line of US$1.90 per day. and Mauritius (all upper-middle-income or high-income
Two out of five Zimbabweans (7.3 million) are living on economies with GDP per capita between six and 14
less than US$3.20, the extreme poverty line for lower- times larger than that of Zimbabwe) currently have more
middle-income countries.17 Although this poverty rate educated populations.19 Globally, other countries with
of roughly 40% is projected to decline to around 30% roughly eight years of education in the adult population
by 2040, more than seven million people will be living in include Portugal and Turkey, where GDP per capita is
extreme poverty by 2040 (Figure 4). roughly 14 and 12 times higher, respectively.
A 2015 study using a nationalised household
consumption-based poverty measure found that of all the In SADC, only Botswana, South Africa,
provinces, Matabeleland North had the highest poverty the Seychelles and Mauritius have more
rate of 85.7%, while in the other rural provinces it ranged
from 65% to 76%.18
educated populations than Zimbabwe
Education The Zimbabwe National Statistics Agency (ZimStat)
Education offers a bright but fragile hope for Zimbabwe’s estimates that Zimbabwe had a literacy rate of 94% in
development. In 2018, the average Zimbabwean adult 201720 – a bit higher than the IFs estimate of 90%, which
(15 years and older) had completed eight years of would make it the sixth highest in Africa and markedly
education – 1.4 years more than his/her counterpart in higher than the average for upper-middle-income Africa
other lower-middle-income African countries. (86%). About 12% of Zimbabwe’s population of 15 and
8 GREAT ZIMBABWE: ALTERNATIVE PROSPECTS TO 2040Figure 4: Extreme poverty (US$3.20 per person per day)
22 4
20
3.5
18
3
16
14 2.5
Millions of people
% of population
12
2
10
8 1.5
6
1
4
0.5
2
0 0
2015 2020 2025 2030 2035 2040
Millions of people Extreme poverty rate
Source: Data from the World Bank; forecast from IFs v 7.36
above has either no education or incomplete primary Nearly all learners (94%) who enrol in Form 1 continue
education, which is excellent when compared to other all the way through to the beginning of Form 4 (the last
lower-middle-income Africa (30%). year of lower secondary, not shown in the table), but the
However, problems seem to be arising at the transition majority do not pass the Ordinary Level exams, which are
from the Ordinary Level cycle to the Advanced Level required to graduate. This helps to explain why only 23%
cycle and at graduation from Form 6, the last year of of students who enrol in Form 4 proceed to Advanced
the Advanced Level cycle. Table 1 shows learners’ Level cycle (upper secondary school).
participation in the education system in Zimbabwe and This concerning lower-to-upper secondary transition rate
in comparison groups. reflects a number of dynamics. First, Zimbabwe has for
Note that enrolment and graduation rates are gross years been documenting low pass rates of the Ordinary
rates, meaning that they measure the total number Level exams, estimated at under 30% in 2017.21 A
of students (regardless of age) who have enrolled or student who fails may be ineligible to proceed to either
graduated as a percentage of the age-appropriate the Advanced Level cycle or to the types of tertiary
population, and thus may exceed 100% (Box 3). institutions that do not require an upper secondary
education (e.g., agricultural, vocational, polytechnic and
Table 1 shows that Zimbabwe’s primary completion rate
teachers’ colleges).
of 94.2% is higher than the global primary completion
rate of 91.3%. Participation in the Ordinary Level cycle, Two additional factors cited by members of the Ministry
or lower secondary, is also better than in low-income of Education are that many parents cannot afford the
African countries but below lower-middle-income Africa fees needed for the Advanced Level cycle and that lower
and the global average. secondary schools outnumber upper secondary schools.22
SOUTHERN AFRICA REPORT 23 | AUGUST 2019 9Box 3: Education in IFs and definitions23
In IFs, education is conceptualised as a pipeline last grade of the given level of education, as a
in which learners steadily progress from primary percentage of the population at the theoretical
to secondary and all the way to tertiary level (i.e., graduation age for the given level of education.
completion of one level enables transition to the
Gross graduation rate: The number of graduates
subsequent level). The more learners a country
who have completed the last grade of a given level
can enrol in primary school, the larger the pool of
of education, regardless of age, as a percentage of
potential learners who can graduate and transition
the population at the theoretical graduation age for
to secondary, and potentially tertiary, studies.
the given level of education.
Gross enrolment rate: The number of students
Transition rate: The number of students admitted
enrolled in a given level of education, regardless
to the first grade of a higher level of education
of age, expressed as a percentage of the official
(such as lower secondary) in a given year,
school-age population corresponding to the same
expressed as a percentage of the number of
level of education.
students enrolled in the final grade of the lower
Completion rate: The number of people in the level of education in the previous year (such as
relevant age group who have completed the primary in this example).
Despite these issues, the Current Path forecasts of shows the shares of the population that are expected to
educational attainment are positive. The average number complete primary, secondary and tertiary school.
of years of education among the population 15 years and Zimbabwe has also improved gender parity significantly.
older is expected to increase from eight years in 2018 In 1980, only 91 female learners for every 100 male
to 8.6 years in 2030 and just over nine years in 2040. learners enrolled in primary school; only 76 female
And overall, a greater portion of Zimbabweans will attain learners per every 100 male learners enrolled in
higher levels of education in 2040 than in 2018. Figure 5 secondary school; and only 50 female learners per every
Table 1: Education outcomes, 2015
Lower secondary Upper secondary
Primary (Grades 1–7) (Ordinary Level/ (Advanced Level/ Tertiary
Country/region Forms 1–4) Forms 5 and 6)
Enrolment Completion* Enrolment Graduation Transition Graduation Enrolment Graduation
Zimbabwe 99.9% 94.2% 68.1% 55.4% 23% 12.6%** 8.4% 1.1%
Low-income
102.1% 48.3% 45% 31.3% 73.9% 15.4% 5.9% 5.9%
Africa
Other lower-
middle-income 104.5% 80.2% 74.6% 56.1% 86.5% 45.4% 17.2% 12.2%
Africa
World 105.4% 91.4% 91% 76.8% 91.6% 56.2% 38.8% 29.4%
Source: Data from UNESCO Institute for Statistics and ZimStat
Note: Cells are shaded red, orange, yellow, light green or dark green based on how they compare with the other values in the column.
* Completion rate is used rather than graduation rate because there are no reliable data sources for primary graduation rates. Completion and graduation rates
are sufficiently similar to use them interchangeably in this context.
** This is the completion rate, as reliable data was not available for Zimbabwe’s upper secondary graduation rate.
10 GREAT ZIMBABWE: ALTERNATIVE PROSPECTS TO 2040Figure 5: Level of educational attainment, 2018 and 2040
90
80
80
75
70
60
% of population 15+
50
40
30
20
17
12
10
6 7
1 3
0
No education/ Completed Completed Completed tertiary
incomplete primary only primary only secondary
2018 2040
Source: Data from Barro-Lee; forecast from IFs v 7.36
100 male learners enrolled in tertiary school.24 Presently, many teachers have left the country, emigrating mostly
Zimbabwe has achieved gender parity in primary and to Botswana, South Africa and Namibia.27 The crisis
secondary enrolment and reached a ratio of 89 to 100 for continues since Zimbabwe’s cash shortage has plunged
tertiary school enrolment. the country into financial disarray and teachers are
demanding pay in US dollars.28
With high levels of skilled outward migration, Zimbabwe’s
ratio of qualified teachers to students has steadily Health
declined over time, an important contributor to the The HIV/AIDS epidemic has had devastating
recent decline in the quality of education outcomes in the consequences for health in Zimbabwe, its impact clear
country. The trend is compounded by underinvestment, across most health indicators. Because the effects of the
poor infrastructure, corruption and low morale.25 epidemic are long-term, the country is still lagging behind
Following the introduction of free compulsory primary its regional and income peers that were less affected by
and secondary education after independence in 1980, the epidemic.
Zimbabwe’s education system has been a source of Its impact is most evident in Zimbabwe’s historical life
pride, but has endured multiple challenges owing to expectancy. In 1980, Zimbabwe’s life expectancy of
economic, political and monetary crises, and now 59 years far exceeded the average life expectancy in
appears to be on a downward trend. low-income African and other lower-middle-income
Following the 2008 economic crisis, teachers went on African countries.
strike for an entire year; 94% of rural schools closed East Asia and the Pacific, meanwhile, already had an
and those that remained open had an average 20% average life expectancy of 65 years at that time, having
attendance rate.26 Absenteeism is rife and according made very rapid progress in the preceding two decades.29
to the Progressive Teachers Union of Zimbabwe, Just 20 years prior, in 1960, Zimbabweans had an
SOUTHERN AFRICA REPORT 23 | AUGUST 2019 11average life expectancy two years longer than that of East the highest average life expectancy globally – is 79 years.
Asia and the Pacific. Life expectancy in Zimbabwe is projected to improve at a
similar rate to low-income and lower-middle-income Africa
From the beginning of the epidemic in the mid-1980s to
in the coming decades, reaching 68 years by 2040.
2000, Zimbabwe suffered the highest HIV/AIDS death rate
in the world (Figure 7). In 1985, average life expectancy The HIV/AIDS epidemic also contributed to a rise in infant
began to decline, reaching a low of 46 years (among the mortality.31 Historically, Zimbabwe has had lower infant
lowest in the world) in 2000 before beginning to recover, mortality rates than its regional and income peers (Figure
thanks in part to the establishment of HIV counselling 8). Infant mortality is an important indicator of the health of
centres in 1999.30 a population and the quality, availability and accessibility of
healthcare and medical technology.32 From 1960 to 1990,
Life expectancy in Zimbabwe is the infant mortality rate declined from 100 to 59 deaths per
1 000 live births, coinciding with a reduction in the global
projected to improve at a similar rate to average infant mortality rate over this period. Over this
low-income and lower-middle-income same period, the average infant mortality rates in the rest of
Africa in the coming decades Southern Africa and in other lower-middle-income African
countries were substantially higher, though also declining.
Zimbabwe’s current estimated life expectancy of 61 is But from 1990 until 2000, the infant mortality rate rose to
roughly on a par with low-income and other lower-middle- 66 deaths per 1 000 live births before beginning to slowly
income countries in Africa. However, the average life improve. IFs estimates that in 2018, infant mortality was
expectancy of East Asia and the Pacific has since soared 43 per 1 000 live births – the 25th highest infant mortality
to 76 years, while that of North America – the region with rate in the world.
Figure 6: Life expectancy at birth
90
85
80
75
70
65
Years
60
55
50
45
40
35
1960 1965 1970 1975 1980 1985 1990 1995 2000 2005 2010 2015 2020 2025 2030 2035 2040
Zimbabwe Low-income Other lower- Upper-middle- East Asia North World
Africa middle-income income Africa and the America
Africa Pacific
Source: Data from UNPD; forecast from IFs v 7.36
12 GREAT ZIMBABWE: ALTERNATIVE PROSPECTS TO 2040Figure 7: AIDS deaths rate
1.2
1.1
1
0.9
0.8
% of population
0.7
0.6
0.5
0.4
0.3
0.2
0.1
0
1990 1995 2000 2005 2010 2015 2020
Zimbabwe Botswana Ethiopia Namibia South Africa
Source: Data from UNAIDS/World Health Organization (WHO); forecast from IFs v 7.36
Figure 8: Infant mortality rate
170
150
130
Deaths per 1 000 live births
110
90
70
50
30
10
1960 1965 1970 1975 1980 1985 1990 1995 2000 2005 2010 2015 2020 2025 2030 2035 2040
Zimbabwe Low-income Africa Other lower-middle- Upper-middle- World
income Africa income Africa
Source: Data from UNPD; forecast from IFs v 7.36
SOUTHERN AFRICA REPORT 23 | AUGUST 2019 13By 2040, infant mortality in Zimbabwe is projected to infrastructure across much of the country. A ZimStat
decline to 27 deaths per 1 000 live births (roughly the survey found that, in 2014, over 13% of children in
same as in low-income and lower-middle-income Africa). Zimbabwe were suffering from diarrhoea.33
The distribution of mortality in Zimbabwe shows that the And although AIDS deaths continue to decline from
country is progressing slowly through its epidemiological the peak of the epidemic in the early 2000s, HIV/
transition, the process by which mortality shifts away AIDS remains the dominant cause of death among the
from communicable diseases (e.g., malaria, cholera and population 15 years and older. Meanwhile, respiratory,
typhoid) and towards non-communicable diseases (e.g., ‘other communicable 34 and, to a lesser extent, diarrhoea,
cancer and diabetes). are the leading causes of death among the elderly
population (65 and older).
Communicable diseases continue to be responsible for
the large majority of deaths in the country, but the burden
of non-communicable diseases has been steadily rising Communicable diseases continue to
and is beginning to contribute significantly to overall
be responsible for the large majority of
mortality. Non-communicable diseases are expected to
overtake communicable diseases as the primary cause of deaths in the country
death in around 2030 (Figure 9).
Among infants, ‘other communicable diseases’ (a Among non-communicable diseases, cardiovascular
catch-all term used by the Global Burden of Disease diseases and cancer are the primary causes of death
project for less prevalent communicable diseases), among older cohort populations.
diarrhoea and respiratory infections are the leading The rise of non-communicable diseases presents
causes of death, reflecting poor water and sanitation a significant challenge to Zimbabwe: not only must
Figure 9: Number of deaths by cause (International Classification of Diseases)
160
140
120
Thousands of deaths
100
80
60
40
20
0
1990 1995 2000 2005 2010 2015 2020 2025 2030 2035 2040
Communicable diseases Non-communicable diseases Injuries
Source: Data from the Institute for Health Metrics and Evaluation and WHO; forecast from IFs v 7.36
14 GREAT ZIMBABWE: ALTERNATIVE PROSPECTS TO 2040the GoZ address the immediate, mostly preventable depletion of livelihood assets that will lead to food
health risks posed by communicable diseases like HIV/ consumption gaps’.41
AIDS and diarrhoea, but it must also invest in more Meagre crop production in the 2018/2019 season are
advanced healthcare systems capable of tackling non- expected to maintain Crisis outcomes across much
communicable diseases. Furthermore, when interventions of the country until at least January 2020.42 Per this
aimed at largely preventable diseases are successful, classification, Zimbabwe is only two phases away from
the transition towards non-communicable diseases Famine (Phase 5).
accelerates, underscoring the need for early preparations.
Economics
Hunger also presents a pervasive threat to the well-being
Zimbabwe’s economy has suffered a series of intense
of Zimbabweans across much of the country. Low access
and prolonged economic crises that have been among
rates to improved water and sanitation cause outbreaks
the worst in Africa’s recent history. Recurrent runaway
of diarrhoeal diseases, which are the leading cause of
inflation, dollarisation, re-dollarisation and the emergence
malnutrition and hunger.35
of multiple parallel exchange rates have severely distorted
An estimated 2.4 million Zimbabweans are severely the economy. At present, the country is in the midst of
food insecure36 and roughly 40% of the population is a monetary crisis brought about by the misuse of the
undernourished37 (6.4 million people) – the seventh real-time gross settlement (RTGS) platform that started in
highest rate of undernourishment in the world. 2016 and the GoZ’s recent decision to make the RTGS
Although this rate is projected to decline over the next dollar the sole legal tender.
two decades, Zimbabwe will still be among the 10 The current crisis is a far cry from the state of the
countries globally with the highest undernourishment economy at independence. From 1980 to 2004,
rates by 2030, and among the top 15 by 2040, when Zimbabwe had the fourth largest economy in Southern
its undernourished population is expected to be over Africa (South Africa, Angola and Zambia claimed the top
four million. Nutrition programmes to ensure access three spots). Zimbabwe’s economy peaked in size in
to required calories as well as contain communicable 1998 at US$18.6 billion before plummeting to roughly half
diseases are necessary to ensure that people reach their of that (US$9.3 billion) by 2008.
full potential.
Roughly 270 000 children (defined as under five years of Two out of five people in Zimbabwe are
age) were considered malnourished in 2018, representing
nearly 11% of Zimbabwe’s child population.38 Stunting,
undernourished – the seventh highest
an indicator of chronic malnutrition measured by rate of undernourishment in the world
height-for-age,39 remains one of Zimbabwe’s greatest
challenges: ZimStat estimates that 27.6% of children Although average incomes in Zimbabwe have been
were stunted in 2014.40 On the Current Path, there will relatively stagnant for decades, they were higher than in
still be approximately 200 000 malnourished children in Zambia from the mid-1980s to 2002. But from 1998 to
2040. Severe malnutrition among children under five can 2008, Zimbabwe’s GDP per capita more than halved from
lead to permanent physical and cognitive impairments, US$3 100 to US$1 365 (Figure 10).
hampering their educational and economic outcomes
In the decade since, GDP per capita has grown by
throughout their lives.
roughly 60% to US$2 200 but remains low compared to
The Famine Early Warning Systems Network has regional peers. Average incomes in Zambia, for example,
designated the majority of the population as enduring are now almost double than those in Zimbabwe. GDP has
Integrated Food Security Phase 3 (Crisis) outcomes. slowly recovered to nearly US$18 billion in 2018 and is
Even with humanitarian aid, at least one out of five projected to grow at an average rate of 4.6% per annum
households is suffering from malnutrition, or is ‘marginally out to 2030 and at an average rate of 5.2% between
able to meet minimum food needs only with accelerated 2030 and 2040 to reach US$51.4 billion by 2040.
SOUTHERN AFRICA REPORT 23 | AUGUST 2019 15Figure 10: GDP per capita
28
26
24
22
20
Thousands of 2018 dollars
18
16
14
12
10
8
6
4
2
0
1980 1985 1990 1995 2000 2005 2010 2015 2020 2025 2030 2035 2040
Zimbabwe Botswana Mozambique Namibia Zambia
Source: Data from the World Bank; forecast from IFs v 7.36
Throughout these economic crises, Zimbabwe has GDP increased by 40%. Finance Minister Ncube attributed
received little aid and foreign direct investment (FDI) the increase to the inclusion of the informal economy,
relative to its income peers (Figure 11). Although there a reflection of the extent to which the economy has
is clearly considerable scope for increases in both, regressed since the early 2000s.44
more FDI would require a substantial change in current A large informal economy generally constrains the
levels of business and investor confidence. Zimbabwe development of its formal counterpart, which provides
currently has the eighth and 25th lowest scores globally job security and employment benefits and contributes
in the World Bank’s regulatory quality and governance to government revenues through taxation. A 2018
effectiveness indices, respectively; the 25th worst score IMF working paper suggests that the informal sector
globally on Transparency International’s Corruption contributed an average of 61% to GDP between 1991 and
Perceptions Index; and the 18th lowest score globally 2015 and 67% in 2015 – second only to Bolivia globally.45
on the Fraser Institute’s economic freedom index, which
The economy relies heavily on a few commodity exports,
lists excessive bureaucratic costs and administrative
particularly tobacco, gold, diamonds and platinum,
requirements for business and government control over
rendering the country exposed to fluctuations in
the movement of capital as the most severe issues (see
commodity prices. The OEC estimates that raw tobacco
Box 4 for full definitions of these indicators).43 Zimbabwe’s
comprised over half of Zimbabwe’s exports in 2017;
performance across these indicators is not projected to
mineral products, metals and precious metals accounted
improve in the coming decades.
for nearly 30% of exports.46 In 2016, gold accounted for
A large informal economy, a highly concentrated trade approximately one third of exports.47 Recent turmoil over
profile and a large trade deficit have also contributed to the lack of foreign exchange to meet outstanding debts
Zimbabwe’s economic woes. During the most recent has resulted in certain mining companies not being paid
rebasing of the economy (in 2018), Zimbabwe’s 2016 for nearly two months, harming production.48 Several
16 GREAT ZIMBABWE: ALTERNATIVE PROSPECTS TO 2040Figure 11: Foreign direct investment and foreign aid
22
20
18
16
14
12
% of GDP
10
8
6
4
2
0
-2
1980 1985 1990 1995 2000 2005 2010 2015 2018
Inward FDI Inward FDI Foreign aid Foreign aid
(Zimbabwe) (low-income Africa) (Zimbabwe) (low-income Africa)
Source: IMF World Economic Outlook 2017 and Organisation for Economic Co-operation and Development (OECD) data in IFs 7.36
agro-processing, technical support services firms, 2018 the Transitional Stabilization Plan (TSP) stated that
transport and logistics companies also threatened to end the country’s external debt arrears amounted to about
operations in 2018.49 US$5.6 billion.54 The 2019 World Economic Situation
and Prospects report estimated that government debt
may reach 94% of GDP in 2018 and 117% in 2020.55
Zimbabwe’s large and fragmented
Generally, a debt level of less than 40% of GDP is
public sector has exacerbated its considered manageable; at 60% or higher, countries
huge debt burden head for trouble. Zimbabwe’s large and fragmented public
sector has exacerbated this debt burden: government-
In 2018, over 80% of Zimbabwe’s exports went to just guaranteed debt from state-owned enterprises and
four countries (South Africa, the United Arab Emirates, parastatals alone accounted for US$2.1 billion in 2015.56
Mozambique and Zambia). Zimbabwe’s imports profile
Migration and remittances
is similarly restricted, with over 40% of imports coming
from South Africa.50 According to the Observatory of Zimbabwe has suffered very high levels of outward
Economic Complexity (OEC), which relies on data from migration, estimated at between 0.4% and 0.2% of its
UN COMTRADE, Zimbabwe’s trade deficit in 2016 was population annually since the turn of the century. This
roughly US$2.3 billion.51 ZimStat estimates that the migration has resulted in a large diaspora and significant
nation’s trade deficit for the 11 months leading up to remittances, which have played a central role in steadying
December 2018 reached a record US$2.4 billion.52 the Zimbabwean economy by injecting much-needed
foreign currency.
Zimbabwe also has protracted arrears with official
creditors, including the World Bank, effectively blocking According to the TSP, remittances are the second largest
access to international financial support.53 In October source of income, with exports coming in first.57 In 2015,
SOUTHERN AFRICA REPORT 23 | AUGUST 2019 17remittances through the formal channels recorded by to the weakening global economy and the diaspora’s
the Reserve Bank of Zimbabwe are estimated to have increasing preference to send remittances in kind and
reached US$1 billion– more than double the amount through informal channels.61
of net foreign direct investment received by Zimbabwe
Agriculture
during the same period.58 However, this high outward
migration has also harmed human capital by stripping the Zimbabwe’s agricultural sector, the mainstay of the
country of much of its better-educated workforce. economy, has suffered decreasing productivity since the
late 1970s, when it boasted yields twice the average for
low-income Africa. On the Current Path, this trend will
Zimbabwe’s agricultural sector has
extend into the coming decades, warning of deepening
suffered decreasing productivity since food insecurity. Zimbabwe already relies heavily on
the late 1970s crop imports from neighbours, with an estimated 30%
of demand being met by imports. Within Southern
Remittances from South Africa account for approximately Africa, only Botswana, Lesotho and Namibia are more
one third of the total diaspora remittances to Zimbabwe.59 dependent on agricultural imports.
Although remittances are usually made in cash transfers, At an estimated 1.8 metric tons per hectare in 2018,
shortages of basic commodities in Zimbabwe encourage Zimbabwe’s yields are the 13th lowest in Africa and
migrants to purchase goods such as foodstuffs abroad have been below the average for low-income Africa
and bring them home or send them through relatives, since 2005. Average yields in other lower-middle-
friends, taxi or bus.60
income countries in Africa are more than double that in
However, formal diaspora remittances to Zimbabwe Zimbabwe. Zimbabwe’s yields are projected to remain
decreased roughly 15% between 2015 and 2016 owing stagnant to 2040, although droughts will continue
Figure 12: Agricultural yields per hectare
8
7
6
Metric tons per hectare
5
4
3
2
1
0
1980 1985 1990 1995 2000 2005 2010 2015 2020 2025 2030 2035 2040
Zimbabwe Angola Botswana Mozambique Tanzania
Source: Data from Food and Agriculture Organization (FAO); forecast from IFs v 7.36
18 GREAT ZIMBABWE: ALTERNATIVE PROSPECTS TO 2040to cause sharp fluctuations in both yields and total Programme, and Finance Minister Ncube is believed
agricultural production. to have claimed that it has made ‘land a dead asset’.68
Much of the agricultural land has no collateral value,
As a result, Zimbabwe’s total agricultural production is
blocking farmers’ access to credit.
projected to increase by a mere 8% over 2018 levels
to eight million metric tons by 2040. Over this same Climate change
period, Zambia, Mozambique and Kenya are projected to
Climate change will cause Zimbabwe to become on
increase their agricultural output by over 50%; Tanzania,
average warmer and dryer. Droughts are likely to become
by more than 60%.
more intense and frequent, and rain increasingly variable.
Expanding irrigation has the potential to increase Climate change – in addition to natural climatic cycles
crop yields, improve the nutritional status of rural like El Niño – also intensifies the severity of major weather
communities and bolster economic development by events like cyclones.
commercialising crop production.62 Most crops in
In 2019 Cyclone Idai illustrated the destruction such
Zimbabwe are rainfed, and given that rain is highly
events may leave in their wake and underscored the
unpredictable in Zimbabwe – annual average rainfall
need to reduce the vulnerability of poor populations,
ranges from a low of 300 mm (in the Limpopo Valley)
which have very little capacity to adapt to the impacts of
to a high of 3 000 mm (in the east), the lack of irrigation
climate change.69
has challenged food security.63
Because of the country’s high percentage of rural people,
livelihoods in Zimbabwe are intimately connected with the
Expanding irrigation has the potential rhythm of the seasons, the quality of the country’s natural
to improve the nutritional status of rural resources and the preservation of its fragile ecosystems
communities and bolster development and biodiversity.
The impacts of climate change are threatening these
resources and in 2015 the Ministry of Environment, Water
Recent studies suggest that Zimbabwe has enough
and Climate recognised that climate change was ‘likely
renewable internal water resources to irrigate more
to stall the country’s development, pose a serious risk to
land sustainably. Estimates of the current area of land
food security and adaptive capacity’.70
equipped for irrigation vary from 150 000 to 206 000
hectares,64 although less than 50% of that area equipped Poor and worsening macroeconomic conditions
for irrigation is likely to actually be irrigated owing to poor have further aggravated food insecurity by impeding
maintenance.65 The Food and Agriculture Organization the availability and affordability of staple foods like
estimated in 2015 that, excluding the Zambezi and maize meal.
Limpopo rivers, Zimbabwe could sustainably irrigate a Infrastructure
total of 365 624 hectares.66
Zimbabwe has significant backbone infrastructure, but
Rehabilitating existing irrigation schemes and building successive political and economic crises since the 1990s
new ones would improve agricultural production, have left energy, water, sanitation and road infrastructure
especially if combined with modern farming practices and in varying states of disrepair. Currently, an estimated one
improved access to fertilisers, seeds and other enablers. in three Zimbabweans has access to electricity. This
Unlocking the potential of land requires the ability to figure has barely budged since 1990. Around half of
transfer land titles in line with the TSP’s commitment to Zimbabweans are expected to have access to electricity
‘guarantee security of tenure for all farmers, irrespective by 2040.
of race, by issuing 99-year leases and A1 permits’.67 Water, sanitation and hygiene (WASH) facilities are also
The lack of transferability of land titles, an element severely lacking in Zimbabwe, particularly in rural areas,
of command agriculture, has particularly hindered increasing people’s chances of being malnourished and
the sector since the 2001 Fast Track Land Reform contracting communicable diseases. In 2000, 80% of
SOUTHERN AFRICA REPORT 23 | AUGUST 2019 19Zimbabweans had access to an improved source of such as cholera. This access rate is projected to improve
drinking water – quite high relative to its regional and on the Current Path, but only slightly. In 2030, 10.4 million
African income peers.71 people are projected to lack access to an improved
sanitation facility; in 2040, over six million people.
In the years that followed, this rate declined while access
rates in most African countries improved. In 2012 and Recent cholera epidemics in Harare underscore the
2014 respectively, improved water access rates in lower- urgency of Zimbabwe’s ailing WASH infrastructure. The
middle-income Africa and Southern Africa surpassed city’s water and sewage infrastructure has not been
that of Zimbabwe. IFs estimates that in 2018, 75% of upgraded since 1994, when only 1.5 million people lived
Zimbabweans had access to improved water. This means in the city. Now, an estimated 4.5 million people live in
that roughly four million people in Zimbabwe did not have Harare and its peripheries.72
access to an improved source of drinking water.
In September 2018, a burst sewage pipe contaminated
a well and two boreholes in two densely populated
Recent cholera epidemics in Harare suburbs, causing a cholera outbreak that killed at least
30 people and infected at least another 5 460, according
underscore the urgency of Zimbabwe’s
to the Ministry of Health.73 A decade prior, a cholera
ailing WASH infrastructure outbreak resulted in over 4 000 deaths and 98 585
reported cases.74
A similar story emerges from the data on access to
sanitation. Since around 2000, approximately three out
Alternative futures
of every five Zimbabweans have lacked access to an The following sections present two alternative futures for
improved sanitation facility (10 million people in 2018), Zimbabwe, Great Zimbabwe and Things Fall Apart – both
increasing their risk of contracting waterborne diseases of which have a time horizon of 2040. The scenarios help
Figure 13: Improved water access rate
100
95
90
85
80
% of population
75
70
65
60
55
50
45
40
2000 2005 2010 2015 2020 2025 2030 2035 2040
Zimbabwe Low-income Africa Other lower-middle- Other Southern Upper-middle-
income Africa Africa income Africa
Source: Data from UNICEF/WHO Joint Monitoring Programme; forecast from IFs v 7.36
20 GREAT ZIMBABWE: ALTERNATIVE PROSPECTS TO 2040to frame the uncertainty around how Zimbabwe may yields based on the literature establishing the relationship
develop over the next two decades. between greater land tenure security and agricultural
productivity and sustainable development more broadly.75
The large gap between Great Zimbabwe and Things
Fall Apart indicates the choices that the country now In the second, the GoZ increases the total area of land
confronts. Down one road are opportunities for improved equipped for irrigation from an estimated 175 000
human development; down the other, a path more hectares in 2018 to 340 900 hectares by 2040,76 which
reminiscent of the country’s recent history. is within the Food and Agriculture Organization’s estimate
of how much land available internal renewable water
Great Zimbabwe
resources could irrigate (365 624).77
Great Zimbabwe is a future in which the GoZ sets
Consequently, agricultural yields nearly return to the
the country on a higher growth path by making the
average of the early 1980s of 3.5 metric tons per
agricultural sector more efficient by stepping away
hectare by 2040, marking a growth of roughly 80%
from its state-centric, command and control approach
between 2019 and 2040.78 This places Zimbabwe’s
to governance. As a result, Zimbabwe experiences a
yields on par with low-income African economies by
reversal of the downward development trends that have
2035, but still far below the average for the rest of lower-
characterised the past few decades.
middle-income Africa.
A first, basic assumption of this scenario is that the
Great Zimbabwe also models gradual improvements
GoZ resolves the financial crisis, granting the minimal
in government effectiveness, regulatory quality and
macroeconomic and political stability necessary to
economic freedom, and a reduction in corruption
implement the changes that the scenario envisions.
and the risk of instability associated with government
This scenario includes two agricultural components. The performance.79 These dimensions have strong
first is that the GoZ makes property rights transferable. It relationships across other modules within IFs, especially
is assumed that this will significantly improve agricultural to economics and infrastructure (Box 4).80
Box 4: Governance measures in Great Zimbabwe
IFs draws the measures of government effectiveness to which their policies and institutions support
and regulatory quality from the World Bank’s economic freedom, a concept based on ‘personal
Worldwide Governance Indicators project. Government choice, voluntary exchange, open markets, and
effectiveness ‘captures perceptions of the quality of clearly defined and enforced property rights’. In IFs,
public services, the quality of the civil service and the greater economic freedom improves social capital’s
degree of its independence from political pressures, contribution to multifactor productivity, and thus
the quality of policy formulation and implementation, boosts economic growth more broadly.
and the credibility of the government’s commitment to
such policies’. Regulatory quality reflects perceptions The IFs measure of corruption is taken from
of the government’s ability to create and implement Transparency International, which ranks countries
policies and regulations that promote the development based on perceptions of public sector corruption.
of the private sector. Greater government effectiveness Researchers at the Pardee Center created an index
and regulatory quality link forward to improved of the risk of instability associated with government
information and communication technology and performance that directly affects the government’s
enhanced social capital. ability to preserve security in their territory. This
The economic freedom index is from the Fraser dimension of governance affects social capital as a
Institute. It ranks countries based on the extent subcomponent of multifactor productivity.
SOUTHERN AFRICA REPORT 23 | AUGUST 2019 21Improved accountability and service delivery is an of Zimbabwe’s currency leads to a faster reduction
important component of Great Zimbabwe. In the of the country’s extraordinarily large informal sector
country’s recent history, economic mismanagement and than is currently expected. In Great Zimbabwe, the
recurrent human rights violations have severely undercut informal sector shrinks at roughly twice the rate than
its significant development potential. In this context, the is projected on the Current Path between 2020 and
state-sponsored extrajudicial killings of civilians in the 2040. But despite this improvement, the informal
Matabeleland and Midlands regions between 1982 and sector remains significantly larger than the average
1987, the Gukurahundi massacres, loom large.81 in other low-middle-income countries in Africa on
both measures.
Nonetheless, a recent Afrobarometer survey revealed
that Zimbabweans are still enthusiastic about democracy, The kinds of development Zimbabwe would see
even while acknowledging that it does not truly exist given these conditions are dramatic and span
for them.82 Voting remains very popular, with 75% across sectors.
believing that it can improve lives, according to the poll. The increased irrigation and improved yields modelled
Some misgivings notwithstanding, 83% of respondents in the Great Zimbabwe scenario increase Zimbabwe’s
prefer to choose leaders through ‘regular, open, and total crop production to 10 million metric tons by 2030
honest elections’. However, in the same poll, 51% of – more than 50% above the projection on the Current
respondents feared becoming a victim of political violence Path for that year. By 2040, Great Zimbabwe sees total
related to the election and only 44% expected the crop production reach 12 million metric tons – nearly
election to be completely free and fair.83 double the projected amount on the Current Path.
The Great Zimbabwe scenario also envisions that This increase reduces Zimbabwe’s dependence on
improved governance coupled with the stabilisation crop imports significantly. On the Current Path, crop
Figure 14: Agricultural yields per hectare
6
5.5
5
4.5
4
Metric tons per hectare
3.5
3
2.5
2
1.5
1
0.5
0
1980 1985 1990 1995 2000 2005 2010 2015 2020 2025 2030 2035 2040
Zimbabwe Zimbabwe Low-income Other lower-middle- Upper-middle-
(Current Path) (Great Zimbabwe) Africa income Africa income Africa
Source: Data from FAO; forecast from IFs v 7.36
22 GREAT ZIMBABWE: ALTERNATIVE PROSPECTS TO 2040You can also read