SBI Cards & Payment Services - Prabhudas Lilladher
←
→
Page content transcription
If your browser does not render page correctly, please read the page content below

Company Initiation

                 SBI Cards
                 & Payment
                  Services
    Play on cashless consumption

                               Shweta Daptardar
           shwetadaptardar@plindia.com | +91-22-6632 2235

Prabhudas Lilladher Pvt. Ltd. and/or its associates (the 'Firm') does and/or seeks to do
business with companies covered in its research reports. As a result investors should be
aware that the Firm may have a conflict of interest that could affect the objectivity of the
report. Investors should consider this report as only a single factor in making their investment
decision.
Please refer to important disclosures and disclaimers at the end of the report.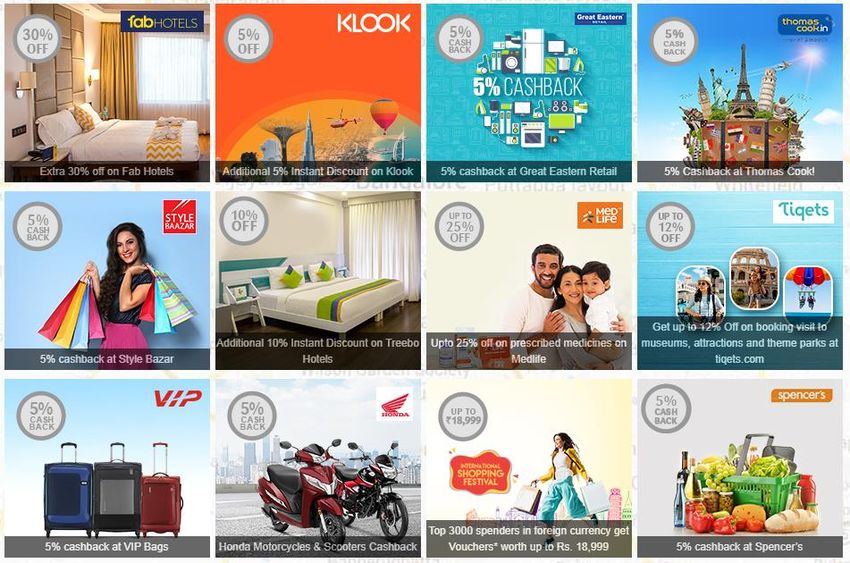
Contents
                                                                              Page No.                                                                                   Page No.
IPO Details - Subscribe                                                              3   Incentivizing spends through reward points                                            35
Play on cashless consumption, RECOMMEND BUY, TP: Rs1,191                             4   (D) Incentivizing spends through co-branded card offerings                            36
                                                                                         (E) Investing in physical/digital technology and data analytics                       37
Macro & Industry                                                                         (F) Tapping high potential self-employed customer base                                38
India’s robust consumption story remains intact                                     6    Robust risk management practices ensure superior control                              39
Promising consumption story to create Rs52tn retail credit market by FY24           7
Discretionary spends + digital payments = ~Rs9000bn e-commerce market               8    Financial Analysis
Credit cards emerging as the most preferred payment solution                        9    SBI cards customer base to double over FY19-22                                       41
Cards-in-force to grow at 22%CAGR over FY20-FY24                                   10    Card loan receivables to grow at 27% CAGR to Rs408bn over FY20-22E                   42
Credit card Infra to drive higher volumes/spends and receivables                   11    Robust fee income – a key catalyst to revenue growth                                 43
Spends growth concurring with CIF growth = Rs3000bn credit card loan mkt           12    High yield loan income to sustain NII traction                                       44
HDFC bank & SBI Cards have 45% market share in outstanding cards                   13    Robust fees & Interest income to enable 27% revenue CAGR over FY20-22                45
Credit Card Transaction Process – A Snapshot                                       14    Higher yields & steady funding costs to enable 14% NIMs over FY20-22                 46
High value cards are gaining popularity                                            15    23% Opex CAGR led by higher acquisition & reward redemption costs                    47
Reward cards encourage higher spends and revenues                                  16    Operating leverage to reduce cost-income by 446bps                                   48
Co-branded cards – a win-win for all                                               17    GNPA have softened from high levels of FY2018                                        49
Case Study: Co-branded cards provide attractive offerings                          18    Manageable client concentration and controlled inter- bucket movement                50
Credit Cards have dual income streams                                              19    GNPAs to stay range-bound, credit costs expected to stay elevated                    51
Credit Card is an opex intensive model                                             20    RoA and ROE estimated at 6% and 28% by FY22                                          52
Credit Card business is prone to higher delinquencies                              21    DuPont Analysis - SBI Cards v/s industry and global peers                            53
                                                                                         High growth and scarcity justifies premium valuations                                54
                                                                                         Peer valuation metrics                                                               55
Company Section                                                                          Risks & Concerns                                                                     56
Company Background                                                                 23
SBI Credit Card Transaction Model - Snapshot                                       24    Financials
SBI Cards – Michael Porter’s Five Forces Model                                     25    Key Card Metrics                                                                     58
SBI Cards v/s key industry players                                                 26    Income Statement & Balance Sheet                                                     59
SBI parentage is biggest advantage for SBI cards                                   27    Key Ratios                                                                           60
SBI cards has ample scope to expand cardholder base                                28
Robust acquisition and customer retention enable niche positioning                 29    Annexures                                                                          62-68
(A) Expansion into non-metros led by non- bank channels                            30
(C) Capitalizing on parent’s physical network                                      31
Capitalizing on parent’s digital network                                           32
(D) Incentivizing spends through partnerships and high value card offerings        33
Incentivizing spends through exclusive offerings                                   34

  2                                                                                                                                                              February 28, 2020
IPO Details - Subscribe
Issue Summary
Fresh Issue Rs5000mn
Offer for sale 130,526,798 Equity Shares
Issue period 2nd Mar'20 - 5th Mar'20
Issue size: Rs 102.76bn – 103.41bn
No. of shares: 137,193,464 – 137,149,314
Face value: Rs 10
Price band : Rs 750-755
SBI Credit Card IPO comprise of Rs5000mn fresh issue and offer for sale
Shareholding of 13 crore shares leading to promoter dilution of 14.6%.
Particulars Pre-Issue Post-issue
Funds raised by the company would be utilised for capital augmentation.
Promoters & Pro. Group 74.00% 69.51%
At upper price band of Rs755, Market Capitalisation is pegged at
CA Rover Holdings 26.00% 15.89%
Rs709mn.
Public - IPO Subscribers - 14.60%
Offer Structure
Particulars Lower band Upper band
Price 750 755
Existing O/s shares (mn) 932.33 932.33
Fresh issue (mn) 6.67 6.62
Post issue shares (mn) 939.00 938.96
Post issue market cap (Rs bn) 704.25 708.91
3 February 28, 2020
Play on cashless consumption, RECOMMEND BUY, TP: Rs1,191
We initiate coverage on SBI Cards and Payment Services Ltd with a BUY recommendation and target price of Rs1,191. We believe that SBI cards is a
formidable play on rising discretionary spends and non cash economy given a) broad reach and parentage of SBI b) under-utilized captive banca
potential c) leadership in co-branded cards and d) 40% contribution of premium cards. We estimate 23% CAGR in total cards-in-force which will enable
27% CAGR in in loan receivables and revenues. Strong risk management and data analytics capabilities will enable a steady 14% NIMs, 2.5-2.6% GNPAs
and ROA/ROE of 6% and 28% despite credit costs of 0.4% given high risk unsecured lending model.
At higher end of IPO price band of Rs 755, SBI Cards is being valued at a PE of 29x FY22 annualized EPS. We note that SBI cards is being offered at
significant premium to global peers which are trading at 9x-13x FY22 EPS. We expect premium valuations to sustain given unique business model of
standalone cards business, 35% EPS CAGR and attractive return ratios. We value the stock at 45.5xFY22 EPS of Rs26 and arrive at a target price of
Rs1,191. Risks of cap on MDR and rising competition in highly profitable credit cards business are a risk to our call.
Premium valuations; high risk-high reward play: Our valuations for SBI Cards translates into PEG of 1.2 which stands lower to one of the biggest global
card players; viz, American Express (58mn cards-in-force, market cap: USD98bn) with PEG of 1.3,
SBI cards emerging as a niche player in crowded credit cards market: With GoI’s vision of cash-less society, digitalization, developments in e-commerce &
growth in POS infrastructure, credit card industry stands poised to grow at 23% CAGR. SBI cards has created a strong niche to gain from this transition with
leadership in co-branded cards with 18 offerings and higher than industry presence in premium cards at 40%. 18% market share (total cards-in-force) in credit
cards and just 3% penetration of credit cards in parents debit cardholder base will enable doubling of cardholder base to 16mn by FY22 from 8m in FY19.
Robust customer acquisition capabilities to enable 27% revenue CAGR over FY20-22: Capitalizing on the trusted parent brand, SBI Cards stands poised
to clock healthy 27% loan receivables CAGR led by: (a)expansion of open market customer acquisition channels (52% in Q3FY20 v/s 44% in FY19) and
increasing merchant ties (18) b) tapping under-penetrated non-metro markets (58% of new acquisitions) c)strengthening marketing and high value card
propositions with reward programs, merchant discounts and innovative offers and d) steady spends per card translating into 26% spends CAGR over FY20-22
Strong technology/analytics focus to enable higher volumes and efficiencies: Continuous evolution of technological/data analytics capabilities will
increase credit card numbers and transaction volumes which will drive operating leverage and reduce cost income ratio by 446bps over FY20-22.
Robust risk management processes to control delinquencies; although credit costs to stay elevated: Despite banking on vast cardholder database,
credit bureau data analysis and generation of tailor-made underwriting scorecards, SBI cards has NPAs at 2.5-2.6% (Industry ~1% as at Q3FY19), which will
keep credit cost at an elevated level of 0.4%. Rising presence in tier2/3 cities, self employed customer base and competition are a key risk, in our view.
4 February 28, 2020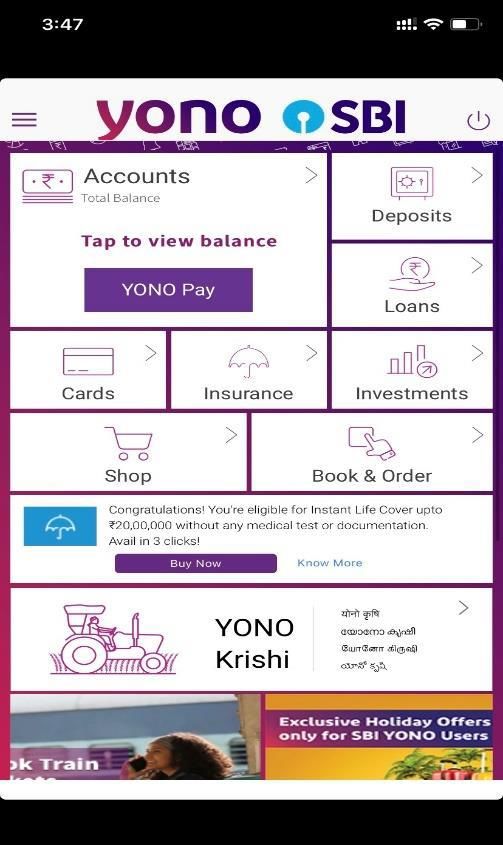
Macro & Industry

5                      February 28, 2020
India’s robust consumption story remains intact
Rising per capita GDP, aspiring households, rapid urbanization have spurred PFCE have increased discretionary spends and India’s robust consumption story
Per capita GDP growth has stood at steady 10% past 4 years Rising millennial populace to boost consumption (age-group in years)
GDP per capita at current prices (units '000s) YoY Gr. (RHS) 0-14 Years 15-29 Years 30-59 Years 60+ Years
150 143 13.0% 100%
6.9 7.8 9.5
12.4% 130 80%
130 30.8 33.7 37
11.5% 118 11.0%
60%
107
110 10.4% 27.5
98 27.6
9.8% 9.9% 40% 26
90 9.6% 9.0%
90 9.1%
81 20% 34.7 30.9 27.5
72
70 7.0% 0%
FY12 FY13 FY14 FY15 FY16 FY17 FY18 FY19 2000 2010 2020E
35% of Indian populace resides in urban driving high value spends Resultantly, discretionary spends (luxury & entertainment) continue to rise
40 Urban Population as % of Total Population Non-Discretionary Spending Discretionary Spending
35
35 100%
31
90%
30 28 80%
26 47% 48% 51% 51% 53%
70%
25 23
60%
20
18 50%
20 17 40%
14 30%
15 12 53% 52% 49% 49% 47%
11 11 20%
10
10 10%
1901
1921
1941
1951
1971
1981
2001
2021
1911
1931
1961
1991
2011
0%
2013-14 2014-15 2015-16 2016-17 2017-18
6 Source: MOSPI, RBI, Company, PL February 28, 2020
Promising consumption story to create Rs52tn retail credit market by FY24
High urban consumption & spends expected to drive 18% retail CAGR                       Unsecured credit, in turn, also gets a boost, expect 22%CAGR next 4 years

   60.0                     Systemic Retail Credit (Rs trn)                                                              Unsecured Loans (Rs trn)
                                                                                           16
   50.0
                                                                                           14
                                                                                           12
   40.0
                                                                                           10
                                                                                            8
   30.0                                                                                     6
                                                                                            4

                                                                                                         1.9
                                                                                                 1.5
                            16.2

                                                                                                                                                                14.4
   20.0
                    13.9

                                                                                                                 2.4

                                                                                                                          3.1

                                                                                                                                          5.3
                                                                                                                                  4.2
                                                                                            2
            11.7

                                            22.2

                                                           31.1

                                                                          43.7
                                    19.1

                                                    26.4

                                                                   36.9

                                                                                 51.8
                                                                                            0

                                                                                                         FY15E

                                                                                                                 FY16E

                                                                                                                          FY17E

                                                                                                                                  FY18E
                                                                                                 FY14E

                                                                                                                                          FY19E

                                                                                                                                                                FY24E
   10.0
          FY15     FY16    FY17    FY18    FY19    FY20E FY21E FY22E FY23E FY24E

Source: Company, PL. Note: Retail credit represents bank retail credit                  Source: Company, PL. Note: Unsecured Loans include banks , NBFCs

   7                                                                                                                                                   February 28, 2020
Discretionary spends + digital payments = ~Rs9000bn e-commerce market
Higher consumer spends, GoI moves to catalyze India’s payment market to drive e-commerce transactions and usage of credit cards
Non-cash transactions per capita per annum stands lowest for India With high potential, digital Payment to expand 2.5x over FY19-24E
800 728 Digital Payment Market (Rs trn)
700 4500 4055
4000
600
3500
500 3000
(units)
355 2500
400
Huge Potential to Tap 2000 1630
1370
300 1500 1122
785 823 920
1000
200 142
500
100 70
26 32 0
11
FY14E
FY15E
FY16E
FY18E
FY24E
FY17E
FY19E
0
India China Mexico South Africa Brazil UK Singapore
E-commerce industry to grow at 25%CAGR to expand to Rs 9000bn Credit cards, mobile banking fueling overall e-commerce transactions (%)
9025
Indian E Commerce Industry (Rs trn) RTGS Cheque/Paper Clearing
9000
ECS/NEFT/NACH/IMPS Credit Cards (excl ATM Transaction)
8000 Debit Cards (excl ATM Transaction) Prepaid Payment Instrument
7000 ATM Transactions
6000 100
80 39 36 35 38 38 35 34 34 34 33 31
5000 52 51
60 11 16 16 13 16 15 15 16 16 16
4000 14
2905 5 6 16 15 14 14 14 14 16 16 15 15 16
40 9 9
3000 2275 5 5 6 5 6 6 6 6 6 6 6 6 6
1742 20 22 22 22 21 23 23 23 24 24 24 24 26 27
2000 1471
1037 0 6 6 6 6 5 5 5 5 4 4 4 4 3
713
1000
Q1FY17
Q3FY17
Q4FY17
Q2FY18
Q3FY18
Q1FY19
Q2FY19
Q3FY19
Q4FY19
Q2FY17
Q1FY18
Q4FY18
Q1FY20
0
FY14E FY15E FY16E FY17E FY18E FY19E FY24E
8 Source: RBI, Company, PL February 28, 2020
Credit cards emerging as the most preferred payment solution
With GoI’s vision of cash-less society, digitalization, developments in e-commerce & growth in POS infrastructure, there lies higher potential for credit
cardholders base to grow. With debit cards and UPI being largely limited to banking transactions, credit cards, besides, playing major role in facilitating credit,
per se are a facilitator towards payments to E-wallets, etc. Higher value propositions and 50-day free credit period places Credit cards as a favoured
payment infrastructure.
Credit Card E-Wallets UPI PPIs Debit Card
Credit card provides a line E-wallets is a service that PPIs are tied directly to
UPI is an instant real time Debit cards are tied directly
of credit that an individual allows users to make value stored on such
Description payment system facilitating to individual's bank
can access through the payments for transactions instruments paid by the
inter bank transactions. account
card. made online holder.
Minimum KYC requirement Minimum KYC requirement
up to Rs 10,000; Full KYC up to Rs 10,000; Full KYC
KYC Requirement Full KYC required Full KYC required Full KYC required
required for above Rs required for above Rs
10,000 10,000
No need to load any
Amount gets deducted from No need to load any amount as Load instruments with
Load wallets with amount amount as the transaction
Limit the limit provided to the the transaction directly goes amount user is willing to
user is willing to spend directly goes through the
card holder through the bank balance spend
bank balance
Payments for online Payments for online Payments for online
transactions, cash Payments for online Payments for online transactions, cash transactions, cash
Usage
withdrawal at ATMs, POS transactions transactions withdrawal at ATMs, POS withdrawal at ATMs, POS
terminals terminals terminals
Avg. Transaction amt. ~ Rs.3400 ~Rs 450 ~Rs. 1700 ~Rs.630 ~Rs.1300
Credit facility provided with Credit through EMI facility Credit through EMI facility
Credit interest free period.(Up to provided in some cases but No credit facility No credit facility provided in some cases but
50 days) has no interest free period has no interest free period
Discounts/ cashback &
Discounts/ cashback on Discounts/ cashback on Discounts/ cashback on Discounts/ cashback on
Rewards reward points on amount
transactions made. transactions made. transactions made. amount spent through card
spent.
Money is not blocked but is Money is blocked instantly. Money is blocked instantly. Money is blocked instantly. Money is blocked instantly.
Transaction dispute
instantly deducted from Deducted from customer Deducted from customer Deducted from customer Deducted from customer
management
customer credit limit. account account account account
9 February 28, 2020Cards-in-force to grow at 22%CAGR over FY20-FY24
Credit card penetration stands lower as compared to other financial products in India. Credit card industry in India has grown at a healthy 22%CAGR over FY15-
FY19 with outstanding credit cards at ~53mn at H1FY20. Credit to debit ratio is mere 6% for the system. Such an under-penetrated market offers huge potential.
India stands lowest in terms of credit card penetration Only 3 per 100 populace hold credit cards in India
350 320 4.0%
300 265 3.4%
3.5%
250 214
193
(nos)
200 3.0%
156 2.7%
150
94 88
100 73 2.5% 2.2%
42 29
50 7 7 1.8%
3 2.0%
0 1.6%
1.5%
1.5%
1.0%
FY14 FY15 FY16 FY17 FY18 FY19
Cardholder base, therefore, to more than double over FY20-24 Credit card and unsecured loans to outgrow overall systemic & retail credit
No. of Credit cards O/S (Units Mn) Credit Growth YoY %
140 130 Retail Unsecured Credit Card Non-food
120 108 40% 13%
12% 12%
100 89 35%
11%
80 73 30% 28% 30% 10%
27% 29% 10%
59 26%
60 25% 9%
47 9% 8%
22%
37 20% 8%
40 20% 23%
30
25 16% 7%
21 16% 16% 18%
20 15% 6%
FY15 FY16 FY17 FY18 FY19 FY20E FY21E FY22E FY23E FY24E FY15 FY16 FY17 FY18 FY19 FY20E FY21E
10 Source: Company, PL February 28, 2020Credit card Infra to drive higher volumes/spends and receivables
Scalable technological systems, data analytics capabilities, deepening presence beyond Tier II markets, multi-channel customer acquisition, cross selling to
existing customers have enables the card spends to grow at 34% CAGR during FY15-FY19. We envisage 20% spends CAGR for the industry in turn driving
credit card loans to expand 3x over FY19-24
POS terminals are growing at healthy 28%CAGR Banca accounts for70% of the customer acquisition channel
POS (units mn) Growth Rate (RHS) FY19
5.0 89% 100%
Open Market
4.5 90% 30%
4.0 80%
3.5 70%
3.0 60%
2.5 50%
2.0 40%
23% 21%
1.5 18% 30%
1.0 7% 20%
0.5 1.1 1.4 2.6 3.1 3.7 3.3 4.3 10%
0.0 0%
FY16
FY18
FY19
FY15
FY17
4MFY19
4MFY20
Banca
70%
Credit card transactions, therefore, poised to increase at 18%CAGR Credit card loan receivables, in turn, have potential to increase 3x (FY19-24)
Number of (Credit Card) Transaction 3500
4500 3000
4000
2500
3500
3000
(Rs bn)
2000
(units mn)
2500
1500
2000
1500 1000
552
619
1000
423
1413
1772
2791
3321
4278
1094
2233
3819
500
1827
2192
2587
1198
1498
3053
797
500
708
922
0 0
FY15 FY16 FY17 FY18 FY19 FY20E FY21E FY22E FY23E FY24E FY15 FY16 FY17 FY18 FY19 FY20E FY21E FY22E FY23E FY24E
11 Source: Company, PL February 28, 2020Spends growth concurring with CIF growth = Rs3000bn credit card loan mkt
We summarize briefly the credit card business dynamics encompassing value drivers and expectations over next 4 years
FY15- FY20-
Market size FY15 FY17 FY19 FY24 FY19 FY24 Comments
CAGR CAGR
Rising GDP at 7% CAGR & increasing per capita income coupled with
GDP (Rs tn) 105 123 141 199 7.6% 7.3%
aspirant households to spur domestic consumption
Growth YoY % 7.4% 8.2% 6.8%
Credit card spending relative to PFCE has doubled in 4 years, going ahead,
Per capita credit card spend % of per capita
2.5% 3.6% 5.4% 7.6% with card spends rising at higher pace, card spend as % of per capital PFCE
PFCE
to climb to 7.6% by FY24
Rising issuance of cards in smaller cities, increasing organized retail
Cards in Force (CIF) (Units Mn) 21 30 47 130 22.3% 22.0% penetration and growth in payments infrastructure to drive 20%CAGR in
credit cards outstanding over FY20-24E
Growth YoY % 20.0% 27.0% 20.0%
Credit card spends grew at 32%CAGR from FY15-19 to Rs6tn led by post
demo initiative. GoI push on cash-less society, focus on digitalization,
Credit Card spends (Rs mn) 1900000 3300000 6100000 18012002 33.9% 23.2% developments in e-commerce, credit-card promotional-offers and EMI
financing options are expected to propel card spends to Rs18tn by FY24,
which is 3x increase over FY19
Growth YoY % 32.0% 32.6% 21.0% By FY24 spends growth should concur with outstanding cards growth
Increasing acceptance of digital payments by Indian consumers and the rise
Spend per card (Rs mn) 90476 110000 129787 138430 9.4% 1.0% of e-commerce businesses have led to 9%CAGR in spend per card between
FY15-19, we estimate moderate 1-2% annual growth rate over FY20-24
Growth YoY % 10.0% 4.4% 0.8%
Rapid digitization & easier availability of free credit has led to 30%CAGR in
transaction numbers over FY15-19. We expect slightly slower 18% CAGR
No. of Credit Card transactions (Units mn) 619 1094 1772 4278 30.1% 17.7%
over FY20-24 led by competition and unpredictability to customer spend
patterns (switches to other modes contingent upon offers/discounts)
Growth YoY % 37.3% 25.4% 12.0%
Severely under-penetrated market, increased retail and unsecured credit
have increased credit card loans at 30%CAGR during FY15-19. We expect
Credit Card receivables (Rs bn) 423 708 1198 3053 29.7% 19.5%
credit card loans to clock 20%CAGR over FY20-24 aided by continued
spends, growing POS terminals and diversified offerings
12 Source: MOSPI, RBI, Company, PL February 28, 2020HDFC bank & SBI Cards have 45% market share in outstanding cards
Amongst 74 players offering credit cards in India, 4 players account for ~72% of cards-in-force and 66% of overall spends’ market share largely
driven by cross-selling to existing liability customers.
SBIC ranks no. 2 to HDFC Bank in terms of card-in-force, incremental card additions, transactions no. & total spends
Amongst the key card players in the industry, Axis Bank followed by SBI Cards have witnessed robust traction over past 5 years in volumes and
spends. In the past seven years, Axis and SBI Cards have witnessed rapid increase in market share to 10.6% and 17.8% respectively from 2.4% and 7.9% in
FY12.
SBI Cards and BoB Cards are the only card players in the industry with sole focus on credit card business that helps them to offer customized products to
customers while enabling them to innovate and integrate various processes in the value chain
International players such as American Express, Citi Bank and Standard Chartered Bank, have lost market share in credit card spends over the years
Cards-in-force for some of the key US based players are Chase (93mn), American express (58mn), Discover (Rs57mn), Capital One (45mn)
SBI Card ranks 2nd best w.r.t. cards-in-force, transactions no. and spends
Market share % (FY19) Cards in Force O/s transactions Total spends POS terminals
HDFC bank 27% 27% 28% 13%
SBI Card 18% 16% 17% -
ICICI Bank 14% 14% 11% 11%
Axis Bank 13% 9% 10% 14%
RBL 4% 3% 3% 19%
Citi Bank 6% 13% 9% 1%
American Express 3% 4% 9% 1%
Source: RBI, Company, PL
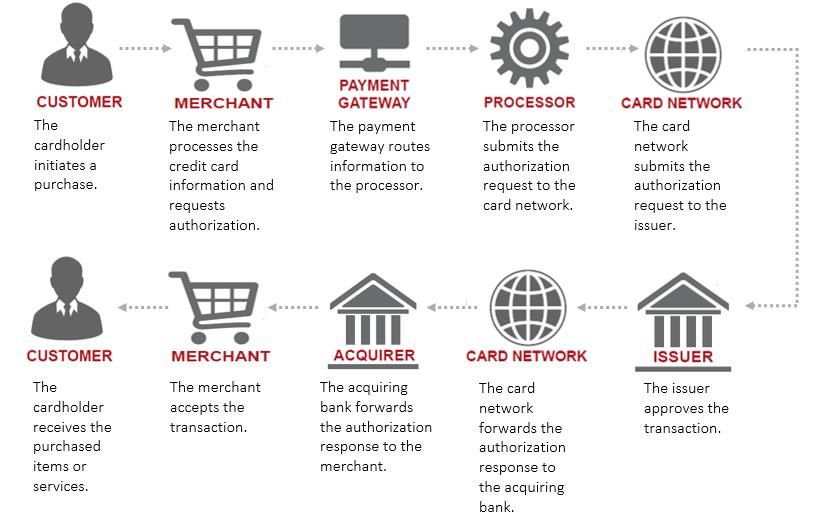
13 February 28, 2020Credit Card Transaction Process – A Snapshot
ENTITITIES INVOLVED IN THE TRANSACTION: A typical credit card transaction process
Merchant location: Entity selling goods and services
Acquiring Bank: The bank which with POS terminal at the merchant
location
Card network: RuPay/Visa /MasterCard, etc.(transaction routing/settling
agency)
Customer / Consumer: Cardholder
Issuing Bank: The bank which has issued the card to the customer
TYPES OF TRANSACTIONS:
ON-US Transaction: issuing bank and the acquiring bank are the same
entity
OFF-US Transaction: issuing bank and acquiring bank are different
entities
Source: Industry, PL
TRANSACTION PROCESS: The issuing bank authenticates the card / cardholder details; based on
successful authentication and after checking availability of balance (for
A consumer purchases some goods / services and uses a debit / credit
debit card) or credit limit (for credit card) authorizes the amount and issues
card to pay the merchant.
an authorization code or declines the transaction.
The merchant (terminal) sends the encrypted transaction data to the
The acquiring bank notifies the merchant that the transaction either has
acquiring bank system / switch for authorization.
been authorized or declined; the merchant then completes the transaction
The acquiring bank sends the transaction data to the consumer’s (card (if successful, then print receipt and hand over the goods, etc.)
issuing) bank over the card payment network
14 February 28, 2020High value cards are gaining popularity
Players with increased focus on credit card business offer customized products that are continuously adapted to the evolving needs of cardholders and
changing industry dynamics. Technology, data analytics, partnerships, acceptance infrastructure have enabled them to innovate and integrate various
processes in the value chain. PL View: Channel checks suggest issuing companies to come up with innovative corporate offerings ahead, share here to rise
Credit card product dynamics –Personal Cards form 85-90% of the overall credit card offerings
Type of Cards Personal Corporate
% of Total cards-in-force 85-90% 10-15% Typical Credit Card offerings by issuers
Cards Spends as a % of Total Spends 85-90% 10-15%
come in 5 types:
Bureau Profile Super-Prime; Prime-Plus; Prime Individuals Prime, Super Prime Corporates Personal credit cards
Bureau Score 650-750 >700
Internal customers/Open market/Co-brand Direct tie-ups with corporates or private
Corporate Credit cards
Customer Acquisition Channel
partnerships companies
Personal Premium Cards
Acquisition cost Rs.800-Rs.2000 Rs.500-Rs.1000 (borne by the corporate)
Value Propositions Cashbacks/Discounts/select facilities select facilities-Travel, hotel & other utilities Personal – Reward points cards
Credit limit Rs 70,000 (~2x of salary) Varies from corporate to corporate
Co-branded cards
Annual fee Rs.499-Rs.4999 Rs.0-Rs.499
Delinquency 0.85% 0.80%
Source: Media, channel checks, PL
Premium Card dynamics – focusing on affluent /super-prime customers
HDFC
IndusInd Premium Cards:
Particulars SBI Card Bank ICICI Bank Axis Bank RBL Bank
Bank Cards with joining fee > Rs.1500
Total number of cards offered 46 20 33 21 30 23 Premium credit cards stand at 15% of total credit card offerings in the
industry
% of premium cards offered 40% 20% 45% 25% 25% 70%
Value Proposition: Premium credit cards come with benefits/offers from
Premium cards offered 18 4 15 5 8 16 airline, hotel credits, VIP Lounge access, premium gifts, concierge
services, and lifestyle/entertainment/shopping benefits.
Range of fees for paid cards 500-5,000 500-10,000 200-10,000 250-10,000 500-5,000 250-25,000
Source: Company, PL
15 February 28, 2020Reward cards encourage higher spends and revenues
Reward cards encourage higher spends and in turn carry higher income
potential for credit card issuers
For every credit card transaction, the card company earns an
'interchange' fee from the merchant outlet that can vary from 1% to 2.5%.
The outlet can negotiate a lower fee if its volumes are high.
Reward points dynamics:
Reward cards: Broadly, only 35-40% of rewards points are being used.
Entry-level cards are usually issued at a minimal fee while premium cards
have high joining and annual fees. The number of points earned on each
transaction depends upon the amount involved, the type of card used and
at times on where the transaction is done.
PL View: Sizeable the interchange fees, higher the rewards to
cardholders. Card issuers with higher reward card offerings have an
edge as part of earnings from interchange fee is distributed in the
form of reward points in turn encouraging customer for increased
usage which drive higher spends for the credit card issuer.
Reward points economics
Card Type Reward points earned
Entry-level cards (Silver, Gold) 1 reward point per Rs. 100-150 spent
Premium (Signature, Platinum cards) 2 reward points per Rs. 100-150 spent
Co-branded cards (fuel, air miles etc.) Up to 5 reward points per Rs. 100-150 spent
Corporate cards 1-2 reward points on domestic/international spending
Source: Media, PL
16 February 28, 2020Co-branded cards – a win-win for all
Co-branded Cards dynamics: Glimpse of Co-branded partnership between SBI Cards and Air India
A card that is offered by two organizations, one a lending institution, the A typical SBI Card Co-branded (Air India) Model
other a non-financial group.
Issuer SBI Credit Card
Cardholders are offered tailored cross-sell products at the time of Partner AirIndia
application through card sales distribution and later on through outbound
and inbound tele-calling and digital modes like website and mobile
application. Benefits of Co-Brand partnerships
Merchants: Airlines, hotels, retail chains and non-financial groups with Customer Stickiness
loyalty points are known to offer co-branded cards.
Increase in Spends
Benefits to customer: i) Special offers (eg: in the case of an airline, Issuer Focused Customer Base
earning frequent-flyer miles they can redeem when traveling), ii) discounts
Customer growth
(discounts on merchandise), iii) loyalty points (these can be used for
additional purchases). Higher Activation compared to Normal Card
Benefits to issuer: built-in audience and a major sales channel. Increase in Top Line
Benefits to retail partners: i)Bonus from card issuer ii) Commission to Partner Brand Visibility
sales personnel for each new customer iii) Earnings in the form % of EMI Customer Loyalty
conversion and late fee charges to customer.
PL, View: Higher the offerings, higher the spends, higher the revenue
Cost and Revenue Sharing
traction. Moreover, a co-branded card offering is a win-win deal wherein
all the parties; viz, card issuing company (merchant discount/interchange Annual fee Generally, Partner gets a share of Annual Fee from
fees), merchant partner (sales promotion exercise) and the customer Issuer
(offers/discounts) stand to gain. Costs (Marketing) Shared Between Both the parties
Discount / Voucher Borne by the Issuer
Source: Company, PL
17 February 28, 2020Case Study: Co-branded cards provide attractive offerings
Co-branded ties with retail merchants allow card issuing companies to indulge into attractive offerings (zero cost EMI facility, cashbacks) augmenting unique
customer base and revenue stream. The adjoining illustration is a perfect exemplar of a co-branded partnership of Card companies with Croma for consumer
durable products during festive season. SBI Cards alongside private and global players actively & timely participate into co-branded offerings
Standard
HDFC Bank ICICI Bank Axis Bank Citibank SBI Credit American
Sr. No Category Brand Chartered Offers
Credit Card Credit Card Credit Card Credit Card Card Express
Credit Card
10% Cashback subject to maximum of Rs.3000 will be posted to your card account in 90
1 Appliances BLUE Star Acs 12 Months 12 Months 12 Months 12 Months 12 Months 12 Months 12 Months
days. Only one transaction per card per month is allowed during the offer period.
HITACHI Acs & Refs
2 Appliances 12 Months 12 Months 12 Months 12 Months 12 Months 12 Months 12 Months 10% and 5% cashback. It will be posted in customer account within 90 days
(Selected Model)
5% Cashback subject to maximum of Rs.3000 per card per transaction per month.
3 Appliances Voltas Acs 12 Months 12 Months 12 Months 12 Months 12 Months 12 Months 12 Months
Cashback will be posted within period of 90 days. TnC apply
4 Appliances Godrej 9 Months 9 Months 9 Months 9 Months 9 Months 9 Months 9 Months NA
5 Appliances Daikin 9 Months 9 Months 9 Months 9 Months 9 Months 9 Months 9 Months NA
10% with max cashback of Rs. 2000 on your card account for entire scheme period. The
6 Appliances Siemens 12 Months 12 Months 12 Months 12 Months 12 Months 12 Months 12 Months
cashback will be credited in 90 days
10% with max cashback of Rs. 2000 on your card account for entire scheme period. The
7 Appliances Bosch 12 Months 12 Months 12 Months 12 Months 12 Months 12 Months 12 Months
cashback will be credited in 90 days
8 Appliances IFB 9 Months 9 Months 9 Months 9 Months 9 Months 9 Months 9 Months NA
5% with max cashback of Rs. 2500 on your card account for entire scheme period. The
9 Appliances Panasonic 12 Months 12 Months 12 Months 12 Months 12 Months 12 Months 12 Months
cashback will be credited in 90 days from offer end date
10 Smartphones NOKIA 12 Months 12 Months 12 Months 12 Months 12 Months 12 Months 12 Months No EMI only Cashback
11 Smartphones OPPO Mobile 12 Months 12 Months 12 Months 12 Months 12 Months 12 Months 12 Months 5% additional cashback. The cashback will be credited within 90 days
1. INR 750. It will be posted in your account within 90 days. TnC apply
2. INR 1000. It will be posted in your account within 90 days. TnC apply
12 Smartphones Xiaomi 12 Months 12 Months 12 Months 12 Months 12 Months 12 Months 12 Months
3. INR 4000 on EMI Transactions youu are eligible for one Cashback during the scheme
period. Cash back will be posted within 90 days. TnC apply
5% with max cashback of Rs. 3000 per transaction. It will be posted in your account in 90
13 Smartphones Vivo 12 Months 12 Months 12 Months 12 Months 12 Months 12 Months 12 Months
days.
14 Laptops HP 6 Months 6 Months 6 Months 6 Months 6 Months 6 Months 6 Months NA
15 Laptops Acer 6 Months 6 Months 6 Months 6 Months 6 Months 6 Months 6 Months NA
10% Cashback on Credit Card EMI Transaction up to INR8000 on Dell Selected products.
16 Laptops Dell 6 Months 6 Months 6 Months 6 Months 6 Months 6 Months 6 Months
Cash back will be posted within 90 days. TnC apply
17 Laptops Asus 24 Months 24 Months 24 Months 24 Months 24 Months 24 Months 24 Months NA
18 DSLRs Nikon 9 Months 9 Months 9 Months 9 Months 9 Months 9 Months 9 Months NA
5% with max cashback of Rs. 6000 per card per month during the offer period . It will be
19 DSLRs Canon 12 Months 12 Months 12 Months 12 Months 12 Months 12 Months 12 Months
posted in Customer account in 90 days. TnC apply
20 TVs Hitachi TV 12 Months 12 Months 12 Months 12 Months 12 Months 12 Months 12 Months 10% and 5% cashback. It will be posted in customer account within 90 days
21 Entertainment Acoosta 12 Months 12 Months 12 Months 12 Months 12 Months 12 Months 12 Months NA
22 Entertainment BOSE 12 Months 12 Months 12 Months 12 Months 12 Months 12 Months 12 Months NA
23 Any Product Amazon Devices 12 Months 12 Months 12 Months 12 Months 12 Months 12 Months 12 Months NA
24 Any Product Croma own label 6 Months 6 Months 6 Months NA
18 February 28, 2020Credit Cards have dual income streams
We analyze the revenue engines for the parties involved in the credit card transaction circuit
Broadly, a credit card company operates on a dual revenue model (a) non-interest income (primarily comprised of fee-based income such as interchange fees,
late fees and annual fees, among others) (b) interest income on credit card loan receivables. (Note: MDR: merchant discount rate)
Revenue model for credit card issuer
Interest Income Fee Income
Rewards points
Business revenue
Revolver Subscription- Spends-based development Balance transfer redemption:
EMI Receivables: Service
receivables: based fees: Sign Instance-based fees: Portion of incentive fee: Fees on Fees on
Interest charge on Charges:
Interest earned on up fee and fees: Late fees & MDR paid by income: transfer of debt purchase of
conversion of Maintenance
unpaid credit card annual renewal over limit fees. payment network Incentives from from one credit products or
balance into EMI. charges
dues card fees. to the card issuer network/co- card to another services by
branded partners customers using
reward points
Commissions on payment settlements, interest income on amount in merchant account and income through sale of POS terminals if any
Revenue model for acquiring bank
Merchant Settlement Cycle Interest: Interest earned on
Acquirer Fees: Commission as % of MDR for payment Sale of PoS Terminals: One-time fee (Rs8000-12000)
the money that resides with acquiring bank till the merchant
settlement processes from the merchants for PoS terminals
accounts are settled.
Payment networks earn service revenues, data processing revenues, international transaction revenues and client incentive income
Revenue model for payment network
Data processing revenues: Earnings from Client incentives: Revenues from long-
International transaction revenues:
Service Revenues: Earnings for customer authorization, clearing, settlement, network term contracts with financial institution
Earnings from cross-border transaction
support services for the delivery of payment access, and other maintenance & support clients for build payments volume, increase
processing and currency conversion
network products and solutions. services that facilitate transaction and Visa-branded card acceptance, and win
activities
information processing merchant routing transactions
19 February 28, 2020Credit Card is an opex intensive model
• The credit card business carries high operating expenses compared to Glimpse of Credit card operating model
other retail segments.
• It is a function of market-engagement costs, comprising acquisition and Operating Costs
marketing costs, rewards redemptions costs, other spend based costs
(including costs to payment networks, such as VISA and MasterCard,
and payment gateways, among others) and other costs (including
employee, sourcing, on-boarding, collection and recovery costs).
• Acquisition cost comprises costs for acquiring customers through
Fixed Variable
various channels and marketing cost comprises costs for
advertisements and discounts or cashbacks offered. Indian credit card
players largely rely on the banca channel for new customer acquisition
and hence have witnessed certain relief on this front as they stand
largely supported by the ready-made bank provided infrastructure. Said
that, with quest for deeper reach and newer markets, open market
Employee Expense Acquisition Costs
acquisition channels are grabbing higher share in turn proving as key
expense factor for the card company.
• Technology and data analytics capabilities are the mainstay of a
successful credit card business, while the first one aids in customer
acquisition, the second enables control on delinquencies. Erratic
Rewards Points
consumer spend patterns, uncertain macros require the credit card Admin/ Other expense
Redemption Costs
company to constantly evolve and adapt. Technological and collection
costs, therefore, account for higher share in company’s overall cost
metrics.
• PL View: The only offsetting measure to high opex intensive credit card
model is the establishment of a modern, sophisticated technological Collection Costs
infrastructure supported by process automation, data analytics and
algorithms that support size and scalability. Scalability and steady
revenue streams bring in cost efficiencies over the course of the
business. Source: Company, PL
20 February 28, 2020Credit Card business is prone to higher delinquencies
Unsecured loans have grown at a faster pace (25% CAGR) over past 5 Credit card delinquencies for industry remained range bound past 3 years
years largely led by millennial spends which should sound red flags to the Retail loans pack Delinquency Level: FY17-FY19
Card Cos. Personal loans 0.5 – 0.7%
CRISIL Data suggests ~25% of new card additions in FY19 were to new- Credit cards 1.5 - 1.8%
to-credit customers. With card companies increasingly vying for new-to- Consumer durable loans 1.5 – 2%
credit customers with limited credit history poses risks on the quality of the
portfolio Source: Company, PL
Credit Card Industry NPA trends
But credit bureaus have played an integral part in this with its widened
customer-base and more data points available per customer with the Q12018 Q22018 Q32018 Q42018 Q22019 Q32019
passage of time aiding card players manager better. Moreover, digital Industry 0.88% 0.89% 0.94% 0.88% 0.76% 0.9%
solutions from documentation stage to payment disbursals, low ticket
offerings like credit cards and personal loans stand best suited aiding Global Credit Card Players 2016 2017 2018
reduction in likelihood of defaults.
Discover 0.87% 0.99% 1.08%
Besides, with increasing data availability and improved card payment American express (International) 0.90% 0.90% 0.70%
habits, customers are becoming aware of the cost of carrying large Capital One (Credit Card) 1.83% 1.94% 1.92%
balance or missing the payment schedules
Delinquency (90 plus days) levels, therefore, have reduced in the last FY17 FY18 FY19
couple of years. SBI Card 2.4% 2.8% 2.3%
PL, View: While industry-wide NPAs have stood under control over past 3 Source: TransUnion CIBIL, Bloomberg, Company, PL
years, we reckon charge offs are expected to increase across credit card
players with increasing competition, consumption headwinds and
business seasonality.
21 February 28, 2020Company Section 22 February 28, 2020
Company Background

                    SBI Cards and Payment Services Ltd (SBI Cards) is second largest credit card issuer in India. The company is focused on catering to
                    cardholders’ two primary financial needs; viz, transactional needs and short term credit. The company’s total credit card spends grew at
About the Company
                    a 54.2% CAGR (vs 35.6% industry CAGR) and the number of credit cards outstanding grew at 34.5% CAGR (25.6% industry CAGR) for
                    FY17-19.

                    Promoted by State bank of India (SBI) which holds 74% in the cards company, 26% of the company is owned by CA Rover Holdings as
Promoter
                    on 1HFY20.

                    33,086 outsource sales personnel operating out of 133 Indian cities at 3,009 open market points through multiple channels such as
                    physical points of sale, telesales and online. The company has also associated with payment networks (Visa, Mastercard, Rupay) and
Presence            third-party co-brand partners (CRISIL, Air India, Apollo Hospitals, BPCL, Etihad Guest, Fbb, OLA Money, IRCTC, Yatra) to expand
                    reach, functionality and customer base. Company’s physical customer acquisition network is complemented by digital sales and
                    marketing capabilities

                    Helmed at the top by MD & CEO, Mr. Hardayal Prasad with 36 years wide experience and deeper industry expertise and professionally
Management depth    managed business team. Senior order executives from parent have been absorbed in SBI Cards to boost strategic decision making and
                    operational capabilities.

                    SBIC focuses on comprehensive cross-selling ecosystem, appropriate third party products and services by banking on SBI parentage
                    and network (22007 branch network and 436 mn customer base). The company’s current acquisition of new accounts through SBI
Business            stands at 47.6% (1HFY20). SBIC’s products stand diversified and tailor-made across customer categories encompassing premium,
                    affluent, mass affluent, mass and new to credit. Said that, 85.7% of the total accounts as on 1HFY20 are dominated by salaried customer
                    base.

                    The revenue derived from credit card products consists primarily of interest on credit card receivables and non-interest income primarily
                    comprised of fee-based income such as interchange fees, late fees, annual credit card membership fees and other fees. 50.7% of
Revenue mix
                    SBIC’s revenue emerged from revolving and term credit card balances, while remainder from income from fees and services as at
                    H1FY20.

Loan book mix       Overall credit card receivables comprise of 28.9% of term loan and rest includes transactor and revolver receivables.
Capital Adequacy    Capital Adequacy stands at 19.0% of which Tier 1 is 14.8% as on 1HFY20
Credit Rating       AAA / Stable (Long Term) from CRISIL &ICRA and A1+ (Short Term) from CRISIL & ICRA.
Auditors            S. Ramanand Aiyar & Co. appointed on July 11, 2017

  23                                                                                                                                        February 28, 2020
SBI Credit Card Transaction Model - Snapshot
Illustration of a typical SBI credit card transaction model
• Merchant platform: Pine Labs
• Cardholder (customer) begins a credit card (SBI Card) transaction by • Merchant uses their credit card machine, software or gateway (Pine labs) to
SBI Credit cardholder presenting his or her card to a merchant (Croma) as payment for goods or Merchant (Croma) transmit the cardholder’s information and the details of the transaction to
services their acquiring bank (HDFC Bank), or the bank’s processor. A 2% merchant
discount rate (MDR) is charged to merchants for payments through cards
• Acquiring bank (HDFC Bank) captures the transaction information and
Card network • MasterCard transaction information is routed between issuing and acquiring Acquirer (HDFC Bank) routes it through the appropriate card network to the cardholder’s issuing
(Mastercard) banks through card network (MasterCard’s Banknet) bank for approval
• Credit card issuer (SBI Card) receives the transaction information from the
acquiring bank (HDFC Bank) through Banknet and responds by approving Card network • Card issuer (SBI Cards) sends a response code back through the
Issuer
or declining the transaction after checking to ensure, among other things, (Mastercard) appropriate network (Banknet) to the acquiring bank (HDFC Bank)
(SBI Cards)
that the transaction information is valid, the cardholder has sufficient
balance to make the purchase and that the account is in good standing
• The response code reaches the merchant’s terminal (PineLabs) and is
SBI Credit cardholder • The cardholder (customer) receives the pucthased items or services Merchant (Croma)
stored in a batch file. Merchant accepts the transaction
Parties to the credit card model
Payment networks Payment networks issuing cards Payment Processors (IODs)
Visa American Express Pine Labs
Mastercard Discover Eze Tap
Rupay Innoviti
Amex M-swipe
Discover
24 February 28, 2020SBI Cards – Michael Porter’s Five Forces Model
Industry rivalry Entry Barriers
MEDIUM
74 credit card issuers in India We believe consistent innovative
including HDFC Bank, Axis Bank, product offerings, technology,
and ICICI Bank. HDFC Bank is the data analytics and superior Threat of Bargaining power Bargaining power
market leader and has maintained its underwriting models happen to be Substitutes of suppliers of customers
market share in the number of the biggest barriers to entry in the
outstanding credit cards at unsecured retail credit space
approximately 27.0% over the years, Banks such as HDFC bank, RBL SBIC is currently rated AAA and A1+ SBIC has been investing in
followed by SBI Card at 18.0%, ICICI Technological changes continue to
bank, ICICI Bank, foreign players like by both CRISIL and ICRA. innovation towards providing
Bank at 14.0% and Axis Bank at significantly impact the credit cards
American Express have become Alongside, the Co. continues to convenience to customers driving
13%. and payment services industries,
more competitive in the credit card receive strong support from its credit card growth
such as continuing development of
space parent. With cumulative positive
Payment solutions space is technologies in the areas of smart SBI Cards stands poised in capturing
mismatch across all buckets up to
heating up with mobile, e-wallet, cards, radio frequency and proximity Other mode of payments like customer mindspace by expanding
one year and back-up of undrawn
UPI, PPIs, POS devices, debit cards payment devices, electronic wallets, mobile, UPIs, e-wallets, paytm credit payment capabilities through
banking lines, the Co.'s cost of
and tokenization platforms proving mobile commerce, data analytics, are also able to attract large no. of partnering with online/offline
funds stand lower vis-a-vis peerset
formidable competition as they are machine learning, block-chain and volumes merchants and aggregators to offer
able to attract large payment artificial intelligence, among others. SBI Cards enjoys steady interchange co-branded credit card products,
volumes at low or no payment SBI Cards possess a large database fees (1 to 2% of merchant discount highly customized card offerings for
processing fees to merchants SBI Cards with its robust of cardholder demographic and rate) on value of transactions from corporates, high reward incentives,
technological systems has been socio-economic data. Such data the merchant acquirer that settles cash backs, discounts to customer on
Paytm, RuPay credit and other leveraging upon artificial intelligence, analytics enable the Co. to filter cardholders' transactions. Merchants credit card spends, interest free line
payment networks have been automation, data analytics, machine prime potential customer base which view these expenses as new of credit to customers.
proving competiitve in the short term learning capabilities and portfolio other payment modes such as UPI or customer acquisition engine and
credit market management and transaction e-wallets might fail to attract Higher reward offerings which can
hence agree for
monitoring models turn out to be higher than annual fees
SBI Cards is poised to maintain Furthermore, SBI Cards has tie-up SBI Cards earns contractual for customers will prove as a big step
market leadership determines by its with corporates and online/offline business development incentives for the Co. to combat the bargaining
industry leading position in terms of merchants through co-branding to through its sticky contracts (typically power of customers
open market acquisition channels, offer rewards, such as cashback or 3-5 years) with payment networks.
co-branded tie-ups and access to discounts, based on customer usage Negotiations over renewals also
potential cardholder database. which can help the Co. combat stand in favor as transaction volumes
threats stand higher for SBI Cards. Payment
networks view these expenses as
HIGH expansion into newer customer
space
25 February 28, 2020SBI Cards v/s key industry players
With 74 players offering credit cards in India, top 3 private banks (HDFCB, AXIS, ICICI) followed by SBIC as pure-play credit card issuers, co-branded credit
card models like that of RBL bank and foreign players like Citi Bank and Amex with fee-base models have turned aggressive over the years. While a basic credit
card model can be categorized into two kinds – (a) the primary model of internal-to-bank customer model largely followed by banks issuing credit cards and (b)
the secondary model of new-to-bank customer followed by new entrants and banks with limited liability franchise or by pure credit card issuing players.
FY19 SBI Cards HDFC Bank RBL Bank Amex India
Market share -Outstanding no. of Cards 18% 27% 4% 3%
Market share - Spends Market share 17% 28% 3% 9%
PoS presence (H1FY20) 687594 (SBI Bank) 700075 986425 47382
Payment Gateway NO NO NO YES
Cards-in-force (units in mn) (H1FY20) 9.5 13.3 2.3 1.6
ACQUIRING THROUGHPUT
OPEN MARKET ACQUISITION- HYBRID MODEL-
CARDHOLDERS MODEL – MODEL
Business Model Hook the partners - leverage upon Hook the merchants, not the
Hook the cardholders Hook the merchants, cardholders
partners’ strengths cardholders
should follow
(a) Acquisition of Merchant (a) Acquisition of Merchant partners
Exclusive Cardholders Model: (a)
partners: (banking on 4,90,000 POS (a) Co-branded partnership with (Discount revenue primary revenue
Interest income on revolving
terminals) (b) Bajaj Finance: 1.2mn cards in force driver) (b) Spend-centric model:
balances that are carried over from
Strategy Cross sell to existing cardholders: in partnership (b) Fee-income based Growing no. of overall transactions
one month to next (51% of revenue)
Focus on internal customer revenue model 49% contribution to on its cards through special offers &
and (b) fee based (49% of revenue)
conversion (80% of new credit cards overall revenues low fees (c) Cardholders: Interest
revenue model
issued to existing customers) income and fees model
~50%+ banking outlets focused on Relatively affluent premium
Customer/ Geographic profile Salaried focus (87%) Urban centric
semi-urban & rural locations customer base
~90% of HDFCB customers initiate
Gradual increase in self-employed 62% geographic concentration in top leadership in the premium consumer
Strengths transactions through internet/mobile
base tapping Tier II/III towns (58%) 8 cities area
channel
Product profile
(a) Own credit cards 28 24 30 6
(b) Co-branded credit cards 18 6 8 1
Customer Acquisition Channel
(a) Bank channel 55% 80% 27%
(b) Open Market Channel (Retail+co-brands) 44% 20% 73% 100%
Source: Company, PL
26 February 28, 2020SBI parentage is biggest advantage for SBI cards
SBI Cards banks upon parent-bank lineage drawing benefits as under:
High potential customer base : The bank happens to be largest customer referral partner for the company. Currently, 55% of new customer acquisition for
SBIC emerge from the banca channel giving an edge to SBI Cards in the co-branded card space.
Better distribution capabilities: SBI cards taps parent’s 22,000+ branch network and digital platform like YONO for marketing its card products to prospective
customers.
Leveraging Infrastructure: Co. leverages upon SBI’s huge infrastructure for supporting key business functions; IT infrastructure, compliance and risk
management
Talent pool acquisition: High order executives from parent have been absorbed in SBI Cards to boost strategic decision making and operational capabilities.
Pricing advantage/negotiations: Parent SBI’s size & scale enables SBIC derive significant benefits w.r.t pricing advantages in negotiating third party &
payment network contracts
Brand & trust: SBI’s parentage & highly trusted brand aids easier establishment of reputation of trust,
reliability and transparency amongst cardholders. SBI Cards incurs royalty fees of 2% of net profit or
0.2% of total income, whichever is higher for usage parent’s logo and wordmark.
PL, View: Well-founded parentage brings in readymade network and customer base that strengthens market positioning for SBI Cards. Such a muscle should
enable the Co. to stand firmly particularly in the industry crowded by bank-led credit card business models.
27 February 28, 2020SBI cards has ample scope to expand cardholder base
SBI Cards ranks 2nd in terms of market share Highest market share in incremental cards in force
Share in cards in force* 1M 3M 6M 12M 24M 36M
Market Share (FY19)
HDFC Bank 30% 18% 12% 16% 20% 21%
HDFC Bank SBI Card ICICI Bank Axis Bank Citi Bank
SBI Card 45% 24% 27% 24% 23% 22%
30% 27% 27% 28%
ICICI Bank 44% 29% 24% 21% 17% 15%
25% Axis Bank 19% 13% 16% 16% 15% 15%
20% 18% Citi Bank 2% 1% 0% 1% 1% 1%
16% 17%
14% 14% Kotak Mahindra Bank -11% 1% 3% 4% 5% 5%
15% 13% 13%
11% RBL Bank -8% 7% 9% 9% 9% 7%
9% 10% 9%
10% American Express 4% 3% 3% 3% 3% 3%
6%
5% Standard Chartered Bank -3% 0% -1% 0% 1% 1%
Cards in Force Transactions Spends
IndusInd Bank 4% 4% 3% 3% 3% 3%
Source: Company, PL Source: Company, PL *As of July 2019
With parent’s standing on low credit to debit card ratio, it leaves ample scope for SBI cards to cross sell and maintain the market leadership
Credit Card to Debit Card Ratio % FY15 FY16 FY17 FY18 FY19 1HFY20 The debit cardholder base in India stands at
830mn that is 17 times more than the credit
Systemic credit to debit card ratio 3.8% 3.7% 3.9% 4.4% 5.2% 6.3% cardholder base at 50mn
Kotak Mahindra Bank 33.4% 20.4% 21.0% 17.8% 16.2% 14.9%
SBI bank’s debit cardholder base stands at 300mn
HDFC Bank 27.6% 31.6% 36.3% 43.9% 46.3% 45.1% that is 30times the SBI Cards credit cardholder
base at 9mn
RBL Bank 26.4% 20.2% 48.0% 95.5% 245.6% 278.5%
IIB 16.5% 17.2% 17.4% 20.3% 22.1% 24.2% With SBI Cards superior technological and data
analytics infrastructure (refer for details on page
Axis Bank 12.1% 15.6% 16.6% 20.1% 24.3% 27.5% 38), sizeable debit card customer base can be
filtered to be converted into credit card customer.
ICICI Bank 12.0% 11.2% 11.5% 12.0% 14.8% 17.5%
State Bank Of India 2.0% 1.9% 2.1% 2.2% 2.6% 3.2% SBI Cards, therefore, is expected to maintain its
market position
Yes Bank 0.0% 0.0% 5.8% 14.0% 20.5% 24.7%
Source: RBI, Company, PL
28 February 28, 2020Robust acquisition and customer retention enable niche positioning
While cards-in-force have more than doubled over FY15-FY19 to 8.3mn, a sticky customer base would determine the success story of the credit card
business ahead.
With competition heating up in the digital payment space, we believe SBI Cards is expected to maintain its niche with a steady customer pool driven by
diversified acquisition channels and customer retention strategies as depicted below:
(B) Robust open market acquisition channel: Led by co-branded
partnerships, open mkt strategy involves deploying sales/marketing
(A) Expanding beyond top 8 metros to tap rural market:
personnel in variety of locations; viz, physical points of sale in retail
Proportion of new accounts sourced from Tier 2/Tier
stores, malls, fuel stations, railway stations, airports, corporate parks and
3/beyond stood at 57% (FY19) up from 33% (FY17)
offices, as well as through tele-sales, online channels, email, SMS
marketing and via mobile applications
(D) Incentivizing spends through partnerships and high value
Build proposition card offerings:
(C) Capitalizing on parent’s network: Parent bank’s network (a) Focus on personal cards that form 99.6% of overall card
opens access to new customer base: (a)Parent’s POS- 661000
Customer
offerings
(Q3FY20) (b) Parent’s BCs- 60000 (Q3FY20) (c) Parent’s - no. of acquisition (b) Catering to affluent class, premium cards form 40% of overall
debit cards customers: 299.7mn (1HFY20) (d) No. of credit cards & retention card offerings
linked to parent SBI’s YONO App- 2.2lakh (c) Building partnerships & gaining fair share of consumer’s wallets
strategy
increasing customer loyalty, co-branded cards for 39% of overall
card offerings
(E) Investments in physical & digital technology and data
analytics : Build-up of brand new peripheral applications, (F) Tapping the high spend potential self
such as online customer acquisition (mobile application employed base: Self-Employed as a share of
features), online servicing, customer relationship total active cardholders accounts have risen to
management and employment of data analytics for 13% (FY19) from 9.6% (FY17)
development of new product offerings
29 February 28, 2020(A) Expansion into non-metros led by non- bank channels
Geography-wise new account sourcing is gradually tilting towards non-metro areas that stand under-penetrated with high loyalty potential
FY17 FY18 FY19
Tier 2, Tier
3 & Others
33% Tier 2, Tier
3 & Others
46% Tier 2, Tier
3 & Others Top 8
57% metropolitan
Top 8 areas
metropolitan 43%
Top 8 areas
metropolitan 54%
areas
67%
Source: Company, PL
(B) 45% of the customer sourcing happens through exclusive SBI Cards’ network and own channel
Retail Co-Brand
Led by co-branded partnerships, open mkt strategy involves deploying
sales/marketing personnel in variety of locations; viz, physical points of sale in retail
Bank Distribution Channel (SBI) Corporate Distribution channel
stores, malls, fuel stations, railway stations, airports, corporate parks and offices, as
100% well as through tele-sales, online channels, email, SMS marketing and via mobile
applications, SBI cards non-banca customer acquisition channel stands at 45% of the
80% 35% overall acquisition engine.
45%
55%
60%
SBI Cards stands as a leading player in open market customer acquisition in
28%
40% 26% India. Its platform includes:
30%
(a) 3,009 open market points of sale across 133 cities in India
20% (b) bank branch networks of 7 bank co-brand partners across India
35%
28% (c) physical presence in 11 non-bank co-brand partner retail locations and 7 bank co-
15%
0% brand partner branches
FY17 FY18 FY19 (d) outreach with 4,350 outsourced tele-sales workforce
(e) online e-apply channels, email and SMS marketing
Source: Company, PL
30 February 28, 2020You can also read