2011 ANNUAL REVIEW -Creating a happy tomorrow for everyone
←
→
Page content transcription
If your browser does not render page correctly, please read the page content below
-Creating a happy tomorrow for everyone-

                                            2011
                                           ANNUAL REVIEW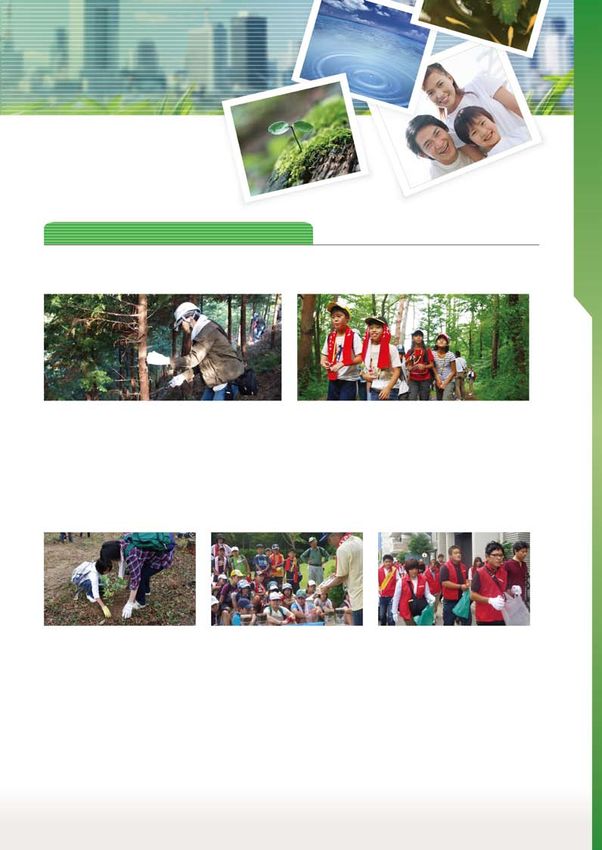
TAble of contents

                                                                                Consolidated Financial Data : Trends in Key Financial Index        2

                                                                                To Our Shareholders                                                3

                                                                                Long-Term Management Framework 2020                                5

                                                                                      Long-Term Management Framework 2020                           5
                                                                                      Mid-Term Management Plan 2011-2013                            6

                                                                                Overview of Sales Results                                          7

                                                                                   Soft Drink Market in Japan                                       7
                                                                                   Trade Marketing                                                  8
                                                                                   Overview of Sales Structure                                      9
                                                                                   Our Brand Lineup                                                11
                                                                                		 Spotlight on Our Major Brands                                   12

                                                                                Supply Chain Management Activities                                 14
              -Creating a happy tomorrow for everyone-
                                                                                Corporate Social Responsibility Activities                         15

                                                                                      Global Environmental Protection Activities                   15
                                                                                      Quality Assurance                                            17
                                                                                      Business Activities Contributing to Local Communities        18
                                                                                      Together with Local Communities                              19

                                                                                Financial Information                                              21

                                                                                      Analysis of Operating Results                                21
                                                                                      Segment Information                                          22
                                                                                      Consolidated Balance Sheets                                  23
                                                                                      Consolidated Statements of Income and
                                                                                      Consolidated Statements of Comprehensive Income              25
                                                                                      Consolidated Statements of Changes in Shareholders’ Equity   26
                                                                                      Consolidated Statements of Cash Flows                        27

                                                                                Other Information                                                  28

                                                                                   Risk Information                                                28
                                                                                   Corporate Governance                                            29
                                                                                   Top Management                                                  34
                                                                                		 Dividend Policy and Shareholder Reward Points System            35
                                                                                   Stock Information                                               36
                                                                                   Coca-Cola System in Japan                                       37

Coca-Cola, GEORGIA, Aquarius, and Sokenbicha are registered trademarks of the
Coca-Cola Company.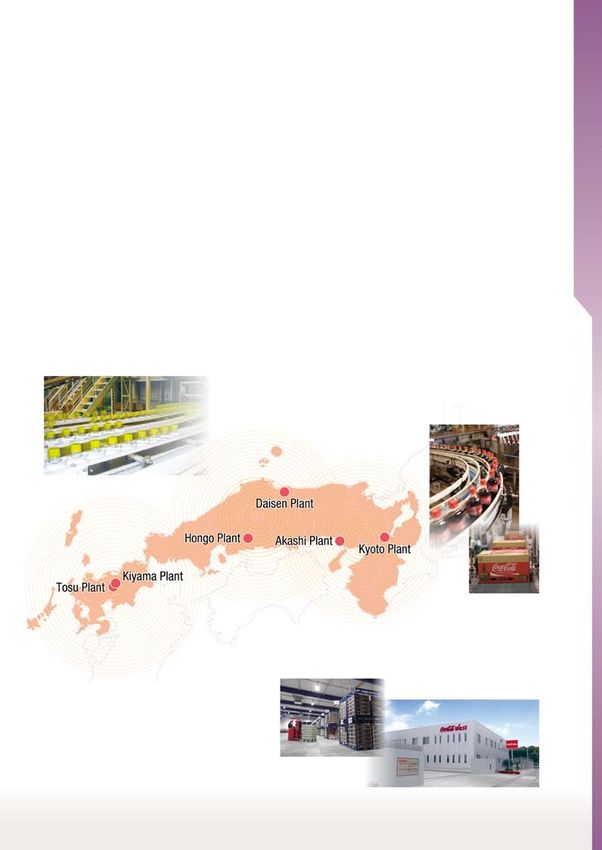
Consolidated Financial Data : Trends in Key Financial Index
Consolidated Financial Data : Trends in Key Financial Index

                                                                                              2007               2008        2009        2010       2011

Net Revenues (Millions of Yen)                                                             409,521          395,556       369,698     375,764    399,717
Growth Rate in Net Revenues (%)                                                               24.9             (3.4)         (6.5)        1.6        6.4

Operating Income (Millions of Yen)                                                          16,056              10,521      2,242      12,003     16,469
Operating Income / Net Revenues (%)                                                            3.9                 2.7        0.6         3.2         4.1

Recurring Income (Millions of Yen)                                                          17,493              11,048      2,085      12,659     16,044
Recurring Income / Net Revenues (%)                                                            4.3                 2.8        0.6          3.4        4.0

Income (Loss) before Income Taxes, minority interests and other                             14,254               2,402    (10,446)     12,982     14,013
adjustments (Millions of Yen)
Income (Loss) before Income Taxes, minority interests and other
adjustments / Net Revenues (%)                                                                  3.5                0.6        (2.8)        3.5        3.5

Net Income (Loss) (Millions of Yen)                                                          9,375                 129     (7,594)      7,582      6,997
Return on Sales (%)                                                                            2.3                 0.0        (2.1)        2.0        1.8

Comprehensive Income (Millions of Yen)                                                           −                   −           −          −      5,605

Net Income (Loss) per share (Yen)                                                            88.29                1.25     (75.96)      75.84      69.99

Return on Equity (%)                                                                            3.7                0.1        (3.3)        3.4        3.1

Return on Assets (%)                                                                            5.6                3.7         0.7         3.8        4.7

Total Assets (Millions of Yen)                                                             315,672          277,696       326,818     346,032    342,560

Net Assets (Millions of Yen)                                                               254,025          234,521       222,816     226,267    227,864

Equity Ratio (%)                                                                              80.5                84.4       68.2        65.3       66.4

Net Assets per share (Yen)                                                                 2,391.83        2,345.03       2,227.96    2,260.03   2,275.55

Price Book Value Ratio (PBR) (times)*1                                                          1.0                0.8         0.7         0.7        0.6

Price Earnings Ratio (PER) (times)*2                                                          28.0          1,549.5         (21.6)       19.4       19.1

Cash Flow from Operating Activities (Millions of Yen)                                       33,000              16,180     28,747      31,732     39,960

Cash Flow from Investing Activities (Millions of Yen)                                      (23,306)              2,153    (23,447)    (49,203)   (34,050)

Cash Flow from Financing Activities (Millions of Yen)                                        3,586          (31,486)       43,297     (16,316)    (8,780)

Cash and Cash Equivalents at end of fiscal year (Millions of Yen)                           35,564              22,412     71,221      37,434     34,564

Dividend Payout Ratio (Consolidated) (%)                                                      48.7          3,440.0              −       52.7       58.6

Dividend per Share (Yen)                                                                     43.00               43.00      42.00       40.00      41.00
(Interim dividend amount per share) (Yen)                                                   (21.00)             (21.00)    (21.00)     (20.00)    (20.00)

Interest Coverage Ratio (times)*3
                                                                                             285.4               462.7       97.2        35.4       58.1
(Operating Cash Flow / Interest Paid)

Depreciation (Millions of Yen)                                                              22,533              21,741     21,900      22,405     21,371

Capital Expenditure (Millions of Yen)                                                       19,951              18,032     25,201      16,524     21,201

   Capital Expenditure for Vending Machines (Millions of Yen)                               10,012              10,359      8,760       7,604      9,518
   (Share of Capital Expenditure for Vending Machine)                                        (50%)               (57%)      (35%)       (46%)      (45%)

*1 Price Book Value Ratio (PBR) = Market Value at the end of period ÷ Equity per share
*2 Price Earnings Ratio (PER) = Market Value at the end of period ÷ Net Income per share
*3 Interest Coverage Ratio=Operating Cash Flow ÷ Interest Paid

                                                                                                      2
                                                                                           Annual Review 2011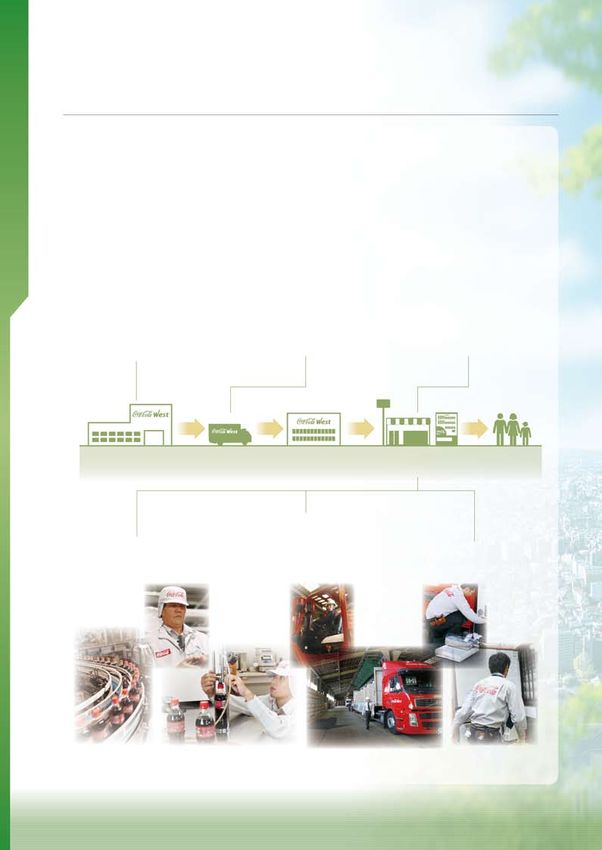
To Our Shareholders
To Our Sharehoders

                       We would like to express our sincerest gratitude to shareholders           diate materials, as well as strengthening coordination between the
                     and investors for their continuing interest in the company.                  SCM department and the sales department so as to improve the ac-
                       Also, we feel deep sympathy for people in areas affected by the            curacy in supply and demand matching. The result of these efforts
                     Great East Japan Earthquake and other related parties, and sin-              has led to the stable supply of products, dramatically reducing SCM-
                     cerely hope that the disaster-stricken areas will recover as soon as         related expenses from the previous fiscal year.
                     possible.                                                                      In administrative and indirect departments, for the sake of cost
                                                                                                  reduction, we worked to advance structural reforms across the com-
                                                                                                  pany, including a review of all business processes.
                     Overview of Business Results for the Fiscal Year 2011                          Also, in order to deal with the problem of nationwide electricity
                                                                                                  shortage, we implemented various electricity saving measures as
                       In 2011, partly because the rainy season ended earlier than usual,
                                                                                                  part of the policies to control the total volume of energy usage of the
                     sales volume in the soft drink industry was brisk during the summer,
                                                                                                  Group. These measures include suspending the cooling function of
                     the period of peak demand. As a result, sales in the overall market
                                                                                                  vending machines on a rotational basis, always remembering to turn
                     were almost the same as 2010, when the summer was extremely
                                                                                                  off unnecessary lights, and introducing LED lights in the head office,
                     hot. However, retail prices have continued to fall due to budget-
                                                                                                  factory offices, and other places.
                     minded mentality of consumers, which primarily stemmed from the
                                                                                                    As for Corporate Social Responsibility (CSR), we continued our
                     uncertain economic outlook. In addition, as competition among the
                                                                                                  effort to contribute to local communities through continuous sup-
                     soft drink companies has been intensifying, business conditions sur-
                                                                                                  port for social welfare, sports activities, and cultural and educational
                     rounding the Group have been increasingly difficult.
                                                                                                  activities. We also continued to conduct local environment improve-
                       Under such business conditions, in order to expand profits and
                                                                                                  ment activities, including forest conservation activities and cleanup
                     sales volume/market share, and to establish a solid business foun-
                                                                                                  activities in cooperation with local communities.
                     dation for future sustainable growth, we carried out various activities
                                                                                                    As a result, in fiscal 2011, the consolidated net revenues in-
                     in 2011, which is the first year of the phase of “Grow with break-
                                                                                                  creased ¥23,952 million, year-on-year, totaling ¥399,717 million
                     through” in the Mid-Term Management Plan 2011-2013.
                                                                                                  (6.4% increase compared to the previous fiscal year). The operating
                       As for sales, with the aim of expanding sales volume and market
                                                                                                  income increased ¥4,466 million, year-on-year, totaling ¥16,469
                     share, we mainly focused on conducting finely tuned sales activities
                                                                                                  million (37.2% increase compared to the previous fiscal year), and
                     to meet diverse consumer needs in each sales channel. Specifically,
                                                                                                  the recurring income increased ¥3,384 million, year-on-year, total-
                     for the chain store channel (supermarket, etc.), we researched and
                                                                                                  ing ¥16,044 million (26.7% increase compared to the previous
                     analyzed the purchase patterns of consumers in each retail store,
                                                                                                  fiscal year). The net income decreased ¥584 million, year-on-year,
                     and we developed product lineups and promotion activities based
                                                                                                  resulting in ¥6,997 million (7.7% decrease compared to the previ-
                     on the results of the analysis. For vending machines, we focused on
                                                                                                  ous fiscal year).
                     adjusting product lineups (brands, packages, and prices) according
                                                                                                    We achieved the results of increased operating income and re-
                     to the features of the locations and seasonality. As a result, sales
                                                                                                  curring income compared to the previous fiscal year, making a good
                     volume increased from the previous fiscal year, led by our core 8
                                                                                                  start in the Mid-Term Management Plan 2011-2013.
                     brands—Coca-Cola, Coca-Cola Zero, Fanta, Georgia, Sokenbicha,
                     Aquarius, Ayataka, and I LOHAS, which account for approximately
                     60% of the total sales.
                                                                                                  Fiscal 2012 Management Policies
                       With regard to Supply Chain Management (SCM), for productivity
                     improvement we engaged in capital investment, updating manu-                   As for future prospects, business conditions surrounding the
                     facturing equipment and introducing new technologies. Also, we               Group are expected to remain difficult, marked by sluggish con-
                     focused our efforts on reducing costs in procuring raw and interme-          sumption and declining product prices in the soft drink industry.

                                                                                           3
                                                                                   Annual Review 2011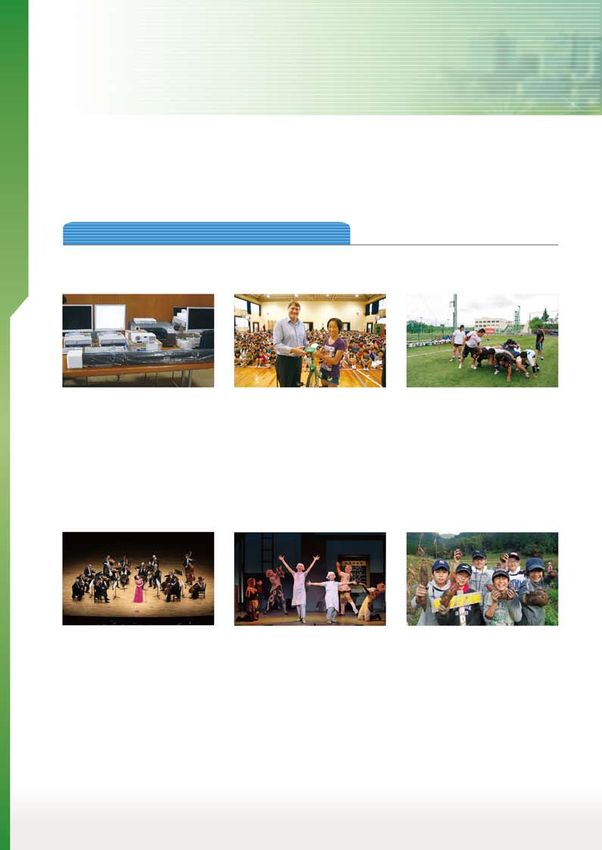
To Our Sharehoders
  Under such business conditions, in 2012, which is the second                                            Dividends
year of the Mid-Term Management Plan 2011-2013, we will strive
                                                                                                             Our dividend payout policies are based on the principle of provid-
to achieve business targets and build a foundation to continue to
                                                                                                          ing profit to shareholders consistently and continuously. As for the
develop in the future and enhance profitability, by way of: (1) steadily
                                                                                                          dividends for the fiscal year 2011, we took into consideration both
implementing consumer-oriented strategies in the markets to
                                                                                                          the results of operations for that term and also the future operational
achieve the sustainable growth of profits and sales volume/market
                                                                                                          environment. Using those data, we set the term-end dividend pay-
share; and (2) carrying out “8 Initiatives of Business Model Innova-
                                                                                                          out as ¥21 per share, and the annual payout, including the interim
tion” to establish a business foundation from mid- and long-term
                                                                                                          payout, as ¥41 per share (increased by ¥1 from the previous fiscal
perspectives.
                                                                                                          year).

                                                                                                             As we work toward attaining these goals, we would like to seek fur-
                                                                                                          ther support and understanding from all shareholders and investors.
    Net Revenues                                    Operating Income
                          (Unit: Millions of Yen)                         (Unit: Millions of Yen)
    500,000                                         18,000
                                                                                   16,469

                                  399,717           15,000
    400,000             375,764
              369,698
                                                                         12,003
                                                    12,000
    300,000

                                                      9,000

    200,000
                                                      6,000

    100,000
                                                      3,000     2,242

          0                                               0
               2009      2010        2011                       2009      2010        2011

    Recurring Income                                Net Income
                          (Unit: Millions of Yen)                         (Unit: Millions of Yen)
     18,000                                         10,000
                                    16,044

     15,000                                           8,000              7,582
                                                                                   6,997
                        12,659
     12,000                                           6,000

      9,000                                           4,000

      6,000                                           2,000
                                                                                                            Tamio Yoshimatsu
      3,000    2,085                                      0                                                 Representative Director & President
                                                               (7,594)
          0                                         (10,000)
               2009      2010        2011                       2009      2010        2011

                                                                                                            4
                                                                                                    Annual Review 2011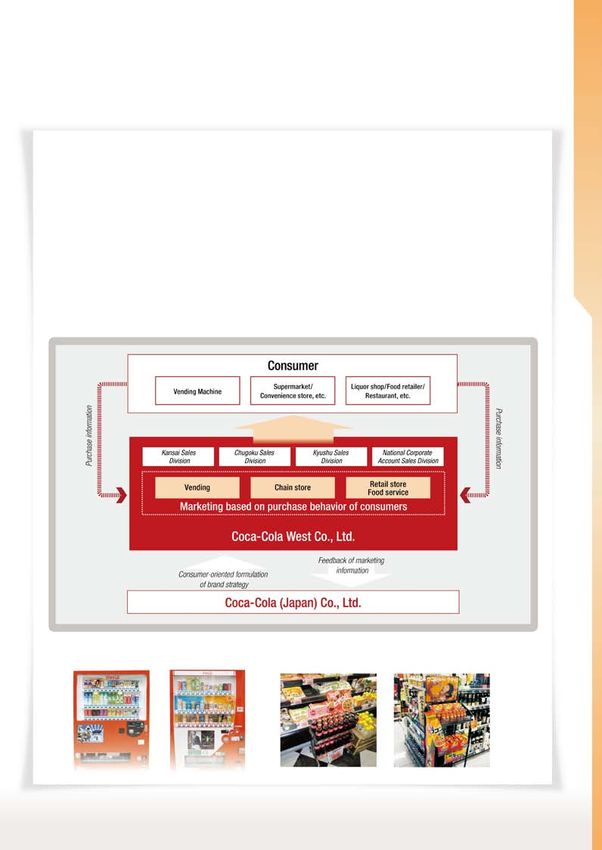
LONG - Term management framework 2020
Long-Term Management Framework 2020

                                                                                          Long-Term Management Framework 2020

                                            With the aim of ensuring a significant leap forward                                    Phase Progression toward Long-term Management
                                         over a long period of time and an ongoing survival as                                     Framework 2020
                                         a corporation, we have developed “Long-Term Man-
                                         agement Framework 2020” for 10 years beginning in
                                         2011 as a guide focusing on the strategically planned
                                         growth, efficiency improvement, and organization ac-
                                         tivities. Based on these three strategies, we are work-
                                         ing on a variety of activities.
                                            We divided the next 10 years until 2020 into the
                                         following three phases to reliable transition toward
                                         achieving the 2020 targets: Three years to grow with
                                         breakthrough, Three years to realize growth, and Four
                                         years to actualize dreams & progress to the next level.

                                                                                                                                                                      West Vision
                                                                   Corporate Philosophy
                                                                                                                                             To be the most respected company by all
                                                     We will contribute to the happy lifestyle
                                                                                                                                           key shareholders, encompassing consumers,
                                                     of all our stakeholders and contribute to                                              customers, employees and the community!!
                                                    the development of a sustainable society
                                                        by providing value and refreshment
                                                                                                                                      Coca-Cola West vision statement describes where we want to be in the year
                                                          through our beverage portfolio.                                             2020 in a bit to reach the goal of becoming a company that will gain special
                                                                                                                                      patronage from our shareholders, our consumers, local communities, and
                                                                                                                                      our own employees.
                                              In the business field primarily for drinks, we will continue to discover new
                                              needs of consumers, as well as the provision of safe and secure high-quality                                     Corporate Message
                                              products and services. In addition, our corporate philosophy expresses that
                                                                                                                                                      -Creating a happy tomorrow for everyone-
                                              we will offer products and services that enjoy new values through uninter-
                                              rupted innovations; thereby,
                                              ●   we contribute to the physical and mental wellbeing (that is, “happiness”)
                                              for people to lead a forward-looking life, such as taste, fun, health, and
                                              comfort, in the diverse lifestyle of our consumers, and
                                              ●   we definitely keep in mind contribution to environmental preservation and
                                              coexistence with local communities in our business activities, and based on
                                              these efforts, we contribute to development of a sustainable society.                   The corporate message “Creating a happy tomorrow for everyone” expresses
                                                                                                                                      our sincere desire to provide happiness to all of our stakeholders.

                                                                                                                              5
                                                                                                                      Annual Review 2011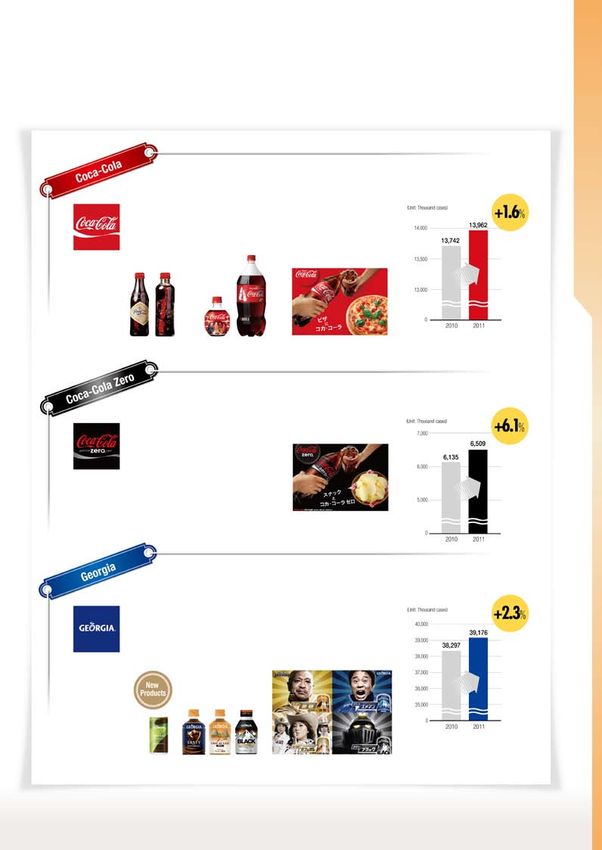
Long-Term Management Framework 2020
                                            Mid-Term Management Plan 2011–2013

   We developed, as the first phase toward the Long-Term Management Framework 2020, the Mid-Term Man-
 agement Plan 2011–2013 with placing the first three years beginning in 2011 as Growth with breakthroughs.
   We will ensure implementation of the three basic strategies: Growth Strategy, Efficiency Strategy, and Struc-
 tural Strategy. This is to expand sales and profit toward achieving the earnings projection in 2013 and bring
 “Happiness” to all of our stakeholders.

                          * Trade marketing: A brand marketing expansion method at sales sites. Its purpose is to build sales site strategy for the improvement in
                                             number and in value of purchased items though consumer-related knowledge management. And in order to deliver sales
                                             volume and value, trade marketing support sales forces with well-designed fundamental enhancement plans.

   In 2011, coupled with an increase of profit, sales volume, and an expansion of market share, we were seeking to create a basis for growth
and profit for the future. To this end, we were engaged in various activities in the area of sales and SCM (supply chain management) and made
investments. Through these efforts, operating income in the fiscal year ended December 2011 was more than projected, marking a good start
toward actualizing the 10-year Long-Term Management Framework.
   In 2012, we will implement the reform of business model toward establishing a solid management basis from the mid- and long-term view-
point. In addition, with the aim of attaining sustainable growth of profit, sales volume, and market share, we will enhance our ability in business
activities in the market while increasing efficiency to cut down costs in SCM as well.

                                                      Business Model Innovation
                                                                    - Eight Initiatives -
         In our every activity in the process until the delivery of products to consumers, we will create a consumer-oriented business model
      by pushing forward a company-wide reform.
         We will make clear an optimal service model that should be provided to each customer and vending machine and execute market
      activities in line with each model. Along with measures, we will put into action eight initiatives in the reform of the business model,
      including the reform of distribution process toward introducing more efficient vending machine business and consolidating inventories,
      as well as the optimal allotment of manufacturing bases and the improvement of productivity in the manufacturing field.
         These consumer-oriented initiatives will be interconnected and linked together, thereby maximizing effectiveness and efficiency and
      ensuring a competitive edge. With these, we will further reduce costs.

                                                                                   6
                                                                        Annual Review 2011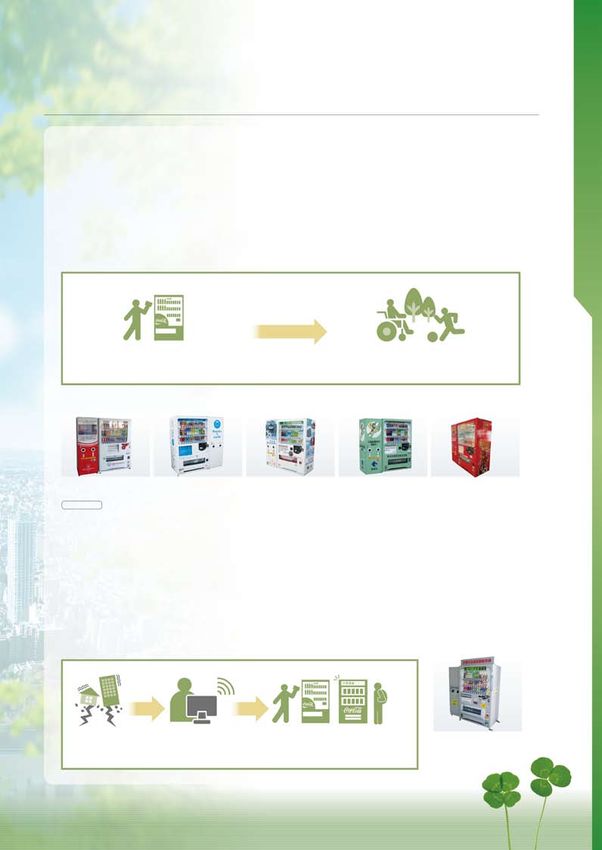
Overview of Sales Results
                            Soft Drink Market in Japan
Overview of Sales Results

                            Market Trends

                               In 2011, production volume of soft drinks exceeded that marked in 2010 when we experienced extremely hot weather and hit a record
                            high. By product category, production volume of carbonated beverages, coffee beverages, and mineral water all increased from the previous
                            year. The soft drink market has seen nearly 60% growth in the last 20 years.

                            Change of Production Volume of Soft Drinks

                            Source: Statistical Report on Soft Drinks, Japan Soft Drink Association, a General Incorporated Association (Data for the year 2011 is preliminary.)

                                                                                               Over-the-Counter Sales Market Share by Category for 2011
                                                                                                                      (excluding vending machines)

                                    Carbonated beverages                                       Canned coffee                                         Blend tea                              Sports and functional drinks

                                     No.1                                                 No.1                                                  No.1                                             No.1
                            Source: MBI conducted by Intage, Inc.

                                              Over-the-Counter Sales Market Share for 2011                                                           Outdoor Vending Machines Market Share for 2011
                                                                (excluding vending machines)

                                                                 No.1                                                                                                 No.1
                            Source: Store Audit conducted by Intage, Inc.                                                            Source: Survey of Vending Machines, Intage. Inc. (survey period from June 2011 to July 2011)

                                                                                                                            7
                                                                                                                 Annual Review 2011
Trade Marketing

                                                                                                                                                                                                         Overview of Sales Results
  We operate our business activities in the market by establishing sales divisions by sales territory under the “Trade Marketing*,”
a marketing technique based on consumers’ purchasing behaviors.
*Trade marketing: A brand marketing expansion method at sales sites. Its purpose is to build sales site strategy for the improvement in number and in value of purchased items though consumer-related
		                knowledge management. And in order to deliver sales volume and value, trade marketing support sales forces with well-designed fundamental enhancement plans.

Scheme of Trade marketing

   Our efforts for differentiation and diversification of our sales methods (including brands, packages, sizes, and prices) according to business
categories or sales sites encourage providing products suitable for our consumers’ drinking preferences. By deploying detailed marketing op-
erations from a consumer-oriented viewpoint, we are seeking to increase sales volume and profits and expand our market share.
   As for vending machines, we will pursue vending machines that are attractive to consumers and select products depending on character-
istics of the location and the season along with thorough price strategies. Through these efforts, we will increase sales volume per vending
machine. In terms of chain stores, we will attend reliably to our consumers’ needs by differentiating and diversifying our assortment (sizes
and prices) according to particular business conditions and sales sites.

Point of Sales
                                     [Vending]                                                                               [Supermarket]

      Summer-                                  Winter-
        type                                    type

                     Assortment of products varied with the seasons                                 Sales sites expansion depending on consumers’ drinking preferences.

                                                                                                        8
                                                                                            Annual Review 2011
Overview of Sales Structure
Overview of Sales Results

                              The number of customers in our sales territory is about 300,000. We organize specialized systems per selling structure (channel) for
                            our customers, and perform a variety of cooperative activities with them. Thus these efforts result in enhancing our consumers’ satis-
                            faction.

                            Chain store (Supermarket/Convenience stores, etc)

                                We analyze consumers’ behavioral intentions and purchase motives for each supermar-
                              ket to provide the best product assortment available. We also support creating a comfort-
                              able shopping experience by proposing the most appropriate product—for example, small
                              bottles of Coca-Cola or Coca-Cola Zero placed in the pizza section and small bottles of
                              Sokenbicha and Ayataka in the bento meal section. We also carry out seasonal and holiday
                              campaigns to strengthen sales, such as Aquarius for prevention of summer heat strokes
                              and large-sized Coca-Cola bottles for Christmas parties.

                              VENDING

                                 As of December 31, 2011, we have about 270,000 vending machines installed both
                              indoors and outdoors. We have been selecting products suited for the installed areas
                              (outdoors, offices, factories, schools, etc.) and providing larger breadth of size and price,
                              seeking more sales per machine. Additionally, seasonal products and campaigns are imple-
                              mented to meet the needs of the consumers.
                                 We are also actively introducing Cashless Vending Machines and Energy-Saving Vending
                              Machines with solar panels and LED lighting in order to cater to our customers’ and con-
                              sumers’ environmentally conscious needs while improving levels of convenience.

                             Retail store, Food service

                                 The retail store/food service channel represents retailers such as liquor stores and ki-
                              osks, and food service such as food courts, restaurants, and movie theaters.
                                 We support creating enjoyable shopping spaces by proposing the most appropriate sell-
                              ing devices well suited for our customers’ preference and providing advertising materials
                              depending on the season or media tie-ups.
                                 Additionally, for food courts and restaurants, we propose original set menus for each
                              facility and support hygiene management of selling equipment, ensuring high-quality mer-
                              chandise and services for the consumer.
                                 We also put effort into new business transactions and propose table-top coolers for new
                              customers, striving for business expansions.

                                                                                                   9
                                                                                          Annual Review 2011
Retail store
7.0%
Supermarket
Convenience 26.7%
store
10.8%
Overview of Sales Results
コカ・コーラ
7.6%
コカ・コーラ ゼロ
Sales volume by Channel その他 3.4%
35.2%
12.3% ファンタ
4.8%
(Unit: Thousand cases) 10.4%
Composition of Sales Figures in 2011
ジョージア
2010 2011 Percentage change 7.2%
21.3%
■ Vending 57,817 54,205 (6.2)% 綾鷹 10.8%
Other 2.7% 爽健美茶
■ Supermarket 49,026 50,099 +2.2% 16.3%い・ろ・は・す / 6.8%
ミナクア / アクエリアス
Vending
■ Convenience store 19,469 20,312 +4.3% Food service
森の水だより
6.8%
11.5%
28.9%
10.3%
■ Retail store 12,978 13,166 +1.4%
■ Food service 18,690 19,302 +3.3% Retail store
7.0%
■ Other 25,941 30,690 +18.3% Supermarket
Convenience 26.7%
Total 183,921 187,773 +2.1% store
10.8%
Sales volume by Package
(Unit: Thousand cases) Composition of Sales Figures in 2011
2010 2011 Percentage change
■ Small-sized (less than 1,021ml) 41,519 42,661 +2.8% Syrup, Powder
21.7%
■ Large-sized (more than 1,021ml)
Small-sized
PET 35,123 35,550 +1.2% PET bottle
22.7%
Subtotal 76,642 78,212 +2.0% コカ・コーラ
Other 7.6%
■ Can 54,934 55,980 +1.9% 6.8% コカ・コーラ ゼロ
その他 3.4%
■ Other 14,638 12,744 (12.9)% 35.2%
12.3%
Large-sized
ファンタ
PET bottle
4.8%
■ Syrup, Powder
Can 18.9%
37,708 40,837 +8.3% 29.8% 10.4%
Total 183,921 187,773 +2.1% 7.2%
ジョージア
21.3%
綾鷹 10.8%
2.7% 爽健美茶
Major examples of packages い・ろ・は・す /
ミナクア /
6.8%
アクエリアス
森の水だより 11.5%
6.8%
Small-sized PET bottle Large-sized PET bottle Can
Syrup, Powder
21.7%
Small-sized
PET bottle
22.7%
Other
6.8%
Large-sized
PET bottle
Can 18.9%
29.8%
10
Annual Review 2011Our Brand Lineup
Overview of Sales Results
Our investment and sales are centered on the core 8 brands—Coca-Cola, Coca-Cola Zero, Fanta, Georgia, Sokenbicha, Aquari-
us, Ayataka, and I LOHAS. We are also promoting Sprite, Huang, and Qoo to meet the diverse needs of consumers.
The core 8 brands
Coca-Cola Coca-Cola Zero Fanta Georgia
Sokenbicha Aquarius Ayataka I LOHAS
Other
16.3%
Vending その他
Food service 28.9% 12.3%
10.3%
フードサービス ベンディング
Retail store
Others 10.4% 32.1%
7.0% リテール
7.2%
Supermarket
Convenience 26.7%
コンビニエンスストア
store スーパーマーケット
10.8%
10.8% 27.2%
Sales Volume by Brand
(Unit: Thousand cases)
2010 2011 Percentage change Composition of Sales Figures in 2011
Composition of Sales Figures in 2011
Coca-Cola ■ 13,742 13,962 +1.6%
Coca-Cola
コカ・コーラ
■
Coca-Cola Zero 6,135 7.6% 6,509 +6.1% 7.4%
Coca-Cola Zero
The Core 8 Brands
コカ・コーラ ゼロ
■ Fanta その他 8,560 3.4% 8,424 (1.6)% Others 3.5%
35.2% 38.4% Fanta
12.3% 12.3%
■ Georgia
ファンタ 4.5%
38,297 4.8% 39,176 +2.3%
10.4% 10.4%
■ Sokenbicha 12,284
ジョージア
12,348 +0.5% Georgia
7.2% 7.2% 20.9%
21.3%
■ Aquarius 20,774 19,999 (3.7)%
綾鷹 10.8% 10.8%
■ Ayataka 2.7% 4,833 爽健美茶 8,298 +71.7% Sokenbicha
I LOHAS
6.8%
■ I LOHAS
い・ろ・は・す / 3.7% 6.6%
ミナクア / 5,686 アクエリアス
6,889 +21.2%
森の水だより 11.5% Ayataka
■ Others 6.8% 73,610 72,168 (2.0)% 4.4%
Aquarius
10.7%
Total 183,921 187,773 +2.1% The Core 8 Brands
61.6%
11
Annual Review 2011
シロップ、パウダー ボトルSpotlight on Our Major Brands
Overview of Sales Results
To commemorate the 125th anniversary of Coca-Cola, the revision of the Coca-Cola
“heritage” series has been released in 2011 in limited quantities. Additionally, Progression of Sales volume
promotion activities combining Coca-Cola with various foods have been held
at supermarkets, striving for an expansion of consumer drinking opportuni-
ties. Various bottle packaging such as limited winter-designed PET bottles
and 2L PET bottles perfectly sized for parties have also been released to meet
the needs of the consumers.
Revision of the “Heritage” series Winter Design “Coke & Meals” Campaign
The zero-calorie drink Coca-Cola Zero has made “zero sugar, zero pre- Coca-Cola Zero
Progression of Sales volume
servatives, zero synthetic fragrances” a reality, having rapidly growing sales
owing to the increasing number of health-conscious consumers. In 2011, by
selling sets of Coca-Cola Zero combined with
snacks in venues such as supermarkets, we
were able to promote health awareness while
having a delicious bite at the same time.
"Coke Zero & Snacks” campaign
In 2011, we reinforced the product selection of the Georgia brand, by re- Georgia
Progression of Sales volume
leasing new regional-limited products and “Wa-Style” showcasing new Japa-
nese flavors for the fall and winter season, and iced coffee and iced café au
lait products for the summer. Additionally, the consumer-participatory “Georgia
Ememan Battle” campaign, which featured four Emerald Mountain Blend
products where the consumers voted for the 1st place spot, garnered much
attention.
"Wa-Style" Regional-limited Products “Georgia Ememan Battle”
Campaign
12
Annual Review 2011Spotlight on Our Major Brands
Overview of Sales Results
Ayataka, with its renewed design and freshly brewed richness and savory Ayataka
taste, enables the consumer to have an authentic green tea experience. We have Progression of Sales volume
promoted the product through TV spots, vending machine placement, and sample
tasting at supermarkets, earning support from a wide range of consumers and
enhancing the visibility of Ayataka’s characteristics. Additionally, we have released
a new product “Maccha-Latte,” to good reviews.
Ayataka sales have steadily grown in the green tea market.
New Products
“All-Japan Ayataka Test” TV Spot Series “Maccha-Latte” New Label Design for 2011
Featured Products
Glacéau Vitaminwater
This stylish drink that enables vitamin and mineral intake
while obtaining fluids has five different types to choose from
according to one’s lifestyle and mood. We are reinforcing sales
with focus on supermarkets and drug stores.
Real Ukon
This first-ever carbonated turmeric drink has a pineapple taste
and no trace of the distinctive turmeric aroma—good news for
the consumers who have had a disliking for turmeric drinks. Ever
since its launch in October 2011, sales have been rising steadily
in convenience stores. We have also expanded sales focused on
the liquor section of supermarkets.
13
Annual Review 2011Supply Chain Management Activities
Supply Chain Management Activities
In our activities for a stable product supply and reduction of SCM (supply chain management) cost and environmental burden,
we are undergoing a variety of activities in procurement, manufacturing, and logistics.
As for procurement, we have made bottles lighter and labels thinner, focusing on environmental considerations while reducing material cost.
In manufacturing, we have heightened the extraction rate of production lines and self-manufacturing average, cutting down costs. Additionally, rein-
forced communications between the SCM department and the sales department has lead to enhanced supply-demand accuracy, resulting in a reduction
in disposal products for 2011 compared to the previous year. By investing in renewed production lines and the introduction of the in-line blow molder* 1,
we are aiming for a medium-term manufacturing cost reduction while providing for our consumers’ diverse needs.
In the logistics field, we are continuing our installation of a stock-intensive “distribution center,” which will allow streamlined distribution from our logis-
tic facilities to our consumers and customers, reducing distribution costs and allowing a long-term restructuring of the logistics process. In 2012, we will
start a new distribution network in Nagasaki and Osaka and validate the effects with a goal of full-scale expansion within our sales region.
*1 In-line blow molder: our own PET bottle-molding device
Plant Manufactured items Package Plant Manufactured items Package
Daisen Mineral water PET bottle Carbonated drink, Sports drinks PET bottle
Carbonated drink, Coffee, Tea, Sports drinks, Fruit juice Can
Kyoto
Carbonated drink, Sports drinks, Fruit juice, Lactic drink Tank*2,BIB*2
Coffee Roasting*2
Akashi Carbonated drink, Coffee, Tea, Sports drinks, Fruit juice PET bottle
*2 Articles for cup vending machines and for dispensers.
Plant Manufactured items Package
Carbonated drink, Coffee, Tea, Sports drinks, Fruit juice PET bottle
Hongo
Carbonated drink, Coffee, Tea, Sports drinks, Fruit juice Can
Plant Manufactured items Package
Carbonated drink, Coffee, Tea, Sports drinks, Fruit juice PET bottle
Carbonated drink, Sports drinks, Fruit juice Can
Kiyama
Carbonated drink Tank*2
Carbonated drink, Fruit juice Bottle
Carbonated drink, Sports drinks PET bottle
Tosu Coffee, Tea Can
Coffee Roasting*2
*2 Articles for cup vending machines and for dispensers. Distribution Centers
14
Annual Review 2011Corporate Social Responsibility Activities
Global Environmental Protection Activities
Corporate Social Responsibility Activities
Initiative for Energy Usage Reduction
Our Group is working as one toward our greenhouse gas reduction goal. As a result of activities in the Vending Machines
Department and the Transport Department, our Group’s CO2 emissions for 2011 decreased by 4% from the previous year,
showing a 25% decrease from 2004.
Efforts by Vending Machines Department
We are actively pursuing a more environmentally friendly vending The Number of Environmentally friendly Vending
machine, by implementing LED lighting and natural refrigerant that Machines
has less impact on the earth’s environment, and we have installed ■ Heat-pump method non-freon system ■ Hybr
“solar-panel equipped vending machines” and “heat-pump*1 method ■ Non-freon system
(Unit: Number)
■ Natu
■ Elec
non-freon type vending machines” with 30,000
enhanced insulation and a
50,000
46,009
300
system that uses waste heat for warming. 40,000
20,000the installed numbers of
In our endeavors to stop global warming, 30,000
29,327 200
our environmentally conscious vending machines should reach ap- 20,000 17,583
42,433
proximately 46,000 machines by the end of 2011.
10,000 28,182
100
10,000 16,703
*1 The heat-pump method: a method that uses heat emitted from the machine during Vending machine outfitted 3,576
1,145
0 that heat instead of electric
the cooling process and uses 0 880 0 0
with solar panel 2009 2010 2011
heaters to warm products efficiently.
200
Efforts by Transport Department
150
We are actively using larger vehicles
100
for more efficient distribution, The Number of Eco-cars in Operation
and implementing the Modal Shift*2 for transport between factories and
warehouses. The Group as a whole promotes
50
eco-driving such method
■ Heat-pump as idling
non-freon system ■ Hybrid cars
■ Non-freon system ■ Natural gas cars
stop, economical speed driving, and axel 0
off during speed reduction. (Unit: Number) ■ Electric cars (Unit: Number)
30,000 50,000
46,009
300
(単位:台)
Additionally, we have installed safety recorders in delivery vehicles to 257
28,859
40,000
analyze and check driving conditions, and to improve fuel efficiency and 197
20,000 29,327 200 188
implement safe driving. 30,000
42,433 191 17,583
Moreover, introduction of the zero CO2 emission
20,000 electric car and
17,583
134 140
10,000 100
streamlined distribution have contributed to our10,000
goal of fuel-usage re- 28,182
16,703
duction. 3,576 Electric car 54 54 18
48
0
880 0
1,145
0 0 3 3,820
*2 Modal Shift: To change from truck transportation to railroad transportation
2009 or shipping,
2010 2011 2009 2010 2011
which is energy saving, low pollution, and more adapted for mass trans-
200 port. 平成20年 平成21年 平成22年
CO2 Emissions 200
150
150 134
(Unit: CO2 Thousand tons)
100 100
■ Others
■ Transport Department
50
■ Vending Machines Department
25% below 26% below 50
2004 levels 2004 levels 0
0 600 (単位:台)
548 28,859
135
400 427 411
77 126 17,583
127
72 65
200 405
337 3,820
229 219
(単位:台)
0 平成20年 平成21年 平成22年
2004 2010 2011 200 2013 191
Base numbers Target
150 134 140
100
50
0
15
Annual Review 2011Corporate Social Responsibility Activities
Water Reduction Activities
We feel it is our social responsibility to pursue the efficient use of Water Usage
water, which is the base of our products and an invaluable resource. Percentage
2010 2011 Change
In 2011, we have successfully reduced water usage at all of our
factories, resulting in 7% or 5.7 L/L (Liters needed/Per product liter) Used amount (per thousand m3 ) 7,616 7,479 (2)%
less water per primary unit*. Primary unit (L/L) 6.1 5.7 (7)%
* Primary unit: water needed to create 1 liter of a product.
Waste Recycling Activities
We have actively been collecting used bottles and cans and recycling industrial waste to promote beneficial use of
all resources.
Recycling of empty containers
For the effective use of our limited natural resources, we pursue collecting empty containers from vending machines disposal bins for recycling.
At the Kita Kyushu Sawayaka Recycling Center in the Kyushu region (in operation since 2003) we endeavor to recycle resources efficiently by
separating steel cans, aluminum cans, PET bottles, and Glass bottles. We recycled about 5,000 tons of empty containers in 2011.
Empty Containers Recycling Flow
Collection Box Offices Recycling Center
Steel cans Aluminum cans PET bottles Grass bottles Paper cups Other
Paper boxes materials
Impurities Aluminum cans Clothes Recyclable bottles Toilet paper Appropriate
Equipments Aluminum Plastic products Pavement materials Paper towels disposals
products
トイレットペーパー
ペーパータオル 適正処理
Recycling of Retired Vending Machines
スチール缶
PET bottles, 衣類
再生びん
プラスチック製品
道路舗装材
All retired
Grassvending
bottles machines are recycled. In 2008 at Sawayaka Recycling Center, located in Retired Vending Machine Recycling Center in
Kita kyushuPaper region, vending machines collected from Chugoku and Kyushu regions were disassembled and sorted by materials to reuse as
iron, steel and
cup
all that. Additionally, we
● Improvement
properly collect freon gas
of efficiency and productivity
that can cause ozone layer depletion and global warming.
■ Realization of customer-origination SCM
Drink box
■ Realization of low-cost supply system
Others
Waste Recycling at Production Plants
■ Innovation in logistic process
Impurities
■ recycling
Equipment
At all of our plants, we promote sorting and Improvedofefficiency in management
indus- Volume andRate
and Recycling indirect divisions
of Waste from Production Plants in 2011
■ Realization
Aluminum cans
trial waste in order to again achieve zero emissions (with a of proper labor
waste cost
Waste type Volume Generated Recycling Rate
(Tons) Recycling Usage
recyclingAluminum
rate of ware
over 99%). Coffee grounds and tea leaves, which Coffee grounds 23,316 100.00%
account for Clothes
the most important volume among other wastes, have Tea leaves 10,123 100.00% Organic fertilizer
Grime 4,881 100.00%
been 100% recycled
Plastic article by transforming them into organic fertilizer Waste plastic 887 99.87% Recycled plastic fuel
or sub-combustible
Recyclable bottles materials. Glass 311 99.98% Recycled cullet
Metals 334 99.80% Recycled iron and steel, aluminum Cans
Pavement materials Paper 970 100.00% Cardboard, Recycled paper
Toilet paper Waste oil 12 98.95% Recycled oil
Other 166 99.83% Base course material
Paper towel Total 41,000 99.994%
Appropriate Disposal
16
Annual Review 2011Quality Assurance
Corporate Social Responsibility Activities
In order to provide safe, secure, and fresh products, we strive to maintain thoroughgoing quality management in ev-
ery aspect of our business until our products are in our consumers’ hands.
Quality Assurance
We have established a stringent quality control structure under the “KORE” management system, a system uniquely formulated by Coca-
Cola as a global standard. Starting with implementation of the International Standard (ISO9001*1, FSSC22000*2) at our manufacturing plants,
we carry out quality control in warehouses, in logistics facilities, at outlet stores, and other sales channels so our consumers are able to receive
high-quality products.
*1 ISO9001: Quality Management System
*2 FSSC22000: Food Safety Management System
Plants Distribution Stores
We produce reliable bever- We punctually and promptly We are operating from day to
ages for consumers to enjoy deliver safe, secure and high day to offer fresh and tasty
drinking. quality products. beverages.
Plants Distribution Offices Stores Consumers
Vending machines
Vending machines Maintenance Hygiene Control
We operate daily activities We treat breakdowns of We practice foolproof qual-
giving the highest priority to vending machines as a ity control to “Secure food
offer fresh beverages to our highest priority. safety”.
consumers.
17
Annual Review 2011Business Activities Contributing to Local Communities
Corporate Social Responsibility Activities
To support local residents and communities, we have installed “Community Contribution Vending Machines.” These
include “Community-Support-Type Vending Machines” and “Disaster-Response Vending Machines,” by which we as-
sist the development of local communities and safe and secure living conditions for its residents.
“Community-Support-Type Vending Machines” to support local communities
A portion of the sales revenue for the “Community-Support-Type Vending Machines” is returned to the local community to fund social con-
tribution activities, civic events, and sports organizations. 3,561 machines have been installed as of December 31, 2011.
Scheme to support local activities through Community-Support-Type Vending Machines
Portion of sales revenues
Purchase at Community-Support-Type
Donations to Activity Funds
Vending Machines
Support for welfere Support for Town Development Support for Tourism Support for Environment Support for Professional Sports
Special Olympics Nippon (SON) Nara Shoudo Osaka supporting vending Chikujo-cho tourism supporting Settsu-shi environmental-support INAC Kobe Leonessa supporting
region supporting vending machine machine vending machine vending machine vending machine
Other examples Other examples Other examples Other examples Other examples
● Special Olympics Nippon Shiga Es- ●
Shiraishi-cho town development ●
Awaji-island fiesta ●
Greening of Fukuoka-shi ●
Gamba Osaka
tablishment preparation committee ●
Unan-shi town development ●
Shimonoseki tourism ●
Environmental conservation and ●
Serezo Osaka
● SON Wakayama ●
Taku-shi town development research for nihonawa coral ●
Sanfrecce Hiroshima
● SON Osaka ●
Avispa Fukuoka support
“Disaster-Response Vending Machines” to provide relief during emergencies
In the event that supply lines are severely disrupted by earthquakes or other disasters, “Disaster-Response Vending Machines” provide free
soft drinks to residents by remote control via personal computers from local administrative offices. These machines are also outfitted with
digital displays that can provide real-time information on emergency evacuation sites and maps. As of December 31, 2011, we have installed
a total of 266 “Disaster-Response Vending Machines” to contribute to the safety of local residents.
Disaster-Response
Vending Machine
Scheme of Disaster-Response Vending Machines
Delivery of Disaster (Principal Municipalities in implementing)
Disaster Strike Municipalities Free Drink Supply Information Messages ● Kyoto
● Daisen-cho, Tottori
● Yasugi-shi, Shimane
● Okawa-shi, Fukuoka
18
Annual Review 2011Together with Local Communities
Corporate Social Responsibility Activities
The Group conducts various social activities as a corporate citizen to- Resolutions of the general meeting of shareholders
gether with local communities in our sales territory (14 prefectures). Appropriation of funding retained earnings
We carry out continuous actions on approval of shareholders. ■ Dividend
● Reserves for local communities’ contribution
■ Reserve fund ● Reserves for local communities’ environmental protection
■ Retained earnings at beginning
Local communities’ contribution activities
Under our basic stance, “With local communities”, we encourage the healthy development of youth and also encourage closer commu-
nication with communities. Our four major supporting activities are social welfare, sports activities, cultural and educational activities, and
major regional events.
■ Donation of Educational Materials to ■ Donation of Unicycles to Elementary Schools ■ Rugby Clinic
Special-Needs Schools With our wish for children as leaders of the next Our rugby club members provide guidance for
We have been donating information equipment generation to grow healthily and to acquire coopera- high-school students to help improve their rugby
(computers and peripherals) to special-needs schools tiveness and patience through sport activities, we skills. This guidance is of help to them in under-
since 1993 to help mentally and physically disabled have been donating unicycles to public elementary standing the safety of the game and the importance
students gain self-reliance. In 2011, we donated schools since 1994. Unicycles are appreciated as of fundamentals by implementing a clinic with both
teaching tools to 14 schools in our sales territory. effective sporting equipment to develop the nervous students and coaches.
system and to improve reflex nerves. Unicycle-riding
is part of the Ministry of Education, Culture, Sports,
Science and Technology curriculum guidelines, and
is considered one of the tools children can use and
for fun.
We donated 1,000 unicycles to 100 schools in our
sales territory in 2011.
■ Classical Music Concerts ■ Family Musicals ■ Ichimura Shizenjuku-Kyushu
To create an affluent society (cultivation of spiritual During the summer holidays since 2000, we hold The school has been supporting healthy develop-
human resources), we have been sponsoring “Coca-Cola “Coca-Cola West Family Musicals” as an activity to ment and growth of children under the basic ideal
West Classic Concert” for local residents since 1989 foster the bond between parents and children where of “Learn energy to live from the earth” since it was
to enjoy live performances of the finest classical mu- children and their parents can enjoy musical perfor- launched in 2003. Through farming activities and
sic. mances. communal life, the program offers children some op-
In 2011, we held “Wiener Ring Ensemble New In 2011, we held, at three locations, in Fukuoka portunities to learn moral principles and to promote
Year Concert” in Fukuoka and “Franz Liszt Chamber Prefecture, in Hiroshima Prefecture, and in Osaka independence and creativity.
Orchestra & Hiroko Koda (Soprano)” in Osaka, where Prefecture, “Rudolf and Ippaiattena,” , which is based
masterful performances were offered and local resi- on the children’s book read for nearly 25 years. We
dents we invited enjoyed the fantastic concerts. invited local residents and their families had a pleas-
ant time.
19
Annual Review 2011Corporate Social Responsibility Activities
Local environment improvement activities
We recognize global environmental protection as one of the crucially important issues, and therefore, we contribute to the develop-
ment of sustainable society with the slogan of “Sawayaka for people and the environment (Fine people and Pleasant environment).”
■ Conservation Activities at “Sawayaka Shizen-no-Mori” ■ Mt. Daisen “Environmental Class of Water”
With the aim of recharging irreplaceable clean water resource produced from for- As a corporation utilizing irreplaceable clean water, we hold an environ-
ests, we have been conducting forest conservation activities at “Sawayaka Shizen- mental class so that children can increase understanding of forest-produced
no-Mori” since 2006, under co-management agreements with the communities in water and the global environment.
the suburbs of our all plants. In 2011, 90 elementary school students from Kansai, Chugoku, and Kyushu
In 2011, about 200 participants, including our employees and their families areas participated, as a place of activity with the Daisen factory, a factory for
together with local citizens, gathered to thin trees, to improve cutting, and to build water located in Mt. Daisen, which is the highest mountain in the Chugoku
trails at 5 locations in Kyoto, in Hyogo, in Tottori, in Hiroshima, and in Saga. Mountains, and at the foot of Mt. Daisen. The children had a valuable experi-
ence not perceivable in daily life by seeing the process of manufacturing the
natural mineral water “I LOHAS” and visiting facilities introducing the nature,
history, and culture of Mt. Daisen.
■ Support for Tree Planting Activities ■ Summer School of Ecological ■ Local Community Cleanup Activities
We perform a tree-planting activity “Create an Experiences Our employees of each business establishment
Acorn Forest” as a part of environmental and edu- We hold learning programs on natural environment proactively participate in Local Community Cleanup
cational support programs for local communities. so that children as leaders of the next generation can Activities organized by each municipality, considering
Through these programs, children and local residents understand the splendor and richness of nature with them as occasions to communicate directly with lo-
gained understanding of the importance of nature actual experiences. cal residents.
and environment conservation. At the same time, we In 2011, 30 elementary school children from In 2011, about 650 employees and their families
consider these activities could prevent global warm- Fukuoka Prefecture and Saga Prefecture and 30 took part, at 7 locations, in our sales territory, thereby
ing through an increase of greenhouse gas absorp- elementary school children from Kyoto participated contributing to local beautification. We will continue
tion. in a two-day, one-night program. Children learned participating in these activities and strive to contrib-
We planted 440 new broadleaf trees, such as about relations between lives and forests as well ute to a community.
quercus serrate and oak trees, according to the local as the importance of the water-retaining function of
vegetation in 2011. forests with the help of expert instructors.
20
Annual Review 2011Financial Information
Analysis on Operating Results
Financial Information
Outline of Business Results of Fiscal 2011
Operating Results prepaid pension costs and provision for retirement benefits, which had formerly
been recorded by each plan, were netted. This resulted in prepaid pension costs
■ Net Revenues and provision for retirement benefits decreasing by the same amount, which are
In the soft drink business, although we faithfully engaged in finely tuned mar- the main reasons for decreases in total assets and liabilities.
keting activities according to the characteristics of each channel, net revenues
decreased slightly, due primarily to the effect of declining product prices. Mean- ■ Net Assets
while, we acquired the shares of Q’ SAI, CO., LTD. on October 1, 2010, and since Net Assets as of the end of the fiscal year increased by ¥1,597 million, or 0.7%,
then it and its five subsidiaries have been included in the scope of consolidation. from the end of the previous fiscal year, to ¥227,864 million. This is mainly attrib-
Consequently, the total net revenues of segments increased by ¥23,952 million, utable to net income for the fiscal year.
or 6.4%, from the previous fiscal year, to ¥399,717 million.
■ Consolidated Cash Flows
■ Operating Income
Net Cash provided by Operating Activities
In addition to the aforementioned effect of newly consolidated companies, we Net cash provided by operating activities resulted in a cash inflow of ¥39,960
reduced manufacturing costs through such methods as starting in-house PET million (25.9% increase compared to the previous fiscal year). Due primarily to
bottle production and improved productivity by reorganizing the personnel struc- the impacts of an increase in income before income taxes, minority interests, and
ture. Consequently, operating income increased by ¥4,466 million, or 37.2%, other adjustments and an increase in notes and accounts payable-trade in the
from the previous fiscal year, to ¥16,469 million. soft drink business, net cash provided by operating activities for the fiscal year
increased by ¥8,227 million from the previous fiscal year.
■ Recurring Income
Due primarily to an increase in operating income, recurring income increased Net Cash provided by (used in) Investing Activities
by ¥3,384 million, or 26.7%, from the previous fiscal year, to ¥16,044 million. Net cash provided by (used in) investing activities resulted in a cash outflow of
¥34,050 million (compared to a cash outflow of ¥49,203 million for the previous
■ Net Income fiscal year). The acquisition of the shares of Q’ SAI, CO., LTD. in the previous fis-
Although recurring income increased, net income decreased by ¥584 million, cal year has a major impact on net cash provided by (used in) investing activities,
or 7.7%, from the previous fiscal year, to ¥6,997 million. This was mainly attrib- causing a difference of ¥15,153 million between the cash outflows of the fiscal
uted to the recording of extraordinary losses in relation to adjustment for changes year and the previous fiscal year.
of accounting standard for asset retirement obligations, and the occurrence of
loss on retirement of noncurrent assets. Net Cash provided by (used in) Financing Activities
Net cash provided by (used in) financing activities resulted in a cash outflow of
Financial Position ¥8,780 million (compared to a cash outflow of ¥16,316 million for the previous
fiscal year). The partial repayment of long-term loans payable of Q’ SAI, CO., LTD.,
Equity ratio as of the end of the fiscal year stood at 66.4%, so we deem that
the company’s consolidated subsidiary, at the time of refinancing has a major
we continue to maintain financial soundness.
impact on net cash provided by (used in) financing activities, causing a difference
of ¥7,535 million between the cash outflows of the fiscal year and the previous
■ Assets and Liabilities
fiscal year. As a result, cash and cash equivalents as of the end of the fiscal year
Total assets as of the end of the fiscal year decreased by ¥3,471 million, or decreased by ¥2,870 million, or 7.7%, from the end of the previous fiscal year, to
1.0%, from the end of the previous fiscal year, to ¥342,560 million. ¥34,564 million.
Total liabilities as of the end of the fiscal year decreased by ¥5,069 million, or
4.2%, from the end of the previous fiscal year, to ¥114,695 million. Upon unifi-
cation on January 1, 2011 of the retirement benefit plans of the company and
consolidated subsidiaries engaging in the soft drink business, which had been dif-
ferent among pre-merger companies (Coca-Cola West Japan Co., Ltd., Kinki Coca-
Cola Bottling Co., Ltd., and Mikasa Coca-Cola Bottling Co., Ltd.), the amounts of
Net Revenues Operating Income Net Income
(Unit: Millions of Yen) (Unit: Millions of Yen) (Unit: Millions of Yen)
500,000 20,000 10,000 9,375
409,521 395,556 399,717 16,056 16,469
8,000 7,582
400,000 369,698 375,764 6,997
15,000
12,003 6,000
300,000 10,521
10,000 4,000
200,000
2,000
5,000 129
100,000 2,242 0
0 0 (10,000) (7,594)
2007 2008 2009 2010 2011 2007 2008 2009 2010 2011 2007 2008 2009 2010 2011
21
Annual Review 2011Segment Information
Financial Information
Business Results by Business Segment
■ Soft Drink Business
As for product strategy, we concentrated our investment in core 8 brands and strengthened sales activities to expand sales. With regard to channel strategy,
we expanded sales by proactively using coolers or racks to raise the number of selling places in supermarkets, as well as by displaying small-package products
to increase immediate consumption opportunities. For vending channel (vending machines), we worked on the expansion of sales per machine by developing
product lineups and setting prices according to the features of the locations.
Moreover, based on a strategic partnership with the Coca-Cola Company and Coca-Cola (Japan) Co., Ltd., we have reinforced marketing cooperation and
promoted various efforts to achieve the sustainable growth of the Coca-Cola business.
With regard to SCM, we developed the supply system in line with business strategies to reduce unsellable products. Also, we engaged in capital investment
through such methods as updating manufacturing equipment and introducing new technologies, and achieved productivity improvement and the resultant cost
reduction.
As a result, in fiscal 2011 net revenues and operating income for the segment amounted to ¥363,469 million and ¥11,475 million, respectively.
■ Health Foods Business
The Group’s health foods business is conducted by Q’ SAI, CO., LTD., the company’s subsidiary, and its five subsidiaries.
As for product strategy, focusing on healthcare products “Hyaluronan collagen” and “Peptide ace (Food for Specified Health Uses)” and skin care products
“Basic skin care,” we used advertising expenses, taking into account efficiency, to attract new consumers and encourage existing consumers to continue to use
our products. In addition, with the aim of expanding sales in the mail order channel, which is the main sales channel for the products, we changed the order
acceptance system to improve our capacity to meet consumer needs and focused on training telephone communicators, who function as contact points with
consumers.
As a result, in fiscal 2011 net revenues and operating income for the segment amounted to ¥34,788 million and ¥4,989 million, respectively.
■ Other Businesses
Other businesses formerly consisted of the transportation business (general cargo) and the food service business. However, for the purpose of the concen-
tration of management resources of the Group, on November 18, 2011 we transferred all the shares of Akiyoshi Systems Co., Ltd., which engages in the food
service business.
In fiscal 2011 net revenues and operating income for the segment amounted to ¥1,458 million and ¥5 million, respectively.
(Unit : Millions of Yen)
2010 2011
Soft Drink Business Health Foods Business Other Businesses Total Soft Drink Business Health Foods Business Other Businesses Total
Net revenues ¥365,680 ¥8,378 ¥1,705 ¥375,764 ¥363,469 ¥34,788 ¥1,458 ¥399,717
Segment income*1 ¥10,809 ¥1,124 ¥69 ¥12,003 ¥11,475 ¥4,989 ¥5 ¥16,469
(Unit : Thousands of U.S. Dollars)*2
2010 2011
Soft Drink Business Health Foods Business Other Businesses Total Soft Drink Business Health Foods Business Other Businesses Total
Net revenues $4,745,394 $108,730 $22,128 $4,876,253 $4,716,709 $451,449 $18,930 $5,187,089
Segment income*1 $140,270 $14,597 $895 $155,764 $148,916 $64,744 $65 $213,726
*1 Segment income concurs with operating income in the consolidated statements of income.
*2 Amounts in U.S. dollars are presented for the purpose of convenience only. Exchange rate of 77.06 yen against the U.S. dollar (as of December 31, 2011; amounts less than one unit are truncated) is
used for conversion.
Net Revenues Composition Ratio for 2011 Operating Income Composition Ratio for 2011
0.4% 0.0%
8.7%
30.3%
■ Soft Drink Business ■ Soft Drink Business
■ Health Foods Business ■ Health Foods Business
90.9% ■ Other Businesses 69.7% ■ Other Businesses
22
Annual Review 2011You can also read