Warming responses of two native Icelandic species, Ranunculus acris and - Thymus praecox ssp. arcticus in
←
→
Page content transcription
If your browser does not render page correctly, please read the page content below
    Warming responses of two native
 Icelandic species, Ranunculus acris and
     Thymus praecox ssp. arcticus in
            geothermal areas

              Nia Sigrun Perron

Faculty of Life and Environmental Sciences
          University of Iceland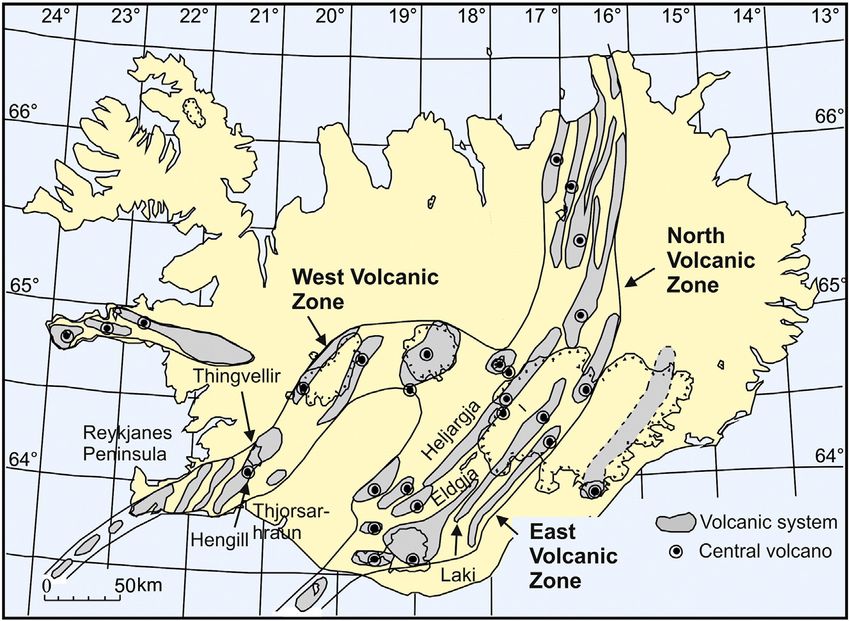

Warming responses of two native Icelandic
    species, Ranunculus acris and Thymus
   praecox ssp. arcticus in geothermal areas

                      Nia Sigrun Perron

       60 ECTS thesis submitted in partial fulfillment of a

Magister Scientiarum degree in Environment and Natural Resource

 Specialization: Environmental Management, Science and Policy

                         MS Committee

                     Bryndís Marteinsdóttir

                    Þóra Ellen Þórhallsdóttir

                       Master’s Examiner

                  Dr. Hafdís Hanna Ægisdóttir

           Faculty of Life and Environmental Sciences

           School of Engineering and Natural Sciences

                      University of Iceland

                     Reykjavik, June 2017

                                ii
Warming responses of two native Icelandic species, Ranunculus acris and Thymus praecox
ssp. arcticus in geothermal areas.
Warming responses of two native Icelandic species in geothermal areas
60 ECTS thesis submitted in partial fulfillment of a Magister Scientiarum degree in
Environment and Natural Resource Specialization: Environmental Management, Science
and Policy

Copyright © 2017 Nia Sigrun Perron
All rights reserved

Faculty of Life and Natural Science
School of Engineering and Natural Sciences
University of Iceland
Sturlugata 7
101, Reykjavik
Iceland

Telephone: 525 4000

Bibliographic information:
Perron, N.S., 2017, Warming responses of two native Icelandic species, Ranunculus acris
and Thymus praecox ssp. arcticus in geothermal areas, Master’s thesis, Faculty of Life and
Natural Science, University of Iceland, pp. 59.

Printing: Háskólaprent
Reykjavik, Iceland, June 2017

                                             iii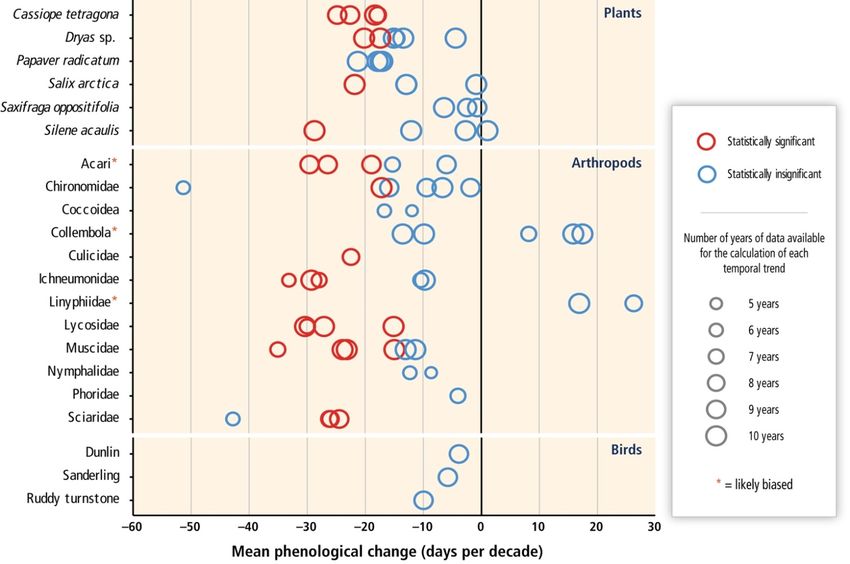
Abstract
Global average temperature is predicted to increase from 0.3 - 4.8ºC by 2100, resulting in
higher soil temperatures. My objective was to determine 1) how native Icelandic plant
species, Ranunculus acris and Thymus praecox ssp. arcticus may respond to soil warming
in three geothermal sites, 2) if these responses affect plant fitness, and 3) whether
responses are site specific. Geothermal areas provide natural temperature gradients within
small geographic areas where soil temperature can be isolated from other variables. Each
site has soil temperatures ranging from 9ºC to 49ºC, but they differ in elevation and the
time since warming started. Plant phenology, fitness and functional traits were recorded for
both species at each site. Linear mixed models were used to describe the relationship
between plant traits and soil temperature, revealing that warming responses were species
and site specific. At the low elevation/short-term warmed site, temperature affected fitness
and height of both species. At the low elevation/long-term warmed site, temperature
affected R. acris fitness, size and height, and T. praecox phenology. In the high
elevation/long-term, warmed site (Hen) temperature affected T. praecox phenology and
size. Temperature effects on fitness were partly mediated by the effect of temperature on
two plant traits, height and size, where resource allocation to reproduction lead to a
decrease in vegetative growth and vice versa. This study highlights the complexity of plant
responses to warming in subarctic environments and encourages research into whole-
ecosystem responses to warming using geothermal systems.

Keywords: Climate change, global change, phenology, fitness, Ranunculus acris, Thymus
praecox, geothermal warming, natural gradients

                                             iv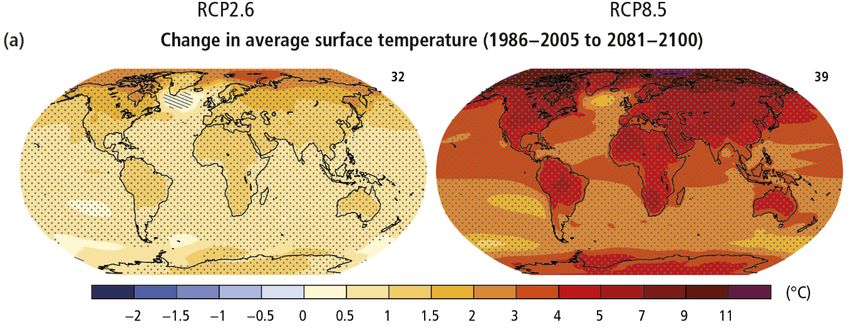
Útdráttur
Því er spáð að lofthiti jarðar muna að meðaltali vera 0,3-4,8ºC hærri árið 2100 en nú.
Mikilvægt er að skilja hvaða áhrif þessi hlýnun mun hafa á lífríki. Svæði þar sem
jarðvegurinn er hitaður upp af gufum frá jarðvarma skapa einstakar aðstæður til að
rannsaka þetta. Markmið þessa verkefnis var að ákvarða hvaða áhrif jarðvegshlýnun hefur
á brennisóley (Ranunculus acris) og blóðberg (Thymus praecox ssp. arcticus) á þremur
jarðvarmasvæðum á Íslandi. Innan hvers svæðis voru merktar 60 plöntur af hvorri tegund,
sem uxu við hitastig frá 9 ºC til 49 ºC. Fyrir hverja merkta plöntu var skráð hver langt hún
var komin í þroskunarferlinu og hæfni og stærð hennar mæld. Almennt þroskuðust plöntur
fyrr við hærra hitastig, en áhrif jarðvegshita á hæð, stærð og hæfni voru mismunandi eftir
tegundum og svæðum. Brennisóleyjarplöntur minnkuðu með hærri jarðvegshita á tveimur
svæðum og blóðbergsplöntur urðu hærri á einu svæði en minnkuðu á öðru. Jarðvegshiti jók
hæfni brennisóleyjar en dró úr hæfni blóðbergs, en aðeins á sumum svæðanna. Þessi
rannsókn sýnir að viðbrögð plantna við hlýnun eru flókin og breytileg eftir tegundum,
svæðisbundnum aðstæðum, t.d. hæð yfir sjávarmáli og því hversu lengi hlýnunin hefur
hefur átt sér stað.

                                             v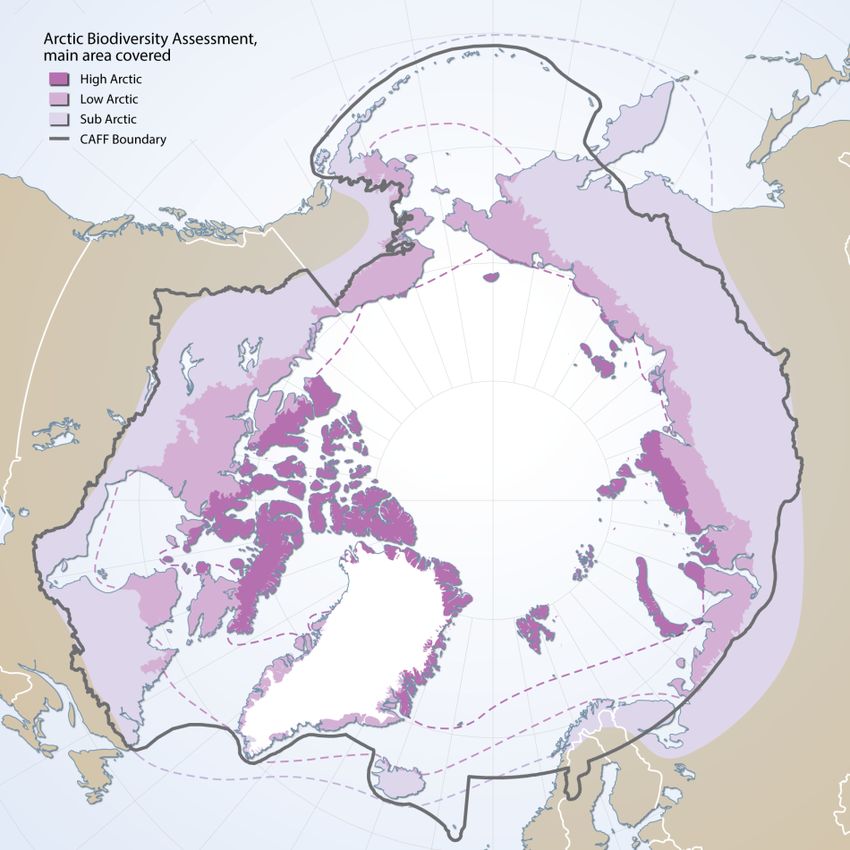
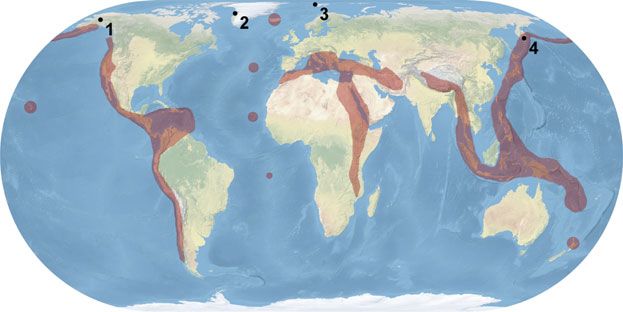
Table of Contents
List of Figures .................................................................................................................................................... ii


List of Tables .................................................................................................................................................... iii


Abbreviations ................................................................................................................................................... iv


Acknowledgements ........................................................................................................................................... v


1
   Theoretical Background ............................................................................................................................. 1

      1.1
   The Arctic .......................................................................................................................................... 1

      1.2
   The Arctic and Climate Change ......................................................................................................... 2

      1.3
   Plant Responses to Arctic Warming .................................................................................................. 4

             1.3.1
   Change in distribution patterns ............................................................................................... 5

             1.3.2
   Change in plant phenology ..................................................................................................... 6

             1.3.3
   Phenotypic plasticity and adaptive evolution ......................................................................... 7

      1.4
   Predicting Future Changes ................................................................................................................. 8

             1.4.1
   Warming Studies .................................................................................................................... 8

             1.4.2
   Transplant and Common Garden Studies ............................................................................. 10

             1.4.3
   Modeling ............................................................................................................................... 11

      1.5
   Geothermal Areas ............................................................................................................................ 12

      1.6
   Iceland .............................................................................................................................................. 13


2
   Warming responses of two native species, Ranunculus acris and Thymus praecox ssp. arcticus
      in geothermal areas, Iceland .................................................................................................................... 17

      3.1
   Introduction ...................................................................................................................................... 17

             3.1.1
   Objectives ............................................................................................................................. 19

      3.2
   Methods ........................................................................................................................................... 19

             3.2.1
   Study Sites ............................................................................................................................ 19

             3.2.2
   Study Species........................................................................................................................ 21

             3.2.3
   Plant Measurements .............................................................................................................. 22

             3.2.4
   Environmental Parameters .................................................................................................... 24

             3.2.5
   Statistical Analysis ............................................................................................................... 24

      3.3
   Results .............................................................................................................................................. 25

             3.3.1
   Plant response to soil temperature ........................................................................................ 25

             3.3.2
   Soil warming and the selection for traits that will effect plant fitness ................................. 28

      3.4
   Discussion ........................................................................................................................................ 28

             3.4.1
   Trait responses to soil warming ............................................................................................ 29

             3.4.2
   Site Conditions ..................................................................................................................... 32

      3.5
   Conclusions ...................................................................................................................................... 34


References ........................................................................................................................................................ 35


Appendix A: Trait correlations ..................................................................................................................... 35


Appendix B: Effect of soil temperature on correlated traits for each site ................................................. 48


Appendix C: Path analysis for all traits, including those that were correlated ........................................ 50

                                                                                    i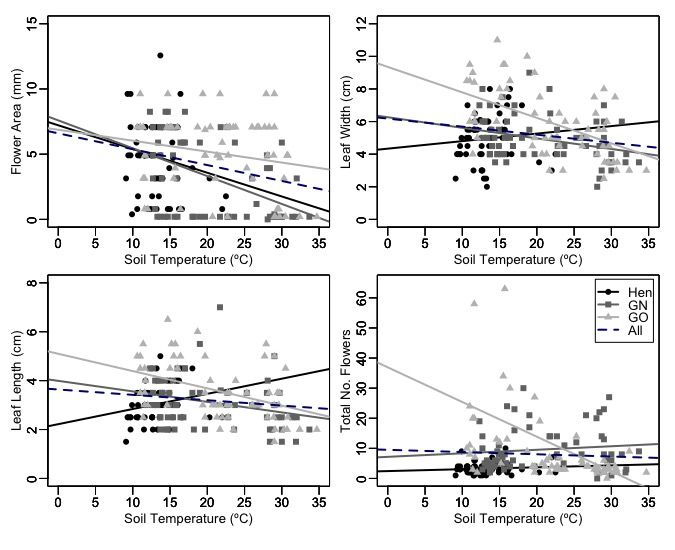
List of Figures
Figure 1: High, Low and Sub - Arctic, and geographic Arctic circle, northern treeline
and 10 ºC July isotherm. ......................................................................................... 1
Figure 2: Predicted changes in average surface temperatures between 1986-2005 to
2081-2100 under the most and least modest climate change scenario. .................. 3
Figure 3: Schematic of the predicted changes within Arctic biomes as a result of
climate change......................................................................................................... 4
Figure 4: Changes in flowering onset for six species between 1996 and 2005 in the
high-Arctic of Greenland. ....................................................................................... 6
Figure 5: Map of geothermal areas around the world representing the hottest areas,
including high-latitude ecosystems. ...................................................................... 13
Figure 6: Map of Iceland´s main volcanic zones, systems and central volcanos. ................... 14
Figure 7: Location of study sites within Iceland. ..................................................................... 19
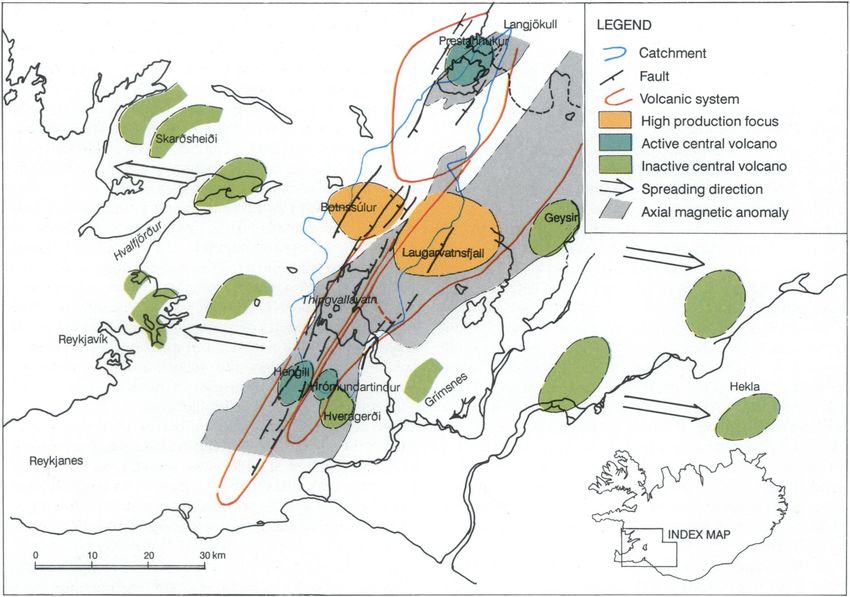
Figure 8: The Thingvallavatn catchment of SW-Iceland, major faults, volcanic
systems including Hengill, Hrómundartindur and Hveragerði, as well as
active and extinct central volcanoes...................................................................... 20
Figure 9: Plant phenology, fitness, plant size, and plant height of R. acris across the
three study sties; Hengill, GN and GO, and all three sites together. .................... 26
Figure 10: Plant phenology, fitness, plant size, and plant height of T. praecox across
the three study sties; Hengill, GN, and GO, and all three sites together............... 27
Figure 11: Results of the likelihood ratio test comparing models. a) model with
height and fitness for R. acris at GN, b) model for height and fitness for
R. acris from GO, c) model for total plant size for R. acris from GO, d)
model for plant height and fitness, measured with the average number of
seeds for each flower for T. praecox from GN. .................................................... 28
iiList of Tables
Table 1: Site conditions for GN, GO and Hengill including short-term versus long-
term warming, elevation, GPS corrdinates, mean annual temperature,
mean annnual precipitation, and the presense of sheep grazing. The
sample size, and temperature gradients from control to T5 for both R.
acris and T. praecox at each site. .......................................................................... 21
Table 2: Phenological stages for R. acris. ................................................................................ 23
Table 3: Phenological stages .................................................................................................... 23
Table 4: The best fit models for R. acris and T. praecox across the three geothermal
sites combined. The models compared included one with interaction
between sites, one without interaction but with temperature and site as
fixed variables, and the models with only one of the two fixed variables. ........... 25
Table 5: Results of linear mixed effect models for R. acris and T. praecox across
each of the three sites individually as well as results from the comparison
for the model using temperature as the fixed variables, measured plant
traits as the response variables (phenology, fitness, size and height) and
soil moisture as the random effect. ....................................................................... 26
iiiAbbreviations
ACIA -Arctic Climate Impact Assessment
CAFF -Conservation of Arctic Flora and Fauna
ENMs -Ecological Niche Models
GN -Grassland New
GO -Grassland Old
Hen -Hengill
IPCC -Intergovernmental Panel on Climate Change
ITEX -International Tundra Experiment
LMM -Linear mixed effect models
LT -Long-term
NDVI -Normalized Difference Vegetation Index
SEM -Structural Equation Models
ST -Short-term
STS -Space for time substitutions
ivAcknowledgements
This project would not have been possible without the support, encouragement, and direct
help from several people. I would like to take the time to thank some of the people who
became part of this project in some way or another.
I would to start by thanking my advisor Bryndís because without her this project would not
have been possible. Bryndís, I am so glad that you decided to reach out and look for a
student to take on this project. From the moment I heard about the position, I knew it
would be something I would enjoy. I am very grateful that you chose to take me on as a
student. What I did not expect was how much I would enjoy working with you. Having a
mentor that is a young female researcher was probably one of the most valuable things I
will take away from this project. With your guidance, I will continue to pursue a path in
research with the goal of someday inspiring a young student in the way that you have
inspired me.
Þóra Ellen, thank you for agreeing to take me on as a student. I was honoured to have the
opportunity to work with someone with your wealth of knowledge and experience. With
your guidance, I have learnt so much about how to bring together a story in a compelling
way.
Of course, I owe Martina a debt of gratitude for her support with this project. Martina
thank you for listening to me complain about R during our coffee breaks all year. Having
someone who understands my frustration was so valuable. I also have not forgotten how
much you helped me with QGis. What may have seemed like an easy task to you would
have taken me hours to figure out, so thank you for taking that time to help me out.
Bjarni and ClimMani. Thank you for the opportunity to participate in the FORHOT
workshop and conference. It was an important opportunity for me to put my research into
perspective and understand how it fits in with a larger research group. Based on the
experience at this workshop I know that I will want to participate in collaborative research
in the future.
Finally, to my friends and family thank you for offering the endless reassurance that I
could in fact accomplish the goal of finishing this project. Your support helped me keep
my sanity when things started to look grim.
v1 Theoretical Background
1.1 The Arctic
The Arctic encompasses areas from Eurasia to North America, with diverse land and
seascapes that make up a single complex and integrated system. The definition of the
Arctic is variable, with disciplines setting different southern limits (ACIA 2005). There are
sociopolitical interpretations, including the Arctic Circle based on the latitudinal gradient
(66º33’North) or the definition established by the Conservation of Arctic Flora and Fauna
(CAFF). Transportation and shipping routes use a definition that is based on a marine
context. For natural scientists the Arctic tundra can be defined as the area beyond the
treeline which, in continental areas corresponds closely to the climatological interpretation
which uses the 10 - 12ºC mean daily July isotherm (Löve 1970; ACIA 2005; Meltofte et
al. 2013). The Arctic includes; the high Arctic in the north with sparsely vegetated lowland
areas and Polar deserts; the low Arctic further south, with lush vegetation and tundra
ecosystems and the transition into the subarctic below the treeline and the 10 ºC July
isotherm that encompasses the boreal forest-tundra biome (Löve 1970; Meltofte et al.
2013; IPCC 2014; Figure 1).
Figure 1: Geographic extent of the high, low and subarctic, defined by CAFF, along with the boundary of the
CAFF itself. High and low the Circumpolar Arctic Vegetation Mapping Project defined Arctic terrestrial
boundaries - Bioclimatic subzones. Subarctic boundary was defined by the Arctic Biodiversity Assessment.
Source: http://geo.abds.is/geonetwork/srv/eng/catalog.search#/home
1Three distinct types of landforms dominate the Arctic landscape composition; (i) uplands shaped by ice sheets leading into fjords, (ii) flat plains or plateaus with glacial, alluvial or marine deposits, and (iii) mountain ranges in the forms of peaks or rounded slopes. Climate of the Arctic and subarctic regions are greatly influenced by absence of sunlight throughout the winter months and continuous sunlight in the summer. The region is highly dependent on the cryosphere, with snow and ice playing a prominent role in the determination of both regional and global climate (Dicks et al. 2013). This reliance on the cryosphere makes the Arctic particularly vulnerable to disturbances because of small changes in temperature (ACIA 2005). The environmental conditions of the Arctic are characterised by significant environmental variability on both spatial and temporal scales, with steeper temperature gradients than in any other biome (Wielgolaski 1997). For example, average summer temperatures as well as thawing soil layers will vary significantly over a small geographic area, with a large impact on the terrestrial plant composition. This is seen in northern Siberia where the average July temperature varies by 10 ºC over 900 km, a similar temperature change would require over 2000 km in the boreal zones (ACIA 2005). Instead of a homogenous region, the Arctic is composed of distinct regional climates with specific ecological conditions (Wielgolaski 1997). Unique local conditions, such as soil type and temperature, create microclimates within the larger macroclimate communities, creating the diverse ecosystem structure (Wielgolaski 1997). These variations in local conditions lead to abundant structural diversity in the landscape that follow a latitudinal gradient with temperature from the boreal-tundra transition of the subarctic, to the polar desserts in the high Arctic (Wielgolaski 1997; ACIA 2005). This small scale heterogeneity makes some Arctic environments more vulnerable to climate change as population size and range are relatively restricted by local conditions (ACIA 2005; Forbes 2015). As a result of low mean summer temperatures and a short growing season, net primary productivity, net ecosystem productivity, decomposition rates, and species diversity are low in Arctic regions. Thus, mean summer temperature is one of the environmental variables that best predict plant diversity of the Arctic mosaic (ACIA 2005). Arctic communities have developed specific adaptations to Arctic conditions and can cope with freezing temperatures, ice encapsulation, low summer temperatures, short and late growing seasons, inter annual variability, and snow cover. However, despite these adaptations, the low species diversity of Arctic communities, means these ecosystems are sensitive to even minor departures from typical climatic conditions (ACIA 2005). Thus, climate change will likely have harsh effects on organisms in the Arctic. 1.2 The Arctic and Climate Change Anthropogenic climate changes are expressed as increasing average temperatures, rising sea levels, altered precipitation/hydrological patterns, as well as more frequent and extreme weather events globally (IPCC 2014). These changes are amplified in the global poles where regional warming is nearly twice as high in the Arctic compared to the global average (ACIA 2005; IPCC 2014; Figure 2). In 2015 the average global land surface temperature was +0.7ºC (± 0.18ºC standard error) relative to the baseline between 1981 and 2010, while the Arctic experienced a 1.2ºC increase in average land surface temperatures in 2015 relative to the same base period (IPCC 2014). Changes to terrestrial ecosystems in the Arctic and subarctic are already apparent because of warming 2
conditions. These changes range from general trends showing a greening of the Arctic, to
specific species level changes, such as local extinction (IPCC 2014). These changes are
highly dependent on site characteristics. For example, the advancement of woody and
herbaceous plants is influenced by local factors such as warming, herbivory, precipitation
and land use patterns, therefore the advancement has been heterogeneous across the Arctic
(IPCC 2014).
Figure 2: Change in average surface temperature based on projections for 2081–2100 relative to 1986–2005
under the RCP2.6 (left) and RCP8.5 (right) scenarios. (IPCC 2014).
Changes to the Arctic are of global concern because their impacts are not restricted to
Arctic regions. The global climate regime is dependent on processes such as the earth’s
energy balance and the oceanic circulation system, both which are maintained by
conditions in the Arctic (ACIA 2005). Climate modeling suggests that as a result of
feedback processes warming will continue into the future, with greater changes occurring
in the winter (ACIA 2005; Winton 2006; Bony et al. 2006; Koenigk et al. 2013). For
example, decreases in annual snow cover in the Arctic mean that reflective surfaces will be
replaced by darker land and water surfaces that have the ability to absorb more solar
radiation, triggering a feedback mechanism and accelerating the warming process further
(ACIA 2005; Winton 2006). It is predicted that Arctic surface temperature over land area
will increase by 2.2 ºC during summers months and up to 5 ºC by 2100 (RCP4.5 Scenario,
+1.8 ºC), while the global average is estimated to range from 1.1 to 2.6 ºC (RCP4.5
Scenario, +1.8 ºC; IPCC 2014; IPCC 2015).
This warming is likely to result in significant changes unique to Arctic environments, such
as a reduction in sea ice cover, melting of glaciers, and thawing of permafrost, as well as
general global changes, such as increases in soil temperatures (ACIA 2005; Hinzman et al.
2005). This warming will be accompanied by an increase in annual precipitation (25% in
the winter, 15% in the summer; (ACIA 2005; Hinzman et al. 2005; IPCC & Stocker 2014).
Arctic ecosystems will be influenced by these warming conditions with an extension of
regional growing seasons, and potential shifts in the range of species distribution.
However, the response of individual species is difficult to estimate (ACIA 2005; Hinzman
et al. 2005; IPCC 2014; Franks, Weber & Aitken 2014; Figure 3). Some plant species may
be ill adapted to cope with modern climate change, whereas other species may thrive.
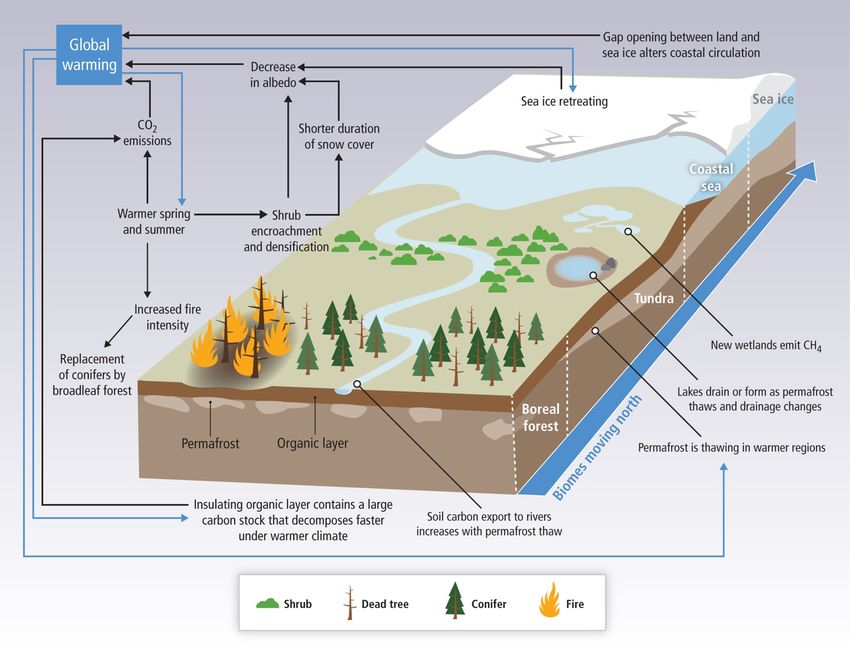
3Figure 3: Changes in the boreal-tundra biome, as a result of global change and warming in Arctic and subarctic environments. This includes a northern shift of Arctic vegetation, with the boreal moving into tundra areas. There will also be changes in surface energy balance, carbon balance and emissions, leading to increased feedbacks and more climate change (IPCC 2014). 1.3 Plant Responses to Arctic Warming Changing environmental conditions will have substantial effects on ecosystems in the Arctic. Terrestrial plant communities can be studied to determine how short term changes (years and decades) in local climate will influence species responses (Primack & Kang 1989). Primary production, or the abundance and diversity of plant species, are the building blocks for entire ecosystems and are vital for maintaining population dynamics (ACIA 2005). Warming temperature is likely to have a direct impact on species, as well as on the trophic relationships between populations. For example, herbivore populations could become dependent on climate responses in vegetative populations. A species ability to respond to warming could determine not only the vulnerability of the species, but also the vulnerability of entire ecosystems. Species responses could include, but are not limited to, changes in distribution patterns and species range, changes in plant phenology, and adaptive evolution. 4
1.3.1   Change in distribution patterns

Using the Normalized Difference Vegetation Index (NDVI), a general trend towards
increased plant productivity, or a general greening in the Arctic has emerged (IPCC 2014).
While over half the Arctic has shown no increase in productivity, at least one third has
greened and only 4% has browned (greening refers to a general increase in vegetation
cover throughout the growing season, while browning refers to a decrease; IPCC 2014).
This greening has been associated with changes in vegetative communities at northern
latitudes including, but not limited to species migration. In Iceland, greening has been
observed, with increases in NDVI measurements between 1982-2010, likely due to
warming climate as well as reductions in grazing activity, increased afforestation and soil
reclamation, as well as glacial retreat (Raynolds et al. 2015).

According to paleoecological evidence through pollen analysis, plant communities have
responded to historic climate change primarily through relocation (Huntley 1991). In past
warming events that occurred early in the Holocene, species had the ability to migrate
northward with increasing temperatures because sea levels were still low, extending the
available areas around Arctic coastlines (Forbes 2015). Current global trends in species
migration show similar movements, with a poleward range shift of terrestrial plant species
(Parmesan 2006). General trends in Arctic and alpine vegetation studies suggest that
warming is resulting in an increase of shrub cover along with an overall decrease in species
richness and an upwards movement of plant species (Wilson & Nilsson 2009; Elmendorf et
al. 2012). In Sweden a temperature increase of nearly 2.0 ºC over a 20 year period, resulted
in an increase of the evergreen shrub Empetrum hermaphroditum, accompanied by a
decrease in overall species richness –and increase in herbaceous vegetation within forest
communities , with most of the changes occurring at the lower elevations (Wilson &
Nilsson 2009). A short term vegetation study in Iceland looking at warming responses of
tundra communities found no change in species richness as temperature increased,
however there was an increase in deciduous (Betula nana) and evergreen dwarf (Empetrum
nigrum ssp. hermaphroditum) shrub abundance (Jonsdottir et al. 2005). Multispecies
studies have indicated that latitudinal species range expansion northward will occur at a
rate between 6.1 km/decade in the Northern Hemisphere (Parmesan & Yohe 2003), to 16.9
km each decade within Europe, North America and Chile (Chen et al. 2011).

The rate of northward migration of new or novel species into Arctic regions could become
problematic for native populations. As climate change influences the conditions in the
Arctic, it is estimated that the abundance and distribution of boreal species, which by
current estimates comprise of 40% of all the Arctic species, will continue to increase in
Arctic areas (Forbes 2015). Arctic species having the largest abundance or widest
ecological amplitude are well adapted to Arctic conditions and are widely distributed
mainly due to lack of competition (Forbes 2015). However, with changing conditions,
exposure to more stressful local climate conditions will be more likely for species at the
trailing southern edge of their range, such as warmer and drier conditions, and increased
competition from the southern neighbours. Species with slow growth, low plant stature and
relatively low (and variable) flowering and seed set, risk being outcompeted by new
species moving into a newly widened northern ecological niche (ACIA 2005). By contrast,
species at the leading edge of their range have only limited potential to colonize new areas
as a result of extreme and variable local climate events, and maritime encroachment with
sea-level rise. Therefore, it is expected that the most significant decline and replacement of
                                                                                            5
cold-adapted species by warm-adapted species, will occur at the southern and northern ecotones (Gottfried et al. 2012). However, populations at the leading and trailing edges of their habitat, are often better suited to respond to a warming climate because here the genetic variation is greater compared to the interior population (Parmesan & Yohe 2003; Parmesan 2006). 1.3.2 Change in plant phenology Plant phenology is an important component of plant development. It describes the timing of specific reoccurring natural processes within a plant’s life cycle that are influenced by the environment (Menzel et al. 2006; Cleland et al. 2007; Wolkovich et al. 2012; Schwartz 2013). Phenological characteristics include, but are not limited to plant emergence, bud emergence, flowering time, and senescence. The timing of these phases is critical for the entire life cycle (Cleland et al. 2007). Changes in plant phenology, particularly timing of phenological stages can play a role in ecosystem processes like nutrient capture, productivity, species composition of an ecosystem and in the global carbon intake balance (Cleland et al. 2007; Leblans 2016). Phenological characterises are triggered by environmental factors, such as temperature, CO2 concentration, and precipitation. All these factors are predicted to change considerably in Arctic and subarctic environments as a result of climate change (Menzel et al. 2006; Cleland et al. 2007; IPCC 2014), thus changes in plant phenology are expected (Molau, Mølgaard & ITEX 1996; Cleland et al. 2007; Oberbauer et al. 2013). Most Arctic terrestrial ecosystems are already showing signs of phenological responses to warming that vary in magnitude from nearly non-responsive, to drastically earlier (ACIA 2005; Cleland et al. 2007; Wolkovich et al. 2012; IPCC 2014; Figure 4). The trend emerging is showing later senescence associated with warmer fall temperatures and earlier spring flowering, or spring advancement occurring at a rate between 2.3 to 5.1 days earlier per decade (Cleland et al. 2007; Wolkovich et al. 2012). Studies have demonstrated that earlier spring flowering has been associated with recent temperature increases, especially increases in spring temperatures (Menzel et al. 2006; Cleland et al. 2007; Wolkovich et al. 2012). Species not considered early spring species are often less responsive to changes in temperature and have shown signs of delayed phenology when temperatures exceed their tolerance, potentially attributed to other factors such as photoperiod or soil moisture (Rathcke & Lacey 1985). This phenological advancement is estimated to increase by 2.3 days per decade (Parmesan & Yohe 2003). Figure 4: Changes in onset of flowering for six species based on weekly sampling across various plots (individual circles) between 1996 and 2005 in the high-Arctic of Greenland. Sampling lasted between eight and ten years for all species listed. Negative values indicate the earlier onset of flowering in number of days per decade. Adapted from (Høye et al. 2007; IPCC 2014). 6
The shifts in spring flowering time and the longer growing seasons might not be the result
of temperature increases alone. There is evidence to suggest that atmospheric CO2
concentrations, and altered precipitation patterns may also play a role in the earlier spring
start and general plant phenology (Cleland et al. 2007). For example, in Spain, experiments
have been unable to rule out precipitation, specifically drier weather, as a contributing
factor to changes in plant phenology (Llorens & Peñuelas 2005). Meanwhile, studies of
crop species have documented increased levels of CO2 concentrations leading to an
acceleration of phenology stages (Kimball, Kobayashi & Bindi 2002).

1.3.3   Phenotypic plasticity and adaptive evolution

The plant responses that trigger the phenological change or changes in other plant traits as
response to warming can be attributed to either phenotypic plasticity or adaptive evolution.
Phenotypic plasticity refers to the ability of an identical genotype to display variation in
plant traits (phenotypes) under different environmental conditions (Primack & Kang 1989;
Conner & Hartl 2004; Franks et al. 2014). Phenotypic plasticity is a means for plant
populations to react to environmental conditions as a result of climate change in both the
short-term and the long-term.

Phenotypic plasticity can be simply a non-adaptive response to environmental conditions
with no effect on overall plant fitness, or an adaptive response to environmental stimuli
that increases fitness (Merilä & Hendry 2014). Fitness can be described as the ability for an
individual to successfully grow, survive and reproduce (the output being the relative
number of offspring in the next generation), or as the abundance and success of genes over
multiple generations (Primack & Kang 1989). When phenotypic plasticity increases
species fitness, adaptive evolution can occur. Adaptive evolution is the gradual natural
selection of traits, that increase plant fitness because they are better suited for the new
environmental conditions (Conner & Hartl 2004; Franks et al. 2014). Genetic diversity
contributes to adaptive evolution by increasing the traits that can be influenced by natural
selection. Compared to other biomes worldwide, ecosystem resilience of Arctic
communities is highly dependent on genetic diversity because species diversity is
relatively low (ACIA 2005).

To determine if global change is affecting plant populations and species through plastic or
adaptive responses, it is crucial to identify which environmental factors are leading to
specific changes. Temperature increases may favour certain plants groups, such as vascular
plants however, the effect of temperature often coincides with other environmental
changes, making it challenging to isolate the impact of changing temperatures alone
(ACIA 2005; Merilä & Hendry 2014). Additionally, there are secondary effects of
increased temperature which, when acting alongside increased competition, and changes to
moisture and nutrient regimes, will likely have negative impacts on plant communities that
could outweigh any impacts.

If species do not respond to climate change by means of phenotypic plasticity or adaptive
evolution they will need relocate or expand their range into locations that are more
suitable, otherwise they will become locally extinct (Nicotra et al. 2010). As a result, the
relative importance of plant plasticity compared to other plant responses, such as adaptive
evolution or species migration has been questioned. It is unknown if environmental
conditions triggering plastic phenotypic responses will continue to be reliable or if at a
                                                                                           7
certain point, species will have to migrate/ expand their ranges, or respond with adaptive evolution in order to cope with the new conditions (Nicotra et al. 2010). 1.4 Predicting Future Changes In order to predict how Arctic terrestrial ecosystems will respond to climate change, we must first understand the way in which environmental variations, such as temperature increases, influence the life cycles of individual plant species. Scientists use various approaches to study this e.g. warming studies to determine how individual plants will respond, transplanting and common garden studies to determine if observed responses are caused by phenotypic plasticity or adaptive evolution, and modeling to predict future conditions. Ideally, these approaches should be combined to study the complex species and environmental dynamics (ACIA 2005). 1.4.1 Warming Studies Warming studies typically use one of three approaches; long-term observational studies, space for time substitutions or small scale warming of natural plant communities to simulate future changes (Wolkovich et al. 2012). Observational Studies Long-term observational studies have been carried out at various locations in the Arctic. These studies typically use time series data to determine the change in terrestrial communities (Elmendorf et al. 2015). A study using satellite data and the normalized difference vegetation index (NDVI) for long term observations (21 years) of vegetation change, determined that there was an increase in peak vegetation greening by nearly 17% and an increase in aboveground biomass by 171g/m2 in the Alaskan tundra, between 1981 and 2001 (Jia, Epstein & Walker 2003). Similar results were found when change in shrub cover over a 50-year-old period in Alaska was estimated from high-resolution oblique- aerial photographs. The photo comparisons showed an increase or no decrease in the height, diameter and infilling of three shrub species (Sturm, Racine & Tape 2001; Tape, Sturm & Racine 2006). Studies using long term field monitoring, such as the 42 year study in Yukon, Canada, determined that changes in community composition were occurring as a result of warming temperatures (up to 2 ºC; Danby et al. 2011). Observational data can be used to predict plant responses however, these studies may be limited in their ability to evaluate the full range of a plant’s response if the sites are located at the leading or trailing edges of species range (Reyer et al. 2013). There are also concerns that studies which only focus on these extreme ecosystems fail to capture the true species response across its population range and can negatively influence the understanding of mean climate impacts or responses of individual species (Reyer et al. 2013). These studies have even been criticized for being too opportunistic, referring to the inability to plan the environmental conditions, such as an unseasonably warm growing period, during the study (Reyer et al. 2013). The length of the study is also a crucial factor to consider when using observational studies, as the initial responses to warming can be significantly different, in both direction and magnitude, from the long-term responses. Factoring in time scale can be difficult given long term studies rarely have the ability to date back longer than 100 years and cannot determine future conditions (Shaver et al. 2000; Rustad 2008). 8
Space for Time Substitution
Space for time substitutions (STS), are an attempt to address problems that arise when
long-term observations are not feasible. STS use existing gradients in plant distribution and
climate conditions to predict the impact of future climate changes (Elmendorf et al. 2015).
Individual species studied in space for time substitutions exist naturally across a range of
conditions that simulate predicted changes. For example, the impact of climate change
induced warming has been studied in plant species growing across a range of latitudinal or
altitudinal gradients (Nicotra et al. 2010). In Niwot Ridge, Colorado, USA, slopes with
varied elevation were used to represent different temperature conditions, revealing a
significant change in community composition, diversity and distribution for herbaceous
plant species correlated with the changes in temperature (Sproull et al. 2015). Space for
time experiments are advantageous because they use natural features to simulate changes,
they allow researchers to compare plants already present in a location, growing in natural
conditions. However, these locations span large areas geographically, with variation in
external environmental conditions that can confound the results related to temperature and
plant responses, resulting in high variability in the results (Leblans 2016) and making site
comparisons difficult (Rustad 2008).

Small Scale Warming Studies
Numerous small-scale warming studies have been performed in the Arctic and subarctic
through research organizations such as the International Tundra Experiment (ITEX; (ITEX
1996)). Using passive open top warming chambers situated in the field, warming
temperatures between 1 and 3 ºC were simulated during the growing season (Henry et al.
2013). Through long term monitoring, the ITEX initiative was able to demonstrate
changes in vegetation with an increase in shrub cover and decrease of lichens and
bryophytes that were a direct result of warming temperatures (Elmendorf et al. 2012). The
experiment also revealed that experimental warming lead to early phenology events and
increased vegetative growth, especially in Low Arctic locations (Henry & Molau 1997).
The results indicated that Arctic ecosystems were more sensitive to smaller increases in air
temperature compared to other climatic zones (Oberbauer et al. 2013).

Experimental warming, using passive open top chambers (ITEX 1996) or other techniques
such as field greenhouses or active open-top chambers are simple to use and inexpensive,
however they do not allow for control of the amount of temperature increase, leading to
significant variability in the warming (Shaver et al. 2000). They also tend to alter other
variables that could influence plant growth, such as wind, light, humidity and precipitation
and evapotranspiration. They are also limited in their application, in that only relatively
small areas can be manipulated simultaneously (Shaver et al. 2000). Warming experiments
are useful for determining short term (years to decade) responses of vegetation to climate
conditions but fail to identify the long term (decades to centuries) responses that are
identified through other methods, such a space for time experiments (Shaver et al. 2000).
As a result, they tend to under predict warming responses (Wolkovich et al. 2012).

Limitations of Warming Studies
To determine the strengths and weaknesses of both spatial gradients, long-term
observations and manipulation experiments, Elmendorf et al. (2015) compared the shift
from cold-adapted species to more warm-adapted species in tundra plant communities

                                                                                           9
using the three approaches. The results indicated that each method was a suitable option for monitoring changes in tundra vegetation alongside climate change, as long as limitations for each method, such as community response lag times and underestimation of climate change impacts for manipulation experiments, high variability within elevation gradients, and the limited feasibility of long-term observations, were considered. While warming experiments provide valuable information, they are often limited by monetary and/or logistical constraints and can examine only few factors over a restricted time period (Reyer et al. 2013). As a result, long-term monitoring studies of plant responses to climate change, including warming, are sparse. When the studies do exist, experimental studies underestimate the timing of phenology responses to warming temperatures compared to observational studies (Wolkovich et al. 2012). The response of species and populations to change is influenced by the rate in which the change is introduced, step changes, are a common approach in experimental design but can be an unreliable way of determining local responses to external variables (Rustad 2008). As a result, warming experiments may overestimate the influence of experimental variables by introducing sudden changes to a system, versus a gradual change that would be representative of the rate of change in a natural system. For example, experimental data predicts a 1.9 - 3.3 day change in flowering for every ºC increase, whereas observational data predicts between 2.5 – 5 days for every ºC increase (Wolkovich et al. 2012). For this reason, warming experiments should be used alongside other approaches, such as transplant sand common garden studies, and modeling techniques to eliminate bias from each study design (Reyer et al. 2013). 1.4.2 Transplant and Common Garden Studies Transplant studies and common gardens can isolate individual processes by effectively identifying cause and effect relationships (De Boeck et al. 2015) and are thus an effective way of determining if and how genotypes are responding to environmental conditions through the expression phenotypes (Primack & Kang 1989). Transplant experiments allow researchers to investigate potential adaptation without taking away natural conditions, whereas common garden or greenhouse experiments can isolate specific controlled effects on individual plants (Primack & Kang 1989). Transplant Studies Transplant studies determine if there are genetic differences between different populations and if these changes are adaptive. Reciprocal transplantations of individuals into new environments are used to compare traits and fitness of resident and foreign individuals. If resident individuals have higher fitness, then it can be inferred that those individuals are different, perhaps even locally adapted to the specific set of environmental conditions (Primack and Kang 1989). A reciprocal transplant study planting seeds and seedlings of Arabidopsis thaliana originating from the northern extent of its range in Sweden in the southernmost part of the range (and vice versa) found that populations were adapted to local conditions (Ågren & Schemske 2012). Transplant studies allow for interactions between natural variables but provide limited opportunities to determine causal relationships between variables due to the difficulty in isolating single environmental variables in the field (Leblans 2016). For that reason, common garden studies are a valuable complement to climate change studies. 10
Common Garden Studies
Common garden or greenhouse studies can also be used to determine genetic
differentiation and plastic responses of plant communities by comparing individuals under
standardized conditions (Nicotra et al. 2010). They are a tool used to evaluate cause-and-
effect relationships between a limited number of controlled variables (Rustad 2008).
Individual species with known genetic composition, or that have been tracked over several
generations, are grown under managed conditions either in a laboratory or in the field. A
common garden study of Mimulus guttatus in Yellowstone National Park, determined that
individuals growing in geothermal areas had vegetative, floral mating and phenological
responses to temperature that were significantly different from those in non-geothermal
areas. The study was also able to determine that the local conditions (geothermal vs non-
geothermal) was not related to the genetic variation present within the population therefore
this adaptation was likely a result of phenotypic plasticity (Lekberg et al. 2012).

1.4.3   Modeling

Species responses to local climate changes can be important component of both global
climate change modeling as well as species distribution modeling. Work has begun to
demonstrate the correlation between species ranges and future climate scenarios using
modeling techniques including Ecological Niche Models (ENMs) and processed based
models (ACIA 2005; IPCC 2014). These models have suggested that Arctic species will
see an increase in range if they are habitat generalists or a decrease in range for habitat
specialists. General trends suggest a decrease in projected future ranges for Arctic species
compared to present ranges however, the extent of this range reduction will depend on the
physiological constraints that species experience at the southern extent of their range and
on propagule dispersal at the northern extent of the plant range (ACIA 2005).

Modeling can be used to test hypothesis inferred through experimental analysis, for
combining multiple observed responses and for scaling up responses in terms of time and
space (Rustad 2008). Schwartz, Ahas, and Aasa (2006) performed this type of modeling to
determine the relationship between warming of the Northern Hemisphere and the onset of
spring (i.e. plant phenology/ spring greening). Modeled and derived measurements were
used to test the hypothesis of earlier spring warming across a large spatial scale. Both the
small-scale studies and the modeled results indicated that phenological events in plant
growth were occurring earlier across the Northern Hemisphere.

Modeling can also be used to determine current and future plant distribution. Current range
models, or species niche models, are often based on the known ecological range of a
species and are assumed to represent the limits to their growth tolerance, or the ecological
potential of the species. Distribution modeling was used to predict the occurrence and
abundance of the dwarf shrub Dryas octopetala L. in Svalbard (Beck et al. 2005).
Temperature, exposure and slope increased the occurrence of the shrub whereas snow and
water cover decreased it. Using ground truthing, it was determined that the model was
successful at identifying the actual distribution of the species and suggests models for
Arctic species continue to be used, as long as they incorporate data such as snow cover
(Beck et al. 2005).

By incorporating updated knowledge of species tolerance determined through warming or
manipulation experiments, these models can be expanded beyond the realized niche of the
                                                                                     11
plants and represent the fundamental or the potential niche of a species. Determining the ability for plants to grow in a range of temperatures, will allow modellers to produce visuals that can help to update our understanding of the niche in which plants can occupy and predict the likelihood of survival across larger geographic ranges (Nicotra et al. 2010; IPCC 2014). As with the other techniques discussed, modeling has its disadvantages. Modeling is challenging because it needs to incorporate heterogeneity and disturbance into the design however it cannot always account for variables such as biodiversity or random events that influence the system under investigation (Rustad 2008). It is also difficult for models to fully incorporate in impacts of important processes such as genetic adaptation, phenotypic plasticity, and species interactions, nor are they able to fully account for the rates in which changes will occur (IPCC 2014). 1.5 Geothermal Areas An alternative approach that draws from both manipulation experiments and observational studies is the use of natural gradients or naturally heated ecosystems to study the influence of warming soil temperatures. Natural gradients, unlike manipulation studies, have variables that have existed long-term and can be examined over prolonged periods at a relatively low cost (Leblans 2016). Geothermal areas constitute natural thermal gradients and have been used for climate change studies as the systems offer a unique and important cross between field and laboratory conditions, or the observational and experimental conditions (O’Gorman et al. 2014). Geothermal areas are found near tectonic plate boundaries, such as the mid-Atlantic ridge in Iceland (Figure 5), where water is heated from the upwelling of magma below the surface of the earth. As heated water accumulates under impermeable rock, it creates high-pressure areas. This high-pressure process keeps the heated water circulating while warming the rock and soil above (Barbier 2002). Where the warmed channels are close to the surface, temperatures can exceed 50ºC above ambient. As a result, geothermal system become locations where terrestrial plants grow in soil across a large and often gradual range of temperatures, displaying small scale environmental gradients that can be regarded (or exploited) as a natural experiment. This range is often of small biogeographical area therefore, site characterises remain fairly constant within the system itself and between the system and the external environmental (O’Gorman et al. 2014; De Boeck et al. 2015; Leblans 2016). Geothermal areas provide researchers with the opportunity to study temperature changes on biotic systems without the confounding factors such as spatial scale and time. In theory, they are a way for researchers to isolate the influence of soil temperature from other variables, such as space, time and biological complexity, because the experiment is performed in the same geographic area (O’Gorman et al. 2014). These areas allow researchers to determine how terrestrial species behave in natural environments that are warmer than a species preferred growing conditions (Woodward et al. 2010). This soil temperature gradient from normal to >50ºC offer a space for researching the impact of climate change across the full range of modelled scenarios (IPCC 2014). 12
Figure 5: Map of geothermal areas around the world representing the hottest areas (in red; underlying data
adapted from the US Geological Survey). The numbered black circles indicate high-latitude ecosystems (1:
Alaska; 2: Greenland; 3: Svalbard; 4: Kamchatka). Source (O’Gorman et al. 2014)

1.6   Iceland
Iceland is a volcanic island in the Atlantic Ocean, situated between the latitudes 62º23’N
and 66º32’N and the longitudes 13º30’W and 24º32’W. Between 16 and 18 million years
BP, the oldest parts of Iceland were formed by volcanic activity that resulted in a dome
uplift situated at the intersection between the Mid-Atlantic mobile hydrogeological region
and the Iceland-Faroe ridge. Through the gradual spreading of the ridges, the Iceland
mantle plume reached the surface, with peaks now reaching as high as 2110 m (Zakharova
& Spichak 2012). The tectonic plates continue to separate, maintaining the volcanic
activity in the area and an annual mean divergence of 2 cm each year. As a result, the
major geological drivers for Iceland are volcanic activity, with over 30 active volcanic
systems (Figure 6) and the dynamic glaciers that represent approximately 11% of the
country’s surface area. The volcanic zones that span the length of the country have led to
unique geological features and are the cause of active geothermal areas found throughout
the country (Figure 6). With the abundance of these areas, Iceland provides a unique
opportunity for climate change studies.

                                                                                                       13
You can also read