Speleothems from the Middle East: An Example of Water Limited Environments in the SISAL Database - MDPI
←
→
Page content transcription
If your browser does not render page correctly, please read the page content below
Review

Speleothems from the Middle East: An Example of
Water Limited Environments in the SISAL Database
Yuval Burstyn 1,2,*, Belen Martrat 3, Jordi F. Lopez 3, Eneko Iriarte 4, Matthew J. Jacobson 5,
Mahjoor Ahmad Lone 6,7 and Michael Deininger 8
 1 Geological Survey of Israel, 30 Malchei Israel Street, Jerusalem 95501, Israel
 2 Institute of Earth Sciences, Hebrew University of Jerusalem, Edmond Y. Safra Givat Ram Campus.
   Jerusalem 91904, Israel
 3 Department of Environmental Chemistry, Spanish Council for Scientific Research (CSIC), Institute of

   Environmental Assessment and Water Research (IDAEA), 08034 Barcelona, Spain;
   belen.martrat@idaea.csic.es (B.M.); jlfqam@idaea.csic.es (J.F.L.)
 4 Laboratorio de Evolución Humana, Universidad de Burgos, 09001 Burgos, Spain; eiriarte@ubu.es

 5 Department of Archaeology and Centre for Past Climate Change, University of Reading,

   Reading RG6 6UR, UK; m.j.jacobson2@pgr.reading.ac.uk
 6 High-Precision Mass Spectrometry and Environment Change Laboratory (HISPEC), Department of

   Geosciences, National Taiwan University, Taipei 10617, Taiwan; lonemahjoor@gmail.com
 7 Research Center for Future Earth, National Taiwan University, Taipei 10617, Taiwan

 8 Institute of Geosciences, Johannes Gutenberg University Mainz, J.-J.-Becher-Weg 21,

   55128 Mainz, Germany; michael.deininger@uni-mainz.de
 * Correspondence: yuval.burstyn@mail.huji.ac.il; Tel.: +972-544-331745
 Received: 30 January 2019; Accepted: 3 April 2019; Published: 22 April 2019

 Abstract: The Middle East (ME) spans the transition between a temperate Mediterranean climate in
 the Levant to hyper-arid sub-tropical deserts in the southern part of the Arabian Peninsula (AP),
 with the complex alpine topography in the northeast feeding the Euphrates and Tigris rivers which
 support life in the Southeastern Fertile Crescent (FC). Climate projections predict severe drying in
 several parts of the ME in response to global warming, making it important to understand the
 controls of hydro-climate perturbations in the region. Here we discuss 23 ME speleothem stable
 oxygen isotope (δ18Occ) records from 16 sites from the SISAL_v1 database (Speleothem Isotope
 Synthesis and Analysis database), which provide a record of past hydro-climatic variability. Sub-
 millennial changes in ME δ18Occ values primarily indicate changes in past precipitation amounts
 the result of the main synoptic pattern in the region, specifically Mediterranean cyclones. This
 pattern is superimposed on change in vapor source δ18O composition. The coherency (or lack
 thereof) between regional records is reviewed from Pleistocene to present, covering the Last Glacial
 Maximum (~22 ka), prominent events during deglaciation, and the transition into the Holocene. The
 available δ18Occ time-series are investigated by binning and normalizing at 25-year and 200-year
 time windows over the Holocene. Important climatic oscillations in the Holocene are discussed,
 such as the 8.2 ka, 4.2 ka and 0.7 ka (the Little Ice Age) Before Present events. Common trends in the
 normalized anomalies are tested against different climate archives. Finally, recommendations for
 future speleothem-based research in the region are given along with comments on the utility and
 completeness of the SISAL database.

 Keywords: SISAL database; speleothem; cave; isotopes; Middle East; palaeoclimate

Quaternary 2019, 2, 16; doi:10.3390/quat2020016                                www.mdpi.com/journal/quaternary
Quaternary 2019, 2, 16                                                                               2 of 28

1. Introduction
      The climate conditions across the Middle East (ME) are markedly heterogeneous for its relatively
small geographical extension, encompassing the Eastern coasts of the Mediterranean (hereafter, the
Levant) and the Fertile Crescent (FC) (often considered in tandem,) as well as parts of the Arabian
Peninsula (AP) and North-East Africa [1,2]. The region spans the transition between a temperate
Mediterranean climate in the Levant to hyper-arid sub-tropical deserts in the south, with complex
alpine topography in the northeast feeding the Euphrates and Tigris rivers which support life in the
Southeastern FC (Figure 1). Climate projections predict severe drying in major parts of the ME in
response to global climate change, with a considerable impact for societies [3–5]. Climate
reconstructions and archaeological information, suggest that changes in the regional hydroclimate
was a primary driver in human expansion out of Africa [6], the Neolithic revolution, and the
development of the first complex societies [7]. The ME has plentiful archeological records of human
settlement throughout much of the Quaternary, and well into the Holocene [8–14]. Initially, the
predominantly semi to hyper-arid climate of the region served as a bottle-neck for early hominin
dispersion out of Africa, allowing migrations onto the Levant and the AP pathways only during
wetter periods that were identified using speleothem growth (wet)/non-growth (dry) patterns in
desert and water-limited settings [15–18]. These events are also recognized using other methods and
different climate archives [10,19,20]. Since the Last Glacial Maximum from c. 25 to 20 ka BP (Before
Present, calibrated in the SISAL database to the year 1950 of the Common Era, hereafter CE) and the
following transition into the Holocene interglacial, there has been considerable evidence that
variations in climate served as a driver in Homo Sapiens’ cultural evolution. The most notable is the
“Neolithic Revolution”, where it has been suggested that post-glacial hunter-gatherers were able to
cultivate a number of food plants due to the trend towards warmer and possibly wetter climate [21],
whereas succeeding abrupt cooling events may have forced proto-agrarian societies to turn to the
cultivation of wild cereals and fruit [21–23]. Wheat was cultivated in the FC around 9500 years BP,
suggesting that the ME was the first region to cultivate plants and support sedentary human
communities [24,25]. The ME localities, specifically the FC, were also the earliest locations where
sophisticated civilizations, city-states and complex empire systems appeared during the mid- to late-
Holocene [26,27]. It has been argued that the expansion and subsequent collapse of these civilizations
was partly driven by rapid climate change events [14,28–32] superimposed on more gradual
millennial climatic shifts. Furthermore, recent studies have suggested an association between a
contemporary increase in the frequency and intensity of droughts in recent decades, to geopolitical
unrest in the region, e.g., the Syrian Civil War [29,33,34]. These correlations highlight the importance
of understanding both past and future climate perturbations in the ME. This can be achieved by use
of large spatio-temporal networks/datasets of terrestrial hydro-climate archives. Regional-scale
coherency would greatly improve our understanding of past variations in the spatio-temporal
precipitation pattern of the ME, thereby resolving some of the contradictions between different
records in the region [1,35].
      The first version of the Speleothem Isotope Synthesis and Analysis database (SISAL_v1) [36,37],
contains 376 isotope entity records derived from speleothems (secondary cave deposits) worldwide.
Speleothems are commonly used as archives of past terrestrial climatic variability. This is because
speleothems can be accurately dated and preserve multiple climate-sensitive proxies, which can be
sampled at high spatial and temporal resolution. In temperate regions speleothem time-series are
often continuous even under dry conditions [38,39]. By contrast, in semi-arid environments where
the effective infiltration (i.e., precipitation minus evaporation or evapotranspiration) is negative
throughout most of the year, the site specific hydrology and reservoir properties are emphasized in
the palaeo-record and decadal, annual and often seasonal hiatuses (or seasonal biases) can be found
[31,40,41]. Similarly, arid to hyper-arid environments particularly highlight growth/non-growth
events. This gives speleothem records a distinct advantage over alternative palaeoclimate proxies
(e.g., lake cores, tree-rings, corals), specifically for inter-comparison of the different climate settings
found in the ME.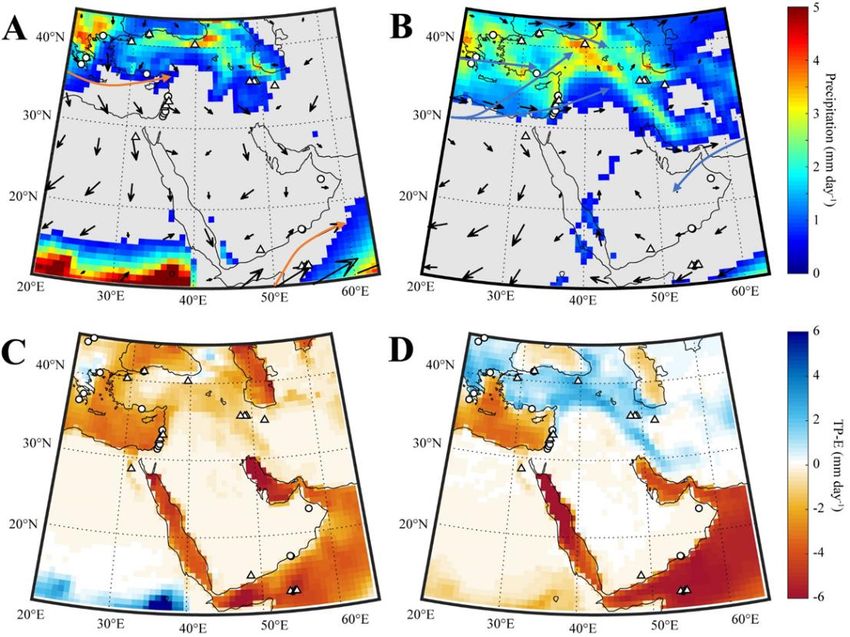
Quaternary 2019, 2, 16 3 of 28
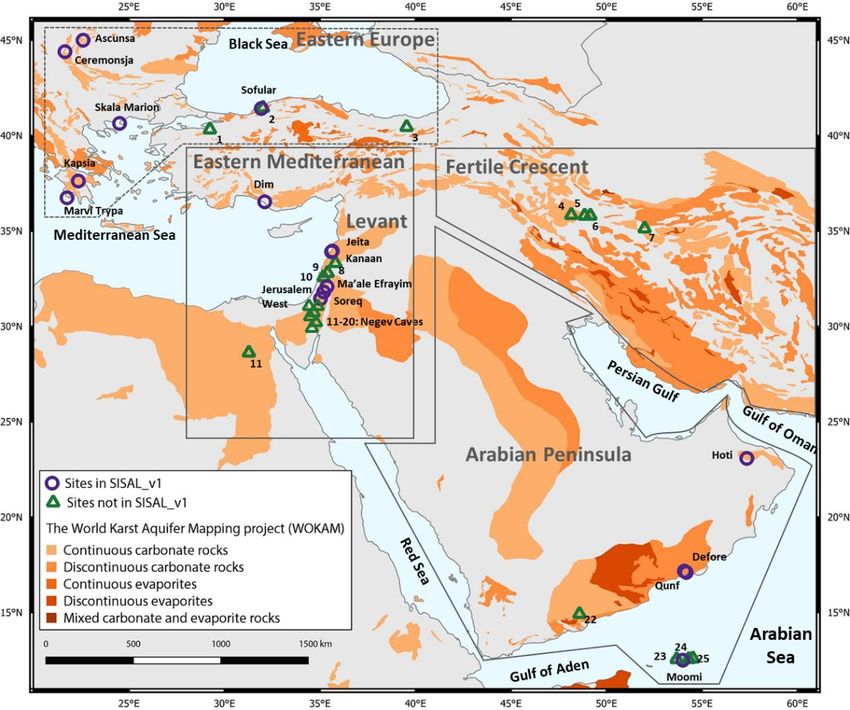
Figure 1. Location of the Middle East (ME) speleothem records that are included in SISAL_v1 (purple
circles) and other identified records, not yet included in the database (green triangles). The base map
shows the distribution of carbonate and evaporite rocks in the ME, as provided by the World Karst
Aquifer Mapping project (WOKAM), adapted with permission from [42]. Cave sites with entities not
included in the SISAL database are numbered (Table 1): (1) Karaca (2) Ovacik (3) Akçakale (4) Katleh
Khor (5) Qal’e Kord (6) Gejkar (7) Gol-e Zard (8) Mitzpe Shlagim (9) Peqiin (10) Zalmon (11) Ashalim
(12) Even Sid (13) Hol-Zakh (14) Izzim (15) Ma’ale Ha-Mishar (16) Ma’ale Dargot (17) Makhtesh ha-
Qatan (18) Shizfon mini-caves (19) Tzavoa (20) Wadi Lotz (21) Wadi Sannur (22) Mukalla (23)
Dimarshim (24) Casecas (25) Hoq.
In this work we review 17 speleothem isotope records (hereafter entities) that are in SISAL_v1
for the ME, which includes sites in Lebanon, Israel, the West Bank, Oman, Yemen, and Southwest
Turkey (entities from the AP and Egypt are also reviewed by Braun et al. [43]). An additional six sites
from Eastern Europe and Northern Turkey (see Kern et al. [44]) are included here as these sites are
along the dominant Eastern Mediterranean (EM) Sea storm tracks, the major climate patterns
controlling precipitation in the region (Figures 1 and 2; Table 1). The aim of this work is to highlight
the applicability of speleothems from the ME currently logged in the SISAL_v1 database to resolve
regional-scale consistencies and inconsistencies and to test for spatial coherency between
speleothems and additional climate recorders (i.e., Arctic ice sheets and Mediterranean surface
temperatures). The available speleothem stable oxygen isotope ratio (hereafter δ18Occ) Holocene
time-series are investigated via binning and normalizing (providing median, the 25th and 75th
quantiles of the data) at 25-year and 200-year time windows, as used previously in the context of the
PAGES 2k databases [45]. This method is used to better understand how different Holocene climatic
events are differentiated regionally with the context of a normalized ME composite time-series from
multiple records analysis (hereafter, ME composite), i.e., Sapropel 1, the 8.2 ka and the 4.2 ka event
or the Little Ice Age at 0.7 ka BP. Finally, we highlight sites and entities that are not logged in
SISAL_v1 and identify potential regions for the generation of new speleothem proxy time-series,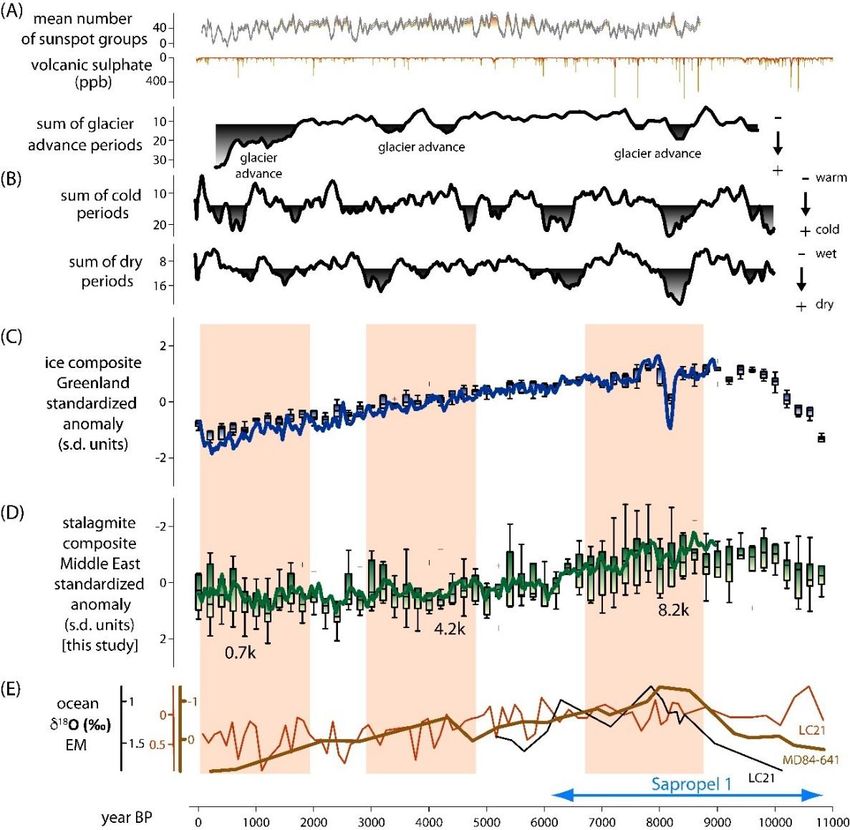
Quaternary 2019, 2, 16 4 of 28
suggestions regarding future speleothem-based research using the SISAL database are given
accordingly.
Table 1. List of all speleothem records which include SISAL metadata: site (or cave) name and id
number, latitude, longitude, entity (or speleothem) name and id number. Additional information
includes; location of site (country or region), site height Above Mean Sea Level (AMSL) in meters,
minimum and maximum ages given in years BP (1950), and published references. The top table are
records available in SISAL_v1 (with annotations of some entities in those sites as yet to be added to
SISAL_v1). The bottom table lists additional sites and speleothems not included in in SISAL_v1. A
minimum age of “~present” is designated where a younger than 1950 CE sample is presented without
an exact minimum age for the age model or a removal date. When ages beyond U/Th dating method
are reported, the table notes these as >U/Th.
latitude longitude elevation entity Min. Age Max. Age
site_name Site _id Location entity _name Ref.
ºN ºE (m AMSL) _id (yrs BP) (yrs BP)
Ascunsa 72 Romania 45.00 22.60 1050 POM-2 161 -32 8169 [46]
Ceremosjna 76 Serbia 44.40 21.65 530 CC-1 165 -48 2426 [47]
Defore 170 Oman 17.17 54.08 150 S3 366 -46 731 [48]
S4 9095 10,693 [49]
Dim 79 Turkey 36.53 32.11 232 Dim-E2 168 9738 13,094
Dim-E3 169 12,575 89,714 [50]
Dim-E4 170 12,020 14,555
Hoti 152 Oman 23.08 57.35 800 H5 327 6026 9607 [49,51]
H1 78,000 82,000
H2 ~present 5,000
H3 ~present 5,000
H4 117,000 130,000
H10 6,200 10,500
H11 6,200 10,500
H12 [49,52]
164 6277
117,000 130,000
H13 180,000 210,000
300,000 325,000
H14 6,200 10,500
flowstone 117,000 130,000
Jeita 11 Lebanon 33.95 35.65 100 Jeita-1 58 1137 12,288
Jeita-2 59 13,330 20,367 [53,54]
Jeita-3 60 372 847
JeG-
1100 11,900 [54]
Stm-1
Jerusalem
68 Israel 31.80 35.20 700 AF-12 152 -16 168,714 [55]
West
Kanaan_
Kanaan 19 Lebanon 33.91 35.61 98 81 83,125 128,847
MIS5
[56]
Kanaan_
82 154,455 193,498
MIS6
Kapsia 44 Greece 37.62 22.35 700 GK-09-02 120 1115 2904 [57]
Ma'ale
110 West Bank 32.08 35.37 250 ME-12 218 16,548 66,948 [18]
Efrayim
36 samples
Mavri Trypa 156 Greece 36.74 21.76 70 S1 347 1296 4687 [58]
Moomi 138 Yemen 12.50 54.00 400 M1-5 293 11,086 27,370 [59]
M1-2 40,000 53,000 [59]
Qunf 159 Oman 17.10 54.18 650 Q5 351 308 10,558 [49]
Skala Marion 56 Greece 40.64 24.51 41 MAR_L 136 1481 5534 [60]
Sofular 141 Turkey 41.42 31.93 700 SO-1 305 -56 50,275 [61]
SO-2 -60 59,510
SO-4 1080 307,030
SO-6 93572 133,200
[62,63]
SO-10 ~present 2,200
SO-14B 475,910 670,000
SO-17A 86,190 122,930
Soreq 160 Israel 31.45 35.03 400 Soreq composite 354 ~present 30,031 [64]
2N 353 4440 33,804 [31]
2–6 352 743 2086 [14]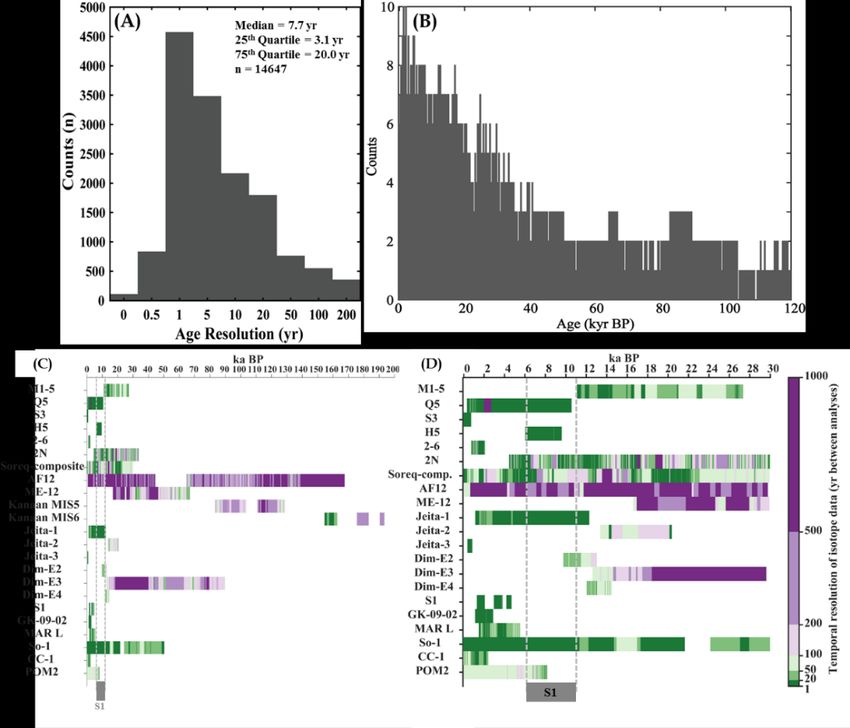
Quaternary 2019, 2, 16                                                                                                    5 of 28

                                                                                Numerous                                   [13,28,
                                                                                                     ~present   250,000
                                                                                 samples                                   65–72]

                                   Sites identified but currently not in SISAL_v1 (see Figure 1)

               Figure                     latitude    longitude    elevation
Cave Name                 Country                                              Identified speleothems Min. Age Max. Age     Ref.
                1 id                         (N)         (E)        (masl)
  Ashalim        11         Israel         30.94        34.74         400                            116,700    >U/Th       [73]
 Akcakale        3         Turkey          40.45        39.54                           2p             -55       189        [74]
  Casecas       24         Yemen           12.56        54.31                         STM5             12        856        [75]
 Dimarshim      23         Yemen           12.55        53.68                          D1            ~present    4530       [49]

  Even Sid      12          Israel         30.64        34.81        800                             87,700     >U/Th       [73]
   Gejkar        6          Iraq           35.80        49.16                         Gej-1            -63       2380       [29]
 Gol-e Zard      7          Iran           35.13        52.00        2530               -             3700       5100       [76]

 Hol-Zakh       13          Israel         31.16        35.20        150                             111,700    349,100     [73]
                                                                                       Hq1             -50       6900
    Hoq         25         Yemen           12.59        54.53                         STM1             -53       5600       [75]
                                                                                      STM6             -56       4500

   Izzim        14          Israel         31.14        35.06        500                             372,600    500,100     [73]

   Karaca        1         Turkey          40.32        29.24                          K1             6000      77,300      [77]

Kataleh Khor     4          Iran           35.84        48.16                      (2 samples)       214,000    500,000     [78]
 Ma’ale ha-
                15          Israel         30.49        34.93        450                             110,600    >U/Th       [73]
 Meyshar
  Ma’ale
                16          Israel         31.4         35.00        300         MD (6 samples)       U/Th       [73]
  Qatan

                                                                                      MS-1            4300      88,000
   Mitzpe
                 8       Israel/Syria      33.32        35.81        2224             MS-2            8800      89,000      [80]
  Shlagim
                                                                                      MS-3            8500      49,100

                                                                                       Y99           119,141    358,887
Mukalla Cave    22         Yemen           14.92        48.59        1500             Y97-4           5630      185,600     [16]
                                                                                      Y97-5           8790      233,300

  Ovacik         2         Turkey          41.46        32.02                         O-1             4472       9796       [61]
                                                                                     PEK-5            5620       6780
                                                                                     PEK-6           24,710     223,700
   Peqiin        9          Israel         32.58        35.19        650                                                    [72]
                                                                                     PEK-9           47,810     283,650
                                                                                     PEK-10          55,630     288,160
                                                                                      QK 8           78,104     99,182
 Qal'e Kord      5          Iran           35.80        48.86                                                           [78,81]
                                                                                      QK 14           6581      127,012

  Shizafon
                18          Israel         30.04        35.00        400                             333,400    >U/Th       [73]
 mini-caves

  Tzavoa        19          Israel         31.20        35.20        550         TZ (15 samples)     14,400     204,760     [79]

 Wadi Lotz      20          Israel         30.47        34.58        900             LOTS-3             -       >U/Th       [73]

Wadi Sannur     21         Egypt           28.62        31.28                       WSS 1 to 6       136,460    188,120     [82]
                                                                               ZAL-1 to ZAL-7 and
  Zalmon        10          Israel         32.80        35.40                                         5100      165,000     [83]
                                                                                    ZAL-11

2. Climate of the Middle East
     The Middle East (ME) is located within the subtropical high-pressure belt between the Northern
Hemisphere tropical (Hadley cell) and the mid-latitude atmospheric circulation, which is generally
associated with dry climates (i.e., the global desert belt). However, while most of the region is indeed
semi to hyper arid, the modern climate of the Levant is less arid and much milder than would be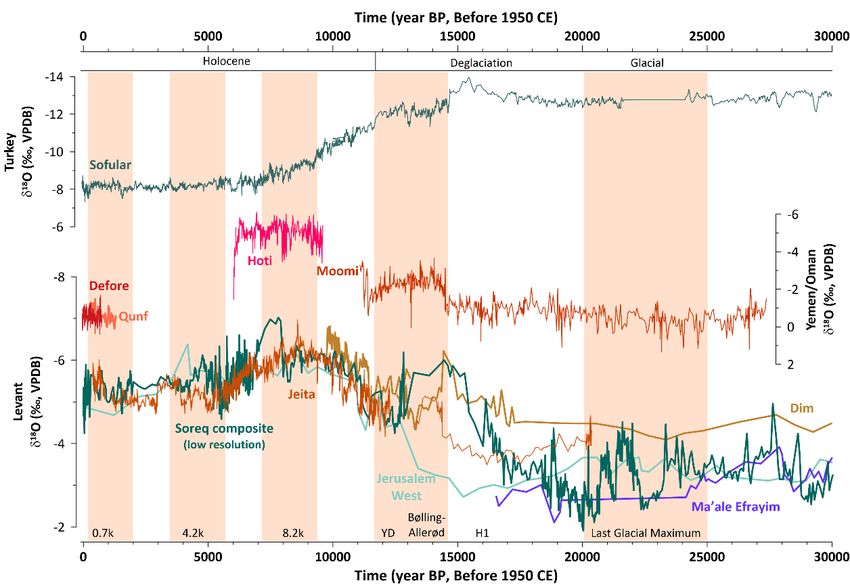
Quaternary 2019, 2, 16                                                                          6 of 28

expected from its location. This is mainly due to Mediterranean cyclones delivering precipitation to
the Levant, Fertile Crescent (FC), and on rare instances the Arabian Peninsula (AP), the genesis of
which is triggered by the interplay between the Mediterranean lows and the major North Atlantic
synoptic systems [84]. Furthermore, the Mediterranean Sea is characterized by an eastward gradient
of increasing salinity and sea surface temperatures (SST). This SST gradient and the cooler (compared
to the Mediterranean SSTs) surrounding land are key drivers for the Mediterranean cyclogenesis [85].
      The EM coastal areas receive most precipitation during Northern Hemisphere winter months,
on average about 95% of rainfall occurs between October and May [86]. Mean annual precipitation
(climatological mean, last 30 years) in the Levant displays a steep gradient, from hyper-arid in the
south with less than 100 mm/y (e.g., Egypt, Southern Negev), through semi-arid with 500–600 mm/y
(e.g., Soreq, Jerusalem) to humid in the north with >1000 mm (Lebanon and Southeast Turkey) (Figure
2A,B). Precipitation in the Levant is mainly sourced from eastward moving storm tracks generated
inside the Mediterranean region, Cyprus low systems, when cold and dry air from continental Euro-
Asia interfaces with the relatively warm Mediterranean Sea (Figure 2A compared to Figure 2B)
[87,88]. A smaller fraction of cyclones enter on a southeastern trajectory from the Atlantic crossing
the Southern EM Sea (Figure 2B), but rarely reach all the way to the Levant and FC [89]. Greece and
Turkey (>38° N) also receive cyclones originating to the northwest over Central Europe, the Black Sea
and in the Gulf of Genoa [84,90]. The semi-arid to hyper-arid FC currently receives most of its
moisture during winter (98% of the precipitation occurs between October-May; [29]) from
Mediterranean storm tracks [91]; while summer precipitation from tropical systems is virtually
absent (Figure 2B).
      The modern AP receives rainfall from the Mediterranean frontal systems (Dec-Mar), and rarely
from the Indian summer monsoon (Figure 2A). In the Late Pleistocene, however, groundwater
evidence suggests that the precipitation was sourced mainly from the Indian Ocean [92]. The modern
climate at the Southern AP is largely dependent on the annual migration of the Inter-tropical
Convergence Zone (ITCZ), which reaches its northern-most position in August. During this period,
the Somali Jet brings large quantities of precipitation to the southernmost parts of the AP [93]. This
is particularly important in the southwest where rainfall can occur all year round due to the
orographic features of the region and moisture advected from the Red Sea [94,95]. The dominance of
the Indian Ocean source in late Pleistocene suggests a northwards migration of the ITCZ.
Quaternary 2019, 2, 16 7 of 28
Figure 2. Maps showing seasonal precipitation amounts and water balance in the study region. Panel
(A) and (B) illustrate seasonal precipitation amounts from June to September (JJAS) and from
December to March (DJFM), respectively. Grey areas indicate regions where the daily precipitation
amount is smaller than 0.5 mm. These panels also show the seasonal 850 hPa wind fields in the EM,
AP and FC. Common storm trajectories are superimposed on the image and shown by the black
arrows. Panels (C) and (D) show the seasonal water-balance: Total Precipitation (TP) minus
Evaporation (E), for the periods JJAS (C) and DJFM (D), to best estimate the potential recharge (or
“effective infiltration”). All data was retrieved from the ERA-Interim reanalysis dataset (1979 to 2015
CE) [96]. Following Figure 1, circles show the locations of speleothem records that are included in
SISAL_v1, while triangles mark identified sites not included in SISAL_v1.
The ME water-balance (Figure 2C,D) plays an important role in the development of cave records
in the region. This becomes immediately visible when comparing the Mediterranean seasonality for
summer (dry) and winter (wet), highlighting that even in regions that receive summer rainfall (Figure
2A), there will be little to no summer recharge under modern climate conditions (Figure 2C). The
importance of the sub-regions reviewed in this work is emphasized when inspecting the patterns of
winter potential recharge throughout the ME. The Levant, specifically the EM coastal region, is
clearly on the desert-Mediterranean climate seamline with positive TP-E in the northernmost parts
and negative TP-E in the south. The Israeli and Lebanese caves are situated in such a way where even
a slight migration of the storm tracks shifts the water-balance from positive to negative and vice-
versa. This sensitivity has been used to describe the Negev humid periods, however, Negev entities
are not yet logged in the SISAL_v1 database) [73], climate controlled vegetation changes in the Levant
[28] and changes in the dominant storm tracks [83]. The FC caves may track a similar transition
between Mediterranean and monsoonal sources using Katleh Khor, Qal’e Kord and Gejkar caves,
which appear to experience a positive winter water-balance compared to Gol-e Zard Cave, located
further east and experiencing more water-limited conditions. The predominantly year-round
negative water-balance in the AP stresses the importance of local physiographic settings and
individual storms.
Due to the high SST and low atmospheric moisture above the Mediterranean Sea, the ratio of
oxygen to deuterium isotopes in precipitation yields a unique regional water line, the Mediterranean
Meteoric Water Line (MMWL, δD = 8 × δ18O + ~22 [‰VSMOW], [97]). The majority of Levant
precipitation indicates a local vapor source, [86,97–99]. Atlantic storms traversing the Mediterranean
Sea are overprinted with the MMWL signal, obscuring the original vapor source. There is no clear
indication that alternative trajectories for the Levant, such as tropical plumes or Red Sea troughs (see
Armon et al. [100]) maintain their source vapor, even though these storms travel very short distances
over the EM [98]. Considering that the vadose aquifer mixes the rainwater of different storms,
identifying shifts in trajectories of Mediterranean storms using water stable isotopes would be nearly
impossible. However, using other tracers such as dust deposition rates its composition and Sr
isotopes in speleothem may prove valuable [101–103]). Another important consideration is the effect
of the aforementioned strong evaporative climate. In a long-term rainfall sampling campaign at the
Soreq Cave site mean rainfall δ18O-δD relationship seemed to fall on the MMWL (slope ~8, deuterium
excess of ~20–30‰) [41,86], however, when events ofQuaternary 2019, 2, 16 8 of 28
3. Spatial/Temporal Setting of Middle East Speleothems
We define the ME roughly from 10° N to 45° N and from 20° E to 65° E. This includes the Eastern
parts of Europe that are relevant for understanding of the ME climate, as described in Section 2. We
use records from 16 caves and 23 individual speleothems from SISAL_v1 (Table 1), of which 10 sites
and 17 entities are from the ME and highlighted in Figure 1. There are additional entities that are not
in the SISAL_v1 database (Table 1), including sites in Turkey, Israel, Egypt, Yemen, Iran and Iraq
[37]. All δ18Occ values are reported in ‰ (per mille) and reported in the Vienna Pee Dee Belemnite
(VPDB) standard.
The geographic coverage of the sites is uneven, with the majority of sites and entities from the
EM, and a smaller proportion from the AP and FC. The geographical distribution of SISAL_v1 sites
in the ME region is centered on areas of continuous carbonate rocks (Figure 1). However, other factors
also have an influence. First, much of the region is arid to hyper arid (Figure 2), which inhibits the
formation of speleothems, or limits formation to pluvial periods only [6,105]. Second, the recent
unstable geopolitical situation in parts of the ME has allowed for limited scientific exploration.
The time intervals covered by the SISAL_v1 entities in the ME range from 0.056 ka BP (Sofular
Cave, Turkey) to 193 ka BP (Kanaan Cave, Lebanon). The temporal distribution of samples is skewed
towards the Holocene, with an almost linear increase in δ18O data in SISAL_v1 from ~40 ka BP to the
present (Figure 3B). Only six entities extend to and beyond the last interglacial (south to north):
Jerusalem West Cave AF-12, Ma’ale Efrayim ME-12, Kanaan Cave MIS5 and MIS6, Dim Cave Dim-
E3 and Sofular SO-1 (Figure 3C). The remaining 17 entities are largely confined to the interval
between the Last Glacial Maximum (LGM, ~22 ka BP) and present day (Table 1). The skewed
distribution may be the result of publication bias, as most studies have focused on the link between
climate and human civilizations [14,106], coupled with the fact that younger speleothems are more
naturally abundant as older samples are either covered by the younger deposits, or destroyed by
dissolution, alteration, earthquakes etc. [107]. Large parts of the Late Pleistocene have generally been
obtained specifically in sites where long-term continuous research has been carried out over multiple
overlapping entities (e.g., Israel, Lebanon and Oman).Quaternary 2019, 2, 16 9 of 28
Figure 3. (A) Histogram showing the distribution of temporal difference between two consecutive
data points for all ME SISAL_v1 entities, in bins of smaller than 0.5 years, between 0.5 and 1.0 years,
between 1 and 5 years, between 5 and 10 years, between 10 and 20 years, between 20 and 50 years,
between 50 and 100 years, between 100 and 200 years and over 200 years. (B) Histogram of speleothem
records during the last 120 kyr subdivided in 250-year bins, available speleothem isotope time-series
were counted if at least one δ18O value was within a bin [108]. (C) Temporal coverage and temporal
difference of studied entities covering the pre-Holocene time periods (up to 200 ka BP) and (D) entities
from the last 30 ka BP. Sapropel 1 period is bracketed by the dashed lines in (C,D) [109].
The median temporal resolution of all ME samples is close to decadal with a 7.7-year temporal
gap between data points (Figure 3A), the distribution of temporal gaps for all existing entities varies
between sub-annual to >500 year gaps, as indicated by the dark purple gaps in Figure 3C,D. Caution
is needed when analyzing close to millennial gaps, as they may be the result of prolonged growth
hiatuses or problematic sampling methodology. Temporal resolution for all entities is given in Figure
3C,D (up to 1000-year gaps), showing that most entities maintain a relatively constant growth-rate,
with the exception of entities from Levant sites (i.e., Soreq, Ma’ale Efrayim, Kanaan Jeita and Dim
caves). This highlights the hydrological sensitivity of the Levant records to changes in storm tracks,
rainfall amount and evapotranspiration [29,40,48].
Following the analysis of spatial distribution of the SISAL_v1 entities (Figure 1), as well as the
temporal distribution and resolution (Figure 3), we will focus our discussion on the last 30 kyr of
available SISAL_v1 data, and the regional ME composite for the last 12 kyr, from the Younger Dryas
(YD) to present day. The temporal potential of climatological analysis is, in most entities, limited to
decadal perturbations. However, the additional entities reported in Table 1 should allow for regional
compilations and coherence tests to extend beyond the late-Pleistocene and Holocene to the last
interglacial and beyond. Moreover, the regional dataset analyzed here is mainly affected by the
Mediterranean storm tracks, with little information on the Indian Summer Monsoon (ISM) (see
Kaushal et al. [110]). Questions concerning the intrusion of the Siberian High and migration of the
ISM would be easier to tackle with the inclusion of the FC entities and the Negev caves (Table 1). The
inclusion of these sites could be used to construct a regional-comparison traverse between Eastern
Europe and the Balkans, EM, FC and AP. For this reason, we limit this review to the last glacial period
and Holocene, and in Section 5 we provide suggestions to achieve a complete regional coherence
analysis for the Late Pleistocene.
4. SISAL_v1 Entities: Site-Specific Trends and Regional Interpretations
While variations of speleothem δ18O values are a response to changes in climate parameters
(rainfall amount and seasonal distribution, temperature, evaporation etc.), the absolute value of
precipitation δ18O values (δ18Op) can vary between different sites, even if they respond to similar
regional climate trends. As a result, even if near-equilibrium deposition is assumed, the absolute
value of δ18Occ from different sites may not be identical. Hence, we focus on trends and excursions
(i.e., on the variability) rather than absolute δ18Occ values of the time-series plotted in Figure 4 (LGM
to present) and Figure 5 (last 12 kyrs), these are then expended on using a normalized ME composite
described in Section 4.3 and plotted in Figure 6.
4.1. Controls on Speleothem δ18O
For the Levant, Southwest and Northwest Turkey, as well as parts of Eastern Europe, two main
processes were suggested to dictate the composition of δ18Op–the source and “amount” effect
[53,111,112].
The potential vapor sources available for Middle East (ME) precipitation are the Mediterranean
and the Indian Ocean (including the Arabian and Red Seas). Another source for the entities included
from Turkey, Greece and Eastern Europe is the Black Sea (see Section 2). The modern Levant rainfall
is limited to winter cold fronts with strong wet-winter/dry-summer seasonality. These fronts quickly
inherit the isotopic signature of the Eastern Mediterranean (EM). This is commonly referred to as theQuaternary 2019, 2, 16 10 of 28
source effect, where δ18Op and (and the resulting δ18O recorded in speleothems) is strongly influenced
by the marine reservoir that contributes its vapor to rain formation. This effect is dominant over
millennial time-scales, specifically glacial-interglacial cycles, where the isotopically light (low δ18O)
polar ice-sheet meltwater deplete the overall composition of oceanic surface water and the resulting
cloud forming vapor [111]. Specifically for the EM there is also a precessional time-scale effect where
the isotopically light Nile flux (during Sapropels, African Humid Periods) results in lighter surface
water [113]. δ18Occ palaeo-data from Soreq, Pequiin and Jeita that show a visual first order millennial
control on δ18Occ, predominantly reflect the change in composition of the vapor source, i.e., the EM
Sea. Often, the glacial-interglacial transitions in speleothem records follow the depletion of sea
surface δ18O as resolved from planktonic foraminifera [53,112]. A similar, but isotopically opposite,
millennial trend is also observed in Sofular Cave, where the vapor source is the Black Sea [62,63] (for
additional discussion see Kern et al. [44]).
The “amount” effect is considered the dominant driver of short-term δ18Op variations in the
Levant and was empirically evaluated using modern measurements in numerous locations on the
EM coastline [98,114]. Rainfall amount and isotopic compositions from the Israeli coastal plains and
mountains display strong negative empirical correlations between rainfall amount, site altitude, and
distance from the sea (all result in more negative values). The three are the underlying parameters
controlling the rainout-distillation process (Rayleigh distillation) of the cloud [86,114]. There is no
similar correlation for desert sites possibly due to desert rainfall being strongly affected by
evaporation at the base of the cloud [98]. This observation was made using data from the EM coastline
sites, where long-term rainfall sampling programs (amount and δ18Op) and modern cave water
monitoring have been established. Regarding the sites in the SISAL_v1 database, only three of the
seven Levant sites reviewed here had a long-term monitoring program (Kanaan, Soreq and Ma’ale
Efraim). Three other sites (Mitzpe Shlagim, Pequiin and Dim) have had cave water sampled
sporadically, when access to those sites was granted.
To evaluate the controlling mechanisms on decadal to seasonal δ18O variability in Levant
records, we refer to the extensive monitoring dataset from Soreq Cave collected between 1989 and
2016. The monitoring included the logging of rainfall amount, analysis of its isotopic composition, as
well as sampling of local ground water and host rock and measurements of cave pCO2, relative
humidity and temperature of the cave air, seasonal cave drip and pool water sampling in multiple
locations and the collection of modern speleothems and calcites [40,41,86,114–117]. The modern data
from Soreq Cave reveals that on an annual time-scale, the rainfall amount is linearly correlated with
more negative annual δ18Op (weighted average), and that this trend is then transferred into the cave.
High mean annual rainfall amount results in more negative δ18Op values of the water in the vadose
zone for that year, while prolonged droughts shifts the baseline seepage water to more positive δ18Op
values [41]. The decadal to seasonal variations were validated in a modern stalagmite sample [40]
and also observed in Soreq Cave fossil speleothem records, with seasonal to centennial resolution
[14,28,31]. A similar control of the “amount” effect was also suggested in Western Mediterranean
caves [118–121].
As a result of the modern strong seasonality pattern of the Levant region, the δ18O of cave water
represents mostly winter rainfall. For seasonal studies, this simplifies the evaluation of the δ18Occ
records by removing the by omitting the summer’s contribution to annual δ18Op variability (i.e.,
rainfall source seasonality [122,123]) and potentially avoiding δ18O enrichment following evaporation
in the epikarst and karst reservoirs (as it is often reported as negligible in winter storms [86,98,114]).
Consequently, the resulting speleothem record is strongly biased towards negative winter δ18Op. The
implementation of the modern observation on paleorecords relies on the hypothesis which a suggests
that the physiography of the Levant enforces the wet-winters/dry-summers seasonality of the region
throughout the Pleistocene [124]. However, we note recent contrasting evidence by speleothem
palaeoclimate studies resolved in seasonal resolution and other studies utilizing isotopically enabled
climate models, which suggest the possibility of significant summer rainfall and positive summer
effective infiltration for the Levant during the interglacials and interstadials[14,31,125].Quaternary 2019, 2, 16 11 of 28
In the Northern AP, Hoti cave records are mainly confined to the interglacial, with modern
rainfall derived from similar Mediterranean cyclones (Figure 2A,B). Regional δ18Op however is much
higher than in the EM coastline caves, ranging between 0 and −2‰. The current hypothesis to explain
why the Hoti records have significantly lower δ18Occ values is that speleothem growth occurs under
the highly pluvial conditions brought by the ISM, as the most recent period of deposition in the cave,
the early to mid -Holocene is regarded as a period of increased monsoonal activity [52]. The Southern
AP sites (Defore, Moomi, Qunf), record the intensity and duration of the ISM as well as the location
of the ITCZ [49], as suggested by the modern synoptic systems and rainfall regime, and corroborated
by examination of multiple δ18Occ records. These variations have been linked to solar output [48] and
orbital forcing [75], and are synchronous global millennial scale events as recorded in the Greenland
ice cores, EM Sea planktonic records and regional terrestrial records (i.e., the Dead Sea level curve
[126]).
Unlike the Levant and AP records, the FC rainfall patterns vary from annual rainfall to distinct
wet-dry seasonality, depending on the topography and proximity to the vapor sources [127]. Positive
effective infiltration is limited to the autumn and winter months. δ18Op values vary between −10‰
(winter) and −2‰ (summer), with heavier events as being high as +5‰ in spring and summer
[81,127]. Records from Qal’e Kord Cave are similar to Soreq Cave and link to changes in monsoonal
precipitation in China. This suggests a teleconnection between Eastern Europe and Asia as a result of
the meridional migration of the Westerly Jet. The main vapor source for the Levant sites and the FC
sites the same (the Mediterranean Sea), however, the average δ18Occ values from the previous
interglacial and glacial in Qal’e Kord Cave are ~2‰ lighter than coeval Soreq Cave records. This is
ascribed mainly to the Rayleigh distillation of atmospheric vapor as it moves east over the land mass
[81].
4.2. The Last Glacial Maximum, Deglaciation and the Transition into the Holocene (30 kyr BP to 12 kyr)
Levant records for the glacial-interglacial transition of the Late Pleistocene (deglaciation) follow
the Mediterranean planktonic curves, indicating that these speleothem δ18O records primarily reflect
sea surface δ18O changes [55,70,111,112]. The glacial period is characterized by a mean δ18Occ that is
several permille more positive as a result of the enriched δ18O composition of the vapor source, i.e.,
the Mediterranean Sea (source effect), variations of the vapor source of ~1‰–1.5‰ are observed in
the Holocene as well, but as shown by Almogi-Labin et al. [112] “…source effect is not directly recorded
in δ18Osea–δ18Oland values, which would remained constant if the source effect were the only control of
rainwater δ18O. The influences of rainfall, the amount, sea–land distance and elevation changes are thus
superimposed on sea surface water δ18O change”. This shift is most pronounced in the Soreq Cave, where
a sharp decrease in δ18Occ is visible starting at the Last Glacial Maximum (LGM) from −3.0‰ towards
Holocene values of −5.5‰ (Figure 4). This depletion trend stabilizes at ~15 kyr BP (circa the Bølling-
Allerød warm event), followed by a pronounced response to the Younger Dryas (YD), which is the
sharpest response observed to event in the SISAL_v1 records from the region, with an enrichment of
>1.5‰, but still 1‰–1.5‰ lower than LGM values (Figure 4).
The Jeita, Ma’ale Efrayim and Jerusalem West entities all have lower temporal resolution during
the LGM and deglaciation, which makes the identification of major climatic events difficult (Figure
4). On centennial and longer time-scale, we observe a gradual transition in the δ18Occ values, from
−2.5‰ after the LGM (~17.5 ka BP) to between ~ −5 and −7‰ in the Holocene in Dim, Jeita and West
Jerusalem caves (Figure 4). The expected “back to glacial” excursion of the YD, described for the
Soreq composite record (~ +1.5‰), is harder to identify in the neighboring Levant (Figure 4). The
identical trends observed across Levant records suggest that they respond to the same drivers,
specifically, changing storm tracks, encroaching coastlines and changes in EM Sea surface isotopic
composition [53,54,83,98]. This can be seen in Jeita Cave, which displays a visual correlation with the
EM marine foraminifera δ18O and in the trend of the ME composite (Figure 4 vs. Figure 6D,E).
However, during prominent climatic events (LGM, H1) Jeita-2 δ18Occ time-series shows opposite
trends to the marine records [128,129]. These excursions towards lighter δ18Occ are often in tandem
with lower δ13Ccc and Sr/Ca values and are suggested to reflect increased infiltration (i.e., high TP orQuaternary 2019, 2, 16 12 of 28
higher TP-E). Evidence of changes in palaeo-infiltration highlight the inconsistencies found between
the climate as inferred from the marine vs. terrestrial records, and also emphasizes that the source
effect is not the only parameter influencing variations in δ18Occ.
Sofular Cave entity SO-1, however, is the only time-series which does not agree with this glacial
to interglacial regional trend, towards more positive values in the transition to the Holocene (Figure
4). The distinct imprint of Greenland interstadials on the MIS2 50-kyr record suggests that SO-1
captures decadal to centennial-scale events. This means that on glacial time-scales SO-1 reflects Black
Sea surface water composition rather than Mediterranean source [61]. Additional discussion on
Sofular Cave, including the Holocene cycle documented in the speleothem δ13C time-series, can be
found in the review of Eastern European records in SISAL_v1 [44].
The majority of entities from the AP grew only during interglacial periods. The only entity
growing from the LGM to the Holocene is M1-5 from Moomi Cave (Socotra Island) spanning from
27 ka to 11 ka BP (Figure 3). The North-Easterly autumn rains sourced from the ITCZ are the main
source of infiltrating water for Moomi Cave. Most of the Moomi δ18Occ record is strongly correlated
with the Greenland ice cores, suggesting a possible Atlantic driver of these monsoonal shifts [59]. The
LGM is dated in the record as occurring circa 23–22 ka BP, which is interpreted as an arid period with
pronounced decrease in precipitation over the Island. After the LGM there is an increase in rainfall,
as deduced from a trend towards more negative δ18Occ values, that is similar but more gradual than
the trend seen in the Soreq Cave composite (Figure 4). The post-LGM warming and wetting trend is
interrupted by the warm/dry H1 event (~16.4 ka BP), followed by the wet Bølling-Allerød event (14.5
ka BP) and then the dry YD (12.9–11.7 ka BP [130]) (Figure 4). The entity terminates soon after the
commencement of the Holocene (dated to 11.4 ka BP), when a sharp decrease in δ18Occ, interpreted
as an increase in monsoonal rainfall is observed. The Levant records (Soreq, Jerusalem West and
Ma’ale Efrayim) do not show a concomitant abrupt change of ~30 years transition from YD to the
Holocene.
Figure 4. Time-series of δ18Occ of speleothem records from the AP (Yemen/Oman), Levant including
Turkeys’ Mediterranean coast, i.e., Dim Cave) and Northern Turkey (Sofular). The climatic events
highlighted on the plot are based on the interpretations from references [30,131].
4.3. Holocene Climatic Events and Spatial Heterogeneity across the Middle EastQuaternary 2019, 2, 16 13 of 28
When interpreting the post-YD, early Holocene time-series, we note that although there is still
an effect of changes in source δ18O (seen in the planktonic curves of the EM Sea, Figure 6E), this is not
as significant as during deglaciation. Thus, in this work we follow the conviction which determines
that the dominant driver of δ18Op variations is likely the “amount” effect [53,112]. The Holocene is
characterized by a general trend towards increasing aridity in the ME region
[49,51,57,61,66,70,132,133]. The wettest period in the EM, and the Levant in particular, occurred from
~10.8 to ~6.1 ka BP, coeval to the formation of Mediterranean Sapropel 1 and the African Humid
Period (AHP) [68,134,135]. The entities from Jeita Cave (Figure 5A) show increasing precipitation
during the early Holocene (from 12 to 10 ka BP) and wet conditions between ~10 to ~7 ka BP with
peak precipitation amounts at ~8.5 ka BP. Between 7.5 and 6.5 ka BP, the δ18Occ time-series from Jeita
Cave indicates progressively decreasing precipitation amounts until 5 ka BP. Late Holocene δ18Occ
values in these entities reveal a generally dry period that is interrupted by shorter and longer wet-
periods, e.g., from 4.0 to 3.0 ka BP, when precipitation amounts were increased. The hydroclimate
changes recorded by the speleothems at Jeita Cave are in general agreement with other speleothem
δ18Occ time-series from the region, such as the speleothem records from Soreq Cave (Israel) [64] and
Dim Cave (Turkey) [50] (Figure 5A). All these records indicate that the most arid conditions in the
Holocene occurred after ~3.2 ka BP [54,58].
The only other record from the Levant that spans the entire Holocene is SO-1 from Sofular Cave
(Figure 5A). This record shows increasing δ18Occ values during the early- and mid-Holocene, until
~6 ka BP. However, compared to other records from the EM, long-term δ18Occ trends in SO-1 are not
related to variations in precipitation amounts, but instead reflect changes in the mean δ 18O value of
the Black Sea, which is the main moisture source for this site, rather than the EM Sea [61,62].
Therefore, while periodic coupling of the Mediterranean and Black Sea system can be observed in the
regional records, it is difficult to directly link long-term δ18Occ changes in SO-1 to δ18Occ variations
from EM speleothems [62]. Only one speleothem record from Eastern Europe, Ascunsa Cave
(Romania), shows similar long-term trends similar to SO-1 (Figure 5A), likely reflecting also δ18O
changes of the Black Sea [133].
For the last 2 kyr, entities from Sofular Cave, Kapsia Cave, Mavri Trypa Cave, Soreq Cave, Jeita
Cave, Qunf Cave and Defore Cave are available (Figure 6). From these records, only SO-1 (Sofular
Cave) covers the entire period at 1 to 50-year resolution. The seasonally resolved Soreq entity 2–6,
which was generated using Secondary Ion Mass Spectrometry (SIMS) [14,71], has more negative
δ18Occ values compared to the δ18Occ of the Soreq composite record and the SIMS time-series
variability is much higher. This is possibly related to the SIMS-sampling methodology, which targets
multiple analyses in a single ~50–100 µm thick annual band, which emphasizes the bias toward the
negative winter values (~ −2.15‰ offset) [14]. The Soreq 2–6 δ18Occ indicates a steep drying trend
from 2.0 to 1.8 ka BP that is not observed in the other δ18Occ time-series from the EM (Figure 5B),
probably due to the relatively low temporal resolution of the other records, which are able to resolve
only pronounced changes in δ18Occ. Lechleitner et al. [136], find the opposite trend in their stacked
records of Western Europe speleothem records. The finer climate variations during the Medieval
Climate Anomaly (MCA) and the Late Antique Little Ice Age (LALIA) [131] are only identifiable in
Soreq 2–6. The Little Ice Age (LIA) is recorded by the EM coastline entities (mainly Jeita Cave) and
the record from Defore Cave (Figure 5B) with a positive excursion, that is again opposite to the
observation from the Western European stack [136].
The comparison between the AP and the Levant over the past 2000 years is limited by the overlap
of the entities that are available. The transition from the LALIA to the MCA is characterized by
variable δ18Occ values in Soreq 2–6. At the beginning of the LALIA δ18Occ values are the most
negative measured in Soreq 2–6, indicating a generally wet conditions in the Southern Levant
(consistent with the Soreq composite record). By contrast, δ18Occ values are more positive at the end
of the LALIA, indicating dryer conditions in the transition period from the LALIA to the MCA. At
the MCA, precipitation amounts increased again in the EM. This is indicated by the negative trend in
δ18Occ values in Soreq 2–6 [14,53,137]. During the MCA, δ18Occ changes in the Qunf record and in
Soreq 2–6 are anti-correlated, suggesting opposite precipitation variations at the southern tip of theQuaternary 2019, 2, 16 14 of 28
AP and in the EM, to be considered further when additional high-resolution entities become
available.
Figure 5. (A) Time-series of δ18Occ of speleothem records for the last 12 kyr. speleothem records are
the same than in Figure 4, which are on the modern dominant storm trace to the ME region shown in
Figure 2. (B) Temporal variability of entities in panel A for the last 2 kyr. The seasonally-resolved
entity 2–6 (Soreq Cave) is added for discussion [14]. The climatic events highlighted on the plot are
based on the interpretations from references [30,131].
Analyses of regional composites have yielded useful results in the study of the Holocene [32,35]
and the past 2000 years [45,138,139], because they mitigate the effect of age uncertainties and focus
on detectable climate variability. Here we construct a composite of Holocene ME speleothem records
(Figure 6E) and compare them with reconstructions of solar and volcanic activity, respectively
(Figure 6A), the sum of glacier advances as well as cold and dry periods [32] (Figure 6B). The ME
composite was produced as follows: first, data from each of the reconstructions were averaged into
bins (at 25-year and 200-year intervals); second, each binned series was normalized. The normalized
anomalies are visualized as boxes that are connected with a 3-point running average of 25-year binQuaternary 2019, 2, 16 15 of 28
means (Figure 6D). The same process is applied to Greenland ice cores [140] (Figure 6C). EM
planktonic δ18Occ profiles are also shown in order to highlight the source vapor isotopic variability,
if recorded [64,109,141] (Figure 6E).
Rapid, prominent events observed in both continental and marine palaeo-archives during glacial
periods are also evident during the Holocene, although less pronounced. This persistent rapid
variability is suggested to be in response to an internal rhythmic throbbing of the climatic system at
centennial scales [142]. In the scope of this review, three reference Holocene events are reviewed: ca.
8200 years BP (referred to here as the 8.2 k event), ca. 4200 years BP (4.2 k event) and ca. 700 years BP
(0.7 k or LIA). These events are concomitant with major glacier advances in the Northern Hemisphere
[32,143] (Figure 6B).
The base of the Holocene is defined in the North Greenland Ice Core Project’s NGRIP2 ice core,
at 11,650 years BP [144]. The Early Holocene goes from the base to the 8.2 k event [145], coeval with
a final drainage of northern ice-dammed lakes causing a freshwater outburst into the North Atlantic
[146] and the formation of Sapropel 1 in the Mediterranean [109,147]. The tail-end of Sapropel 1 in
the EM (roughly 8.2 ka BP until a little after 7 ka BP) in seen in the normalized ME composite as
trending toward more positive δ18Occ values, the result of superposition of a general drying trend
[109] and the enrichment trend of sea surface water δ18O (Figure 6E). The normalized ME composite
during this period displays the highest variability (i.e., the difference 25%–75% percentiles) observed
for the entire 12 kyr composite (Figure 5D). This high variability indicates disagreement between the
time-series of the various entities, hence increased regional heterogeneity. Sapropels are recorded in
marine sediments due to a change either in the flux of organic matter to the sea floor from
productivity changes or in preservation by low oxygen levels in bottom-waters [148,149]. Factors
such as monsoon intensification, increased runoff from North Africa into the Mediterranean Sea and
preconditioning due to meltwater events/sea-level rise are potential factors leading to sapropels
[109,147]. In addition, the particular geomorphology and hydrology of the Mediterranean basin
favours their deposition [148].
The 8.2k event marks the mid-point of Sapropel 1–a generally humid period in the ME–and is
indicated by a rapid positive anomaly in most ME entities (interpreted as cold/dry) (Figure 6C–E).
The 25-year bin line of the normalized ME composite analysis does not indicate a pronounced 8.2 ka
event, while the 200-year bin box highlight it as an interruption of this generally humid period, with
distinct heterogeneity in the records (Figure 6D). In the marine sediment δ18O record (Figure 6E), the
8.2 ka event is not as dominant as in other marine proxies [147], but Sapropel 1 appears as a negative
‘hump’ in the δ18O time-series, where peak negative values are in agreement with the 8.2 ka event as
well as cold reversal consistent in the North Atlantic context (Figure 6B,C) [32,150,151]. The 8.2 ka
event is recorded in multiple records as a pronounced cold temperatures lasting ca. 160 years
(Greenland, Figure 6C), together with a decreased snow-accumulation rate [152]. The 8.2 ka event is
preceded by a remarkable minimum in solar activity [153] and an increase in the magnitude and
frequency of volcanic eruptions [140] (Figure 6A). The Dead Sea level was sustained at low during
the 8.2 k event, which would suggest anomalously low rainfall intensities [154]. Thus, the 8.2 k event
is placed within a distinct cooling of the Aegean-Levantine regions from 8.6 to 8.0 ka BP, when
African monsoon indicators suggest a change from an increased moisture availability to a decline
towards a modern-type aridity reached at around 6 to 5.5 ka BP (Rohling et al. [143] and references
therein) with a discontinuously wet and vegetated Sahara [155–157]. In the Levant, this behaviour of
the ITCZ (African and Indian monsoon driver) could explain why the 8.2 k event results in
differentiated records across the ME region. In the Levant, the 8.2 ka event is suggested to be coeval
with Neolithic revolution traits (e.g., the transition from the Pre-Pottery to the Pottery period) [158].
The 4.2 ka event is one of several decadal to centennial scale, regional to global, Rapid Climate
Change (RCC) events that characterize the mid to late -Holocene [30,159]. The 4.2 ka marks the
transition into the late-Holocene and is generally considered as a cold drought event, between ~4.2
and ~3.8 ka. The drought event lead to considerable environmental stress, most notably in
Mediterranean and Levant societies, with cultural changes and settlement abandonment are seen
from the Near East to Northern Mesopotamia as part of the end-phases of the Bronze age [28,160–Quaternary 2019, 2, 16 16 of 28
162]. Although the 4.2 ka is a widely studied phenomena, identifiable in multiple records and proxies,
there is still considerable debate regarding the timing, nature and drivers of the event (or 4.2 to ~3.8
cycle) [28,159]. Thus, the SISAL entities timing if the event is also not as straight forward and
ubiquitous. Comparing the δ18Occ time-series of Soreq Cave to that of Jeita Cave, there is a close to
centennial offset between the positive δ18Occ excursion found in the Soreq composite (~4.2 ka), and
the positive shift in Jeita Cave δ18Occ (Figure 5A). The Soreq δ18Occ excursion is superimposed on a
prolonged drying trend starting circa 4.8 ka, when in contrast during the Soreq 4.2 ka itself, Jeita Cave
expressed a rapid negative δ18Occ excursion, commonly regarded as a wet condition (which Cheng
et al., interpret to last until 2.9 ka [53]). The offset between the caves could also be a naturally
occurring time transgressive phenomena, similar termination of the African Humid Period which
progressed from north to south, following a gradual reduction in monsoon rainfall [163,164].
Inconsistencies between the Jeita and Soreq records have been suggested to be consistent with the
progressive southward decrease in the regional humidity [53]. With the offset in mind, both caves
appear to produce a close to W-shape event, with cold-warm/dry-wet episodes lasting decades to
centuries, rather than a major single event (Figure 5A). This is in agreement with observation from
Skala Marion Cave [165] and highlighted in regional multi-record compilations, such as a Dead Sea
level drop lasting close to five centuries [154,159,166]. In this regard, the ME composite suggests that
circa 3.8 ka marks the culmination of the observed gradual increase in aridity starting after the
termination of Sapropel 1 (Figure 6D). The period between ~4.8 and ~4.0 ka has minor spatial
heterogeneity which can be indicative of a less premiant and regionally unique event and weaker
than the previous warming event circa 5.6 ka. However, as there is a gap in SISAL_v1 AP records for
the duration of the event/cycle and the available records have much lower resolution for this specific
time period [28], we would recommend additional records to be included in the ME composite before
any significant conclusions be drawn for this climate period.
The Little Ice Age (LIA) is the most recent climate anomaly of the Late Holocene and had strong
impacts on European societies [167,168]. Greenland ice cores show the coldest individual bins of the
past 2000 years during this period and a similar pattern is observed for EM marine profiles (Figure
6C–E). Over the past 2 kyrs, the ME composite (Figure 6D) shows a high variability (i.e., the difference
25%–75% percentiles), as regional heterogeneity intensifies around what seem to be the coldest
periods in the North Atlantic since the early Holocene [32]. Unlike the previous cold events reviewed
(8.2 ka and 4.2 ka), the LIA shows a tendency towards more moisture availability, consistent with
higher lake-levels at the Dead Sea [154]. Forcing simulations suggest that this pattern is consistent
with a global cooling trend arising from an increased frequency of volcanic activity and/or land use
change [138] (Figure 6B). Studies in the North Atlantic show year-to-year variability during the Little
Ice Age: severe droughts, floods, intense storm activity during late summer-early autumn, cold/heat
waves that showed significant spatio-temporal variation and exceptional wintertime conditions, with
sea ice expansion and reduced northward heat transport by the subpolar gyre [169–171]. In the
Levant, the onset of the Little Ice Age coincides with the end of the Crusades and reinforcement of
the Mamluk sultanate and Ottoman empire, between the 14th and early 20th centuries [162], similar
to the rise and subsequent fall of the Roman rule over the Levant during the “Roman Humid Period”
[14].
5. Conclusions and Future of SISAL Project in the Middle East
5.1. Emphasis for Future Speleothem Research in the Middle East
The main goal for future speleothem research in the Middle East (ME) would be to increase
spatial coverage in the region (Figure 1, Table 1), specifically in the Fertile Crescent (FC), Arabian
Peninsula (AP) and Saharan belt (Egypt, Negev) sub-regions where current site density is
considerably lower than the Levant. Efforts in these environments are specifically important as the
spatial distribution of carbonate bedrock is not continuous so without regional continuity, improved
entity density would improve reginal analysis coherency.You can also read