REPORT ON THE EFFECTS OF CLIMATE CHANGE ON MIGRATORY WATERBIRDS WITHIN THE AFRICAN-EURASIAN FLYWAYS - AEWA
←
→
Page content transcription
If your browser does not render page correctly, please read the page content below
AGREEMENT ON THE CONSERVATION OF                             Doc: AEWA/MOP 4.27
                         AFRICAN-EURASIAN MIGRATORY WATERBIRDS                                Agenda item: 25
                                                                                             Original: English

                                                                                         Date: 18 August 2008
                       4th SESSION OF THE MEETING OF THE PARTIES
                          15 – 19 September 2008, Antananarivo, Madagascar

             “Flyway Conservation at Work – Review of the Past, Vision for the Future"

  REPORT ON THE EFFECTS OF CLIMATE CHANGE ON MIGRATORY
     WATERBIRDS WITHIN THE AFRICAN-EURASIAN FLYWAYS

Introduction
In its resolution 3.17 the Meeting of the Parties instructed the Technical Committee to assess on the basis of
current evidence the effects of climate change on migratory waterbirds and review implications of modelled
future patterns of climate change on waterbirds. Under a grant provided by UK on the implementation of
resolution 3.17 and after a call for tenders the Secretariat commissioned the compilation of a report to the
British Trust for Ornithology (BTO). BTO was also commissioned to produce guidelines on measures to
help waterbirds adapt to the conditions of changing climate.

The first draft of this comprehensive report was commented by the Technical Committee in late 2007. The
second draft was approved by the Technical Committee at its 8th meeting in March 2008 and was endorsed
by the Standing Committee at its 5th meeting in June 2008 for submission to MOP4. Conclusions and
recommendation from the report served as a basis for draft Resolution 4.15.

Action requested from the Meeting of the Parties
The Meeting of the Parties is invited to note the Report on the effects of climate change on migratory
waterbirds within the African-Eurasian flyways and take its conclusions and recommendations into account
in the decision making process.
BTO Research Report No. 486

                                                                   Photo: © Rob Martin

         The Effects of Climate Change on Migratory
        Waterbirds within the African-Eurasian Flyways
                                       Authors

Ilya M.D. Maclean1, Mark M. Rehfisch1, Simon Delany2 & Robert A. Robinson1

                                    October 2007
    1
     British Trust for Ornithology, The Nunnery, Thetford, Norfolk IP24 2PU
2
    Wetlands International, PO Box 471, 6700 AL Wageningen, The Netherlands

            Report of work carried out by The British Trust for Ornithology
                       under contract to the AEWA Secretariat

                          © British Trust for Ornithology
                              Registered Charity No. 216652

                                           1
CONTENTS
CONTENTS ............................................................................................................................... 2
List of Tables.............................................................................................................................. 5
List of Figures ............................................................................................................................ 5
List of Appendices ..................................................................................................................... 6
EXECUTIVE SUMMARY........................................................................................................ 8
1. INTRODUCTION............................................................................................................ 12
2. CLIMATE CHANGE WITHIN THE AEWA AGREEMENT AREA ........................... 14
  2.1.     Temperature change ................................................................................................. 14
     2.1.1.     Global ............................................................................................................... 14
     2.1.2.     Africa................................................................................................................ 15
     2.1.3.     Europe and the eastern Nearctic....................................................................... 15
     2.1.4.     Middle East and Asia Minor ............................................................................ 16
  2.2.     Rainfall change and drought .................................................................................... 16
     2.2.1      Global ............................................................................................................... 16
     2.2.2.     Africa................................................................................................................ 17
     2.2.3.     Europe and the north-eastern Nearctic ............................................................. 17
     2.2.4.     Middle East and Asia Minor ............................................................................ 18
  2.3.     Global changes in wind patterns .............................................................................. 18
  2.4.     Global large-scale climate circulation patterns ........................................................ 18
  2.5.     Sea-level rise ............................................................................................................ 19
3. CURRENT EFFECT OF CLIMATE CHANGE ON WATERBIRDS ........................... 21
  3.1.     Changes in range and distribution............................................................................ 21
     3.1.1.     Changes in breeding range ............................................................................... 21
     3.1.2.     Changes in wintering range.............................................................................. 22
     3.1.3.     Changes in migratory routes ............................................................................ 24
  3.2.     Timing of biological events...................................................................................... 26
     3.2.1.     Timing of migration ......................................................................................... 26
     3.2.2.     Timing of breeding........................................................................................... 26
     3.2.3.     Mechanisms, evolutionary traps and constraints.............................................. 27
  3.3.     Changes in demography ........................................................................................... 28
     3.3.1.     Survival ............................................................................................................ 28
     3.3.2.     Productivity ...................................................................................................... 29
     3.3.3.     Population impacts ........................................................................................... 31
  3.4.     Effects of changing rainfall patterns ........................................................................ 32
     3.4.1.     The Sahel region and crucial stop-over sites.................................................... 32
  3.5.     Effects of sea-level rise ............................................................................................ 33
  3.6.     Wind, Storms and Hurricanes .................................................................................. 34
  3.7.     Indirect impacts of climate change........................................................................... 34
     3.7.1.     Climate change and land-use change ............................................................... 34
     3.7.2.     Climate change and water-use change ............................................................. 35
     3.7.3.     Climate change and flood-defences ................................................................. 35
     3.7.4.     Climate change and tourism and recreation ..................................................... 35
4. FUTURE EFFECTS OF CLIMATE CHANGE ON WATERBIRDS ............................ 36
  4.1.     A framework for modelling future changes: approaches and limitations ................ 36
     4.1.1.     Extrapolation .................................................................................................... 36
     4.1.2.     Experiments...................................................................................................... 36
     4.1.3.     Phenomenological models................................................................................ 36
     4.1.4.     Behaviour-based models .................................................................................. 37
     4.1.5.     Expert opinion .................................................................................................. 37

                                                                      2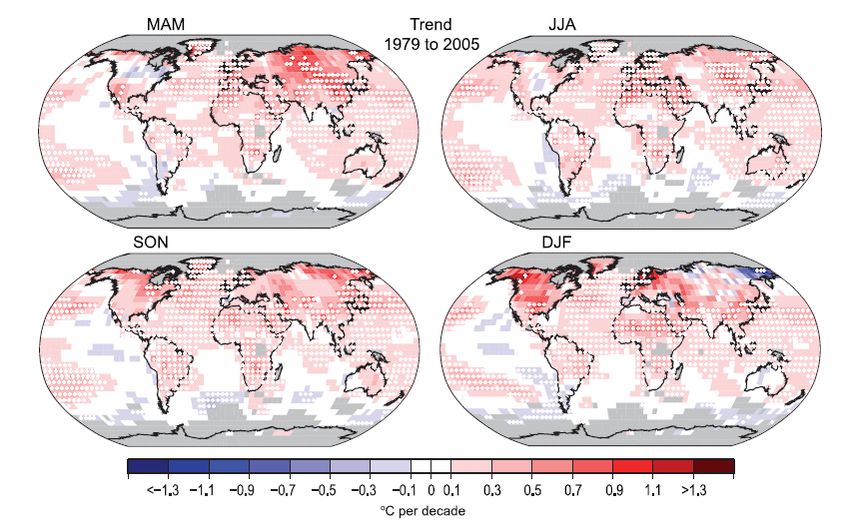
4.1.6.     Outcome-driven models ................................................................................... 37
     4.1.7.     Scenarios .......................................................................................................... 37
  4.2.    Future distribution and range changes ..................................................................... 38
  4.3.    Future changes in timing of biological events ......................................................... 40
  4.4.    Future changes in predation and parasitism ............................................................. 40
  4.5.    Future changes in demography ................................................................................ 41
  4.6.    Future effects of changing rainfall patterns.............................................................. 41
  4.7.    Future effects of sea-level rise ................................................................................. 42
  4.8.    Future indirect impacts of climate change ............................................................... 43
     4.8.1.     Future climate change and land-use change..................................................... 43
     4.8.2.     Future climate change and water-use change................................................... 44
     4.8.3.     Future climate change and flood-defences....................................................... 44
     4.8.4.     Future climate change and recreational disturbance ........................................ 45
5. POSSIBLE MEANS OF ADAPTING TO CLIMATE CHANGE .................................. 47
  5.1.    Site management ...................................................................................................... 47
  5.2.    Protected area networks ........................................................................................... 47
  5.3.    Management of the wider countryside ..................................................................... 48
  5.4.     Minimising other impacts......................................................................................... 48
6. SPECIES ESPECIALLY VULNERABLE TO CLIMATE CHANGE........................... 50
  6.1.    Criteria used to assess vulnerability ......................................................................... 50
     6.1.1.     Population size ................................................................................................. 50
     6.1.2.     Range score ...................................................................................................... 51
     6.1.3.     Fragmentation score ......................................................................................... 51
     6.1.4.     Habitat score..................................................................................................... 52
     6.1.5.     Food score ........................................................................................................ 52
  6.2.     List of vulnerable species......................................................................................... 52
     6.2.1.     Cape Gannet ..................................................................................................... 53
     6.2.2      Crowned Cormorant......................................................................................... 54
     6.2.3.     Bank Cormorant ............................................................................................... 54
     6.2.4.     Slaty Egret ........................................................................................................ 55
     6.2.5.     Northern Bald Ibis............................................................................................ 55
     6.2.6.     White-winged Flufftail..................................................................................... 56
     6.2.7.     Madagascar Pratincole ..................................................................................... 57
     6.2.8.     Slender-billed Curlew ...................................................................................... 58
     6.2.9.     Damara Tern..................................................................................................... 59
  6.3     List of vulnerable populations.................................................................................. 59
     6.3.1.     White Stork – Southern Africa population....................................................... 59
     6.3.2.     Northern Bald Ibis – South-west Asia South Asia wintering population ........ 61
     6.3.3.     Northern Bald Ibis – Morocco population ....................................................... 61
     6.3.4.     Cape Teal - Lake Chad basin population ........................................................ 61
     6.3.5.     White-headed Duck - Algeria & Tunisia population ....................................... 62
     6.3.6.     Common Crane – Turkey & Georgia breeding population.............................. 63
     6.3.7      Siberian Crane – Iran wintering population ..................................................... 63
     6.3.8.     Demoiselle Crane –Turkey breeding population ............................................. 64
     6.3.9.     Demoiselle Crane – Black Sea (Ukraine) / North-east Africa population ....... 64
     6.3.10. White-winged Flufftail – Ethiopia & Southern Africa..................................... 65
     6.3.11. Chestnut-banded Plover – venustus - Eastern Africa population ..................... 65
     6.3.12. Slender-billed Curlew – entire population ....................................................... 66
7. INTERNATIONAL RESEARCH NEEDS...................................................................... 67
  7.1.    Can birds evolve fast enough to keep pace with climate change? ........................... 67

                                                                  3
7.2. Does climate change affect population sizes?.......................................................... 67
7.3. Climate change and migration cues ......................................................................... 68
7.4. Climate variability in early spring............................................................................ 69
7.5. Sea-level rise and risk of nest flooding .................................................................... 69
8. CONCLUSIONS.............................................................................................................. 70
ACKNOWLEDGEMENTS ..................................................................................................... 71
APPENDICES.......................................................................................................................... 72
7.6. APPENDIX 1 – SPECIES VULNERABILITY TO CLIMATE CHANGE............ 72
7.7. APPENDIX 2 – POPULATION VULNERABILITY TO CLIMATE CHANGE .. 78
REFERENCES......................................................................................................................... 80
4List of Tables
Table 1. Palaearctic-Afrotropical migrants with small wintering populations north of the
Sahara. The location of the main northern wintering population is indicated by
an X in the appropriate column. Some species (indicated by the absence on an
X in any column) do not currently over-winter north of the Sahara, but are
considered good candidates for doing so in the future.......................................................... 24
Table 2. Effects of weather variables on the survival, productivity or local population size
of species listed on Annex 2 of the Agreement. Data on productivity are generally
lacking................................................................................................................................... 31
Table 3. Migratory waterbird species listed in Appendix 2 of AEWA, for which a substantial
proportion breeds or winters range in wetlands either Southern Africa / Madagascar
or the Mediterranean Basin and/or Caspian Sea area, two regions predicted to dry
substantially. Source: Wetlands International (2006) ........................................................... 42
Table 4. Contributing climate vulnerability score as a result of population size. ................................. 50
Table 5. Contributing climate vulnerability score as a result of range size........................................... 51
Table 6. Contributing climate vulnerability score as a result of fragmentation. ................................... 51
Table 7. Assessment of vulnerability of all species listed on Annex 2 of the AEWA
Agreement which are either critically threatened by climate change () or highly
threatened by climate change (). ........................................................................................ 53
1 List of Figures
Figure 1. Area covered by the African-Eurasian Waterfowl Agreement. Source: (AEWA 2007) ...... 13
Figure 2. Linear trend of seasonal MAM, JJA, SON and DJF temperature for 1979 to 2005
(°C per decade). Areas in grey have insufficient data to produce reliable trends.
Source: IPCC (2007b) .................................................................................................. 14
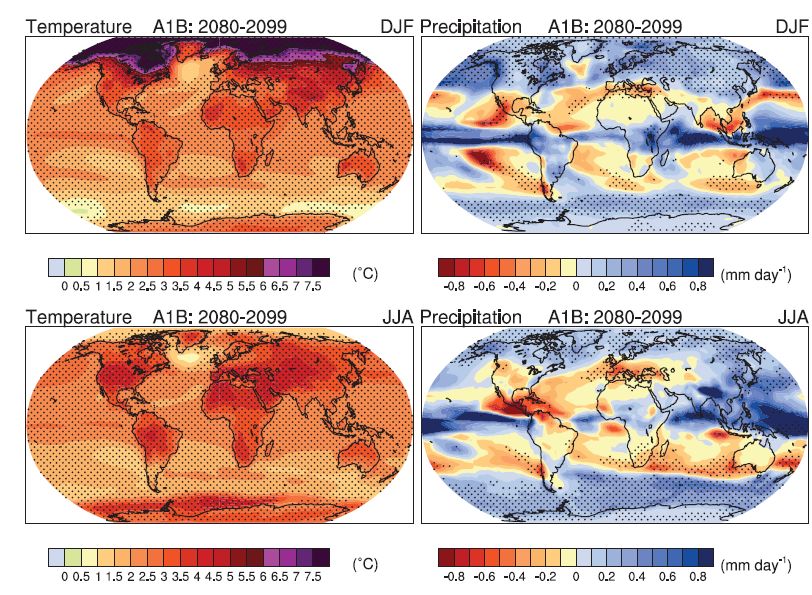
Figure 3. Multi-model mean changes in surface air temperature (°C, left) and precipitation
(mm day–1, right) for boreal winter (DJF, top) and summer (JJA, bottom). Changes
are given for the IPCC (2007b) SRES A1B scenario, for the period 2080 to 2099
relative to 1980 to 1999. Stippling denotes areas where the magnitude of the multi-
model ensemble mean exceeds the inter-model standard deviation.
Source: IPCC (2007b). ................................................................................................. 15
Figure 4. Wetland Bird Survey index (solid) and smoothed-trend (dashed) values of Little
Egret Egretta garzetta over-wintering in Britain (left). Mean number of Cattle
Egrets Bubulcus ibis reported in the Britain and Ireland every month (right).
Source: Rare Bird Alert. Note: data from 2008 are 1 Jan – 19 Feb inclusive,
but are considered to span two-months. ......................................................................... 22
Figure 5. Distribution change in Bar-tailed Godwit Limosa lapponica between the winter
of 1998/99 and 2003/04 (short-term), 1993/94 and 2003/04 (medium-term) and
1978/99 (long-term). The general shift eastward is evident. Source: Maclean &
Austin (2006). ............................................................................................................. 23
Figure 6. Mean number of Dunlin over-wintering on the Severn Special Protection Area
(SPA). The dotted line represents 1% of the international population, the threshold
used to designate this site as an SPA for this species. Waders on a number of
estuaries in the west of the UK have declined such that they have or will soon
drop below the threshold used for designation. Source: Austin & Rehfisch (2005)............ 23
Figure 7. The number of Common Greenshank Tringa nebularia over-wintering in the West
Mediterranean. Source Wetlands International. Numbers in both areas have increased
recently, possibly in response to milder winters. ............................................................. 24
Figure 8. Storm return period for the coast of Egypt. A 20 cm rise would thus result in 1 in
100 year events occurring 4-5 times a year and a 50 cm rise would result in 1 in 100
year events occurring once or twice a week. Adapted from Nichols et al. (1999) .............. 33
52 List of Appendices
Appendix 1. Assessment of vulnerability of all species listed on Annex 2 of the AEWA
Agreement. = critically threatened by climate change; = highly
threatened by climate change; = moderately threatened by climate
change; = some threat from climate change; = minimal threat from
climate change ............................................................................................................... 79
Appendix 2. Populations listed on Table 1 of the AEWA Agreement, which are
either critically threatened by climate change () or highly threatened
by climate change (). Win = winter ............................................................................ 85
67
EXECUTIVE SUMMARY

1.    Climate change: past and future

1.1   It is now unequivocal that our climate is warming. Observations of increases in global average
      air and ocean temperatures, widespread melting of snow and ice and rising global average sea
      levels all point directly to a warmer planet. Temperatures are predicted to increase by
      anywhere between 0.9 and 3.8°C by 2100, with the highest warming occurring near the poles,
      particularly in the northern hemisphere.

1.2   Precipitation has, and is generally predicted to increase in the tropics and polar regions, but
      decrease at mid-latitudes, with the Mediterranean basin and South Africa experiencing
      considerably lower rainfall in the future.

1.3   During the 20th century sea-level rose at an average rate of about 1.7 mm yr-1, but since 1990
      this rate has increased and it has been rising at a rate of around 3 mm yr-1. Estimates of future
      sea-level rise vary considerably, but if the Greenland and Antarctic ice sheets melt, sea-levels
      could rise by several metres over the course of the next century.

2.    Climate change impacts

2.1   This report describes the past and likely future impacts of climate change on waterbirds within
      the African-Eurasian Flyways. Waterbirds are likely to be amongst the organisms most
      adversely affected by climate change as they are associated with a habitat that is very
      vulnerable to changes in rainfall, evaporation and human-demand and because they migrate
      between different areas and could thus be deleteriously affected in any one of those areas.
      Coastal waterbirds will be also be affected by sea-level rise.

2.2   Both the breeding and wintering ranges of waterbird species covered by AEWA are moving
      poleward or shifting upwards. Some coastal waterbird species in north-west Europe have
      shifted their wintering grounds by more than 100 km in the last 20 years. Poleward shifts in
      breeding distributions are less dramatic, but nevertheless well documented. Such shifts are
      expected to occur and accelerate in the future.

2.3   At present, reductions in abundance at the lower-latitude extremities of species’ ranges are
      often matched or exceeded by increases at the poleward edge. However, several waterbird
      species breed on the poleward margins of continental landmasses and have nowhere to move
      to. As species continue to move poleward, increasing numbers of species will face this
      problem. Similarly, shifts in coastal waterbirds may force them to utilize areas with lower tidal
      amplitudes and consequently less area for feeding.

2.4   Warmer temperatures have resulted in many species advancing aspects of their life cycle.
      Earlier arrival from wintering grounds and earlier onsets of breeding are well documented
      across many species and from numerous locations. Changes in the departure date from
      breeding grounds are less consistent, as warming temperatures enable earlier completion of
      breeding, but also reduce the risk of mortality due to cold temperatures in late autumn and
      early winter.

2.5   As climate changes, the cues used to advance breeding and arrival from wintering grounds can
      act as evolutionary traps, whereby former reliable signals might no longer serve to maximise
      benefits to waterbirds. For example, organisms often advance their life-cycles at different rates
      and there are well documented instances where mismatch between the timing of hatching and
      the timing of prey availability has occurred. Similarly, earlier nesting resulting from warmer
      temperatures in early spring can expose birds to higher rainfall, leading to increased chick
      mortality.

                                                  8
2.6 Waterbirds are likely to become more susceptible to such evolutionary traps as temperature
increases accelerate, unless they can evolve sufficiently quickly to accommodate changes in
climate. At present the speed at which such evolutionary responses can occur is poorly
documented.
2.7 The impacts of climate change on the demography of waterbirds are not well studied, although
there are some documented cases of long-term changes in survival and productivity in non
waterbird species. The impacts of weather on the survival and productivity of waterbird
species are very well documented, and consequently it seems reasonable to expect that climate
change will affect demography. Both survival and productivity are generally unfavourably
affected by cold temperatures. Thus warming temperatures are likely to boost the populations
of species over-wintering in cold areas. It should be noted however that increases in one
species are likely to result in decreases in competing species, so for example, migrants are
likely to face greater competition from residents during the breeding season.
2.8 In general, indirect impacts on survival and productivity are less clearly understood. Higher
temperatures may result in adverse indirect effects such as increased evapotranspiration of
wetlands. Likewise rainfall may have mixed effects. High rainfall could increase the mortality
of some waterbirds, particularly those that do not have fully waterproof feathers, such as
newly hatched young, but might also increase the number of wetlands. The impacts of range
shifts and changes in phenology on survival and productivity has received little attention.
2.9 Changes in survival and productivity resulting from climate change, may be at least partially
compensated for because most populations are density-dependent. Thus, the population-level
impacts of climate change remain poorly understood.
2.10 Waterbirds that persist in areas subject to ‘coastal squeeze’, whereby the landward movement
of habitats is prevented by flood defences are also likely to be particularly vulnerable.
Documented instances of the effects of ‘coastal squeeze’ on waterbirds are limited to a few
examples of species loss in northwest Europe.
2.11 Climate change is likely to interact with other factors, such as habitat loss and fragmentation
to worsen the impact of that factor. Other factors interacting in this way include alien species
invasion and human demand for water resources and land as areas near the equator become
less suitable.
3. Climate change adaptations
3.1 The magnitude of future impacts of climate change on waterbirds is likely to be considerably
affected by human habitat modification, offering considerable opportunities for adaptive
management. Adaptive management options include: site management, establishing a
coherent network of protected areas, management of the wider countryside and minimisation
of other impacts,
3.2 Site management could entail manipulation of vegetation structure to ensure cooler micro-
climates or ‘managed-realignment’ and controlled flooding of coastal wetlands. Other site
management options include manipulation of hydrology, but in so doing, due consideration
should be given to potential knock-on effects that occur downstream.
3.3 Ensuring a coherent network of sites could buffer populations against climate change by
increasing the overall available area of habitat, but also by facilitating dispersal between sites.
Although birds are highly mobile and could move easily, the prey on which they depend may
have more difficulty moving unless sites are located sufficiently close together. Highest
priority should be given to establishing protected areas at the beginning or end or arduous
9migration stages or in areas where there is a paucity of protected areas at present. To this end,
the creation of more protected areas immediately north and south of the Sahara is crucial.
3.4 Although networks of protected areas provide one means of aiding species dispersal, another
way is to manage the wider countryside more favourably. In developed countries this is likely
to be best achieved by strategically integrating this objective with existing land- and water-use
policies such as into agri-environment schemes, the water-frameworks directive or into flood
management plans. In developing countries this is likely to be best achieved by seeking win-
win situations with people, as local people tend to exercise more power than governments
over the local use of wetland resources. Minimisation of other impacts, serves to buffer
waterbird populations against climate change, and particularly in the marine environment may
be the most feasible adaptation measure.
4. Climate change vulnerability
4.1 We constructed a climate vulnerability index to identify which species are most at risk from
climate change. Species with small populations, small ranges, with highly fragmented ranges,
associated with threatened or vulnerable habitats and with specialist requirements are
considered most at risk from climate change.
4.2 Using this index, two of the species listed on Annex 2 of the AEWA Agreement are judged to
be critically threatened by climate change, a further seven are considered highly threatened, a
further 14 considered moderately threatened, a further 61 judged to experience some threat
from climate change, with the remainder (150) considered only negligibly threatened. Slender-
billed Curlew Numenius tenuirostris and White-winged Flufftail Sarothrura ayresi are judged
to be critically threatened and Cape Gannet Morus capensis, Crowned Cormorant
Phalacrocorax coronatus, Bank Cormorant Phalacrocorax neglectus, Slaty Egret Egretta
vinaceigula, Northern Bald Ibis Geronticus eremita, Madagascar Pratincole Glareola ocularis
and Damara Tern Sterna balaenarum are considered highly threatened.
4.3 Species’ populations listed on Table 1 of the Agreement are considered to be more threatened
than species listed on Annex 2. Thirteen are judged to be critically threatened and a further 18
are considered highly threatened. Overall, even the least-threatened population of a given
species is more threatened by climate change than the species itself. Although this is an
inevitable conclusion given the criteria used to assess threat, it serves as a reminder that focus
on species as opposed to populations may underestimate the degree of threat facing
waterbirds.
5. Future research
5.1 We recommend that future climate-related waterbird research and conservation action be
directed towards these vulnerable species and populations. However, we also recommend that
future research should concentrate on broad themes that test avian responses to climate change
as a whole rather than the response of just one species. Highest amongst such research
priorities is whether species can evolve sufficiently quickly to keep pace with climate change.
Other important questions include whether adverse impacts are compensated for by reduced
density-dependent mortality, and the extent to which cues used to trigger departure from
wintering grounds are correlated with factors that advance the timing of breeding and lead to
phenological disjunction.
5.2 Although all areas of the African-Eurasian flyways are likely to be adversely affected by
climate change, it is sub-Saharan Africa and central and southwest Asia that face the greatest
challenges. These parts of the flyways have a higher diversity of waterbird species and host
many migratory waterbirds during the boreal winter when mortality has the highest impact on
populations. They are also likely to face the most pressure from factors that conflict with
10waterbird conservation interests and are where funding for conservation action is least
adequate. Thus future research and conservation action should be focused on these regions.
111. INTRODUCTION
It is now unequivocal that our climate is warming. Observations of increases in global average air and ocean
temperatures, widespread melting of snow and ice and rising global average sea levels all point directly to a
warmer planet (IPCC 2007b). There is overwhelming evidence that humans are contributing to global
warming. Most of the observed increase in temperatures since the mid-20th century is very likely to be due to
the observed increase in anthropogenic greenhouse gas concentrations (IPCC 2007b). Discernible human
influences now extend to other aspects of climate, including ocean warming and acidification, continental-
average temperatures, temperature extremes and wind patterns. Anthropogenic greenhouse gas emissions are
also one of the main contributing factors to sea-level rise (IPCC 2007b). Climate change is considered to be
the greatest environmental challenge facing the world today (Defra 2007; GEO 2007; King 2004).
Climate change is likely to affect all ecosystems, but wetlands are particularly vulnerable. Not only are they
the world’s most threatened ecosystem (Reid et al. 2005), but their sensitivity to water regimes makes them
especially susceptible to changes in precipitation or evapo-transpiration. Wetlands are among the world’s
most productive environments. They host a very high biological diversity, providing the water and primary
productivity upon which countless species of plants and animals depend for survival (Ramsar 2007).
However, it is waterbirds that are the most widely used tool to identify, designate and justify the protection
of important wetlands (Stroud et al. 2001). Their sensitivity to environmental change, the relative ease with
which they can be counted and their tendency to congregate at key locations make them effective proxies for
aspects of wider biodiversity (Stroud et al. 2001).
Many waterbirds migrate between different areas to capitalise on seasonally available resources. During
their migrations, these waterbirds cross political boundaries between nations; boundaries that have no
inherent meaning for the birds, but which have a dramatic influence on their annual life-cycles and their
individual survival chances, due to the great differences that exist between countries in conservation policy.
Migratory species are dependent on the specific sites that they find at the end of their journey and along the
way. Increasingly these sites are threatened both by climate change and other human disturbances and causes
of habitat degradation. Historically, the plight of waterbirds has been aggravated by the fact that it has long
been held that migratory species legally do not fall within the jurisdiction of one particular country which
could be held responsible for any harm occurring to them. However, in 1972 the United Nations Conference
on the Human Environment, recognized the need for countries to co-operate in the conservation of animals
that migrate across national boundaries or between areas of national jurisdiction and the high seas. This
recommendation resulted in the Convention on the Conservation of Migratory Species of Wild Animals
(CMS), which came into being in 1979. The goal of the CMS is to provide a framework for the conservation
for migratory terrestrial, marine and avian species over the whole of their range. This is very important,
because failure to conserve these species at any particular stage of their life cycle could adversely affect any
conservation efforts elsewhere. The fundamental principle of the CMS is that contracting parties
acknowledge the importance of migratory species being conserved and of Range States agreeing to take
action to this end whenever possible and appropriate, paying special attention to migratory species, with
unfavourable conservation status, and taking individually or in co-operation appropriate and necessary steps
to conserve such species and their habitat (CMS 2007).
A specific daughter agreement of the CMS designed to conserve waterbirds within the African-Eurasian
flyways is the African-Eurasian Migratory Waterbird Agreement (AEWA), which came into being in 1995.
The AEWA covers 235 species of birds ecologically dependent on wetlands for at least part of their annual
cycle, including many species of divers, grebes, pelicans, cormorants, herons, storks, ibises, spoonbills,
flamingos, ducks, swans, geese, cranes, rails, waders, gulls, terns and even the south African penguin. The
Agreement provides for coordinated and concerted action to be taken by the Range States throughout the
migration system of waterbirds to which it applies (AEWA 2007). The African-Eurasian flyway (see Figure
1) is one of at least seven major flyways and geographically, covers 118 and the European Community (EC)
from parts of Europe, Asia, Canada, the Middle East and Africa. The geographical area covered by the
AEWA stretches from the northern reaches of Canada and the Russian Federation to the southernmost tip of
Africa.
12Figure 1. Area covered by the African-Eurasian Waterfowl Agreement. Source: (AEWA 2007)
3
132. CLIMATE CHANGE WITHIN THE AEWA AGREEMENT AREA
2.1 Temperature change
2.1.1. Global
Global mean temperatures have risen by 0.74ºC ± 0.18ºC when estimated by a linear trend over the last 100
years (1906-2005). The rate of warming over the last 50 years is almost double that over the last 100 years
(IPCC 2007b). Following a period in the late-1800s, when temperatures were about 1.3ºC colder than today,
temperatures rose to 0.8ºC colder than present in the late 1930s, prior to a slight cooling of 0.2ºC, which
lasted up until the late-1970s, followed by rapid warming of about 1ºC during the last 25 years (Brohan et al.
2006; Hansen et al. 2001). Temperatures at present are warmer than at any point during the last thousand
years. Eleven of the last twelve years (1995–2006) rank among the 12 warmest years in the instrumental
record of global surface temperature, which began in 1850 (IPCC 2007b). Palaeoclimatic information
suggests that current temperatures are unusual in at least the previous 1,300 years. Average Northern
Hemisphere temperatures during the second half of the 20th century are very likely to be higher than during
any other 50-year period in the last 500 years and likely to be the highest in at least the past 1,300 years. The
last time the polar regions were significantly warmer than at present for an extended period was about
125,000 years ago (IPCC 2007b). Seasonally, warming is generally slightly higher in winter (IPCC 2007b).
Globally, the number of frost-days has decreased by about 4 days since 1880 and the growing season has
increased by 2 days. Seasonal global temperature changes between 1979 and 2005 are shown in Figure 2.
Figure 2. Linear trend of seasonal MAM, JJA, SON and DJF temperature for 1979 to 2005 (°C per decade).
Areas in grey have insufficient data to produce reliable trends. Source: IPCC (2007b)
For the next two decades, a warming of about 0.2°C per decade is projected (IPCC 2007b). Even if the
concentrations of all greenhouse gases and aerosols were to be reduced to their concentration at year 2000
levels, a further warming of about 0.1°C per decade would be expected. Continued greenhouse gas emissions
at or above current rates will cause further warming and induce many changes in the global climate system
during the 21st century that are very likely to be larger than those observed during the 20th century (IPCC
2007b). Predicted temperature increases vary according to scenarios of greenhouse gas emissions and there is
also uncertainty associated with each projection such that overall, temperatures are predicted to increase by
anywhere between 1.1 and 6.4°C by 2100 (IPCC 2007b). It is most plausible that temperature increases will
be somewhere in the region of 2-3°C. Seasonal predictions of global temperature changes are shown in
Figure 3.
14Figure 3. Multi-model mean changes in surface air temperature (°C, left) and precipitation (mm day–1, right)
for boreal winter (DJF, top) and summer (JJA, bottom). Changes are given for the IPCC (2007b) SRES A1B
scenario, for the period 2080 to 2099 relative to 1980 to 1999. Stippling denotes areas where the magnitude
of the multi-model ensemble mean exceeds the inter-model standard deviation. Source: IPCC (2007b).
2.1.2. Africa
Mean temperature increase has been variable across Africa. The greatest warming has occurred in western
regions, particularly just north and just south of the Sahara, where temperatures have increased by about 1ºC
(linear trend estimate 1901-2005). In eastern Africa, particularly inland, temperature increases during the 20th
century were moderate (c. 0.2ºC) and in some areas did not increase at all (Smith & Reynolds 2005).
Differences in the degree of warming between seasons are relatively small. There is some evidence of more
widespread warming in northern Africa in December, January and February and of less warming within the
Sahara in June, July and August between 1979 and 2005 (Smith & Reynolds 2005).
It is very likely that all of Africa will be warmer this century than last and that the annual average warming
throughout the continent will be higher than the global average (IPCC 2007b). The drier subtropical regions
are expected to warm more than the moister tropics. By 2030, the western Sahara is expected to have
increased in temperature by 1-1.5°C and the rest of Africa by 0.5-1°C. By 2065, temperatures in the Sahara
and inland southern Africa are expected to have increased by 1.5-3°C and in the tropics and coastal northern
Africa, by 1.5-2°C. By 2100, parts of the Sahara could be up to 5.5°C warmer and a warming of about 3.5°C
is expected for all regions except the tropics, which are predicted to increase in temperature by about 2-3°C.
In general, temperatures are likely to increase most in the boreal summer such that on average they will be
about 1°C greater than the annual average (IPCC 2007b).
2.1.3. Europe and the eastern Nearctic
Mean temperature increase has been variable across Europe. The greatest warming has occurred in southern
regions, particularly in the Alps north-east of Italy, where temperatures increased by 2ºC between 1901 and
152005. In northern and western Europe, temperature increases have been moderate over this period (c. 0.5ºC)
and in the south-east of Greenland, temperatures have actually undergone a moderate decrease of up to 0.8ºC
over this period (Smith & Reynolds 2005). There are some notable differences in the degree of warming
between seasons between 1979 and 1997. Boreal winter temperatures in Fenno-Scandia have increased by
more than 3ºC, whereas northern Spain has experienced slight cooling (Smith & Reynolds 2005). Boreal
summer, temperature increases have been moderate in Fenno-Scandia (c. 0.5ºC) and highest in Central
Europe where some regions have experienced a temperature increases in excess of 2ºC (Smith & Reynolds
2005).
Annual mean temperatures in Europe and the north-western Nearctic are predicted to increase by more than
the global mean (IPCC 2007b). Predictions vary, but temperatures are typically expected to increase by
between 2 and 5ºC this century. The warming in northern Europe and the western Nearctic is likely to be
highest in the boreal winter and that in the Mediterranean area largest in the boreal summer. The lowest
winter temperatures are likely to increase more than average winter temperature in northern Europe and the
western Nearctic, and the highest summer temperatures are likely to increase more than average summer
temperature in southern and central Europe (IPCC 2007b). Throughout north-eastern Europe and inland
Greenland, winter temperatures are predicted to increase by almost 10ºC this century and around Svalbard,
by more than 10ºC. In the Mediterranean region, temperature predictions are more moderate and are
expected to be in the region of 2.5ºC. In summer, Mediterranean temperatures are predicted to increase by
5ºC, but northern European and western Nearctic temperatures by only 2-3ºC (IPCC 2007b).
2.1.4. Middle East and Asia Minor
Mean temperature increase has been variable across the Middle East and Asia Minor. The greatest warming
has occurred in Iran and immediately to the east of the Caspian Sea where between 1901 and 2005, mean
temperatures increased by more than 2ºC. Across the Arabian peninsula there was a gradient of warming
with moderate increases in the east of about 1.3ºC, but negligible to very slight increases in the northwest
(Smith & Reynolds 2005). There were few broad-scale seasonal differences, but some small-scale ones.
Between 1979 and 2005, the area to the east of the Caspian Sea has experienced the greatest warming in the
boreal winter, whereas the area to the south and across the north of the Arabian peninsula has experienced
greater temperature increases in the boreal summer (Smith & Reynolds 2005).
Annual mean temperatures in the Middle East and Asia Minor are predicted to increase by slightly more than
the global mean (IPCC 2007b). In general temperature increases are predicted to be greater in the boreal
summer than in the boreal winter and greater inland than in coastal areas. In Asia Minor and the north of the
Arabian peninsula, boreal summer temperatures are predicted to increase by between 5 and 7ºC this century.
Temperatures in the south of the Arabian peninsula and in coastal areas are expected to decrease by less,
typically by 2-4ºC. In Asia Minor and throughout most of the Arabian Peninsula and eastward, boreal winter
temperatures are predicted to increase by between 2 and 3ºC this century. The southern Arabian peninsula
inland, and eastern Iran are predicted to increase in temperature by 3-4°C.
2.2 Rainfall change and drought
2.2.1 Global
Globally, there was no significant trend in precipitation during the 20th century, but over land it has generally
decreased. Between 1900 and 2005, precipitation has generally increased over land north of 30°N, but
downward trends dominate the tropics since the 1970s. From 10°N to 30°N, precipitation increased markedly
from 1900 to the 1950s, but declined after about 1970. Downward trends were recorded in the deep tropics
from 10°N to 10°S, especially since the late-1970s (IPCC 2007b). It has become significantly wetter in
northern Europe, but drier in the Sahel, the Mediterranean and southern Africa (IPCC 2007b). Overall,
precipitation appears to be becoming more variable. There has been a substantial increases in the number of
heavy precipitation events and there is some evidence of extreme (1 in 50 year return period) events
16increasing. However, droughts have also become more common, especially at lower latitudes, since the
1970s. Observed marked increases in drought in the past three decades arose from more intense and longer
droughts over wider areas, as a critical threshold for delineating drought is exceeded over increasingly
widespread areas. Decreased land precipitation and increased temperatures that enhance evapotranspiration
and drying are important factors that have contributed to more regions experiencing droughts, as measured
by the Palmer Drought Severity Index (Dai et al. 2004; IPCC 2007b; Palmer 1968).
Precipitation is generally predicted to increase in the tropics and polar regions, but decrease at mid-latitudes
(IPCC 2007b). In East and Central Africa, Greenland, Northern Fenno-Scandia and Siberia for example,
precipitation is expected to increase by 100-170 mm per year (2080-2099 relative to 1980-1999), whereas in
the Mediterranean Basin it is predicted to decrease by 100-150 mm per year. The intensity of precipitation
events is expected to increase, particularly at high-latitudes and in the tropics in areas where rainfall is
predicted to be higher. However, even in areas predicted to have less rainfall, intensity is predicted to
increase, but there would be longer periods between rainfall events. It is predicted that the centre of
continents will be drier, leading to a greater risk of droughts in those regions. Seasonal predictions of global
temperature precipitation changes are shown in Figure 3.
2.2.2. Africa
There are considerable temporal and regional differences in the extent to which rainfall has changed in
Africa. In the Sahel region and other areas just south of the Sahara and in Egypt there was a catastrophic
decrease in rainfall between 1901 and 2005, in some places close to 100%, but slight increases of about 15%
in the upper Nile and Congo basins in central-east Africa (IPCC 2007b). By contrast, between 1979 and
2005 there were moderate increases in rainfall in the Sahel region of about 15% and at only a few sporadic
locations, predominantly in southern Africa did rainfall decrease. Globally between 1901 and 2002 Africa
has experienced the greatest increase in the severity of droughts. Decreases in the Palmer Drought Severity
Index over this period, are at their maximum value of less than –4, for most of the Sahel region and other
areas immediately south of the Sahara and also in many parts of southern Africa. However, the Ethiopian
Highlands and a small region to the south of Lake Victoria have experienced less severe droughts, with in an
increase in Index values of about 3 (Dai et al. 2004; IPCC 2007b).
Annual rainfall is predicted to decrease by 2100 (relative to the latter part of the 20th century) in much of
Mediterranean Africa and the northern Sahara, with the likelihood of a decrease in rainfall increasing as the
Mediterranean coast is approached. Overall, rainfall is expected to decrease by 20-50%. Drying will be most
severe, but less widespread in the boreal summer, with the Mediterranean coast experiencing less than half
the present annual rainfall, but the south-eastern Sahara actually experiencing an increase in rainfall. In
southern Africa rainfall is likely to decrease most dramatically during June, July and August, with less than
50% of the present rainfall throughout most of inland southern Africa, but only very minor decreases in the
austral summer. The tropics, particularly in east-central Africa are predicted to experience much higher
rainfall (>30%) in the boreal winter, and moderate increases (5%) during the boreal summer. It is uncertain
how rainfall in the Sahel, the Guinean Coast and the southern Sahara will evolve this century (Dai et al.
2004).
2.2.3. Europe and the north-eastern Nearctic
There are moderate temporal and regional differences in the extent to which rainfall has changed in Europe
and the north-eastern Nearctic. Between 1901 and 2005 central Europe and Fenno-Scandia has experienced a
moderate (20-30%) increase in rainfall, central and southern Europe has experienced little change and the
Mediterranean basin has experienced moderate declines of c. 10%. Since 1979, the pattern has changed
somewhat. Only Fenno-Scandia and the area around the Faeroe Islands have experienced higher rainfall (c.
10%), whereas central and south-eastern Europe have experienced decreases (IPCC 2007b). The Palmer
Drought Severity Index reveals a substantial increase in the severity of droughts throughout central and
southern Europe, particularly in south-eastern Europe, but a substantial reduction in severity in northern
Fenno-Scandia and European Russia (Dai et al. 2004; IPCC 2007b).
17Annual rainfall is very likely to increase in most of northern Europe and decrease in most of the Mediterranean area. In northern Fenno-Scandia, mean increases of 15-20% are expected by 2100, whereas in southern Spain and Greece, 15-30% decreases are expected. In general, increases will be more pronounced in the boreal winter, whereas decreases will be more pronounced in the boreal summer. Thus in central Europe, precipitation is likely to increase by 5-10% in winter but decrease by 5-10% in summer. In north-eastern Fenno-Scandia, winter increases will exceed 30%, whereas throughout the Mediterranean, rainfall in summer will decrease by more than 30%. Extremes of daily precipitation are very likely to increase in northern Europe. The annual number of precipitation days is likely to decrease in the Mediterranean area, as is the severity of drought. 2.2.4. Middle East and Asia Minor There are some regional differences in the extent to which rainfall has changed in the Middle East and Asia Minor. Between 1901 and 2005, there was a c. 50% reduction in rainfall in the area around Israel and Jordan and minor reductions (
these effects is complicated by interactions with Atlantic and Indian Ocean associated climate shifts, but
overall it appears to have lead to warmer and wetter weather in Greenland and Iceland, anomalous easterlies
along the equator in Africa and increasingly unusual weather in East Africa (IPCC 2007b).

ENSO inter-annual variability is predicted to continue no matter what changes in average background
conditions occur. There is no consistent indication at this time of discernable changes in projected ENSO
amplitude or frequency in the 21st century. By contrast there is a projected positive trend in the NAO,
although the magnitude of this shift differs depending on the models used (IPCC 2007b).

2.5     Sea-level rise

Global sea level rose by about 120 m during the several millennia that followed the end of the last major ice
age approximately 21,000 years ago, and stabilised between 3,000 and 2,000 years ago. After this it did not
change significantly up until the late 19th century. During the 20th century it rose at an average rate of about
1.7 mm yr-1, but since 1990 this rate has increased and it has been rising at a rate of around 3 mm yr-1 (IPCC
2007b). Sea-level rise has not been uniform throughout the globe. In the Baltic for example, mean sea-level
has been rising by c. 4mm per-year between 1950 and 2003, whereas off the coast of East Africa and
southeast of Greenland, sea-levels actually decreased (IPCC 2007b). Historic patterns of changes in extreme
sea-level are masked by spatial variability and the few numbers of locations where such data are available.
However, analysis of hourly sea levels from 141 stations around the world suggest that there is an increase in
extreme (highest 1%) sea-levels since 1975, but this is broadly consistent with patterns of increase in mean
sea-level.

Although overall, sea-level did not change between 3,000 and 2,000 years ago and the late 19th century, some
land masses are still recovering from the effects of the ice ages and are undergoing isostatic rebound,
whereby some areas, notably in northern Europe, Siberia and Canada, that were depressed by huge weights
of ice are still rising. At some of these locations, notably in Great Britain, post-glacial rebound of Northern
Britain is causing a subsidence of the southern half of the island.

Sea-level is projected to rise during the 21st century by between 18 and 59 cm. The average rate of rise
during the 21st century is very likely to exceed the 1961 to 2003 average, with a central estimate of 4 mm per
year by 2100 (IPCC 2007b). Thermal expansion is the largest component, contributing 70 to 75% of the
central estimate in these projections, but glaciers, ice caps and the Greenland Ice sheet are also projected to
contribute to sea level. However, it is very important to note that these estimates of future changes do not
incorporate uncertainty in carbon cycle feedbacks nor do they include the full effects of changes in ice sheet
flow (IPCC 2007b). Gregory et al. (2004), suggest that temperatures by 2100 will be sufficient to melt the
Greenland ice sheet causing an increase in sea-level of 7 m spread over the next 1,000 years. Similarly,
Overpeck et al. (2006) suggest that the rate of melting of the Antarctic ice sheet is faster that previously
supposed. Thomas et al. (2004) suggest that glacier thinning rates near the coast of Antarctica during 2002–
2003 were much larger than those observed during the 1990s and flow into floating ice shelves over bedrock
up to hundreds of metres deeper than previous estimates. As such, the risk of sea-level rise should the
Antarctic ice sheet collapse is greater than previously thought. It is also noteworthy that in areas of increased
wind speed, such as at mid-latitudes, more extreme wave heights will result.

                                                       19
20
3.       CURRENT EFFECT OF CLIMATE CHANGE ON WATERBIRDS

Migrant waterbirds are particularly vulnerable to climate change because they rely on a network of (often
globally) dispersed sites and must travel between them. They are often strongly constrained by time, for
example, having to time arrival to match periods of resource abundance. Their main habitat: wetlands, is the
most threatened of all ecosystems (Reid et al. 2005) and is one of the habitats, along with Arctic tundra on
which many waterbirds breed, likely to be most adversely affected by climate change (IPCC 2007a). Given
the complexity of migratory systems, direct experimental evidence of impacts of climate change independent
of other factors is almost impossible to obtain. Consequently, most of what is known has been inferred from
other lines of evidence. Here we review published literature to determine the impacts for climate change on
species listed on Annex 2 of the AEWA Agreement. We start by considering the effects of climate change on
range and distribution. We then look at how the timing of life-cycle events has been affected (phenology).
We then consider impacts on demography, primarily survival and productivity. We also consider the special
implications that changing rainfall will have on waterbirds. Lastly, we consider how climate change can
interact with other factors to result in indirect effects.

We make use of all literature that was available to us through standard literature search engines such as Web
of Knowledge and Google Scholar. However, it should be borne in mind that it is very difficult to establish
whether lack of information regarding climate change impacts on a particular species is because no such
impact is present or simply because no research has been conducted on that particular species. The literature
is always likely to be biased towards demonstrating effects rather than lack of effects. Studies that cannot
demonstrate an effect are much less likely to be published, simply because it is difficult to establish whether
failure to detect an effect is due to lack of effect or due to inadequacy in the study such that although an
effect was there, it could not be detected. Moreover, due to the greater availability of financial resources for
research in rich developed countries, there is a considerable bias towards studies conducted in north-west
Europe. For this reason, although we focus on reporting instances where climate change has been shown to
affect a species specifically listed on Annex 2 of the Agreement, if particular climate change impacts are
well documented for a number of species, we report on these too, even if none are listed on Annex 2.

3.1      Changes in range and distribution

It is well known that temperature is one of the primary determinants of the location of biomes and habitats
(Huntley 1991). It is therefore logical that species ranges also depend on temperature (Parmesan 1996; Root
1988a; Root 1988b). Rainfall patterns can also affect species ranges (Newton 1998), and this has led to some
long-standing cultural associations with waterbirds. For example, White Storks Ciconia ciconia are known as
rain birds in dry areas of Africa (Robinson et al. 2005; Sitters et al. 2004) and in parts of East Africa, the call
of a Black Cuckoo Cuculus clamosus is seen as a harbinger of rain. Both breeding and wintering ranges of
waterbirds have been affected by climate change in the latter half of the 20th century (Austin & Rehfisch
2005; Thomas & Lennon 1999).

3.1.1.   Changes in breeding range

In the UK, Thomas & Lennon (1999) showed that between the periods of the two BTO Breeding Bird
Atlases (1968-1972) and (1989-1991), bird species (including some waterbird species) extended their
breeding ranges northwards by an average of 18.9 km, a trend that they attributed to warming temperatures.
Such temperature increases are probably the most likely explanation for the colonisation of the UK by
several new breeding bird species from the continent, including waterbird species such as Little Egret
Egretta garzetta (see Figure 4a) (Musgrove 2002; Robinson et al. 2005). Other species such as Eurasian
Spoonbill Platalea leucorodia and Cattle Egret Bubulcus ibis seem set to follow (Figure 4b). Range shifts
can also be altitudinal. In Poland, White Storks are shifting their breeding range to higher altitudes, with both
the maximum and upper-quartile altitudes of nests increasing significantly (Tryjanowski et al. 2005). There
are concerns that upward altitudinal shifts in montane bird communities might occur in the UK (Watt et al.
1998). Predictive models, such as MONARCH (Harrison et al. 2001), suggest that high altitude species in
Britain, will reduce in population size under current climate change scenarios. Indeed climate change may
already have been responsible for the extinction of breeding Eurasian Dotterel Eudromias morinellus in

                                                        21
You can also read