Contribution of climatic changes in mean and variability to monthly temperature and precipitation extremes
←
→
Page content transcription
If your browser does not render page correctly, please read the page content below
ARTICLE
                  https://doi.org/10.1038/s43247-020-00077-4                OPEN

                  Contribution of climatic changes in mean and
                  variability to monthly temperature and
                  precipitation extremes
                  Karin van der Wiel            1✉   & Richard Bintanja1,2
1234567890():,;

                  The frequency of climate extremes will change in response to shifts in both mean climate and
                  climate variability. These individual contributions, and thus the fundamental mechanisms
                  behind changes in climate extremes, remain largely unknown. Here we apply the probability
                  ratio concept in large-ensemble climate simulations to attribute changes in extreme events to
                  either changes in mean climate or climate variability. We show that increased occurrence of
                  monthly high-temperature events is governed by a warming mean climate. In contrast, future
                  changes in monthly heavy-precipitation events depend to a considerable degree on trends in
                  climate variability. Spatial variations are substantial however, highlighting the relevance of
                  regional processes. The contributions of mean and variability to the probability ratio are
                  largely independent of event threshold, magnitude of warming and climate model. Hence
                  projections of temperature extremes are more robust than those of precipitation extremes,
                  since the mean climate is better understood than climate variability.

                  1 Royal Netherlands Meteorological Institute, De Bilt, The Netherlands. 2 Energy and Sustainability Research Institute Groningen, Groningen University,

                  Groningen, The Netherlands. ✉email: wiel@knmi.nl

                  COMMUNICATIONS EARTH & ENVIRONMENT | (2021)2:1 | https://doi.org/10.1038/s43247-020-00077-4 | www.nature.com/commsenv                                     1
ARTICLE                                               COMMUNICATIONS EARTH & ENVIRONMENT | https://doi.org/10.1038/s43247-020-00077-4

V
         ariability in weather and climate inherently leads to the             drivers of changes in the mean climate are fairly well known, in
         occurrence of extreme weather or climate events. These                contrast to those that govern changes in climate variability13.
         events, more unusual and more severe than normal or                   Unfortunately, the separation of mean changes and changes in
average weather, include for example heatwaves (high-tempera-                  variability with respect to their contribution to changing climate
ture events), cold waves (low-temperature events), downpours                   extremes is currently unknown.
(heavy-precipitation events) and droughts (low-precipitation                       Here we quantify what part of a change in extreme event
events). Societies and natural ecosystems are increasingly at risk             probability is due to a shift in the mean climate, and what part
of such extreme weather events1–4. For instance, heatwaves                     due to a change in climate variability. We use the Probability
increase morbidity and mortality, reduce labour efficiency and                  Ratio (PR) concept24,25 in conjunction with large-ensemble cli-
crop yields, and intensify droughts and forest fires5,6, while                  mate modelling26 to provide robust estimates of the drivers of
downpours lead to floods that result in human casualties, damage                change in extreme events (see Methods). PR represents the
to infrastructure, crop failure, landslides, and insurance costs7–9.           changing probability of an extreme event caused by anthro-
Consequently there is a huge societal and scientific interest to                pogenic climate change. We extend the PR framework to split the
quantify and understand future trends in the frequency and                     conventional (or total) PR (which thus includes changes in both
intensity of extreme events and their attribution to anthropogenic             mean and variability), in a ‘PRmean’ representing changes in
climate change2–4. Recent climate studies have contributed to                  event probability due to a change in mean climate and a ‘PRvar’
quantifying such trends, but the climatic mechanisms behind                    for changes due to changes in climate variability (Fig. 1). We then
changes in climate extremes often remain elusive. This is mainly               apply several state-of-the-art large-ensemble global climate model
because extreme event occurrence responds to both changes in                   simulations to realistically quantify the individual contributions
mean climate and to changes in climate variability10–14. These                 of future changes in means and in variability to an altered
two fundamental aspects of the climate system exhibit consider-                extreme event occurrence. Evidently, PRtotal values and its par-
able changes in response to (human-induced) climate warm-                      titioning into the contributions from changes in the mean and
ing11,14, but often not in the same manner.                                    variability differ among climate variables and are also strongly
   Importantly, changes in mean and variability can generally be               dependent on the region of interest. As such, the novel split of PR
attributed to different climate mechanisms14–17, and, as a result,             into its mean and variability components will yield valuable
may have opposing effects on extreme event frequency.                          insight into the regionally-dependent climate mechanisms that
The combined effect on changes in regional extreme event                       govern changes in extreme climate events.
occurrence thus depends on the balance between, and effectivity
of, the associated driving mechanisms. For example, the Arctic                 Results
region will experience increasing mean temperatures due to                     Attribution of global projections of changes in extreme event
temperature and surface albedo feedbacks18–20, but sea ice retreat             occurrence. Future changes in the probability of extreme monthly
will ultimately lead to a reduction in temperature variability21,22.           high-temperature and heavy-precipitation events exceeding the 98th
The individual contributions to the occurrence of high-                        percentile in the present-day climate will be substantial (Fig. 2). Using
temperature events are thus of opposite sign, the total effect of              large-ensemble time slice simulations27 with the global climate model
climate change on high-temperature event frequency therefore                   EC-Earth28 (see Methods), we find that extreme high-temperature
depends on the balance between the two mechanisms. Another                     events in a 2 °C warmer climate will increase virtually everywhere
example concerns Arctic precipitation, for which mean changes                  (Fig. 2a)1,24. The largest PR-values are located over the tropical
are driven mainly by sea ice retreat and surface evaporation23,                oceans, with values exceeding 20 in many locations (indicating that
whereas changes in variability are governed by atmospheric                     the chance of exceeding a high-temperature threshold will be 20
poleward moisture transport17. Even though both are projected to               times more likely in the future than today). This can be attributed to
increase as a result of climate change, and thus contribute to more            the relatively narrow distribution of near-surface temperatures over
and more extreme heavy-precipitation events, the mechanisms                    ocean surfaces, meaning that a small shift of the mean will move a
behind enhanced Arctic downpours crucially depend on the                       substantial part of the distribution over the extreme event threshold.
relative importance of increases in mean precipitation and in                  In contrast, the average PRtotal over global land areas is more modest
precipitation variability. This attribution of changes in climate              (5.5). By far the largest contributor to the increase in extreme heat
extremes to specific climate mechanisms is important because the                probability is the mean warming (PRmean averaged over global land

Fig. 1 Schematic diagram of the breakdown of the Probability Ratio (PR) in the individual contributions of changes in the mean state and changes in
climate variability to the total change in extreme event probability (see Methods for details). a Two simulated distributions of some climate variable
(`NAT' and `CC'), the PRtotal value is computed from the number of events exceeding the threshold in both distributions (Eq. (1)). b The effect of change
in mean climate is removed by shifting the `CC' distribution such that it has the same mean value as the `NAT' distribution, PRvar can then be evaluated
based on threshold exceedance in `CC_v'. c PRmean follows from the PR-relationship (Eq. (2)), the individual contributions to PRtotal are found. d The ratio
of contribution is determined from the different PR-values (Eq. (3)), and sum up to a total of 1.

2            COMMUNICATIONS EARTH & ENVIRONMENT | (2021)2:1 | https://doi.org/10.1038/s43247-020-00077-4 | www.nature.com/commsenv
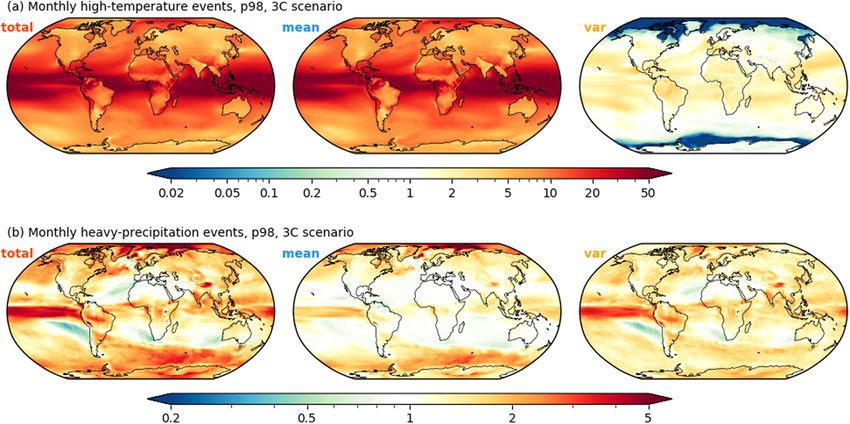
COMMUNICATIONS EARTH & ENVIRONMENT | https://doi.org/10.1038/s43247-020-00077-4                                                      ARTICLE

Fig. 2 Maps of the Probability Ratio (PR) for monthly extreme events exceeding the 98th percentile in a 2C-warming scenario (as specified in the
Paris agreement) relative to the present-day climate. For a high-temperature events and b heavy-precipitation events; shown are from left-to-right the
total PR, PR due to the change in mean climate and PR due to the change in climate variability.

Fig. 3 As Fig. 2, but here for a 3C-warming scenario. Maps of the Probability Ratio (PR) for monthly extreme events exceeding the 98th percentile in a
3C-warming scenario relative to the present-day climate. For a high-temperature events and b heavy-precipitation events; shown are from left-to-right
the total PR, PR due to the change in mean climate and PR due to the change in climate variability.

areas: 5.4), whereas changes in temperature variability only increases       changes in precipitation variability14,21 contribute considerably to
the event probability in a few tropical and midlatitude regions              the increases in event frequency (average over global land areas:
(PRvar averaged over global land areas: 1.1). This finding is in              PRmean = 1.1, PRvar = 1.2). This suggests that, generally, one needs
agreement scientific literature on processes governing changes in heat        to incorporate both components and their underlying causes to fully
waves29–32. Interestingly, subdued temperature variability in the polar      understand and quantify the projected changes in heavy-precipitation
regions related to sea ice retreat11,21,22,33 actually reduces the total     events. This is a direct consequence of precipitation variability
increase in extreme heat occurrence.                                         generally increasing more rapidly than mean precipitation for a
   Over 85% of the Earth’s surface will see an increase of extreme           variety of reasons, such as changing atmospheric moisture content,
heavy-precipitation events1,24, with an average PRtotal of 1.3 over          transport and dynamics, and changes in the intensity and spatial
continental regions (Fig. 2b). In contrast to high-temperature events,       extent of atmospheric convection14,15,17,34.

COMMUNICATIONS EARTH & ENVIRONMENT | (2021)2:1 | https://doi.org/10.1038/s43247-020-00077-4 | www.nature.com/commsenv                               3
ARTICLE                                               COMMUNICATIONS EARTH & ENVIRONMENT | https://doi.org/10.1038/s43247-020-00077-4

Fig. 4 The Probability Ratio (PR) for SREX regions (land only) and the global mean (land and ocean) for monthly extreme events exceeding the 98th
percentile in a 2C-warming scenario (as specified in the Paris agreement) relative to the present-day climate. For a high-temperature events, b heavy-
precipitation events. Red bars show the total PR, blue bars the PR due to the changes in mean climate and yellow bars the PR related to changes in climate
variability. Values of the vertical axis are shown in the global subplot.

   In a world with 3 °C global temperature rise the various values            PR-values for each of the SREX regions (region boundaries and
of PR are higher than in a 2 °C warmer world (Fig. 3), indicating             name abbreviations taken from IPCC SREX1,38). Regions close to
that changes in extreme events are larger for greater magnitudes of           the Arctic, most notably ALA, CGI, and NAS, are projected to
global warming35–37. In contrast, the spatial patterns of PRtotal,            experience a substantial increase in extreme heat probability,
PRmean and PRvar are qualitatively similar between the 2 °C and               despite a considerable sea-ice related decrease in temperature
3° warming experiments (spatial correlations between 0.92 and                 variability21,22 that limits PRtotal (Fig. 4a). In contrast, changes in
0.95), this indicates that the contributions of the associated climate        extreme heavy-precipitation events in these near-Arctic regions
mechanisms to the change in extreme events are largely                        are much less affected by increasing precipitation variability17
independent of the magnitude of the climate forcing or response.              (Fig. 4b), showing the importance of understanding the effectivity
                                                                              of these changes to extreme event occurrence. In relatively warm
Regional climate processes governing changing extreme events.                 regions, such as CAM, NEB and SAU, the increase in likelihood
The strong spatial variations in PR-values and mean and varia-                of high-temperature events is dominated by the changes in mean
bility contributions suggest that the climate mechanisms gov-                 temperatures (presumably because the overall greenhouse
erning changes in climate extremes differ considerably from one               warming dominates local processes39 that amplify heat waves),
region to the next. To quantify the individual contributions of               whereas the increase of heavy-precipitation events is governed by
mean and variability changes at the regional level, we evaluate               the effects of increasing precipitation variability. This could imply

4            COMMUNICATIONS EARTH & ENVIRONMENT | (2021)2:1 | https://doi.org/10.1038/s43247-020-00077-4 | www.nature.com/commsenv
COMMUNICATIONS EARTH & ENVIRONMENT | https://doi.org/10.1038/s43247-020-00077-4 ARTICLE Fig. 5 The ratio of contribution of PRmean (blue bars) and PRvar (yellow bars) to PRtotal in a 2C- and 3C-warming scenario (left and right bar respectively) for events exceeding the 98th percentile for SREX regions and the global mean. For a monthly high-temperature events, b monthly heavy-precipitation events. Values of the vertical axis are shown in the global subplot. that precipitation variability is primarily linked to mean warming precipitation and precipitation variability40. Generally, these via atmospheric convective processes15,34 through which pre- ratios are invariant for different levels of warming and also for cipitation extremes increase at a far greater rate than mean extreme event threshold (Figs. 5 and 6), providing further precipitation. evidence that the regionally-dependent climate mechanisms that The relative contributions of changes in the mean and changes govern trends in mean and variability, both causing changes in in variability can be quantified using the ratio of the respective extreme events, are mostly independent of the magnitude of contributions (Fig. 1d, Eq. (3)), and vary between regions and climate change, and of the extremeness of the event. climate variables, dependent on regional mechanisms that govern changes in the mean and in variability. For example, in the near- Intermodel comparison of contributing climate mechanisms. Arctic regions, the contribution of changes in the mean state to Climate models exhibit considerable intermodel differences, the increase of extreme high-temperature events is approximately especially in terms of (regional) variability and extremes (and 1.25, indicating that reductions in temperature variability oppose changes therein), since these are largely dependent on para- the overall increase in PRtotal by 0.25 (Fig. 5a). The two meterised small-scale processes (e.g., soil moisture processes, contributions are closer to being equal for increasing heavy- surface heat fluxes, clouds, atmospheric convection1,41). To infer precipitation events along the North American west coast (WNA) whether our findings are model-dependent we employ the large- (mean: 0.25, variability: 0.75, Fig. 5b), where projected changes in ensemble simulations collated by the US CLIVAR working group the dynamics of atmospheric rivers impact both mean on Large Ensembles26 (see Methods) to investigate the COMMUNICATIONS EARTH & ENVIRONMENT | (2021)2:1 | https://doi.org/10.1038/s43247-020-00077-4 | www.nature.com/commsenv 5
ARTICLE                                              COMMUNICATIONS EARTH & ENVIRONMENT | https://doi.org/10.1038/s43247-020-00077-4

Fig. 6 The ratio of contribution of PRmean (blue bars) and PRvar (yellow bars) to PRtotal for events of exceeding different thresholds (bars, from left
to right: 90th, 94th and 98th percentiles) in a 2C-warming scenario for SREX regions and the global mean. For a monthly high-temperature events,
b monthly heavy-precipitation events. Values of the vertical axis are shown in the global subplot.

mechanisms behind changes in extreme event likelihood over                   and also because the sign of total change, PRtotal above or below
time in a multi-model framework. Using transient scenario                    1, exhibits considerable intermodel differences. We will demon-
simulations covering the period 1950-2100 based on six global                strate model-dependencies by highlighting projections of tem-
climate models we find that climate models agree on the sign of               perature and precipitation extremes in two contrasting regions:
the change of the two contributors in the majority of the SREX               the Mediterranean (MED) and Alaska (ALA) (Fig. 9). Projections
regions. This model agreement is larger for high-temperature                 of change in high-temperature extremes are well-defined in both
events than for heavy-precipitation events and is higher for the             ALA and MED (Fig. 9a, c), all models agree on the direction of
contribution of changes in the mean than for changes in varia-               change and the contributions of mean and variability, despite
bility (Fig. 7). There is some intermodel uncertainty in the                 obvious regional differences. Note that the ratio of contribution is
magnitude of the changes, i.e. the exact PR-values.                          constant in time (not shown in a graph), indicating that the
   Despite such intermodel differences, the ratio of the contribu-           regional attribution of change to mean and/or variability does not
tions of mean and variability to the change in extreme events is             depend on the magnitude of climate warming.
remarkably similar between models in most regions (Fig. 8).                     End of century PRtotal estimates for heavy-precipitation events
Evidently, changes in high-temperature events are, in all regions            in the MED range from 0.2 to 1.1 between models (Fig. 9d). This
and in all models, governed by changes in the mean state (average            intermodel uncertainty for precipitation extremes, even in the
contribution to PRtotal of 0.94). In contrast, projections of                direction of the change, can be attributed to the uncertain balance
changes in heavy-precipitation events are less robust, mainly due            between two robust climate processes: a negative contribution of
to large spatial variability in extreme precipitation mechanisms,            mean drying climate42 (PRmean between 0 and 0.4) and a

6           COMMUNICATIONS EARTH & ENVIRONMENT | (2021)2:1 | https://doi.org/10.1038/s43247-020-00077-4 | www.nature.com/commsenv
COMMUNICATIONS EARTH & ENVIRONMENT | https://doi.org/10.1038/s43247-020-00077-4                                                        ARTICLE

Fig. 7 As Fig. 4, but here based on the US CLIVAR multi-model large ensemble. Shown are PR values for the end-of-century (EOC, 2070-2099)
relative to 1950-1979 under the RCP8.5 emission scenario. Coloured bars show the multi-model-mean (models included: CanESM2, CESM1, CSIRO-
Mk3.6, EC-Earth, GFDL-CM3, GFDL-ESM2M), vertical black lines indicate the inter-model range of the PR-values, lines are plotted thicker if there is
intermodel disagreement in the sign of change. For a high-temperature events, b heavy-precipitation events. Red bars show the total PR, blue bars the PR
due to the changes in mean climate and yellow bars the PR related to changes in climate variability. Values of the vertical axis are shown in the global
subplot. The two highlighted regions are investigated in more depth in Fig. 9.

positive contribution due to increasing precipitation variability43          Conclusions
(PRvar between 1.0 and 2.5). Both trends are linked to changes in            In this study we attribute changes in extreme event occurrence to
Mediterranean cyclones; models project a decrease in the number              either climatic changes in mean climate or climatic changes in
of Mediterranean cyclones (the dominant source of precipitation)             climate variability. By means of an extension of the PR framework,
owing to changes in circulation and storminess, but rainfall                 we are able to quantify the separate contributions. It is shown that
intensity in individual cyclones is projected to increase due to             future changes in monthly high-temperature extremes are mostly
higher atmospheric moisture content44. In this region 80 % of                driven by increasing mean temperatures (on average 94 % of the
inter-model variance in the mean trend is due to uncertainty in              total), whereas changes in monthly high-precipitation events
the circulation response45, highlighting the need for improved               depend also considerably on changes in precipitation variability.
understanding of physical processes and their (relative) impor-              Overall, climate models agree to a large degree on these drivers of
tance in contributing to regional climatic changes. In Alaska the            change. The trend in extreme events varies between climate vari-
two processes work in the same direction and as a result PRtotal             ables and regions, which is due to differences in climate mechan-
is better constrained (Fig. 9b).                                             isms causing changes in the mean and in variability.

COMMUNICATIONS EARTH & ENVIRONMENT | (2021)2:1 | https://doi.org/10.1038/s43247-020-00077-4 | www.nature.com/commsenv                                 7
ARTICLE                                             COMMUNICATIONS EARTH & ENVIRONMENT | https://doi.org/10.1038/s43247-020-00077-4

Fig. 8 The ratio of contribution of PRmean to PRtotal for extreme events based on the US CLIVAR multi-model large ensemble at the end-of-century
(EOC, 2070-2099) relative to 1950-1979 under the RCP8.5 emission scenario. For a monthly high-temperature events, b monthly heavy-precipitation
events. Models included: CanESM2, CESM1, CSIRO-Mk3.6, ECEarth, GFDL-CM3, GFDL-ESM2M (M1-M6 respectively). The two highlighted regions are
investigated in more depth in Fig. 9. Values of the vertical axis are shown in the global subplot.

   The breakdown into contributions of changing mean climate and            in many regions trends in climate variability remain unquantified
changing climate variability is robust to varying definitions of the         and poorly understood.
extremeness of the event (the event threshold), to the magnitude of
future climate change (the level of warming) and to the choice              Methods
of climate model. This insight is vital for assessing the robustness of     PR framework. Conventionally, the Probability Ratio (PR)24,25 is computed using
projected changes in extreme event frequency. Our understanding of          data from two climate model simulations, one for a natural climate (‘NAT’) and
                                                                            one for a climate under human influence (‘CC’, Fig. 1a). PR is then defined as the
the associated mechanisms associated with changes in the mean               ratio of event probabilities:
climate is generally much better than those for changes in climate
variability13. This suggests that considerable progress can be made by                                           PR ¼
                                                                                                                        PCC
                                                                                                                             ;                                  ð1Þ
improving understanding of (trends in) climate variability, which in                                                    PNAT
many regions depend on small scale climate processes (e.g. atmo-            with PR = 1 indicating no attributable change in extreme event probability, PR > 1
spheric convection, surface heat fluxes) that are normally para-             indicating an increase in event probability, and PR < 1 a decrease in event probability.
meterised in climate models1,41. The breakdown of trends in extreme             Here we extend the PR framework concerning changes in extreme event
events into the two basic contributors (mean, variability) provides         probability by separating this PR-value (‘PRtotal’) into a contribution from changes
                                                                            in the mean climate (‘PRmean’) and a contribution from changes in climate
valuable insights regarding the relative importance of climate pro-         variability (‘PRvar’). We define the mean climate as the annual mean value of the
cesses governing these trends. This will help direct future research, as    meteorological variable of interest, and climate variability as the variation of this

8           COMMUNICATIONS EARTH & ENVIRONMENT | (2021)2:1 | https://doi.org/10.1038/s43247-020-00077-4 | www.nature.com/commsenv
COMMUNICATIONS EARTH & ENVIRONMENT | https://doi.org/10.1038/s43247-020-00077-4 ARTICLE
Fig. 9 Time series of the Probability Ratio (PR) for two SREX regions highlighted with a red box in Figs. 7 and 8 (ALA, MED), for monthly extreme
events exceeding the 98th percentile under the RCP8.5 emission scenario relative to 1950-1979. For each of the six models we show the a, c high-
temperature events, b, d heavy-precipitation events, and a, b SREX region Alaska, c, d SREX region Mediterranean. Red lines show the total PR, blue lines
the PR due to the changes in mean climate and yellow lines the PR related to changes in climate variability, with the 90% confidence interval shown in
coloured shading. The EC-Earth model (used for Figs. 2 to 6) is highlighted with additional dots. Bars at the right of the plots show the end-of-century
(EOC, 2070-2099) multimodel mean PR-values, with black vertical lines indicating the inter-model range, plotted thicker if there is intermodel
disagreement in the sign of change.
variable around the climatic mean. Based on two climate datasets (e.g. ‘NAT’ and scenario for the period 2006-2100, for which the total radiative forcings in the year
‘CC’), we compute the change in climatic mean. We then subtract the change in the 2100 equals 8.5 W m−251. We use monthly mean values of near-surface tem-
mean from the CC dataset to create a new dataset ‘CC_v’ (Fig. 1b). The remaining perature (tas) and precipitation (pr) in all analyses.
difference between CC_v and NAT can then be attributed to trends in climate For the time slice model simulations with EC-Earth, the mean state is computed
variability, from which PRvar is calculated. Following these steps, PRmean can be using all 2000 model years assuming that there is no forced trend within a time
computed from the following relationship: slice. Extreme event thresholds were defined based on the PD ensemble, and PR-
values were consequently computed based on threshold exceedances in the 2C and
PRtotal ¼ PRmean þ PRvar 1: ð2Þ 3C time slice simulations. For the transient model experiments (US CLIVAR) we
In this equation, subtracting by 1 is necessary, since the reference PR-value is 1, employ a 4th order polynomial to estimate the trend in the mean state, following
indicating no change in probability. PR-values should be interpreted on a the approach in related studies13,52. These time series were analysed by taking
logarithmic scale, with PR = 2 and PR = 0.5 representing a similar magnitude of subsequent 30-year periods, with the period 1950–1979 being the reference period
change but in opposite directions (Fig. 1c). for defining extreme event thresholds. Confidence intervals were estimated by
To quantify the relative contribution of changes in the mean climate (PRmean) means of bootstrap resampling (N = 10, 000). For our regional analysis we use the
and changes in climate variability (PRvar) to the total change in extreme event 26 IPCC SREX regions1,38, we only consider land cells within these regions. The
probability (PRtotal), we evaluate the ratio of the contributions as follows: global mean analysis takes into account both land and ocean cells.
Rmean ¼ ðPRmean 1Þ=ðPRtotal 1Þ; ð3Þ
Data availability
and equivalently for Rvar (Fig. 1d). The two relative contributions (Rmean and The model output for the EC-Earth time slice experiments is available on reasonable
Rvar) sum up to a total of 1. request from the corresponding author. The model output for the US CLIVAR large
ensemble experiments were obtained from: http://www.cesm.ucar.edu/projects/
Data and analysis. To evaluate total PR and its components we use data from community-projects/MMLEA/.
various large ensemble climate model simulations. We use a set of three time slice
simulations using the state-of-the-art global climate model EC-Earth28, for which
each time slice consists of 2000 years representative of a certain average absolute
Code availability
Code for data analysis is available on request from the corresponding author.
global mean surface temperature value (‘PD’ for present-day, ‘2C’ for a 2 ∘C
warming and ‘3C’ for a 3 ∘C warming, the latter two relative to pre-industrial
climate)27. Furthermore, we use six transient large ensemble model simulations Received: 9 September 2020; Accepted: 24 November 2020;
collected by the US CLIVAR Working Group on Large Ensembles26 (available at:
http://www.cesm.ucar.edu/projects/community-projects/MMLEA/). These simula-
tions cover the period 1950-2100 and are carried out using six different climate
models28,46–50, the number of ensemble members ranges from 16 to 50: CanESM2
(50 members), CESM1-CAM5 (35; we limit the analysis to members 1-35 out of 40
available members, because members 36–40 are slightly warmer than the rest
which could affect extreme event frequency, see also http://www.cesm.ucar.edu/ References
projects/community-projects/LENS/known-issues.html.), CSIRO-Mk3-6-0 (30), 1. Field, C. B., Barros, V., Stocker, T. F. & Dahe, Q. Managing the risks of
EC-Earth (16), GFDL-CM3 (20), GFDL-ESM2M (30). All six models were also part extreme events and disasters to advance climate change adaptation: special
of the Coupled Model Intercomparison Project, phase 5 (CMIP5). The simulations report of the intergovernmental panel on climate change (Cambridge University
used the historical forcing for the period 1950–2005, and the strong forcing Press, 2012).
COMMUNICATIONS EARTH & ENVIRONMENT | (2021)2:1 | https://doi.org/10.1038/s43247-020-00077-4 | www.nature.com/commsenv 9ARTICLE COMMUNICATIONS EARTH & ENVIRONMENT | https://doi.org/10.1038/s43247-020-00077-4
2. Herring, S. C. et al. Explaining extreme events of 2016 from a climate 32. Di Luca, A., de Elía, R., Bador, M. & Argüeso, D. Contribution of mean
perspective. Bull. Am. Meteorol. Soc. 99, S1–S157 (2018). climate to hot temperature extremes for present and future climates. Weather
3. Herring, S. C., Christidis, N., Hoell, A., Hoerling, M. P. & Stott, P. A. Climate Extremes 28, 100255 (2020).
Explaining extreme events of 2017 from a climate perspective. Bull. Am. 33. LaJoie, E. & DelSole, T. Changes in internal variability due to anthropogenic
Meteorol. Soc. 99, S1–S117 (2019). forcing: a new field significance test. J. Climate 29, 5547–5560 (2016).
4. Herring, S. C., Christidis, N., Hoell, A., Hoerling, M. P. & Stott, P. A. 34. Lochbihler, K., Lenderink, G. & Siebesma, A. P. Response of extreme
Explaining extreme events of 2018 from a climate perspective. Bull. Am. precipitating cell structures to atmospheric warming. J. Geophys. Res. Atmos.
Meteorol. Soc. 101, S1–S140 (2020). 124, 6904–6918 (2019).
5. Mora, C. et al. Global risk of deadly heat. Nat. Climate Change 7, 501–506 35. Arnell, N. W., Lowe, J. A., Lloyd-Hughes, B. & Osborn, T. J. The impacts
(2017). avoided with a 1.5 c climate target: a global and regional assessment. Climatic
6. De Bono, A., Peduzzi, P., Kluser, S. & Giuliani, G. Impacts of summer 2003 Change 147, 61–76 (2018).
heat wave in europe. Tech. Rep., United Nations Environment Programme. 36. King, A. D., Karoly, D. J. & Henley, B. J. Australian climate extremes at 1.5 c
https://archive-ouverte.unige.ch/unige:32255 (2004). and 2 c of global warming. Nat. Climate Change 7, 412–416 (2017).
7. Jonkman, S. N., Godfroy, M., Sebastian, A. & Kolen, B. Brief communication: 37. King, A. D. & Karoly, D. J. Climate extremes in Europe at 1.5 and 2 degrees of
loss of life due to hurricane harvey. Nat. Hazards Earth Syst. Sci. 18, global warming. Environ. Res. Lett. 12, 114031 (2017).
1073–1078 (2018). 38. Seneviratne, S. et al. Notes and technical details on chapter 3 figures. In
8. Sebastian, A., Gori, A., Blessing, R. B., van der Wiel, K. & Bass, B. Managing the risks of extreme events and disasters to advance climate change
Disentangling the impacts of human and environmental change on catchment adaptation: Special report of the Intergovernmental Panel on Climate Change,
response during hurricane harvey. Environ. Res. Lett. 14, 124023 (2019). chap. 3 (eds Field, C. B., Barros, V., Stocker, T. F. & Dahe, Q.) (Cambridge
9. Frame, D. J., Wehner, M. F., Noy, I. & Rosier, S. M. The economic costs of University Press, 2012).
hurricane harvey attributable to climate change. Climatic Change 160, 39. Donat, M. G., Pitman, A. J. & Seneviratne, S. I. Regional warming of hot
271–281 (2020). extremes accelerated by surface energy fluxes. Geophys. Res. Lett. 44,
10. Schaeffer, M., Selten, F. & Opsteegh, J. Shifts of means are not a proxy for 7011–7019 (2017).
changes in extreme winter temperatures in climate projections. Climate Dyn. 40. Warner, M. D., Mass, C. F. & Salathé Jr, E. P. Changes in winter atmospheric
25, 51–63 (2005). rivers along the North American west coast in CMIP5 climate models. J.
11. Stouffer, R. & Wetherald, R. Changes of variability in response to Hydrometeorol. 16, 118–128 (2015).
increasing greenhouse gases. part i: Temperature. J. Climate 20, 5455–5467 41. Randall, D. A. et al. Climate models and their evaluation. In Climate change
(2007). 2007: The physical science basis. Contribution of Working Group I to the
12. Donat, M. G. & Alexander, L. V. The shifting probability distribution of Fourth Assessment Report of the IPCC (FAR), 589–662 (Cambridge University
global daytime and night-time temperatures. Geophys. Res. Lett. 39, L14707 Press, 2007).
(2012). 42. Giorgi, F. & Lionello, P. Climate change projections for the Mediterranean
13. Lewis, S. C. & King, A. D. Evolution of mean, variance and extremes in 21st region. Glob. Planet. Change 63, 90–104 (2008).
century temperatures. Weather Climate Extremes 15, 1–10 (2017). 43. Philandras, C. et al. Long term precipitation trends and variability within the
14. Pendergrass, A. G., Knutti, R., Lehner, F., Deser, C. & Sanderson, B. M. Mediterranean region. Nat. Hazards Earth System Sci. 11, 3235 (2011).
Precipitation variability increases in a warmer climate. Sci. Rep. 7, 1–9 (2017). 44. Zappa, G., Hawcroft, M. K., Shaffrey, L., Black, E. & Brayshaw, D. J.
15. Lenderink, G. & Van Meijgaard, E. Increase in hourly precipitation extremes Extratropical cyclones and the projected decline of winter Mediterranean
beyond expectations from temperature changes. Nat. Geosci. 1, 511–514 precipitation in the CMIP5 models. Clim. Dyn. 45, 1727–1738 (2015).
(2008). 45. Zappa, G., Hoskins, B. J. & Shepherd, T. G. The dependence of wintertime
16. Brown, P. T., Ming, Y., Li, W. & Hill, S. A. Change in the magnitude and mediterranean precipitation on the atmospheric circulation response to
mechanisms of global temperature variability with warming. Nat. Climate climate change. Environ. Res. Lett. 10, 104012 (2015).
Change 7, 743–748 (2017). 46. Jeffrey, S. et al. Australia’s CMIP5 submission using the CSIRO-Mk3. 6 model.
17. Bintanja, R. et al. Strong future increases in Arctic precipitation variability Aust. Meteor. Oceanogr. J 63, 1–13 (2013).
linked to poleward moisture transport. Sci. Adv. 6, eaax6869 (2020). 47. Kay, J. E. et al. The community earth system model (cesm) large ensemble
18. Box, J. E. et al. Key indicators of Arctic climate change: 1971–2017. Environ. project: a community resource for studying climate change in the presence of
Res. Lett. 14, 045010 (2019). internal climate variability. Bull. Am. Meteorol. Soc. 96, 1333–1349
19. Pithan, F. & Mauritsen, T. Arctic amplification dominated by temperature (2015).
feedbacks in contemporary climate models. Nat. Geosci. 7, 181–184 (2014). 48. Rodgers, K. B., Lin, J. & Frölicher, T. L. Emergence of multiple ocean
20. Screen, J. A. & Simmonds, I. The central role of diminishing sea ice in recent ecosystem drivers in a large ensemble suite with an earth system model.
arctic temperature amplification. Nature 464, 1334–1337 (2010). Biogeosciences 12, 3301–3320 (2015).
21. Boer, G. Changes in interannual variability and decadal potential 49. Kirchmeier-Young, M. C., Zwiers, F. W. & Gillett, N. P. Attribution of
predictability under global warming. J. Climate 22, 3098–3109 (2009). extreme events in Arctic sea ice extent. J. Climate 30, 553–571 (2017).
22. Reusen, J., van der Linden, E. & Bintanja, R. Differences between arctic 50. Sun, L., Alexander, M. & Deser, C. Evolution of the global coupled climate
interannual and decadal variability across climate states. J. Climate 32, response to Arctic sea ice loss during 1990–2090 and its contribution to
6035–6050 (2019). climate change. J. Climate 31, 7823–7843 (2018).
23. Bintanja, R. & Selten, F. Future increases in Arctic precipitation linked to local 51. Van Vuuren, D. P. et al. The representative concentration pathways: an
evaporation and sea-ice retreat. Nature 509, 479–482 (2014). overview. Climatic Change 109, 5 (2011).
24. Fischer, E. M. & Knutti, R. Anthropogenic contribution to global occurrence 52. Vinnikov, K. Y. & Robock, A. Trends in moments of climatic indices. Geophys.
of heavy-precipitation and high-temperature extremes. Nat. Climate Change Res. Lett. 29, 14–1 (2002).
5, 560–564 (2015).
25. Stott, P. A., Stone, D. A. & Allen, M. R. Human contribution to the european
heatwave of 2003. Nature 432, 610–614 (2004). Acknowledgements
26. Deser, C. et al. Insights from Earth system model initial-condition large The authors thank the individual modelling groups for their efforts in producing the
ensembles and future prospects. Nat. Climate Change 10, 277–286 (2020). transient large ensembles experiments, and the US CLIVAR Working Group on Large
27. Van der Wiel, K., Wanders, N., Selten, F. & Bierkens, M. Added value of large Ensembles for collecting and making available the ensemble data. We are grateful to the
ensemble simulations for assessing extreme river discharge in a 2 ∘C warmer EC-Earth consortium for their contribution to the development of the Earth System
world. Geophys. Res. Lett. 46, 2093–2102 (2019). Model EC-Earth. Acknowledgment is made for the use of ECMWF’s computing and
28. Hazeleger, W. et al. EC-Earth v2.2: description and validation of a new archive facilities in this research. We thank Peter Pfleiderer for sharing the code to
seamless earth system prediction model. Climate Dyn. 39, 2611–2629 (2012). produce Fig. 4 and all similar figures. This work is part of the HiWAVES3 project, for
29. Lau, N.-C. & Nath, M. J. A model study of heat waves over north america: which funding was supplied by the Netherlands Organisation of Scientific Research
Meteorological aspects and projections for the twenty-first century. J. Climate (NWO) under Grant Number ALWCL.2 016.2. HiWAVES3 was funded under a joint JPI
25, 4761–4784 (2012). Climate-Belmont Forum call (2015).
30. Lau, N.-C. & Nath, M. J. Model simulation and projection of european heat
waves in present-day and future climates. J. Climate 27, 3713–3730
(2014). Author contributions
31. Argüeso, D., Di Luca, A., Perkins-Kirkpatrick, S. E. & Evans, J. P. Seasonal K.W. and R.B. contributed to the design of the study, the interpretation of the results and
mean temperature changes control future heat waves. Geophys. Res. Lett. 43, commented on the manuscript. K.W. performed the EC-Earth time slice model simu-
7653–7660 (2016). lations, analysed the data, and wrote the manuscript.
10 COMMUNICATIONS EARTH & ENVIRONMENT | (2021)2:1 | https://doi.org/10.1038/s43247-020-00077-4 | www.nature.com/commsenvCOMMUNICATIONS EARTH & ENVIRONMENT | https://doi.org/10.1038/s43247-020-00077-4 ARTICLE
Competing interests Open Access This article is licensed under a Creative Commons
The authors declare no competing interests. Attribution 4.0 International License, which permits use, sharing,
adaptation, distribution and reproduction in any medium or format, as long as you give
appropriate credit to the original author(s) and the source, provide a link to the Creative
Additional information Commons license, and indicate if changes were made. The images or other third party
Supplementary information is available for this paper at https://doi.org/10.1038/s43247-
material in this article are included in the article’s Creative Commons license, unless
020-00077-4.
indicated otherwise in a credit line to the material. If material is not included in the
Correspondence and requests for materials should be addressed to K.v.d.W. article’s Creative Commons license and your intended use is not permitted by statutory
regulation or exceeds the permitted use, you will need to obtain permission directly from
Peer review information Primary handling editor: Heike Langenberg. the copyright holder. To view a copy of this license, visit http://creativecommons.org/
licenses/by/4.0/.
Reprints and permission information is available at http://www.nature.com/reprints
© The Author(s) 2021
Publisher’s note Springer Nature remains neutral with regard to jurisdictional claims in
published maps and institutional affiliations.
COMMUNICATIONS EARTH & ENVIRONMENT | (2021)2:1 | https://doi.org/10.1038/s43247-020-00077-4 | www.nature.com/commsenv 11You can also read