Cloud icing by mineral dust and impacts to aviation safety
←
→
Page content transcription
If your browser does not render page correctly, please read the page content below
www.nature.com/scientificreports
OPEN Cloud icing by mineral dust
and impacts to aviation safety
Slobodan Nickovic1*, Bojan Cvetkovic1, Slavko Petković1, Vassilis Amiridis2,
Goran Pejanović1, Stavros Solomos2,3, Eleni Marinou2,4 & Jugoslav Nikolic1
Ice particles in high-altitude cold clouds can obstruct aircraft functioning. Over the last 20 years, there
have been more than 150 recorded cases with engine power-loss and damage caused by tiny cloud ice
crystals, which are difficult to detect with aircraft radars. Herein, we examine two aircraft accidents
for which icing linked to convective weather conditions has been officially reported as the most likely
reason for catastrophic consequences. We analyze whether desert mineral dust, known to be very
efficient ice nuclei and present along both aircraft routes, could further augment the icing process.
Using numerical simulations performed by a coupled atmosphere-dust model with an included
parameterization for ice nucleation triggered by dust aerosols, we show that the predicted ice
particle number sharply increases at approximate locations and times of accidents where desert dust
was brought by convective circulation to the upper troposphere. We propose a new icing parameter
which, unlike existing icing indices, for the first time includes in its calculation the predicted dust
concentration. This study opens up the opportunity to use integrated atmospheric-dust forecasts as
warnings for ice formation enhanced by mineral dust presence.
There have been more than 150 accidents reported by commercial a irplanes1,2 related to cloud ice impacts, such
as engine power loss, blade damage, and the icing of instrument sensors. Most of these incidences have been
linked to icing in the upper troposphere in the vicinity of deep summer convection systems. They have often
been recorded in tropical and subtropical regions where ice crystals are formed in the absence of supercooled
liquid water2,3. Cockpit radars generally cannot detect such small ice c rystals4. High numbers of potentially
engine-damaging ice particles typically exist in the outflow of the broad anvils associated with the convective
storm complexes5. These ice particles can obstruct the normal functioning of important aircraft instruments (e.g.,
the Pitot tube and air pressure sensors), confuse the aircraft crew and therefore seriously degrade the security
of aircraft operations.
Two catastrophic aircraft accidents caused by icing
In this study, we examine the role of mineral dust on ice formation along the routes of two flights with cata-
strophic outcomes: the June 2009 Air France flight (AF477) and the July 2014Air Algérie flight (AH5017). To
reconstruct the atmospheric and desert dust conditions related to two accidents, we use simulations of the
DREAM dust-atmosphere transport m odel6,7 combined with available satellite observations.
Since many aircrafts pass through regions with ice crystals with no fatal consequences, the question that puz-
zles us herein is what made these two accident flights different from the others. Our analysis shows that for both
accident episodes, airborne mineral dust was abundant. As an efficient and dominant ice nucleus in the upper
troposphere, dust could enhance the icing p rocess8. Another common feature for the flights was that the aircrafts
crashed in the vicinity of deep convection systems where ice crystals could not be recorded by aircraft radars,
thus leaving pilots unaware of possibly dangerous flight conditions. Finally, the official investigations reported
that icing was the cause of both accidents. Namely, the final report for AF4779 indicated that ’… following the
obstruction of the Pitot probes by ice crystals, the speed indications were incorrect and some automatic systems
disconnected…’. In the case of AH5017, the final r eport10 stated that ’…the airplane speed decreased due to the
obstruction of the pressure sensors, probably caused by ice crystals…’.
The AF447 accident happened in the early morning of 1 June 2009 when the airplane crashed into the tropi-
cal Atlantic on its way from Rio de Janeiro to Paris9. According to the BEA Final Report9, the aircraft crashed at
approximately 2:00 UTC, at the approximate location of 31° W; 2.7° N and at a height of 11 km. While passing the
periphery of a convection zone shortly before the crash, the cockpit speed information abruptly became invalid
and confused the crew because all three sensors for the aircraft’s speed (Pitot tubes) were iced. The erroneous
1
Republic Hydrometeorological Service of Serbia, 11000 Belgrade, Serbia. 2National Observatory of Athens,
Athens, Greece. 3Academy of Athens, Athens, Greece. 4Deutsches Zentrum für Luft‑ und Raumfahrt (DLR), Institut
für Physik der Atmosphäre, Weßling, Germany. *email: nickovic@gmail.com
Scientific Reports | (2021) 11:6411 | https://doi.org/10.1038/s41598-021-85566-y 1
Vol.:(0123456789)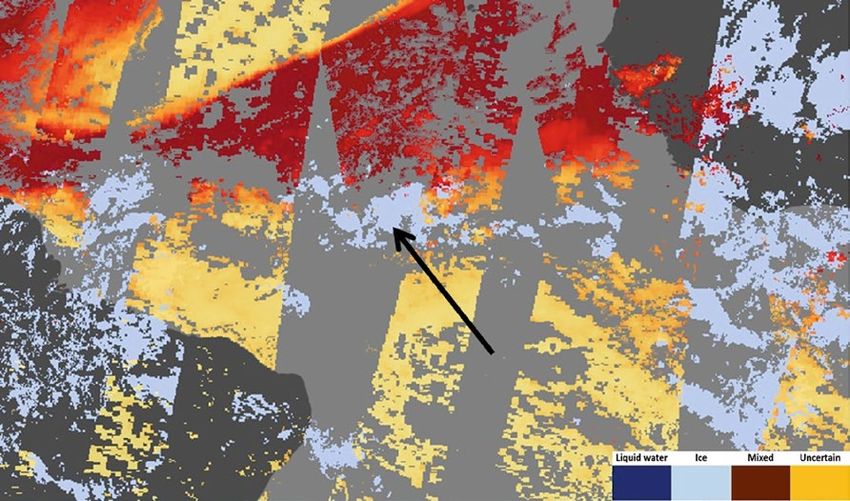
www.nature.com/scientificreports/
information that confused the pilots triggered a series of bad decisions that finally led to the catastrophic accident
with 228 human casualties.
While crossing the Intertropical Convergence Zone (ITCZ), the aircraft entered a region of strong convec-
tion. Figure 1A shows a typical ITCZ pattern on 31 May 2009, as predicted by the atmospheric component of the
DREAM model. The pattern is associated with a well-organized convergence of near-surface winds, accompanied
with a system of convective clouds. At the same time, cloud-top temperatures observed by EUMETSAT’s MSG
SEVIRI instrument indicated the existence of strong convective instability in the zone of the accident (Fig. 1B).
In addition, the ice cloud phase observed by NASA/SUOMI NPP satellite coincided with a Saharan dust pattern
recorded by NASA/MODIS in the accident region (Fig. 1C). Dust presence in the region was the result of a major
desert dust storm developed over Western Africa in the period of 30–31 May and then transported toward the
Central Atlantic.
To examine the influence of the airborne dust on the icing process at the time and location of the accident, we
performed numerical simulations of mineral dust transport. The model experiment covers the period 24 May–1
June 2009. The initial state of the dust concentration in the model is defined by the 24-h forecast taken from the
previous day’s model run except for the ‘‘cold start’’ of the model on 00:00 UTC 24 May 2009, when the initial
dust concentration was set to zero. The simulated large-scale pattern dust load (columnar concentration) over
the Atlantic (Fig. 1D) is in accordance with the MODIS observation shown in Fig. 1C. The vertical cross section
along the AF447 path shows that dust from the lower atmosphere was lifted to the upper troposphere by strong
convection and then further laterally spread toward a periphery of convection (Fig. 1E). The model simulates dust
concentrations at the order of ~ 0.001 µgm−3 at the level of the flight (~ 11 km). The NASA/CALIPSO (Cloud-
Aerosol Lidar and Infrared Pathfinder Satellite Observations) satellite, which crossed the zone of the accident 1 h
after the crash, shows the presence of clouds in the layer 10–14 km. NASA/CALIPSO also shows the presence
of both ice clouds and desert dust in the wider zone of the accident (Fig. 1F).
The AH5017 accident of 24 July 2014 also occurred in the presence of icing conditions. AH5017 was flying
from Ouagadougou (Burkina Faso) to Algiers (Algeria). According to the BEA Final R eport10, the aircraft crashed
at approximately 24 July 1:50 UTC, at the approximate location of 1° W; 15° N and at 9.5 km height. The aircraft
was crossing the West African Monsoon (WAM) zone, which is a typical system affecting the region during sum-
mer. The WAM is characterized by an intertropical front between dry air over the Sahara and moist air from the
Atlantic11. In the wider region of Africa where the AH5017 accident happened, the model simulation shows a
convective precipitation pattern and associated low-level winds (Fig. 2A). Convection was generated by converg-
ing air flow in the lower atmosphere. Between 23 and 24 July, the frontal system created thick convective clouds
between Burkina Faso and Mali, as depicted by the MSG SEVIRI imagery (Fig. 2B). The air-control authorities
advised pilots to change their originally planned flight routes in order to avoid flying through the region with
strong convection. The alternative aircraft path crossed the periphery of the convective system. A pattern of ice
clouds was observed by NASA/SUOMI on 24 July 2014 in the flight zone, partly overlapping with dust observed
by NASA/MODIS (Fig. 2C). Saharan dust was covering a large part of the Sahel and Sahara, as predicted by the
model (Fig. 2D). According to the predicted vertical cross section, a part of the dust concentration was lifted
and laterally spread by convection from the lower dust layer (Fig. 2E). Twelve hours before the accident, NASA/
CALIPSO observed the convective instability was in tandem with the desert dust (Fig. 2F).
According to the official r eport10, ice crystals rather than supercooled water were likely present along the
route crossing the periphery of the convective system. The engine pressure ratio, which is the major parameter
regulating the engines functioning became erroneous on both aircraft engines because the instrument sensors
were obstructed by ice crystals. The pilots did not turn on a de-icing system since they were not warned by the
cockpit instruments about the presence of ice. As a result, the aircraft lost its speed, descended and tragically
crashed. BEA reported, although with no further elaboration the possible influence of mineral dust, specifically
that ’… the high dust content was combined with convection over the northern area of the Sahel…’ and spe-
cifically that ’… the concentration of dust may affect the quantity and concentration of condensation nuclei in
cumulonimbus.’10. Furthermore, BEA stated that ’… the analysis of the satellite imagery evolution did not indicate
supercooled water was present… The cell was in the "mature stage” when the airplane passed. The anvil cloud
was then well developed and the updrafts in the cell core fed this anvil with ice crystals. Thus, the presence of ice
crystals within the anvil cloud was very likely’.
Predicting ice formation caused by mineral dust
The above analysis suggests that there are certain similarities in both accidents. First, a near-surface dust load
was lifted by convection and laterally spread along anvils through which both aircraft were passing. Another
common feature was that the flights were passing through zones where ice crystal icing was likely dominating
over super-cooled water freezing2.
Following the needs of aviation for timely and reliable information on expected icing on aircraft cruising
routes, several icing indices/parameter shave been developed and routinely implemented in order to identify
conditions for icing occurrence1,12–14. These methods use either predicted or observed temperature, cloud liquid
water, relative humidity and vertical velocity to estimate the icing intensity. Most of them are applied to the mid-
troposphere and none considers dust as a contributing factor.
Taking into account the importance of mineral dust in the ice formation process, we here introduce a new
icing index, which for the first time considers both thermodynamic and dust parameters. To formulate the new
index, we first calculate the number of dust particles participating in ice nucleation nINP[#/l], as predicted by
the ice nucleation parameterization in the model7. The parameterization is based on the immersion nuclea-
tion scheme for temperatures between − 15 and − 35 °C and on the deposition nucleation parameterization for
Scientific Reports | (2021) 11:6411 | https://doi.org/10.1038/s41598-021-85566-y 2
Vol:.(1234567890)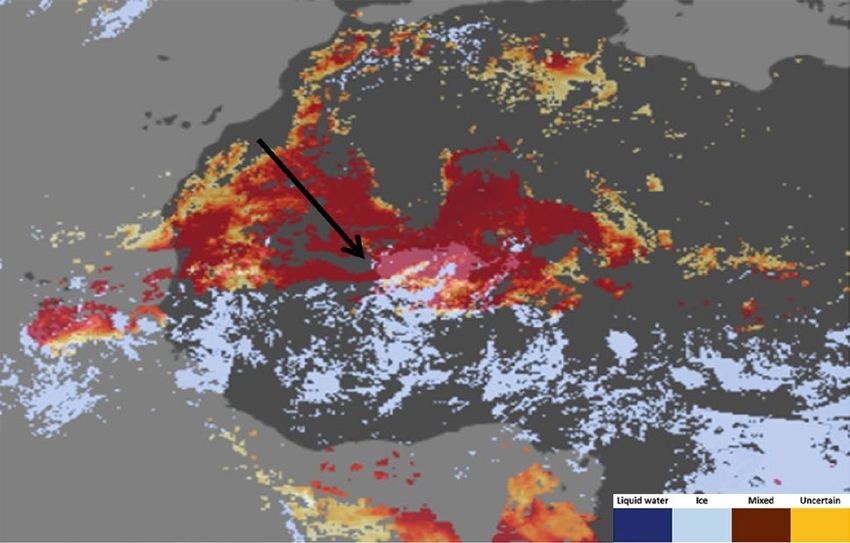
www.nature.com/scientificreports/

                                                                                                          b
                                          a

                                          c                                                               d

                                          e

                                                                                                          f

                                  Figure 1.  Atmospheric and dust conditions relevant for the AF477 accident. In the above images, arrows and
                                  thick lines indicate location of the accident. (A) Model convective cloud cover (shaded) and the near-surface
                                  wind (colored arrows) at 01 UTC 1 June 2009 indicating the location of the ITCZ characterized with strong
                                  wind convergence in the lower atmosphere and by the associated convection. (B) Cloud top temperatures
                                  observed by EUMETSAT MSG SEVIRI at 01 UTC 1 June 2009 showing the cluster of cumulonimbus clouds
                                  at the accident location. (C) Dust optical depth (NASA/SUOMI satellite) and ice cloud phase (NASA/MODIS
                                  satellite) observed on 31 May 2009 demonstrating the existence of a large-scale dust transport in Central
                                  Atlantic combined with the presence of cold clouds in the accident zone. (D) Vertically integrated dust
                                  concentration [µgm−2] at 01 UTC 1 June 2009 as predicted by the model. (E) Dust concentration [µgm−3] and
                                  wind streamlines at 01 UTC 1 June 2009 in the vertical section crossing the atmosphere along the AF477 flight.
                                  Dust was lifted by strong upward convection motion from the lower levels to the upper troposphere. The vertical
                                  red tick line indicates the accident location (F) CALIPSO/CALIOP profile at 02:14 UTC, 1 June 2009 shows cold
                                  clouds in the upper troposphere and dust in its lower part.

Scientific Reports |   (2021) 11:6411 |               https://doi.org/10.1038/s41598-021-85566-y                                               3

                                                                                                                                          Vol.:(0123456789)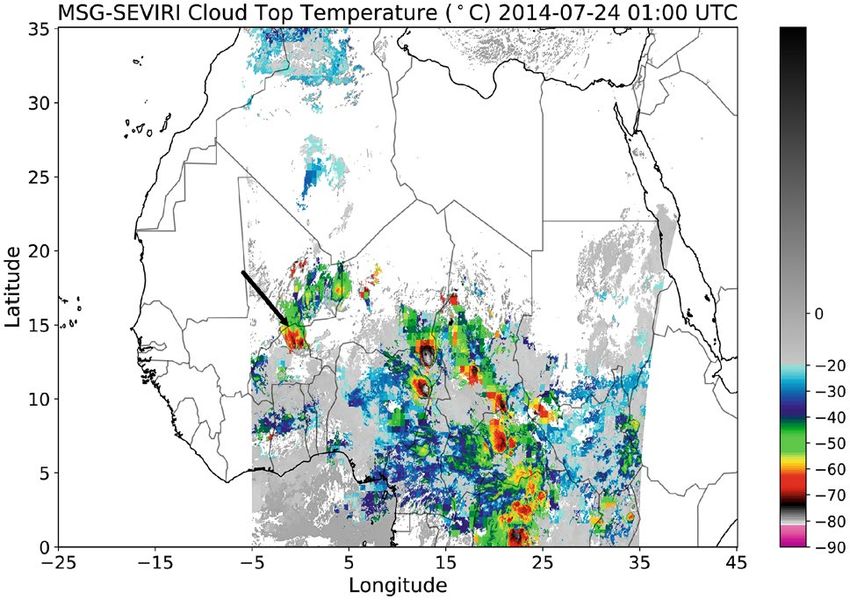
www.nature.com/scientificreports/
a b
c d
e
f
Figure 2. Atmospheric and dust conditions relevant for the AH5017 accident in the Sahel/Sahara region. Arrows
and thick lines indicate location of the accident. (A) Model convective cloud cover (shaded) and the near-surface
wind (colored arrows) at 01 UTC 24 July 2014 indicating the location of WAM characterized with wind convergence
in the lower atmosphere. Moisture transported by SE wind generated unstable convection conditions in the region.
(B) Cloud top temperatures observed by EUMETSAT MSG SEVIRI at 02 UTC 24 July 2014 identifying the presence
of cumulonimbus clouds. (C) Ice cloud phase in NASA/MODIS satellite observation on 23 July 2014 showing a cold
cloud system in the zone of the accident. (D) Vertically integrated dust concentration gm−2 at 01UTC 24 July 2014
predicted by the model. (E) Dust concentration [µgm−3] and wind streamlines at 01 UTC 24 July 2014 in the vertical
section crossing the atmosphere along the AH5017 flight. Dust was lifted by strong upward convection motion from
the lower levels to the upper troposphere. (F) CALIPSO/CALIOP profile at 12:15 UTC 23 July 2014, 14 h before the
accident (this was the closest time to the accident time in CALIPSO passes over the region) showing that there was
already a layer of dust in the lower atmosphere and convective cold clouds at 9–10 km in the wider zone of the AH5017
accident. The red oval tick line shows that the wider region of the accident was characterized by presence of dust,
convection and elevated cold clouds.
Scientific Reports | (2021) 11:6411 | https://doi.org/10.1038/s41598-021-85566-y 4
Vol:.(1234567890)www.nature.com/scientificreports/
temperatures lower than − 35 °C15. The derived number of activated dust particles (nINP) is a function of predicted
temperature, moisture and dust concentration.
For the considered accidents, we calculate the predicted vertically integrated log10(nINP) which indicates the
existence of icing conditions in the regions of AF447 and AH5017 flights (Fig. 3A,B). However, such information
is too general to be of practical use for flight operations. We therefore propose a parameter that more specifi-
cally reflects the icing conditions. Ice nucleation in high cold clouds such as anvil cirrus is affected not only by
conventional thermodynamic parameters and aerosol concentration but also by vertical velocities16,17. Under
conditions prevailing in peripheries of convective systems (e.g., low vertical turbulence in anvils), even lower
updraft grid-scale velocities can contribute to ice production. To link the icing intensity with the number of ice
nucleating dust particles lifted from lower levels, we define the Dust Icing Index ( DII ) as follows:
DII = nINP w
Here, w [hPa/s] is the model vertical velocity. DII represents the vertical flux of nINP.
To explore the capability of DII to identify the increased icing, we calculate it along the routes of two consid-
ered flight. Figure 3C–H show the DII time evolution as a vertical cross section along the flight paths for three
consecutive times around the instances of accidents. For both flights, DII exhibits a sharp rise along a rather
narrow vertical layer in the vicinity of the accidents. The index has increased at both accident times and loca-
tions. In the case of AH5017 (which occurred at 9.5 km height), DII starts taking significant values within the
9–10 km layer and reaches a maximum above.
Figure 4A,B displays DII evolution of at the levels of the two flights starting four days before the accidents.
For both flights, DII is almost zero or has low values days before the accidents, but it abruptly increases at
approximate times of the accidents.
To explore dust relative contribution in forming ice crystals, we compare ice-nucleating dust particle con-
centration nINP with ice concentration nice as parameterized by the atmospheric driven microphysical s cheme18.
After reaching the upper-troposphere altitudes at which the accidents happened, it is assumed that at cloud top
heights the most of dust particles nINP are activated to ice c rystals19. Figure 5A,B show that for both considered
accidents, dust-caused icing dominates over the icing by other causes.
The successful prediction of risky icing conditions presented herein indicates that the newly proposed Dust
Icing Index DII could be a useful warning tool for aviation operators. This study opens an opportunity for detect-
ing flight segments with dangerous icing caused by mineral dust if routine atmospheric-dust forecasts are applied.
Methods summary
Modeling. DREAM is an online dust model6,7,20 driven by the atmospheric model WRF N MM21. There are
28 vertical model levels spanning from the surface to 50 hPa. The horizontal resolution is set to 1/10 deg, for
a grid distance of approximately 16 km in the model domain. Here, non-dust ice nucleation process is param-
eterized by the Ferrier grid-scale cloud microphysics scheme18. By numerically solving Euler-based dust mass
conservation equations for 8 particle bins with radii spanning from 0.2 to 7.8 µm, DREAM describes all major
components of the atmospheric dust processes such as emission, horizontal and vertical turbulent mixing, long-
range transport and dust wet and dry deposition. The USGS land cover data combined with preferential dust
sources22 is used to define barren and arid soils as dust-productive areas. In this study, dust concentration,
atmospheric temperature and moisture of the coupled dust-atmospheric model are used to calculate the ice-
nucleating dust particles nINP . For temperatures in the interval (− 36 °C; − 15 °C), we have implemented the
immersion ice nucleation parameterization23. For temperatures in the interval (− 55 °C; − 36 °C) under which
accidents happened, we use the Ullrich et al., parameterization for the deposition ice nucleation15. This scheme
is based on the ice nucleation active surface site approach, in which nINP is a function of temperature, humidity
and the aerosol surface area concentration.
Scientific Reports | (2021) 11:6411 | https://doi.org/10.1038/s41598-021-85566-y 5
Vol.:(0123456789)www.nature.com/scientificreports/
a b
c d
e f
Figure 3. Cloud icing conditions for AF477 (left column) and AH5017 (right column). Arrows, crosses and
thick lines above indicate locations of the accident. (A, B) Predicted vertically integrated log10 (nINP) at the
times of accidents. (C–H) Height-time graphs of the predicted Dust Icing Index DII for three consecutive times
around the instances of the accidents.
Scientific Reports | (2021) 11:6411 | https://doi.org/10.1038/s41598-021-85566-y 6
Vol:.(1234567890)www.nature.com/scientificreports/
g h
Figure 3. (continued)
a b
Figure 4. (A, B) Time evolution of Dust Icing Index DII at the flight levels of AF477 (left) and AH5017 (right).
Scientific Reports | (2021) 11:6411 | https://doi.org/10.1038/s41598-021-85566-y 7
Vol.:(0123456789)www.nature.com/scientificreports/
a b
Figure 5. (A, B) Time evolution of the ice-nucleating dust particle concentration nINP (red) and the ice
concentration nice (in #/liter) of the Ferrier atmospheric driven microphysical s cheme18 (blue) at flight levels of
two considered flights, AF477 (left) and AH5017 (right).
Data availability
For the MSG SEVIRI cloud top temperature plots, we used the product “CLAAS-2.1: CM SAF CLoud property
dAtAset using SEVIRI—Edition 2” as d escribed24 publicly available from EUMETSAT’s Satellite Application
Facility on Climate Monitoring (CM SAF) on https://wui.cmsaf.eu/. The CALIPSO data were obtained from the
online archive of the ICARE Data and Services center http://www.icare.univ-lille1.fr/archive (NASA/LARC/SD/
ASDC. (2018); ICARE Data Center, 2021) NASA/LARC/SD/ASDC. (2018). CALIPSO Lidar Level 2 Aerosol
Profile, V4-20 [Data set]. NASA Langley Atmospheric Science Data Center DAAC, retrieved from https://doi.
org/10.5067/CALIOP/CALIPSO/LID_L2_05KMAPRO-STANDARD-V4-20, ICARE Data Center: CALIPSO
data, available at: http://www.icare.univ-lille1.fr/, last access: 2February 2021.
Received: 5 December 2020; Accepted: 23 February 2021
References
1. Belo-Pereira, M. Comparison of in-flight aircraft icing algorithms based on ECMWF forecasts. Meteorol. Appl. 22, 705–715 (2015).
2. Haggerty, J. et al. Detecting clouds associated with jet engine ice crystal icing. Bull. Am. Meteorol. Soc. 31, 31–40 (2019).
3. Ackerman, A. S. et al. High ice water content at low radar reflectivity near deep convection—part 2: evaluation of microphysical
pathways in updraft parcel simulations. Atmos. Chem. Phys. 15, 11729–11751. https://doi.org/10.5 194/a cp-1 5-1 1729-2 015 (2015).
4. Fridlind, A. M. High ice water content at low radar reflectivity near deep convection—part 1: consistency of in situ and remote-
sensing observations with stratiform rain column simulations. Atmos. Chem. Phys. 15, 11713–11728. https://doi.org/10.5194/
acp-15-11713-2015 (2015).
5. Yost, C. R. et al. A prototype method for diagnosing high ice water content probability using satellite imager data. Atmos. Meas.
Tech. 11, 1615–1637. https://doi.org/10.5194/amt-11-1615-2018 (2018).
6. Nickovic, S., Kallos, G., Papadopoulos, A. & Kakaliagou, O. A model for prediction of desert dust cycle in the atmosphere. J.
Geophys. Res. 106, 18113–18130 (2001).
7. Nickovic, S. et al. Cloud ice caused by atmospheric mineral dust—part 1: parameterization of ice nuclei concentration in the
NMME-DREAM model. Atmos. Chem. Phys. 16, 11367–11378. https://doi.org/10.5194/acp-16-11367-2016 (2016).
8. Cziczo, D. J. et al. Clarifying the dominant sources and mechanisms of cirrus cloud formation. Science 340, 1320–1324 (2013).
9. BEA—Bureau d’Enquêtes et d’Analysespour la sécurité de l’aviation civil. Final Report on the accident on 1st June 2009 to the
Airbus A330–203 registered F-GZCP operated by Air France flight AF 447 Rio de Janeiro–Paris, 209 (Ministère de l’Écologie, du
Développement durable, des Transports et du Logeme, 2014).
10. BEA—Bureau d’Enquêtes et d’Analysespour la sécurité de l’aviation civil. Final Report on the accident on 24 July 2014 near Gossi
(Mali) to the McDonnell Douglas DC-9–83 (MD-83) registered EC-LTV operated by Swiftair S.A., 170 (Ministère de l’Equipment,
des Transports et du Desenclavement, 2016).
11. Issa-Lélé, I. & Lamb, P. J. Variability of the intertropical front (ITF) and rainfall over the West African Sudan–Sahel Zone. J. Clim.
23, 3984–4004. https://doi.org/10.1175/2010JCLI3277.1 (2010).
12. Olofsson, B., Andersson, S., Mårtensson, T., Mårtensson, E. & Olsson, E. A new algorithm to estimate aircraft icing in the HIRLAM
model. Meteorol. Appl. 10, 111–114 (2003).
13. de Laat, A. et al. Analysis of geostationary satellite-derived cloud parameters associated with environments with high ice water
content. Atmos. Meas. Tech. 10, 1359–1371. https://doi.org/10.5194/amt-10-1359-2017 (2017).
14. Morcrette, C., Brown, K., Bowyer, R., Gill, P. & Suri, D. Development and evaluation of in-flight icing index forecast for aviation.
Weather Forecast. 34, 731–750 (2019).
15. Ullrich, et al. A new ice nucleation active site parameterization for desert dust and soot. J. Atmos. Sci. 74, 699–717. https://doi.org/
10.1175/JAS-D-16-0074.1 (2017).
Scientific Reports | (2021) 11:6411 | https://doi.org/10.1038/s41598-021-85566-y 8
Vol:.(1234567890)www.nature.com/scientificreports/
16. Karcher, B. & Lohmann, U. A parameterization of cirrus cloud formation: homogeneous freezing of supercooled aerosols. J.
Geophys. Res. 107, 1–10. https://doi.org/10.1029/2001JD000470 (2002).
17. Eidhammer, T., DeMott, P. J. & Kreidenweis, S. M. A comparison of heterogeneous ice nucleationparameterizations using a parcel
model framework. J. Geophys. Res. 114, D06202. https://doi.org/10.1029/2008JD011095 (2009).
18. Ferrier, B. S., Jin, Y., Lin, Y., Black, T., Rogers, E. & DiMego, G. Implementation of a new grid-scale cloud and precipitation scheme
in the NCEP Eta model. In 15th Conference on Numerical Weather Prediction, American Meteorological Society, San Antonio,
280–283 (2002).
19. Marinou, E. et al. Retrieval of ice-nucleating particle concentrations from lidar observations and comparison with UAV in situ
measurements. Atmos. Chem. Phys. 19, 11315–11342. https://doi.org/10.5194/acp-19-11315-2019 (2019).
20. Pejanovic, G. et al. Atmospheric deposition of minerals in dust over the open ocean and possible consequences on climate. WCRP
OSC Climate Research in Service to Society, 24–28 October 2011, Denver (2011).
21. Janjic, Z. I., Gerrity, J. P. Jr. & Nickovic, S. An alternative approach to nonhydrostatic modeling. Mon. Weather Rev. 129, 1164–1178
(2001).
22. Ginoux, P. et al. Sources and distributions of dust aerosolssimulated with the GOCART model. J. Geophys. Res. 106, 20255–20274
(2001).
23. DeMott, P. J. et al. Integrating laboratory and field data to quantify the immersion freezing ice nucleation activity of mineral dust
particles. Atmos. Chem. Phys. 15, 393–409. https://doi.org/10.5194/acp-15-393-2015 (2015).
24. Finkensieper, S. et al. CLAAS-2: CM SAF CLoud property dAtAset using SEVIRI—edition 2, satellite application facility on climate
monitoring. Satellite Appl. Facil. Clim. Monit. https://doi.org/10.5676/EUM_SAF_CM/CLAAS/V002 (2016).
Acknowledgements
Computational resources of the Republic Hydrometeorological Service of Serbia were used to perform the
modeling experiments of the study. We acknowledge EUMETSAT and NASA for the use of the satellite data.
CALIPSO data were provided by NASA. CALIPSO data were obtained from the ICARE Data Center (http://
www.icare.univ-lille1.fr/). We thank the ICARE Data and Services Center for providing access to the data used
in this study and their computational center. The MSG SEVIRI data was obtained from EUMETSAT’s Satellite
Application Facility on Climate Monitoring (CM SAF) (https://wui.cmsaf.eu). The cloud top temperature plots
were completed by using data from EUMETSAT’s Satellite Application Facility on Climate Monitoring (CM
SAF). The research has been partly supported by the COST Action CA16202 inDust (International Network to
Encourage the Use of Monitoring and Forecasting Dust Products) and by the D-TECT Grant (725698) funded
by the European Research Council (ERC) under the European Union’s Horizon 2020 research and innovation
program. EM was funded by a DLR VO-R young investigator group and the Deutscher Akademischer Aus-
tauschdienst (Grant No. 57370121). The authors also thank the WMO Sand and Dust Storm Warning Advisory
and Assessment System (SDS-WAS) for its support.
Author contributions
S.N. initiated the research, performed the first model experiments, and wrote the main part of the manuscript;
B.C. performed all the numerical experiments, S.P. and G.P. contributed to numerical experimentation; V.A. and
S.S. contributed to the results’ interpretation; E.M. selected and interpreted satellite observation; J.N. contributed
to the results’ interpretation. In addition, all authors contributed to interpretations, formulated the conclusion,
and reviewed the manuscript.
Competing interests
The authors declare no competing interests.
Additional information
Correspondence and requests for materials should be addressed to S.N.
Reprints and permissions information is available at www.nature.com/reprints.
Publisher’s note Springer Nature remains neutral with regard to jurisdictional claims in published maps and
institutional affiliations.
Open Access This article is licensed under a Creative Commons Attribution 4.0 International
License, which permits use, sharing, adaptation, distribution and reproduction in any medium or
format, as long as you give appropriate credit to the original author(s) and the source, provide a link to the
Creative Commons licence, and indicate if changes were made. The images or other third party material in this
article are included in the article’s Creative Commons licence, unless indicated otherwise in a credit line to the
material. If material is not included in the article’s Creative Commons licence and your intended use is not
permitted by statutory regulation or exceeds the permitted use, you will need to obtain permission directly from
the copyright holder. To view a copy of this licence, visit http://creativecommons.org/licenses/by/4.0/.
© The Author(s) 2021, corrected publication 2021
Scientific Reports | (2021) 11:6411 | https://doi.org/10.1038/s41598-021-85566-y 9
Vol.:(0123456789)You can also read