Novel HPLC-UV method for simultaneous determination of valsartan and atenolol in fixed dosage form; Study of green profile assessment
←
→
Page content transcription
If your browser does not render page correctly, please read the page content below
Pharmacia 68(1): 43–51
                                                                                                                 DOI 10.3897/pharmacia.68.e53631

                                                              Research Article

Novel HPLC-UV method for simultaneous
determination of valsartan and atenolol in fixed
dosage form; Study of green profile assessment
Kateryna Peleshok1, Marjan Piponski2, Elizabeth Adaeze Ajie1, Olha Poliak1, Nadiya Zarivna1,
Olha Denefil1, Liliya Logoyda1
1 I. Horbachevsky Ternopil National Medical University, Ternopil, Ukraine
2 Quality Control Department, Replek Farm Ltd., Skopje, Republic of Macedonia

Corresponding author: Liliya Logoyda (logojda@tdmu.edu.ua)

Received 25 April 2020 ♦ Accepted 20 May 2020 ♦ Published 7 January 2021

Citation: Peleshok K, Piponski M, Ajie EA, Poliak O, Zarivna N, Denefil O, Logoyda L (2021) Novel HPLC-UV method for simul-
taneous determination of valsartan and atenolol in fixed dosage form; Study of green profile assessment. Pharmacia 68(1): 43–51.
https://doi.org/10.3897/pharmacia.68.e53631

Abstract
Aim of this work was to develop the first simple, rapid, green, economical and selective HPLC method for simultaneous quanti-
fication of the cited drugs in their challenging binary mixture. The work was motivated by the global trends towards sustainable
chemistry in designing eco-friendly mobile system without affecting the analysis parameters. The proposed method was subjected to
a greenness profiles using some metrics as Eco-scale.
Materials and methods. This was accomplished under the following chromatographic conditions: HPLC column Discovery C18
(4.6 mm i.d. × 150 mm, 5 μm), column temperature 30 °C, flow rate 1.0 mL/min, mobile phase composed of 20% acetonitrile, 80%
of 0.16% ammonium acetate and 0.2% of 1.5 M tetramethylammonium hydroxide (V/V) and signal monitoring at a wavelength of
225 nm and 237 nm.
Results. A conventional mixture of acetonitrile and 0.16% ammonium acetate was tried in different ratios, but the drugs were not
well separated. The shortest aliphatic chain cationic ion pair reagent tetramethylammonium hydroxide should not be exchanged with
other type similar with this, like tetramethylammonium hydrogen sulfate, it did not work to our experiments. Increasing salt concen-
tration, ammonium acetate, more than 0.2%, pushes the peak of atenolol closer to dead volume, which is negative. Atenolol in their
methods for multicomponent mixtures elutes in dead volume, or when retained longer, much stronger, hydrophobic mobile phase
should be used if valsartan should be seen in same chromatogram at dissent time. The 237 nm can be chosen as compromise signal
for nearly equal peaks height with high sensitivity is not essential. The 225 nm signal shows much higher sensitivity for atenolol and
less increase for valsartan peaks, which can be used when higher sensitivities will be essential. Linearity was examined and proven at
different concentration levels in the range of working concentration of valsartan (0.16–0.96 mg/mL) and atenolol (0.2–1.20 mg/mL).
The high value of recoveries obtained for valsartan and atenolol indicates that the proposed method was found to be accurate. The
results of proposed method found to be an excellent green analysis with a score of 84.
Conclusion. A new fast, simple and green, but selective, accurate, precise and robust HPLC-UV method for simultaneous deter-
mination of valsartan and atenolol in newly formulated dosage form was developed and many possible variations of the same were
suggested. The developed method for the simultaneous quantification of valsartan and atenolol in their challenging binary mixture
offers simplicity essential for quality control of a large number of samples in short time intervals, which is necessary for routine anal-
ysis. The method was subjected to greenness profile assessment.

Copyright Peleshok K et al. This is an open access article distributed under the terms of the Creative Commons Attribution License
(CC-BY 4.0), which permits unrestricted use, distribution, and reproduction in any medium, provided the original author and source
are credited.
44 Peleshok K et al.: Novel HPLC-UV method for simultaneous determination of valsartan and atenolol
Keywords
Valsartan, Atenolol, HPLC-UV, Method Development, Validation, Green chemistry
Introduction MS/MS) (Shah et al. 2009; Gonzaleza et al. 2010), HPLC
methods with photometric (Raju and Rao 2011), fluoro-
Green chemistry is at the frontiers of this continuous- metric detection coupled with mass spectrometry (Rao et
ly-evolving interdisciplinary science and publishes research al. 2011) and high performance capillary electrophoresis
that attempts to reduce the environmental impact of the (HPCE) (Hillaert and Bossche 2002, 2003; Alnajjar 2011)
chemical enterprise by developing a technology base that is as well as the derivative UV-spectrophotometry methods
inherently non-toxic to living things and the environment. (Tatar and Saglik 2002; Kul et al. 2010).
High performance liquid chromatography (HPLC) is one
of the most common and versatile technique in the phar-
maceutical analysis field. It provides an automated, simple,
fast and cost-efficient technique for separation, identifi-
cation and quantification of complex mixtures with high
resolution and reproducibility. Moreover, HPLC has taken
significant steps towards green analytical chemistry. This is
fulfilled by simultaneous analysis of multiple samples with
the lowest energy and mobile phase consumption or was-
tes per sample in the realm of liquid chromatography.
The urgency of the problem of hypertension is deter-
mined by its high population frequency, impact on health Figure 1. Chemical structure of valsartan.
status, performance and life expectancy of the population.
World and national guidelines for the diagnosis and treat- Atenolol (Fig. 2) is a synthetic isopropylami-
ment of hypertension emphasize that virtually all groups no-propanol derivative used as an antihypertensive, hy-
of drugs for the treatment of hy pertension can be com- potensive and antiarrhythmic. Atenolol is chemically
bined with each other, of course, that the recent trend of known as 2- [4 – [(2RS) -2-hydroxy-3 – [(1-methylet-
combining different pharmacological subgroups to achie- hyl) amino] propoxy] phenyl] acetamide. Atenolol acts
ve a more effective therapeutic effect. Therefore, the crea- as a peripheral, cardioselective beta-blocker specific for
tion of fixed combinations of API (active pharmaceutical beta-1 adrenergic receptors, without intrinsic sympatho-
ingredients) antihypertensive action in the form of solid mimetic effects. It reduces exercise heart rates and delays
dosage forms is a task of modern pharmacy. atrioventricular conduction, with overall oxygen require-
Valsartan (Fig. 1) is chemically described as (2S)-3- ments decreasing. Literature survey reveals that various
methyl-2-[pentanoyl-[[4-[2-(2H-tetrazol-5-yl)phenyl] analytical methods have been reported for determination
phenyl]methyl]amino]butanoic acid. Valsartan is an of Atenolol in pure form and in pharmaceutical formula-
orally active nonpeptide triazole-derived antagonist of tions which include high performance liquid chromato-
angiotensin (AT) II with antihypertensive properties. graphy (HPLC) for determination of Atenolol in tablets
Valsartan selectively and competitively blocks the bin- (Kondratova et al. 2016; Logoyda 2018a, b, c, d; Logoyda
ding of angiotensin II to the AT1 subtype receptor in vas- et al. 2018a, b; Logoyda 2019a, b).
cular smooth muscle and the adrenal gland, preventing
AT II-mediated vasoconstriction, aldosterone synthesis
and secretion, and renal reabsorption of sodium, and
resulting in vasodilation, increased excretion of sodium
and water, a reduction in plasma volume, and a reduction
in blood pressure. Therefore, analytical methods for their
separation and quantification in pharmaceutical formu-
lations and inhuman plasma are desirable for quality con-
trol and therapeutic drug monitoring, respectively. Se- Figure 2. Chemical structure of atenolol.
veral techniques have been reported in the literature for
the determination of valsartan individually in pharma- This unique combination is safe and effective for trea-
ceutical dosage forms or human serum samples such as ting hypertension in elderly people than using each drug
spectrophotometry (Gupta et al. 2010) high performance alone. But to date, no chromatographic method has been
liquid chromatography-tandem mass spectrometry (LC– reported for the assaying of this binary mixture.Pharmacia 68(1): 43–51 45
Aim of work Sample preparation
Therefore, the aim of this work was to develop the first Twelve tablets of each preparation were studied to obtain
simple, rapid, green, economical and selective HPLC statistically significant results. The tablets with declared
method for simultaneous quantification of the cited contents of 80 mg valsartan and 100 mg of atenolol were
drugs in their challenging binary mixture. The work was purchased from local drug store, pharmacy. The tablets
motivated by the global trends towards sustainable che- were put in 100 mL measuring flasks and dissolved in
mistry in designing eco-friendly mobile system without 50 mL 50% v/v methanol, ultrasound crushed and treated
affecting the analysis parameters. The proposed method for 2 minutes and shaked 15min with orbital shaker. Af-
was subjected to a greenness profiles using some me- ter that measuring flasks were filled to mark for 100 mL,
trics as Eco-scale. the final concentrations were 1mg/mL for atenolol and
0.8 mg/mL for valsartan. Samples were filtered with RC
0.45 µm syringe filters and injected.
Materials and methods
Valsartan (purity 99.9%) was purchased from Tonira Results and discussion
PHARMA LIMITED (Gujarat – India), atenolol (puri-
ty 100.1%) was purchased from Moehs Catalana (Bar- The emerging of new pharmaceutical formulations pro-
celona – Spain). 80 mg valsartan (standard sample) and vokes the necessity for simple, accurate, economical and
100 mg atenolol (standard sample) were put in 100 mL fast analytical techniques to be applied in quality control
measuring flasks and dissolved in 50 mL 50% v/v me- laboratories where time and cost are critical. Moreover,
thanol, ultrasound crushed and treated for 2 minutes minimizing toxicity with retaining method efficacy may
and shaked 15 min with orbital shaker. The final concen- be one of challenging aspects in developing a safer me-
trations were 1 mg/mL for atenolol and 0.8 mg/mL for thodology. To find the appropriate HPLC conditions for
valsartan. Samples were filtered with RC 0.45 μm syringe separation of the examined drug, various columns, isocra-
filters and injected. tic and gradient mobile phase systems were tried, and suc-
Methanol and acetonitrile used in experiments was cessfully attempts were performed using a C18 chroma-
HPLC gradient grade and ammonium acetate and tetra- tographic column Discovery C18 (4.6 mm i.d. × 150 mm,
methylammonium hydroxide were of Ph. Eur. reagent 5 μm). Method development was initiated by trying sever-
grade and purchased from Merck Darmstdat, Germany. al mobile phases with various compositions to attain op-
Analytical Balance Mettler Toledo MPC227, pH-meter timum separation and resolution (Kondratova et al. 2016;
Metrohm 827, deionized water from TKA Micro system, Logoyda 2018a, b, c, d; Logoyda et al. 2018a, b; Logoyda
with final conductivity less than 0.05 µS/cm. IKA orbital 2019a, b). First, a conventional mixture of acetonitrile and
shaker KS4000i was used for sample agitation. The nylon 0.16% ammonium acetate was tried in different ratios, but
and regenerated cellulose RC 0.45 μm syringe filters were the drugs were not well separated. The shortest aliphatic
purchased from Agilent Technologies. chain cationic ion pair reagent tetramethylammonium
Dionex Ultimate 3000 UHPLC system controlled by hydroxide was purchased from Sigma, as 1.5 M or ~25%
Chromeleon version 6,80, composed of quaternary LPG w/v solution and should not be exchanged with other type
pump ultimate 3000, autosampler ultimate 3000, ulti- similar with this, like tetramethylammonium hydrogen
mate 3000 column compartment, four channel UV-Vis sulfate, it did not work to our experiments. Increasing
detector ultimate 3000 RS. Shimadzu Nexera XR UPLC salt concentration, ammonium acetate, more than 0.2%,
system with LPG Quaternary Pump LC-20AD with de- pushes the peak of atenolol closer to dead volume, which
gasser DGU-20A5R, Autosampler SIL-20AC, PDA detec- is negative. We consulted more some articles for atenolol
tor M20-A, Column Oven and Controller CBM-20A con- retention examination with other very hydrophobic and
trolled by Lab Solutions version 5,97. The used column much less polar component and concluded that they are
Discovery C18 (4.6 mm i.d. × 150 mm, 5 μm), purchased unusable. Atenolol in their methods for multicomponent
from Sigma-Aldrich Supelco. mixtures elutes in dead volume, or when retained longer,
much stronger, hydrophobic mobile phase should be used
Chromatographic conditions: if valsartan should be seen in same chromatogram at dis-
sent time. With 1mg/mL solution of atenolol and 0.8 mg/
The optimum mobile phase composition was composed mL solution of valsartan, visibly more sensitive 225 nm
of 20% acetonitrile, 80% of 0.16% ammonium acetate and signal might create worse linearity, CV below 0.999, but
0.2% of 1.5 M tetramethylammonium hydroxide (V/V), the signal at 237 nm creates perfect CV=1. So, if needed to
pumped with 1.0 mL/min at 30 °C set temperature of co- work at 225 nm, solutions would like to dilute the samples
lumn oven, with UV detector set to 225 nm and 237 nm to final concentration of atenolol 0.5 mg/mL and valsartan
wavelength. Analysis performed on column Discovery to 0.4 mg/mL. This step is not essential but shows slightly
C18 (4.6 mm i.d. × 150 mm, 5 μm). better CV of linear response. The applicability of the mo-46 Peleshok K et al.: Novel HPLC-UV method for simultaneous determination of valsartan and atenolol
bile phase concept was tested on chromatographic sys- of the method. The chromatograms showed that there is
tems and columns with different performances, and the no interference between the principal peaks of bisopro-
obtained chromatograms are shown in Figs 3, 4. lol and enalapril with the components of placebo and the
The 237 nm can be chosen as compromise signal for used solvent, and also good resolution (Fig. 4).
nearly equal peaks height with high sensitivity is not es-
sential. The 225 nm signal shows much higher sensitivity Linearity
for atenolol and less increase for valsartan peaks, which
can be used when higher sensitivities will be essential. Calibration curve representing the relation between the
Chromatograms were obtained with satisfactory retenti- concentrations of drugs versus the peak area were con-
on factors and very good peak symmetry of both analyte structed. In triplicate run from which the linear regression
peaks (tailing factors according to USP of around 1.2– equation was calculated. Chromatogram obtained under
1.4), with resolution better than required (R > 7) (Logoyda linearity study in 6 concentrations levels is presented in
2019). This was accomplished under the following chro- Figs 5, 6. Linearity was examined and proven at diffe-
matographic conditions: HPLC column Discovery C18 rent concentration levels in the range of working con-
(4.6 mm i.d. × 150 mm, 5 μm), column temperature 30 °C, centration of valsartan (0.16–0.96 mg/mL) and atenolol
flow rate 1.0 mL/min, mobile phase composed of 20% ace- (0.2–1.20 mg/mL). The calibration plots of valsartan and
tonitrile, 80% of 0.16% ammonium acetate and 0.2% of atenolol are presented in Figs 7, 8.
1.5 M tetramethylammonium hydroxide (V/V) and sig- For valsartan, linearity regression equation at 225 nm
nal monitoring at a wavelength of 225 nm and 237 nm. y = 2E+06x-43093 and an obtained correlation coeffi-
The method was validated according to the ICH guideline cient of R2 = 1, linearity regression equation at 237 nm
for the Validation of analytical procedures Q2(Q1A (R2) y = 2E+06x-10485 and an obtained correlation coefficient
2003; Q2A 1994; Q2B 1996). of R2 = 1. For atenolol, linearity regression equation at
225 nm y = 2E+06x+86277 and an obtained correlation
Specificity coefficient of R2 = 0.9994, linearity regression equation at
225 nm y = 522282x+ 7976.6 and an obtained correlation
The specificity of the method was determined with evalua- coefficient of R2 = 1. At 225 nm, the values of LOD were
tion of the obtained chromatograms of the blank, placebo 0.15 mg/mL, LOQ were 0.8 mg/mL for atenolol, and LOD
solution, test solution and standard solution. For compa- were 0.2 mg/mL and LOQ were 0.9 mg/mL for valsartan.
rison was added chromatogram of solvent, which should The results show that a phenomenal relationship between
be almost identical to placebo, which confirms selectivity peak area and concentration of the drugs in the calibra-
Figure 3. Elution profiles obtained for test samples prepared of Valsartan + Atenolol tablets (80 + 100) mg using mobile phases:
a) 20% acetonitrile and 80% of 0.16% ammonium acetate (V/V); b) 20% acetonitrile, 80% of 0.16% ammonium acetate and 0.2 % of
1.5 M tetramethylammonium hydroxide (V/V). Chromatographic conditions: Shimadzu Nexera XR UPLC system, C18 chromato-
graphic column Discovery C18 (4.6 mm i.d. × 150 mm, 5 μm), flow rate 1.0 mL/min, column temperature 30 °C.Pharmacia 68(1): 43–51 47
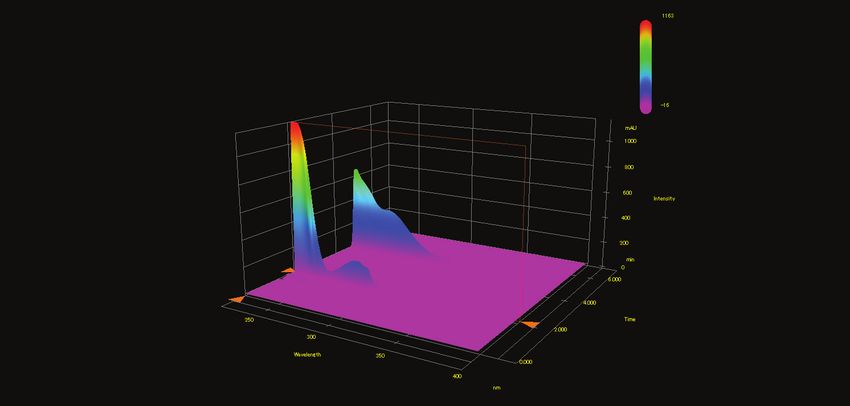
Figure 4. Chromatogram obtained using Shimadzu Nexera XR UPLC system and mobile phase 20% acetonitrile, 80% of 0.16%
ammonium acetate and 0.2% of 1.5 M tetramethylammonium hydroxide (V/V), column Discovery C18 (4.6 mm i.d. × 150 mm,
5 μm) at 2 wavelengths 225 nm and 237 nm (first figure), with 3-D UV contour diagram extracted analytes UV spectra and peak
purity (second figure).
tion curves and indicate high sensitivity of the proposed Table 1. Intra-day and inter-day precision for the HPLC deter-
HPLC method. mination of valsartan.
Day Intra-day precision Inter-day precision
Accuracy and precision Mean RSD % Mean RSD %
1 99.01 0.451 100.91 0.314
2 100.12 0.543 99.24 0.382
Intra-day and inter-day % RSD values lower than 2% 3 100.98 0.385 100.42 0.624
clearly assuring that this method was found to be fairly
*Each value is represented as a mean±SD of observations (n=5), SD: Standard De-
precise and reproducible (Tables 1–4). Regarding accura- viation, RSD: Relative Standard Deviation.
cy, a known amount of the standard drug was added to the
fixed amount of preanalyzed sample solution. % recovery Robustness
was calculated by comparing the area before and after ad-
dition of the standard drug. The high value of recoveries The robustness of the developed method was evaluated
obtained for valsartan and atenolol indicates that the pro- by small deliberate changes in method parameters such
posed method was found to be accurate. as flow rate (+10%) and temperature of column (± 7%).48 Peleshok K et al.: Novel HPLC-UV method for simultaneous determination of valsartan and atenolol
Figure 5. Chromatogram obtained using final established, optimized and validated chromatographic method at wavelength 225 nm.
Figure 6. Chromatogram obtained using final established, optimized and validated chromatographic method at wavelength 237 nm.
14000000 Valsartanl Linearity at 225 nm
12000000 Valsartan Linearity at 237 nm
10000000 y = 1E+07x - 43093
R² = 1
8000000
y = 1E+07x - 10485
R² = 1
6000000
4000000
2000000
0
0 0.2 0.4 0.6 0.8 1 1.2
Figure 8. The calibration curves of atenolol.
Figure 7. The calibration curves of valsartan.
The % RSD values of robustness which is less than 2% Methanol and acetonitrile are the most broadly used sol-
reveals that the proposed method is robust. The results of vents in most analytical methods, and it is worth mentio-
robustness study results are shown in Tables 5, 6. ning that methanol and acetonitrile are rated by the U.S. En-
Even though the small changes in the conditions did vironmental Protection Agency as hazardous solvents, given
not significantly effect on retention time of valsartan their inherent toxicity and the fact that their disposal ne-
and atenolol. cessitates specialized treatment steps, particularly for aceto-Pharmacia 68(1): 43–51 49
Table 2. Intra-day and inter-day precision for the HPLC deter- Table 6. Results of the study of robustness for the HPLC deter-
mination of atenolol. mination of atenolol.
Day Intra-day precision Inter-day precision Conditions of analysis Retention time, min
Mean RSD % Mean RSD % Standard conditions 2.15
1 99.75 0.325 101.19 0.497 flow rate 1.1 mL/min, (+10 %) 1.98
2 101.02 0.612 99.36 0.341 flow rate 0.9 mL/min, (-10 %) 2.35
3 100.58 0.285 100.55 0.614 temperature of column 28 °С 2.21
temperature of column 32 °С 2.09
*Each value is represented as a mean±SD of observations (n=5), SD: Standard De-
viation, RSD: Relative Standard Deviation.
Table 3. Accuracy study for the HPLC determination of valsartan. nitrile, where detoxification through chemical treatment has
to be carried out because traditional disposal (i.e., through
Model The amount of valsartan, % Found,% to
predetermined,
combustion) produces a highly toxic compound (hydrogen
Predetermined quantity, Found quantity,
Solutions Xi=(mi /mrs) 100 % Yi =( Si/Srs) 100 % Zi = (Yi/Xi).100% cyanide). Analytical eco-scale is a semi-quantitative assess-
M1 70.02 70.10 100.11 ment tool commonly used for examining the greenness of
M2 80.51 80.75 100.30 analytical methods in a comparative manner. It is based on
M3 89.87 90.03 100.18
assigning a numerical score, penalty points, for every step in
M4 95.09 95.31 100.23
M5 100.01 99.78 99.77 the whole analytical method that may affect the green sys-
М6 104.91 105.26 100.33 tem such as solvents, their amounts, energy consumption,
М7 110.45 110.85 100.36 occupational risk and waste generated hazards (Gałuszka et
М8 120.43 120.58 100.12
al. 2012; Goswami et al. 2018; Karamad et al. 2019).
М9 130.00 130.27 100.21
Average, Z, % 100.18 The analytical eco-scale total score is then calculated by
Standard deviation, Sz, % 0.18 subtracting all these penalty points form 100 (the score of
Confidence interval of convergence of results (actual) 0.41 ideal green procedure). A score more than 75 represents
∆z = t(95%,8).Sz = 2.3060. Sz, %
excellent green analysis, from 75–50 represents accepta-
Critical value for the convergence of results Performed
∆ ≤ max∆As = 2.4% (< 2.4)
ble green analysis, and less than 50 represents inadequate
Systematic error δ=|Z – 100|, % 0.18 green analysis (Korany et al. 2017). Table 7 summarizes
Criterion of significance of systematic error Performed the results of proposed method found to be an excellent
δ ≤ max δ% (< 0.77) green analysis with a score of 84.
The general conclusion about the technique: Correct
Table 7. Analytical eco-scale for greenness assessment of the
Table 4. Accuracy study for the HPLC determination of atenolol. proposed chromatographic method.
Model The amount of atenolol, % Found,% to Parameters Penalty points (PP)
Predetermined quantity, Found quantity, predetermined, Reagents
Solutions Xi=(mi /mrs) 100 % Yi =( Si/Srs) 100 % Zi = (Yi/Xi).100% Methanol 6
M1 70.01 70.09 100.11 Acetonitrile 6
M2 80.34 80.81 100.59 Energy consumption 1
M3 89.96 90.12 100.18 Occupational hazards 0
M4 95.15 95.29 100.15 Waste 3
M5 100.01 99.79 99.78 Total penalty points (PP) 16
М6 104.96 105.19 100.22 Analytical Eco-scale score 84
М7 110.55 110.79 100.22 Comment Excellent green analysis
М8 120.14 120.19 100.04
М9 130.00 130.27 100.21
Conclusion
Average, Z, % 100.17
Standard deviation, Sz, % 0.21
Confidence interval of convergence of results (actual) 0.48
∆z = t(95%,8).Sz = 2.3060. Sz, %
Critical value for the convergence of results Performed A novel fast, simple and green but selective, accurate, pre-
∆ ≤ max∆As = 2.4% (< 2.4) cise and robust HPLC-UV method for simultaneous de-
Systematic error δ=|Z – 100|, % 1.17
Criterion of significance of systematic error Performed
termination of valsartan and atenolol in newly formulated
δ ≤ max δ% (< 0.77) dosage form was developed and many possible variations
The general conclusion about the technique: Correct of the same were suggested.
The developed method for the simultaneous quantificati-
on of valsartan and atenolol from solid dosage formulations
Table 5. Results of the study of robustness for the HPLC deter-
offers simplicity essential for quality control of a large num-
mination of valsartan.
ber of samples in short time intervals, which is necessary for
Conditions of analysis Retention time, min routine analysis. The concept of mobile phase composition
Standard conditions 5.07
was evaluated and confirmed on different chromatographic
flow rate 1.1 mL/min, (+10 %) 4.69
flow rate 0.9 mL/min, (-10 %) 5.62 systems. The C18 columns proved to be applicable due to
temperature of column 28 °С 5.25 make a shorter run time of analyses. Furthermore, the deve-
temperature of column 32 °С 4.98 loped method showed good results for the tested validation50 Peleshok K et al.: Novel HPLC-UV method for simultaneous determination of valsartan and atenolol
parameters, i.e. it is selective, accurate, linear and precise, and Acknowledgement
is thus suitable to be used for the simultaneous quantification
of valsartan and atenolol in their challenging binary mixture. Authors are grateful to the Ministry of Health of Ukrai-
This work was also focusing on the implementation of ne Fund for providing scholarship for studies related to
sustainable chemistry by replacing conventional solvents solutions for development of original combinations of an-
in method with less hazardous and greener ones without tihypertensive agents, their analysis and standardization
disrupting method performance. The method was subjec- (0120U104201 (№509 date 24.02.2020)).
ted to greenness profile assessment.
References
Alnajjar AO (2011) Validation of a capillary electrophoresis method for of Applied Pharmaceutics 10(1): 98–102. https://doi.org/10.22159/
the simultaneous determination of amlodipine besylate and valsartan ijap.2018v10i1.22805
in pharmaceuticals and human plasma. Journal of AOAC Interna- Logoyda L, Korobko D, Oleshchuk O, Proniv T, Dmutriv M (2018b) A
tional 94: 498–502. https://doi.org/10.1093/jaoac/94.2.498 HPLC MS/MS method development and validation for the simulta-
Gałuszka A, Migaszewski ZM, Konieczka P, Namieśnik J (2012) Ana- neous determination of bisoprolol and enalapril in the present of enal-
lytical Eco-Scale for assessing the greenness of analytical proce- aprilat in human plasma. International Journal of Applied Pharma-
dures. TrAC Trends in Analytical Chemistry 37: 61–72. https://doi. ceutics 10(2): 31–40. https://doi.org/10.22159/ijap.2018v10i2.23195
org/10.1016/j.trac.2012.03.013 Logoyda L (2018c) A HPLC-MS/MS method development and valida-
Gonzaleza O, Iriarte G, Rico E, Ferreiros N, Maguregui MI, Alonso RM, tion for the simultaneous determination of nifedipine and enalapril
Jimenez RM (2010) LC–MS/MS method for the determination of in human plasma. International Journal of Applied Pharmaceutics
several drugs used in combined cardiovascular therapy in human 10(4): 35–42. https://doi.org/10.22159/ijap.2018v10i4.24528
plasma. Journal of Chromatography B 878:2685–2692. https://doi. Logoyda L (2018d) Bioanalytical method development and validation
org/10.1016/j.jchromb.2010.07.026 from the simultaneous determination of verapamil and enalapril in
Guideline Q2(R1) (2005) Validation of Analytical Procedure: methodol- the present of enalaprilat by HPLC MS/MS. International Journal
ogy, International Conference on Harmonisation. http://www.ich.org of Applied Pharmaceutics 10(3): 19–27. https://doi.org/10.22159/
Gupta KR, Wadodkar AR, Wadodkar SG (2010) UV-Spectrophotomet- ijap.2018v10i4.24528
ric methods for estimation of valsartan in bulk and tablet dosage Kondratova Y, Logoyda L, Voloshko Y, Abdel-Megied A, Korobko D,
form. International Journal of ChemTechResearch 2: 985–989. http:// Soroka Y (2017) Development and validation of HPLC-DAD meth-
sphinxsai.com/s_v2_n2/CT_V.2No.2/ChemTech_Vol_2No.2_pdf/ od for the determination of bisoprolol in tablet dosage forms. Inter-
CT=37%20(985–989).pdf national Journal of Applied Pharmaceutics 9(6): 54–59. https://doi.
Hillaert S, Bossche W (2002) Optimization and validation of a capil- org/10.22159/ijap.2017v9i6.21616
lary zone electrophoretic method for the analysis of several angio- Liliya L, Dmytro K, Olena S, Ihor B, Tamara K (2016) Development of
tensin-II-receptor antagonists. Journal of Chromatography A 979: Methodology for Identification of Captopril in Medicines. Asian
323–333. https://doi.org/10.1016/S0021-9673(02)01247-5 Journal of Pharmaceutics 10(3): 168–171. https://www.asiapharma-
Korany MA, Mahgoub H, Haggag RS, Ragab MAA, Elmallah OA (2017) ceutics.info/index.php/ajp/article/view/723\
Green chemistry: Analytical and chromatography. Journal of Liquid Logoyda L (2019a) Efficient validated method of HPLC to determine
Chromatography & Related Technologies 40: 839–852. https://doi.or enalapril in combinated dosage form containing enalapril and bi-
g/10.1080/10826076.2017.1373672 soprolol and in vitro dissolution studies. International Journal of
Kul D, Dogan-Topal B, Kutucu T, Uslu B, Ozkan SA (2010) High-perfor- Applied Pharmaceutics 11(4): 19–24. https://doi.org/10.22159/
mance liquid chromatographic and first derivative of the ratio spec- ijap.2019v11i4.32584
trophotometric determination of amlodipine and valsartan in their Logoyda L (2019b) Analysis of approaches to the development and vali-
binary mixtures. Journal of AOAC International 93(3): 882–890. dation of the methods of analysis of some active pharmaceutical in-
https://doi.org/10.1093/jaoac/93.3.882 gredients from the group of angiotensin converting enzyme inhibitors
Logoyda L (2018a) Bioanalytical method development and validation in drugs and biological liquids. International Journal of Applied Phar-
from the simultaneous determination of verapamil and enalapril in maceutics 11(4): 1–7. https://doi.org/10.22159/ijap.2019v11i4.32420
the present of enalaprilat by HPLC MS/MS. International Journal Raju VB, Rao AL (2011) Reversed phase HPLC analysis of valsartan in
of Applied Pharmaceutics 10(3): 19–27. https://doi.org/10.22159/ pharmaceutical dosage forms. IjCEPr 2: 56–60. https://www.yum-
ijap.2018v10i4.24528 pu.com/en/document/view/37080847/reversed-phase-hplc-analy-
Logoyda L (2018b) A HPLC-MS/MS method development and valida- sis-of-valsartan-in-pharmaceutical-
tion for the simultaneous determination of nifedipine and enalapril Rao RN, Bompelli S, Maurya PK (2011) High-performance liquid chro-
in human plasma. International Journal of Applied Pharmaceutics matographic determination of anti- hypertensive drugs on dried
10(4): 35–42. https://doi.org/10.22159/ijap.2018v10i4.24528 blood spots using a fluorescence detector-method development and
Logoyda L, Abdel-Megied AM, Kondratova Y, Trofimenko O, Korobko validation. Biomedical Chromatography 25: 1252–1259. https://doi.
D, Dakhym I (2018a) Development and validation of HPLC method org/10.1002/bmc.1599
for the simultaneous determination of enalapril maleate in present of Priyanka RP, Sachin UR, Dhabale PN, Burade KB (2009) Simultaneous
their impurities: application to tablet analysis. International Journal UV Spectrophotometric Method for Estimation of Losartan Potssi-Pharmacia 68(1): 43–51 51
um and Amlodipine Besylate in Tablet Dosage Form. Asian Journal Q1A (R2) (2003) Feb ICH Harmonized Tripartite Guideline. Geneva.
of Research in Chemistry 2(1): 183–187. Q2A (1994) Oct ICH Harmonized Tripartite Guideline. Geneva.
Shah HJ, Kataria NB, Subbaiah G, Patel CN (2009) Simultaneous LC– Q2B (1996) Nov ICH Harmonized Tripartite Guideline. Geneva.
MS–MS analysis of valsartan and hydrochlorothiazide in human
plasma. Chromatographia 69: 1055–1060. https://doi.org/10.1365/
s10337-009-0950-1 Supplementary material 1
Tatar S, Saglık S (2002) Comparison of UV- and second derivative-spec-
trophotometric and LC methods for the determination of valsar-
Supplementary data
tan in pharmaceutical formulation. Journal of Pharmaceutical and Authors: Kateryna Peleshok, Marjan Piponski, Liliya Logoyda,
Biomedical Analysis 30: 371–375. https://doi.org/10.1016/S0731- Olha Poliak, Nadiya Zarivna
7085(02)00360-6 Data type: data
Goswami A, Jiang JQ (2018) Simultaneous quantification of gabapen- Copyright notice: This dataset is made available under the Open
tin, sulfamethoxazole, terbutryn, terbuthylazine and diuron by uv- Database License (http://opendatacommons.org/licenses/
vis spectrophotometer. Biointerface Research in Applied Chemistry odbl/1.0). The Open Database License (ODbL) is a license
8: 3111–3117. https://researchonline.gcu.ac.uk/ws/portalfiles/por- agreement intended to allow users to freely share, modify,
tal/25829805/2018_BRAC_V8_1_pp3111_17.pdf and use this Dataset while maintaining this same freedom
Karamad D, Khosravi-Darani K, Hosseini H, Tavasoli S (2019) Ana- for others, provided that the original source and author(s)
lytical procedures and methods validation for oxalate content esti- are credited.
mation. Biointerface Research in Applied Chemistry 9: 4305–4310. Link: https://doi.org/10.3897/PlantSociology.68.53631.suppl1
https://doi.org/10.33263/BRIAC95.305310You can also read