Service Life Estimation for Photovoltaic Modules - 2021 Task 13 Performance, Operation and Reliability of Photovoltaic Systems - Topics
←
→
Page content transcription
If your browser does not render page correctly, please read the page content below
Task 13 Performance, Operation and Reliability of Photovoltaic Systems

 Service Life Estimation
PVPS

 for Photovoltaic
 Modules
 2021

 Report IEA-PVPS T13-16:2021
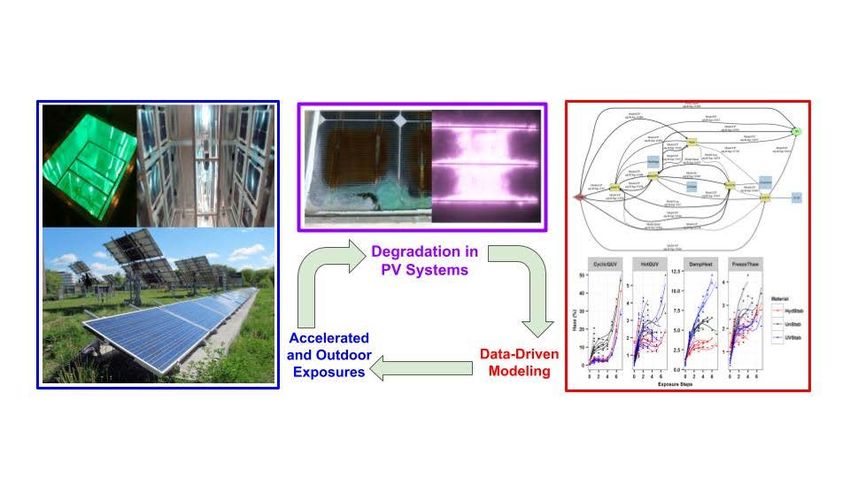
Task 13 Performance, Operation and Reliability of Photovoltaic Systems – Service Life Estimation for Photovoltaic Modules

What is IEA PVPS TCP?
The International Energy Agency (IEA), founded in 1974, is an autonomous body within the framework of the Organization for Economic
Cooperation and Development (OECD). The Technology Collaboration Programme (TCP) was created with a belief that the future of ener-
gy security and sustainability starts with global collaboration. The programme is made up of 6.000 experts across government, academia,
and industry dedicated to advancing common research and the application of specific energy technologies.

The IEA Photovoltaic Power Systems Programme (IEA PVPS) is one of the TCP’s within the IEA and was established in 1993. The mission
of the programme is to “enhance the international collaborative efforts which facilitate the role of photovoltaic solar energy as a cornerstone
in the transition to sustainable energy systems.” In order to achieve this, the Programme’s participants have undertaken a variety of joint
research projects in PV power systems applications. The overall programme is headed by an Executive Committee, comprised of one
delegate from each country or organisation member, which designates distinct ‘Tasks,’ that may be research projects or activity areas.

The IEA PVPS participating countries are Australia, Austria, Belgium, Canada, Chile, China, Denmark, Finland, France, Germany, Israel,
Italy, Japan, Korea, Malaysia, Mexico, Morocco, the Netherlands, Norway, Portugal, South Africa, Spain, Sweden, Switzerland, Thailand,
Turkey, and the United States of America. The European Commission, Solar Power Europe, the Smart Electric Power Alliance (SEPA), the
Solar Energy Industries Association and the Cop- per Alliance are also members.

Visit us at: www.iea-pvps.org

What is IEA PVPS Task 13?
Within the framework of IEA PVPS, Task 13 aims to provide support to market actors working to improve the operation, the reliability and
the quality of PV components and systems. Operational data from PV systems in different climate zones compiled within the project will
help provide the basis for estimates of the current situation regarding PV reliability and performance.

The general setting of Task 13 provides a common platform to summarize and report on technical aspects affecting the quality, perfor-
mance, reliability and lifetime of PV systems in a wide variety of environments and applications. By working together across national
boundaries we can all take advantage of research and experience from each member country and combine and integrate this knowledge
into valuable summaries of best practices and methods for ensuring PV systems perform at their optimum and continue to provide competi-
tive return on investment.

Task 13 has so far managed to create the right framework for the calculations of various parameters that can give an indication of the
quality of PV components and systems. The framework is now there and can be used by the industry who has expressed appreciation
towards the results included in the high-quality reports.

The IEA PVPS countries participating in Task 13 are Australia, Austria, Belgium, Canada, Chile, China, Denmark, Finland, France, Germa-
ny, Israel, Italy, Japan, the Netherlands, Norway, Spain, Sweden, Switzerland, Thailand, and the United States of America.

 DISCLAIMER

 The IEA PVPS TCP is organised under the auspices of the International Energy Agency (IEA) but is functionally and legally autonomous. Views, findings and publica-
 tions of the IEA PVPS TCP do not necessarily represent the views or policies of the IEA Secretariat or its individual member countries.

 COVER PICTURE

 Range of activities involved in service life modelling. Source: CWRU, Cleveland / Roger French.

 ISBN 978-3-907281-05-5: Task 13 Report T13-16:2021
Task 13 Performance, Operation and Reliability of Photovoltaic Systems – Service Life Estimation for Photovoltaic Modules

 INTERNATIONAL ENERGY AGENCY
 PHOTOVOLTAIC POWER SYSTEMS PROGRAMME

 IEA PVPS Task 13
 Performance, Operation and
 Reliability of Photovoltaic Systems

 Service Life Estimation for Photovoltaic Modules

 Report IEA-PVPS T13-16:2021
 June 2021

 ISBN 978-3-907281-05-5
Task 13 Performance, Operation and Reliability of Photovoltaic Systems – Service Life Estimation for Photovoltaic Modules

AUTHORS

Main Authors
 Karl-Anders Weiß, Fraunhofer ISE, Freiburg, Germany
 Laura S. Bruckman, CWRU, Cleveland, USA
 Roger H. French, CWRU, Cleveland, USA
 Gernot Oreski, PCCL, Leoben, Austria
 Tadanori Tanahashi, AIST, Koriyama, Japan
Contributing Authors
 Julián Ascéncio-Vásquez, 3E, Brussels, Belgium
 Luis F. Castillion-Gandara, PCCL, Leoben, Austria
 Gabriele Eder, OFI, Vienna, Austria
 Nikola Hrelja, EDF, Moret Loing et Orvanne, France
 Mike van Iseghem, EDF, Moret Loing et Orvanne, France
 Ismail Kaaya, Fraunhofer ISE, Freiburg, Germany
 Sascha Lindig, EURAC Research, Bolzano, Italy
 JiQi Liu, CWRU, Cleveland, USA
 Stefan Mitterhofer, University of Ljubljana, Ljubljana, Slovenia
 Lukas Neumaier, SAL Silicon Austria Labs, Villach, Austria
 Kunal Rath, CWRU, Cleveland, USA
 Sameera Nalin Venkat, CWRU, Cleveland, USA
 Raymond J. Wieser, CWRU, Cleveland, USA
Editors
 Ulrike Jahn, VDE Renewables GmbH, Alzenau, Germany
 Karl-Anders Weiß, Fraunhofer ISE, Freiburg, Germany

4
Task 13 Performance, Operation and Reliability of Photovoltaic Systems – Service Life Estimation for Photovoltaic Modules

TABLE OF CONTENTS

Acknowledgements .................................................................................................................. 6
List of Abbreviations ................................................................................................................. 7
Executive Summary ............................................................................................................... 11
 Introduction...................................................................................................................... 13
 1.1 Purpose .................................................................................................................. 13
 1.2 Overview / State of the Art ..................................................................................... 13
 Terms and Definitions ..................................................................................................... 15
 2.1 Service Life Prediction ........................................................................................... 19
 2.2 Definition of End-of-Life.......................................................................................... 19
 Climatic Stressors ........................................................................................................... 21
 3.1 Introduction to Climatic Stressors .......................................................................... 21
 3.2 Macroclimatic Loads .............................................................................................. 21
 3.3 Conditions in Accelerated Testing.......................................................................... 24
 3.4 Microclimatic Loads for Modules ............................................................................ 27
 Modelling Approaches ..................................................................................................... 35
 4.1 Issues in Empirical Modelling: Bias versus Variance Trade-Off ............................. 35
 4.2 Degradation Models of PV Module Materials, Components and Specific
 Degradation Modes ................................................................................................ 37
 4.3 Photovoltaic Performance Models ......................................................................... 52
 Conclusion....................................................................................................................... 65
References ............................................................................................................................. 67

 5
Task 13 Performance, Operation and Reliability of Photovoltaic Systems – Service Life Estimation for Photovoltaic Modules

ACKNOWLEDGEMENTS

This report received valuable contributions from several IEA-PVPS Task 13 members and
other international experts. A special thanks goes to Ms. Bianca Krumm from Fraunhofer ISE
for organizing and coordinating all contributors and their contributions as well as for thor-
oughly editing the report.

The authors would like to thank Laura Bruckman and Werner Herrmann for reviewing this
report.

Case Western Reserve University’s work on this report was supported by the U.S. Depart-
ment of Energy’s Office of Energy Efficiency and Renewable Energy (EERE) under Solar
Energy Technologies Office (SETO) Agreement Number DE-EE-0008550.

This report is supported by the German Federal Ministry for Economic Affairs and Energy
(BMWi) under contract no. 0324304A and 0324304B.

This report is supported by the Austrian Federal Government, represented by the Austrian
Research Promotion Agency (FFG) under contract no. 876736.

This report is also supported by The New Energy and Industrial Technology Development
Organization (NEDO), Japan, under contract #15100576-0.

This report has received funding from the European Union’s Horizon 2020 programme under
GA. No. 721452 – H2020-MSCA-ITN-2016.

6
Task 13 Performance, Operation and Reliability of Photovoltaic Systems – Service Life Estimation for Photovoltaic Modules

LIST OF ABBREVIATIONS

A Pre-Exponential Factor of the Arrhenius Equation
AAA Polymeric Backsheet Consisting of Three Layers of Polyamide
ABC Approximate Bayesian Computation
AC Alternating Currents
Ag Silver
AI-BSF Cell type
AIC Akaike Information Criterion
AH Tropical climate with high irradiation based on Köppen-Geiger-
 Photovoltaic climate zone scheme
AK Tropical climate with very high irradiation based on Köppen-Geiger-
 Photovoltaic climate zone scheme
ARIMA Autoregressive Integrated Moving Average
ASHRAE American Society of Heating, Refrigerating, and Air-Conditioning Engi-
 neers
ASTM American Society for Testing and Materials – US Standardization Organi-
 zation
B Desert climate based on Köppen-Geiger-Photovoltaic climate zone
 scheme
BWh Arid climate, desert climate, hot desert based on the Köppen-Geiger cli-
 mate zone scheme
β The Coefficients of Additive Models, e. g. Y = βo + β1 X1 + ε
BoM Bill of Materials
C Concentration
C-AST Combined-Accelerated Stress Test
CCC Cross Correlation Coefficient
CCSF Cross Correlation Scale Factor
CEC Commission of the European Communities
Cfa Temperate, Humid-Subtropical Köppen-Geiger Climate Zone
CS Climatic Stressors
CSD Classical Seasonal Decomposition
D Diffusion Coefficient
DH Damp Heat
DMT Derjaguim-Muller-Toporov Model
EL Electroluminescence
ε The error term of an Additive Model
EPOA Insolation in Plane of Array

 7
Task 13 Performance, Operation and Reliability of Photovoltaic Systems – Service Life Estimation for Photovoltaic Modules

ESTI European Solar Test Installation
ERA5 Copernicus Climate Change Service ERA5 Dataset
EVA Ethylene-Vinyl Acetate
FEM Finite Element Method
FF Fill Factor
FTIR Fourier Transform Infrared
H2 Dihydrogen
H2O Water
HVAC Heating, Ventilation, Air Conditioning
HW Holt-Winters statistical method
HY’s Model Hsueh and Yanaka Model
IEA International Energy Agency
IEC International Electrotechnical Commission
IR Infrared
Isc Short-Circuit Current
I-V Current-Voltage
JPL Jet Propulsion Laboratory
KG Köppen-Geiger climate zone scheme
KRoss Ross Coefficient
KGPV Köppen-Geiger Photovoltaic climate zone scheme
L&DS Lifetime and Degradation Science
LID Light-Induced Degradation
LSCM Laser Scanning Confocal Microscopy
MC Monte-Carlo
MD Molecular Dynamics
MS-PL Multi-Step Performance Losses
Mpp Maximum Power Point
µ The mean of a population
N Nitrogen
Na Sodium
NaOH Sodium Hydroxide
Na2SiO3 Sodium Metasilicate
nA Nanoampere
netSEM Network Structural Equation Modelling
NIR Near-Infrared
NREL US National Renewable Energy Laboratory
O Oxygen
P(t) Power as function of time

8
Task 13 Performance, Operation and Reliability of Photovoltaic Systems – Service Life Estimation for Photovoltaic Modules

P (Pa) Partial Water Vapour Pressure
PA Polyamide
PCA Principal Component Analysis
PCritical Minimum Required Functional Property Level
PDCZ Photovoltaic Degradation Climate Zones
PERC Cell Type
PET Poly-Ethylene Terephthalate
PID Potential Induced Degradation
PL Photoluminescence
PLR Performance Loss Rate
Pmax Maximum Generating Power
Pmpp MPP-Power
PR Performance Ratio
PRtc Temperature-Corrected Performance Ratio
PV Photovoltaic(s)
PVLIB PVlib, a Python Package of functions for PV calculations
PVM Photovoltaic Module
R&D Research and Development
RD Reaction-Diffusion
RH Relative Humidity
Riso Isolation Resistance
RMSE Root Means Square Error
Rs Series Resistance
Rsh Shunt Resistance
S Solubility of Water
Si Silicon
SixNy Silicon Nitride
SLP Service Life Prediction
STC Standard Test Conditions
STL Seasonal and Trend Decomposition using LOESS
t Time
T Temperature
Tamb Ambient Temperature
TC Thermal Cycling
TCO Transparent-Conductive Oxide
TGA Thermogravimetric Analysis
Tmod Module Temperature
TPO Thermoplastic Polyolefin

 9
Task 13 Performance, Operation and Reliability of Photovoltaic Systems – Service Life Estimation for Photovoltaic Modules

Vmpp MPP-Voltage
UV Ultraviolet
V Voltage
VIS Visual
Voc Open-Circuit Voltage
WS Wind Speed
WVP Water Vapour Pressure
WVTR Water Vapour Transmission Rate
XCT X-Ray Computed Tomography
YDS Yearly Degradation Score
YI Yellowness Index

10
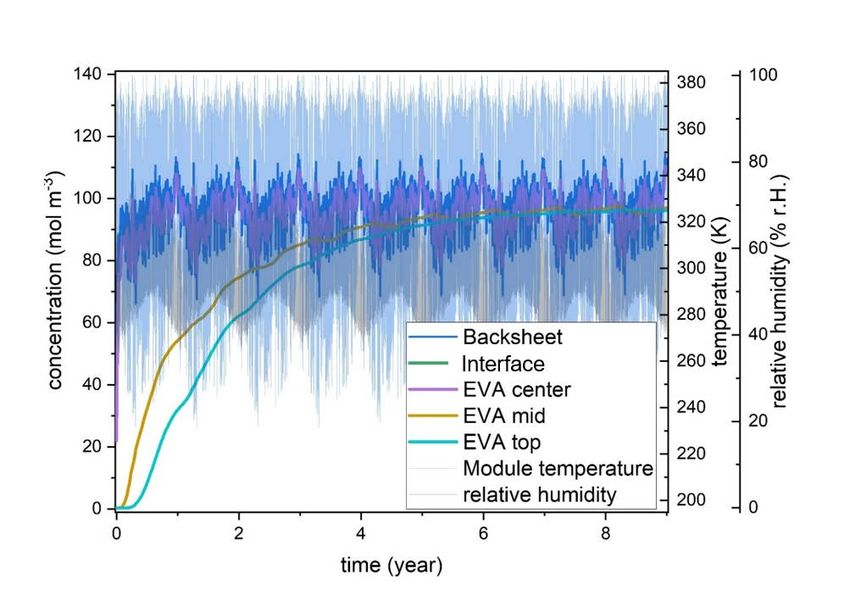
Task 13 Performance, Operation and Reliability of Photovoltaic Systems – Service Life Estimation for Photovoltaic Modules

EXECUTIVE SUMMARY

The economic success of photovoltaic (PV) power plants depends crucially on their lifetime
energy yield. Degradation effects and the total lifetime directly influence the produced elec-
tricity and therefore the cash flow, which also impacts the levelized costs of energy (LCOE)
and therefore the profitability of the power plant. In most cases, the lifetimes and degradation
rates that are used to estimate the system performance are not system-specific but are
based on average values from the evaluations of older systems or data sheets. So, these
values unfortunately have no direct correlation with the specific components of the specific
PV system, nor the operational and climatic conditions at the specific location. Also, the
mathematical models used for calculating the expected power output typically expect linear
degradation rates which are not in line with real degradation processes found in the field,
which are typically non-linear.
This report gives an overview on empirical degradation modelling and service life prediction
of PV modules since they are the major components of PV systems that are subject to the
effects of degradation. For other components no comparable scientific data is available. The
structure of the document addresses different stakeholders with different backgrounds.
Chapter 1 begins with a short introduction including a condensed overview of the state of the
art.
Chapter 2 follows with the definition of relevant terms and definitions. Since especially in dis-
cussions on lifetime and degradation different terms are not used coherently in industry or
science, the authors try to improve the situation with this dedicated glossary. In addition, the
extremely relevant term “end-of-life” is discussed with different definitions, depending on the
point of view and perspective of the user and the typical factors impacting the PV module or
PV system. For this “end-of-life” term, no definition which is generally applicable in all situa-
tions can be given. Since the definition is crucial for the calculated service life, yield, and all
related parameters, through to LCOE it is important to be aware of this when evaluating
power plants and PV investments.
Climatic factors play a major role in degradation and are by nature location specific. It is pre-
condition for the creation of meaningful service life prediction or degradation data to know
about the relevant (climatic) stressors. Therefore Chapter 3 introduces the different relevant
climatic stressors as well as classification schemes and methodologies to handle and ana-
lyse them. The chapter also describes differences and relations of the so called macro-
climatic stressors, describing the climatic conditions in the ambience of the modules, and the
situation at material level, the so called micro-climatic stressors. The latter describes the rel-
evant parameters for degradation processes and so also the mathematical models address-
ing module degradation and service life prediction. The ambient macro-climatic conditions at
specific locations can be estimated using data for the climatic regions or adapted climatic
maps and so be classified using climatic classification schemes which exist also specified for
PV purpose like e.g. the Köppen-Geiger PV scheme. For the determination of microclimatic
loads - which are typically input parameters for degradation models, further calculations are
necessary. The report presents possible ways to determine the necessary data for the most
important micro-climatic parameters which are temperature and humidity. This data is also
very important for the definition of accelerated tests, which can deliver module specific pa-
rameters for the service life and degradation prediction. Chapter 3 also describes basic ac-

 11
Task 13 Performance, Operation and Reliability of Photovoltaic Systems – Service Life Estimation for Photovoltaic Modules

celerated ageing tests, as described in the respective IEC standards, and how they can sup-
port degradation and service life prediction and modelling as well as their limitations.
Chapter 4 addresses general degradation and service-life modelling approaches including
related issues. It starts in section 4.1 with general issues of empirical modelling one has to
be aware of when working on mathematical modelling solutions for service life and degrada-
tion prediction and interpreting results. There are very different approaches for empirical
modelling of the lifetime performance prediction and service life of products such as PV
modules empirical statistical modelling, and empirical physical modelling. Physical empirical
models are those that utilize analytic or numerical forms to represent the fundamental phys-
ics and chemistry of the phenomena. Statistical models, often referred to as data driven
models, use mathematical forms which are able to fit the (measured) data without direct rela-
tion to physical or chemical processes. Both approaches use empirical (measured) data to
determinate parameters which can be used for predicting future behaviour.
Section 4.2 introduces on one hand models for specific degradation modes or phenomena of
modules (e.g., backsheet or cell cracking or electrochemical corrosion). On the other hand,
modelling approaches for degradation effects of components and materials are presented. A
special focus is here on degradation of polymeric materials since these materials are known
to be sensitive to degradation effects causes by typical climatic stressors like high tempera-
ture, humidity and UV radiation. The modelling approaches using predictive models and in-
ferential mechanistic models are presented using polyethyleneterephtalate (PET) degrada-
tion as catchable example. It is shown that different modelling approaches are necessary to
describe all degradation effects. Weak points of modules can be identified and focussed op-
timization of products can be supported.
Performance degradation models are addressed in Section 4.3 which are the core models for
the prediction of degradation of modules over time for specific types and locations. Com-
bined with defined end-of-life conditions, these models can be used for service life prediction.
Different approaches which have been specifically developed for PV modules are presented.
Starting with an approach focusing on physical and chemical processes and the specific ap-
plication. An approach to develop performance loss rate (PLR) models following the statisti-
cal methodology is presented as well including the processes to determine the relevant pa-
rameters from field data.
The modelling approaches are presented including the methodological approach to the prob-
lem the used input data, and parameters related to specific module types or local climatic
conditions, down to calculations of degradation rates over time or remaining useful lifetime
(RUL) or total expected lifetime.
The latest scientific work shows that service lifetime and degradation models for PV modules
are of specific use if they combine different modelling approaches and include know-how and
modelling parameters of the most relevant degradation effects. Such models can differentiate
between the behaviour of different module types and to include the situation at different ser-
vice locations. For some modules, it is also necessary to use multi-step modelling approach-
es to enable meaningful results.
Advanced approaches of data analysis and modelling also enable the determination of deg-
radation signatures which can be related to specific degradation effects. This approach is
expected to be very helpful in future work to identify failures based on operational data.
Since uncertainties of input parameters can have significant impact on the results but are
often not totally avoidable, these topics are addressed in Chapter 4.3.

12
Task 13 Performance, Operation and Reliability of Photovoltaic Systems – Service Life Estimation for Photovoltaic Modules

 INTRODUCTION

The economic success and environmental impact of PV power plants depends crucially on
the degradation and service life of the PV modules and other components of the PV power
plants. The behaviour of PV modules is especially relevant since they typically show gradual
degradation effects over time. The useful service lifetime and degradation of PV modules
directly influences the lifetime yield of electricity, and therefore, the levelized cost of the elec-
tricity (LCOE) produced [1]. Degradation and service life are influenced not only by the mate-
rials used and the quality of module manufacturing, but also by local environmental effects
that dictate the exposure conditions of the PV modules. Therefore, the lifetime and degrada-
tion of PV modules cannot be determined easily and are not valid for all locations and appli-
cations. Since both are dependent on local and operational conditions, the prediction of ser-
vice lifetime from PV module degradation rates must be taken into consideration all of these
factors and incorporate them into mathematical models.

 Purpose
The report introduces the influencing factors for service life and degradation of PV modules
and components as well as the modelling of degradation effects and service life prediction. It
describes relevant stresses and load effects in section 3 and different modelling approaches,
as well as models which have shown to fulfil the requirements of PV stakeholders in section
4. The descriptions are written in a way to address the needs of readers from all stakeholder
groups, so on one hand people with no background in mathematical modelling who are inter-
ested in the influencing factors, potential of service life prediction, and interpretation of given
data, as well as experts in reliability and degradation modelling. The chapters therefore brief-
ly describe the approaches and background as well as examples and list relevant literature
for further reading.

 Overview / State of the Art
The increasing deployment of PV worldwide is a clear indication that PV will play a big role in
the worldwide energy mix. This increasing trend in the inclusion of PV is exciting, but also
comes with several challenges. They include the following: reliability issues, reliable integra-
tion of PV power in electrical grids, end-of-life issues (how to deal with out of service PV
modules or PV components), and many others. To address these issues, two main ap-
proaches are being used: 1) experimental investigations and 2) mathematical modelling.
In the experimental approach, usually different testing conditions are applied according to
established standards to accelerate the ageing of PV modules. According to the applied con-
ditions, different degradation modes can be induced and through different characterization
techniques the physical/chemical kinetics of the induced modes can be understood. This
understanding helps the manufacturers to improve the different PV materials and compo-
nents and hence the reliability of PV modules. The understanding also helps to develop deg-
radation rate models used in lifetime estimations. Although this area is highly studied by dif-
ferent research groups, it is also among the still challenging topics in the field. This is be-
cause the current standardized testing procedures are designed to induce specific degrada-
tion mechanisms that cannot directly be used to evaluate the reliability of PV modules in real-
world operations [2].This challenge is well known, and some research groups are designing

 13
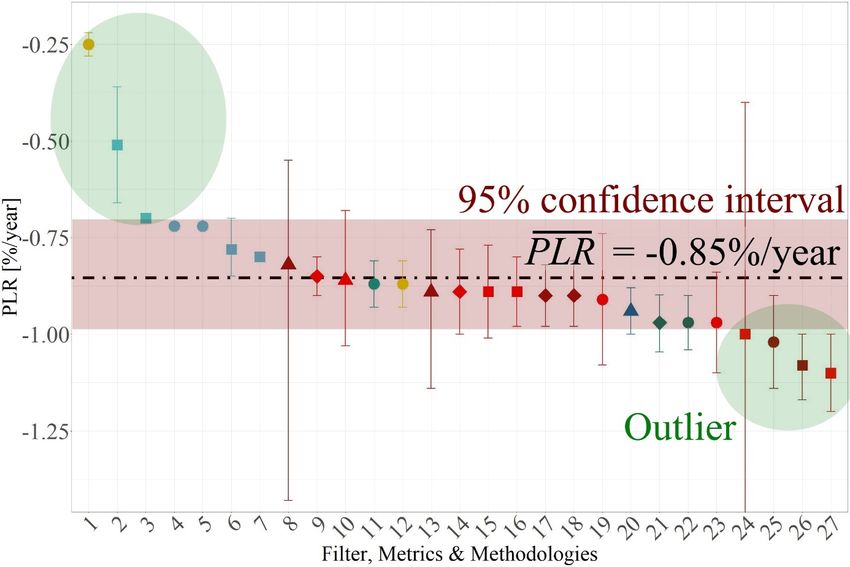
Task 13 Performance, Operation and Reliability of Photovoltaic Systems – Service Life Estimation for Photovoltaic Modules

testing procedures that can induce several degradation mechanisms using more combined
stress conditions [3]–[5].
To evaluate and predict the service lifetime of PV modules in real-world operating conditions,
mathematical approaches are usually utilized [2], [6], [7]. Physical and statistical methods
have been commonly used and recently machine learning approaches are being applied.
The basic concept of mathematical approaches is to extract the degradation rates from his-
torical PV performance or climatic data and use the extracted degradation rates to extrapo-
late the performance until the PV module “lifetime”. Indeed, it is also crucial to understand
how the lifetime is defined in the PV performance context. Excluding catastrophic events
(such as fire) it is unlikely that a PV module drops its power generation to zero. However,
even though a PV module is still generating power, its power output might be too low to be
economically viable to continue its operation. Therefore, for economic viability of PV projects,
most PV module manufacturers guarantee a power reduction of less than 20%, referenced at
standard test conditions (STC), modules tested under 25°C temperatures, 1000 W/m2, irradi-
ance, and air mass 1.5, within 25-30 years of operation. Therefore, in the manufacturers’
context, the lifetime of a PV module is often defined as the time required for a PV module to
lose its initial STC power by 20% (so-called degradation limit) [8].
For outdoor degradation evaluations, statistical methods are commonly used. Therefore, dif-
ferent statistical methods are available and are being proposed [9]–[11]. Although the meth-
ods are based on similar principals, that is, to determine the trends in the historical data, they
differ in their accuracy. In this report, the commonly used statistical methods as well as the
recently proposed methods are presented. The major drawback of statistical methods is the
lack of a direct correlation of the evaluated degradation rates to the climatic variables and
degradation processes. In this regard, physical models are utilized to capture these correla-
tions. Different physical models have been proposed for different degradation mechanisms
especially for indoor applications [9]. For outdoor degradation rate evaluation, little has been
done in this direction with only a few authors that proposed physical models limited to the
dominating stressors (temperature, UV irradiance, relative humidity, and temperature cycling)
[6], [7]. Although these models can provide a representation of combined outdoor effects,
more generalized models that considers all the influencing factors (including additional or
specific stressors, e.g., corrosive salt mist) in addition to the so-called dominating factors are
still needed. Such models will provide a good estimation of the degradation rates under dif-
ferent operating conditions. Additionally, most physical models are proposed based on the
assumption that the degradation kinetics follow an Arrhenius temperature dependence. Due
to the different degradation mechanisms, it is unlikely that all the mechanisms obey the Ar-
rhenius temperature behaviour; therefore, an investigation of which degradation mechanisms
follow the Arrhenius law and which ones do not can help to improve the accuracy of the deg-
radation rate models.
For lifetime prediction, usually a linear approximation with a constant degradation rate is
used. Although this can be a sufficient approximation depending on the performance degra-
dation trend, it is not usually applicable and can lead to increased uncertainty in lifetime pre-
dictions. In this regard, different authors have recently investigated and proposed models for
the non-linearity in performance degradations [12], [13]. Such studies will aid to improve the
accuracy and reliability of service lifetime predictions [14].

14
Task 13 Performance, Operation and Reliability of Photovoltaic Systems – Service Life Estimation for Photovoltaic Modules

 TERMS AND DEFINITIONS

Since some relevant terminologies for the topic of the report have no standard definitions or
are usually interchangeably used, in Table 1, the definitions of the different terms are pre-
sented as used in this report.
Table 1: Definitions of terms as used in this report.

Term Definition
Acceleration Increased rate of degradation in respect to a shorter time frame than i real-
 world conditions (definition for this report).
Acceleration Multiplier indicating the factor by which the degradation rate is increased. An
Factor acceleration factor is defined for a specific degradation mechanism in a
 specific material under a specific exposure condition. Otherwise accelera-
 tion factors tend to be crude approximations or inaccurate or incorrect.
Back sheet Polymeric multi-layer foil; outermost sheet of the PV module on the rear-
 side. It is designed to protect the photovoltaic cells and electrical compo-
 nents from external stressors and to act as electric insulator. The back sheet
 typically consists of a multi-layer polymer laminate (or co-extrudate) that has
 high dielectric properties.
Climate The average weather in a given area over a longer period of time. A descrip-
 tion of a climate includes information on, e.g. the average temperature and
 humidity in different seasons, precipitation, wind, and sunshine/irradiation. A
 description of the (chance of) extremes is often included.
Climate Zone Areas with distinct climates, can be classified using different climatic param-
 eters. Climate classifications are the basis for detailed geozonal models of
 climate zones. The most popular classification scheme is the Köppen-
 Geiger climate classification scheme [15], but other classifications more
 specific to PV were developed (including the relevant correlation between
 climatic stressors and effects on PV).
Concentration In chemistry: the amount of a substance in a defined volume or mass. As a
 ratio, the mass ratios (mass concentration) or the volume ratios (volume
 concentration) can be used.
Corrosion The reaction of a material with its environment, which causes a measurable
 change in the material. Corrosion can impair the function of a component or
 system. An irreversible interfacial chemical reaction of a material with can
 result in consumption or in dissolution into the material.
Degradation / The gradual process of change in characteristics with operational time of a
Ageing material/component/system triggered by stress impact. Typically for PV this
 aging process causes a decrease in performance (power loss).
Degradation A parameter that quantifies the magnitude of a PV module power decay of
Rate its initial maximum output power.
Effects Reactions, alterations, or changes of state, due to causes. Here typically
 due to the impact of stressors.

 15
Task 13 Performance, Operation and Reliability of Photovoltaic Systems – Service Life Estimation for Photovoltaic Modules

Encapsulation Polymeric film embedding the solar cells and electrical circuits to prevent
 mechanical damage to the solar cells and to prevent water, water vapour
 or oxygen ingress to the electrical contacts.
Evaluations The experimental measurements to be made at each exposure step in a
 study.
Exposure The exposure conditions to be used in a study, include the specific stress-
 ors and stressor levels, and the times of each exposure step, between the
 experimental evaluations.
Homogeneous Uniform materials; consisting of one substance in one defined state.
Material
Homogeneous Same mechanical load applied to all parts / sections of a material, compo-
Load nent, or system.
Homogeneous Same stressor level of a stressor applied to all parts / sections of a materi-
Stressor Level al, component, or system.
Hotspot Localized heating of a PV module due to a) reverse biasing and junction
 breakdown of a solar cell, b) at a solder bond due to increase of contact
 resistance or fatigue, c) at contact points of separated parts of a cell.
Lifetime Period of Usability of a Product.
Load The stressor level for an applied mechanical stress as a load on a material
 / component / system.
Macroclimate The general stressors (e.g., temperature, irradiance, humidity, rainfall) that
 a PV module is operating under which are often defined by climate zones
 (e.g., Köppen-Geiger).
 The sum of the general environmental and climatic stressors (e.g., tem-
 perature, irradiance, humidity, precipitation) at a location of interest; often
 given by the climate zone. For the report: describing the climatic conditions
 around the PV module.
Mass Transfer Net movement of mass from one location, usually meaning stream, phase,
 fraction, or component, to another. Mass transfer occurs in many process-
 es, such as absorption, evaporation, condensation, drying, precipitation,
 distillation or induced by concentration gradients of a given substance. For
 PV modules, especially moisture and oxygen ingress is of relevance [16].
Material Water contained in a water absorbing material can be relative or an abso-
Moisture lute value.
Microclimate The local stressors that a PV module is operating under that are specific to
 its exact location (e.g., albedo, stress induced from mounting, variations in
 temperature, irradiance due to location in a PV field).
 The sum of the local stressors that an object, e.g. a PV module experienc-
 es during operation; is specific to its exact location and surrounding (e.g.,
 albedo, stress induced from mounting, variations in temperature, irradi-
 ance due to location in a PV field) and design. The microclimate can be
 inhomogeneous even within a PV module (different humidity or cell tem-
 perature).

16
Task 13 Performance, Operation and Reliability of Photovoltaic Systems – Service Life Estimation for Photovoltaic Modules

Performance A parameter which assesses the performance evolution of a PV module or
Loss Rate PV system based on a performance metric (e.g., electrical, or empirical
 metrics) [17].
Performance A measure of the quality of a PV module, expressed as the ratio of the
Ratio actual and theoretical PV module energy outputs [18].
Relative The amount of water vapour present in air expressed as a percentage of
Humidity the amount needed for saturation at the same temperature.
Reliability Probability that a product, system, or service will perform its intended func-
 tion adequately for a specified period of time or will operate in a defined
 environment without failure.
 PV Materials/Components/Systems, reliability means the probability that
 the material/component/system will operate adequately for a specific envi-
 ronment and time without failure. This is related to the specifics of service
 life and end of life definitions.
Reliability A time dependent function that describes the evolution of PV modules
Model power with increasing operation period.
Service Life Period of use under operating conditions defined specifically for each
 module or installation. For PV modules, it can be often related to the ex-
 pected business plan.
 Life Cycle: Description of all stages of a product; The life-cycle stages of
 photovoltaics involve (1) the production of raw materials, (2) their pro-
 cessing and purification, (3) the manufacture of modules and balance of
 system (BOS) components, (4) the installation and use of the systems,
 and (5) their decommissioning and disposal or recycling.
 End of Life (EoL); Depends on many factors such as technology, opera-
 tional, and economical factors. In PV EoL is often related to warranty con-
 ditions (e.g., time required for a PV module to lose 20% of its initial STC
 power). For more details on the specifics see section 2.
Soiling The deposition of airborne particles, including, but not limited to, mineral
 dust (silica, metal oxides, salts), pollen, and soot. Soiling also includes
 snow, ice, frost, various kinds of industry pollution, sulfuric acid particu-
 lates, bird droppings, falling leaves, agricultural feed dust, and the growth
 of algae, moss, fungi, lichen, or biofilms of bacteria. In PV, soiling is meant
 to be the accumulation of material on light-collecting surfaces in solar
 power systems [19].
Stress Mechanical stress applied to a material / component / system from physi-
 cal loads.
Stressor Level Magnitude of a stressor applied to a material, component, module, or sys-
 tem. For example, if irradiance is the stressor, the level could be 0.5 suns.
 Stressor level x Time = stressor dose.
Stressor Physical, chemical, mechanical, or biological stress which is acting on a
 material/component/system. Examples include temperature, irradiation
 (UV, VIs, NIR), water/moisture, electrical potential as well as mechanical
 stresses such as compressive or tensile impact.

 17
Task 13 Performance, Operation and Reliability of Photovoltaic Systems – Service Life Estimation for Photovoltaic Modules

Study Protocol The complete definition of an experimental study, including definitions of
 the exposure conditions, the experimental evaluations used to characterize
 changes, the measurement plan for when the data of each evaluation will
 be acquired and analysed, and the results interpreted.
Thermal Thermal shock is caused by a type of rapid transient mechanical load. By
Shock definition it is a mechanical load caused by a rapid change of temperature.

18
Task 13 Performance, Operation and Reliability of Photovoltaic Systems – Service Life Estimation for Photovoltaic Modules

 Service Life Prediction
The methodology used to calculate the end-of-life of a product is called Service life prediction
(SLP) [20], [21]. This methodology involves predicting the life of PV modules through the
modelling of degradation as a function of impacting environmental and operational stressors
[20]. Such calculations require adapted mathematical models which are able to include all
relevant stressors and also specific parameters of the specific module type. So, the models
can be rather complex and often require a lot of (experimental) work to supply all relevant
data. Pickett [22] notes, "there is a fundamental difference between the SLP process and a
standard test protocol. Evaluating and qualifying materials for commercial applications re-
quires testing under standardized, agreed-upon conditions to generate pass/fail criteria. It is
engineering. The problem comes in the question of how those test results correlate to the
real world. SLP requires doing many experiments, constructing a model consistent with the
data, and making the prediction with a range of uncertainty. It is science."
Service life prediction as it is applied in the present report is modelling the development of
gradual degradation effects leading to a reduced functionality, in the case of PV modules, to
a reduced maximum output power. Catastrophic failures resulting for extreme events like
hailstorms, fire, human impacts etc cannot be included in such SLP models.
Pcritical is the minimum required functional property level that must be defined in quantifiable
terms to implement SLP, see definition of end-of-life below. These failure criteria can be se-
lected to examine different failure modes for different products. It is common to redefine the
critical value defining failure several times over the course of SLP experiments as one re-
ceives more insight into the system under study [20]. Each specific failure mode will generate
a SLP model that predicts the time-to-failure limited by that particular failure mode. When a
single SLP model is able to predict several types of failure within an experiment, this is evi-
dence that the different failure modes share the same degradation pathways.

 Definition of End-of-Life
Service Life calculation requires a clearly described status of the product which defines the
end-of-life. If a product reaches an unserviceable status the decision is clear but for PV-
modules this is a very rare case and if it occurs, it is usually linked to extreme impacts like
e.g. hailstorms or fire events. Such events are not included in the service life prediction ap-
proaches and models described in this report since they are not depending on intrinsic pro-
cesses in the modules and not following gradual changes. An overview of potential module
failures, influencing factors and effects can be found in a previous report of IEA PVPS Task
13 [23].
End-of-life is defined differently for PV modules, depending on the specific context or issue.
The end-of-life is typically dependent on the use of the PV module and the specific conditions
of the PV power plant. Current levelized costs of energy (LCOE) compared to replacing the
modules or the operation and maintenance costs of modules are often influencing factors.
The following chapters describe different terms and definitions related to the end of life of PV
modules as well as influencing parameters.
The International Electrotechnical Commission (IEC) defines accelerated testing procedures
by which to ensure a defined quality level of PV modules, summed up in so called “Type Ap-
proval Testing” standards such as the IEC 61215 series for terrestrial PV modules [24]. Un-
fortunately, these tests are linked in many people’s minds to specific service lifetimes or war-
ranty times but is has to be clearly mentioned that this is not the case. The standards have
been developed to identify specific weaknesses of modules and ensure a basic quality level

 19
Task 13 Performance, Operation and Reliability of Photovoltaic Systems – Service Life Estimation for Photovoltaic Modules

but do not address the issue of defined service lives. They especially do not differentiate be-
tween different climatic conditions where the modules will be operating in. These "Type Ap-
proval Tests" use four pass/fail criteria to determine if the module satisfies the requirements
of a particular testing standard: First, the measured module power output (Pmax) must not
degrade by more than 8% of the initial power before testing. Additionally, there should be no
open circuit or ground fault detected. There should be no evidence of major visual defects,
and finally, the insulation test requirements are met [25]. It has to be mentioned that the test
requirements have to be seen as minimum requirements and the tests are aimed to identify
early faults (infant mortality) or product series defects, so all these simple pass/fail criteria
are only defined to identify specific quality issues in these tests but cannot be interpreted as
end-of-life conditions. So, neither the tests nor the pass/fail criteria can be used to perform
service live prediction calculations and even more do not allow for a correlation of passing
the standardized tests with specific service lives at a specific location.

2.2.1 End of Functional Life
A more general description of the end of functional life is required for PV modules in the field.
The functionality of products degrades over time. This degradation is described by mathe-
matical models correlating influencing factors, in the case of PV modules typically environ-
mental and operational stressors, with a reduction of a selected property, for PV modules the
selected property is usually the module power. As described in section 2.1, the end of func-
tional life is reached when the critical property has fallen below a certain value. Then the
functional end of life is reached. From a purely technical viewpoint, the end of functional life
of a PV module is only reached when the module does not deliver any electricity at all or
electrical safety is not guaranteed anymore. This is from the practical viewpoint not reasona-
ble and therefore often much higher levels of the critical parameter are chose, which can be
influenced also by non-technical reasons (as warranty levels).

2.2.2 End of Economic Life
Depending on the economic situation of a specific PV system, the end-of-life can be reached
due to changing contractual conditions (e.g., changing electricity prices) or if it comes eco-
nomically attractive to replace PV modules by new ones with higher efficiency. In such cas-
es, the end-of-life can be reached at all stages of degradation, but usually the degradation is
influencing the decision since it influences performance and yield, see also description of end
of functional life. For optimizing these decisions, using appropriate degradation models which
can predict degradation is key.

20
Task 13 Performance, Operation and Reliability of Photovoltaic Systems – Service Life Estimation for Photovoltaic Modules

 CLIMATIC STRESSORS

3.1 Introduction to Climatic Stressors
Degradation of PV modules is controlled by the materials and components of the PV module,
and the stressors (irradiance, temperature, humidity) the module is exposed to in the local
climate zone. And these module and climate factors directly impact the service life of the PV
modules. The term “Climatic Stressors” sums up all stressors which are arise from the local
climate where the PV module is deployed.
Regarding service life and degradation estimation for technical products, one has to differen-
tiate between macroclimatic stressors and microclimatic stressors. Macroclimatic stressors
describe the macroscopic situation of the product, so more or less the conditions around the
product, defined by the weather conditions etc. Microclimatic loads describe the specific situ-
ation on the very specific piece of material of interest. So microclimatic conditions describe
the factors directly influencing degradation processes. Some of them are described by the
same physical values as the macroclimate, e.g. temperature and humidity, others are addi-
tional, like e.g. mechanical tension within a product. There is usually a strong dependency of
the microclimate on the macroclimate for PV modules since they operate in outdoor condition
and so e.g. high ambient temperatures and irradiation levels (macroclimate) also lead to high
temperatures of the module and high irradiation doses for the materials microclimate.
The chapter gives an overview on the different stressors, as well as on possibilities to deter-
mine and classify them and handle related uncertainties.

Figure 1: Schematic presentation of macroclimatic loads, e.g., irradiance, humidity,
temperature, snow, short-term temperature changes triggered by clouds, sand.

 Macroclimatic Loads
PV systems are operated under almost all kinds of extreme environmental conditions. For
example, PV modules in deserts experience high levels of solar radiation which are associ-
ated with high module temperature differences between day and night. PV modules in alpine
regions experience high mechanical loads from wind, ice, and heavy snow loads which place
particularly high demands on the stability of the multi-material composite PV module. In eve-
ry region, there is a very specific mix of climatic and environmental stressors. The influence
of these stressors on the performance and reliability of PV systems is often difficult to predict.
Synergistic effects between the stressors also occur such as moisture which can accelerate
degradation reactions or open new reaction paths. In addition, the combination of mechanical
loads and chemical stress can lead to drastic material degradation or failure.

 21
Task 13 Performance, Operation and Reliability of Photovoltaic Systems – Service Life Estimation for Photovoltaic Modules

3.2.1 Relevant Macroclimatic Stressors
The different factors of the ambient climatic conditions, the macroclimatic stressors, are im-
pacting on the module conditions (microclimate) and influence the degradation processes in
manifold ways. Some of the stressors can be directly linked to specific degradation process-
es, e. g. extreme snow loads to module breakage, others are linked to several or like in the
case of temperature to more or less all processes.
The most important macroclimatic stressors are listed below, subdivided into (i) influence
parameters determined by the climatic conditions and (ii) environmental influences on the
materials/composites.
Table 2: Relevant Macroclimatic Stressors.

Stressors Examples
Climate induced stressors
Temperature • Extreme values (often interrelated with high irradiance)
 • Influencing reaction rates of most chemical processes
 • Temperature cycles
 o short-term temperature changes triggered by
 clouds
 o day-night temperature differences
 o seasonal temperature fluctuations
Humidity • Humidity (can induce chemical reactions - hydrolytic
 degradation)
 • Dew (can induce chemical reactions such as hydrolytic
 degradation)
 • High Surface Conductivity
 • Precipitation (often interrelated with mechanical impact
 or thermal shock)
 o rain
 o snow
 o ice
 o hail
Solar irradiation • Ultraviolet (UV), Visible (can induce unwanted chemical
 reactions; C-C bond cleavage, photo-oxidative degra-
 dation)
 • IR (generates temperature increase and accelerates
 degradation reactions)

22
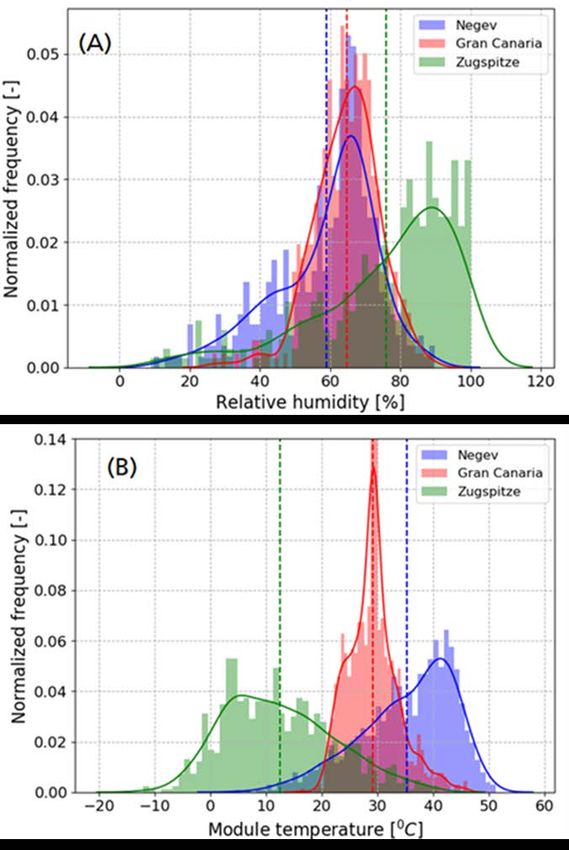
Task 13 Performance, Operation and Reliability of Photovoltaic Systems – Service Life Estimation for Photovoltaic Modules

Environmental stressors
soiling (mostly from natural local • bird droppings
sources) • aerosols, pollen
 • dust, sand
human pollution - pollutants gener- • chemical stressors
ated by local sources (industry,
 o acidic air pollutants (e.g., NOx, SOx)
heavy traffic, agriculture, …)
 o basic air pollutants (e.g., ammonia)
 o salt (e.g., road salt near the motorway)
 o oxygen
stress impact induced by the local • near the coast
geographical conditions
 o chemical stressor (e.g., salt)
 o mechanical stressor (e.g., high wind load)
 • in alpine regions
 o mechanical load (e.g., heavy snow load)
 • in regions prone to hail and thunderstorms
 o hail impact
 o lightning strike
 o storm-prone which manifest as mechanical
 and dynamical mechanical loads (e.g.,
 storms, typhoon)

The time-dependent repeated application of combined climatic and environmental stresses
can induce material degradation effects or fatigue, performance losses and induce failure
modes. As some stressors can have a highly accelerating impact on degradation reactions
and some impacts can act synergistically, the development of suitable accelerated ageing
tests to simulate and predict various climatic and environmental conditions is a demanding
task.

3.2.2 Classification of Macroclimatic Conditions
In order to generalize findings from differing PV sites, a classification system is needed that
associates the similar climatic variables under a singular classification. For many scientific
fields, the Köppen-Geiger classification is used to relate different geographic locations by
similar climatic conditions. This system, first introduced in 1884 by Vladimir Köppen [26], was
improved upon by Rudolf Geiger in 1961 [27]. The Köppen-Geiger classification divides the
world into five main climatic groups, A, B, C, D, E (Tropical, Dry, Temperate, Continental,
and Polar, respectively). These main climatic groups are based on the type of foliage that
can grow in a specific region [26]. This climate classification is updated regularly to represent
current climatic conditions [15].
Recently, groups have been designing specific classifications for certain applications. For
example, the American Society of Heating, Refrigerating, and Air-Conditioning Engineers
(ASHRAE) have developed their own climate zones. The ASHRAE system was designed
around the usage of heating, ventilation, and air conditioning (HVAC) systems, relying on the
number of ‘heating degree days’ or a measurement of how much heating would need to be
applied to warm a space to room temperature [28]. Motivated by supplementing the com-

 23
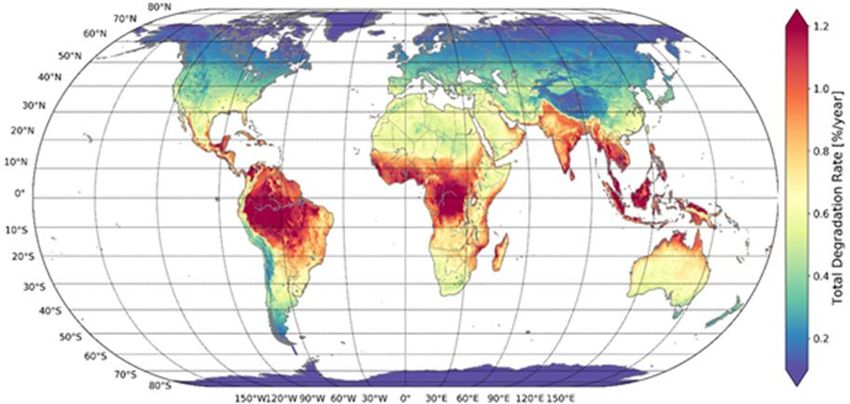
Task 13 Performance, Operation and Reliability of Photovoltaic Systems – Service Life Estimation for Photovoltaic Modules

monly used Köppen-Geiger climate system, Ascencio-Vásquez et al. [29] have added irradi-
ance based climatic conditions. The new system, named KGPV, only uses the main climatic
classification (A - Tropical, B - Desert, C- Steppe, D – Temperate, E - Cold, F - Polar) and a
category based on the average annual irradiance. The irradiance categories have been di-
vided into 30th, 50th, 80th percentiles. Of the 24 climatic zone possibilities, 12 have been
selected based on land coverage and population density. Photovoltaic degradation climate
zone (PDCZ) is a new system based on the specific level of stressors that a module would
be exposed to at a specific location [30]. PDCZ is specifically designed for use in the PV in-
dustry. The climatic classification consists of three categories: module temperature (T1-T8),
mean specific humidity (H1-H5), and wind speed (W1-W5). The temperature category has
been divided up into equal land area portions, whereas the humidity group has been binned
for equal data distribution. To capture the performance and degradation of a PV site, a cli-
mate classification needs to be designated. Climatic categories elucidate the conditions
modules operate under. A robust classification schema enables site owners/operators to ca-
ter their installations to the specific climate location. Using the KGPV classification system,
Ascencio-Vásquez et al. [31], have mapped the amount of predicted degradation of modules
for each climate zone. Alternatively, Karin et al. [30] have specifically selected the criterion
for their climate classification to be stressors that affect the degradation of PV systems. A
climatic classification combined with in-depth understanding of module degradation is critical
to affirming manufacturing warranties and predicting module lifetime [32].

 Conditions in Accelerated Testing
This section describes stressors and stress levels frequently applied for the testing of PV
modules, and current research directions being pursued to increase the relevance of accel-
erated testing for PV. Accelerated stress testing involves applying stressors that PV modules
experience in their field use conditions but at higher stress levels than the PV modules expe-
rience in the field. These include temperature (e.g., high temperature, low temperature, tem-
perature cycling), solar irradiation, mechanical stress, humidity, impacts (e.g., hail, stones,
projectiles), electrical discharge, acid, basic, and corrosive fluids. Indirect factors as a result
of light include current, bias on the p-n junction, and system voltage. Tests should be applied
to materials, components, mini-modules, and full-size modules. Stressors may be applied in
single factor tests, steady state, multi-factor tests, sequential stress factor, and combined
stress factor tests. A major challenge that accelerated testing has yet to address, is the fact
that the response of a material to a five or ten time increase in the particular stress level for
that stressor, may not be a linear function of the stress level. So, for example a material ex-
posed to one sun irradiance vs. exposed to five suns irradiance, may not obey reciprocity,
and may not degrade a factor of five times faster. This makes many, if not most, accelerated
tests, while useful, not activating the same degradation mechanisms as real-world exposure
conditions [33].
Most of the commonly applied stress tests originated in military and electronics test specifica-
tions which include the Commission of the European Communities (CEC), the European So-
lar Test Installation (ESTI), the Jet Propulsion Laboratory (JPL), and the IEC [8]. In the fol-
lowing sections tests and testing methods are described which are used in PV industries.
Most tests are based on the type approval standard IEC 61215. These tests are also varied
in several specific methods in different ways. Some of the methods mainly multiply the test
durations or cycles of IEC 61215, grouped, and named as “extended IEC 61215 testing”.
Other methods do not define specific test durations but apply the tests until a failure occurs.
This approach is named “test to failure”. Both approaches can even be used to generate

24
You can also read