From Canopy to Currency - PREMIUM SPONSORS SPONSORS
←
→
Page content transcription
If your browser does not render page correctly, please read the page content below
State of the
      Forest Carbon
      Markets 2011
      From Canopy to Currency

PREMIUM SPONSORS

SPONSORS
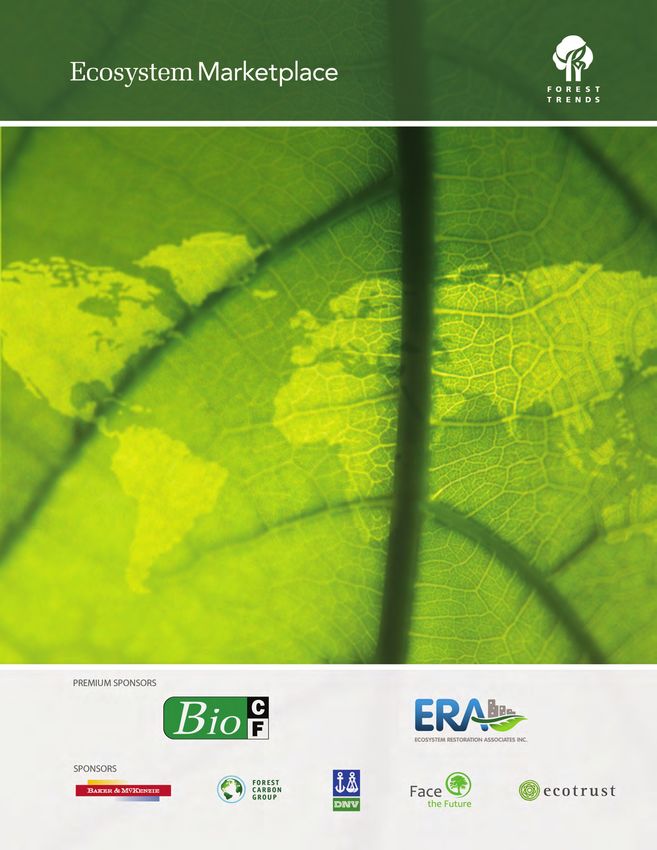
About Ecosystem Marketplace                                        Special Thanks to Our Donors
Ecosystem Marketplace, a project of the non-
profit organization Forest Trends, is a leading                                        *
source of information on environmental markets
and payments for ecosystem services. Our
publicly available information sources include
annual reports, quantitative market tracking,
weekly articles, daily news and news briefs
designed for different payments for ecosystem
services stakeholders. We believe that by
providing solid and trustworthy information on
prices, regulation, science and other market-
relevant issues, we can help payments for
ecosystem services and incentives for reducing
pollution become a fundamental part of our
economic and environmental systems, helping
make the priceless valuable.

             Find out more at
       www.ecosystemmarketplace.com

Ecosystem Marketplace manages the Forest
Carbon Portal, a clearinghouse of information,
feature stories, event listings, project details,
‘how-to’ guides, news, and market analysis on
forest-based carbon sequestration projects.
Launched at the December 2008 UN Climate
Conference of the Parties in Poznan, Poland, this
satellite site to Ecosystem Marketplace exists to
fill knowledge and ‘market intelligence’ gaps with
the goal of stimulating progressive land-based
carbon market offset projects policy in the
regulated markets, and successful pilot projects
in the voluntary markets. It is designed for the
investor, the student, the policymaker, the
project developer, the analyst, the broker, the
retailer, and the conservationist. In other words,
                                                     *This publication is made possible by the generous support of the American
if you have an interest in land-based carbon         people through the United States Agency for International Development
sequestration, these resources are for you.          (USAID), under the terms of the TransLinks Cooperative Agreement No.EPP-A-
                                                     00-06-00014-00 to The Wildlife Conservation Society. TransLinks is a
              Find out more at                       partnership of WCS, The Earth Institute, Enterprise Works/VITA, Forest Trends
         www.forestcarbonportal.com                  and The Land Tenure Center. The contents are the responsibility of the
                                                     partnership and do not necessarily reflect the views of USAID or the US
                                                     government.

       ii |State of the Forest Carbon Markets 2011
State of the Forest
Carbon Markets 2011
From Canopy to Currency
David Diaz, Katherine Hamilton,
and Evan Johnson
Contributors: Daniel Kandy and Molly Peters-Stanley
September 2011Copyright and Disclaimer Acknowledgments
© Ecosystem Marketplace This report is public and freely available due to the financial contributions
from Ecosystem Marketplace’s sponsors and donors:
This document was prepared and based upon
information supplied to Forest Trends’ Premium Sponsors: Wildlife Works, World Bank BioCarbon Fund, and
Ecosystem Marketplace by participants in a ERA Ecosystem Restoration Associates.
market survey.
Sponsors: Baker & McKenzie, Det Norske Veritas, Ecotrust, Forest Carbon
Ecosystem Marketplace does not represent or Group, and Face the Future.
vouch for the accuracy, suitability or content of
the survey responses or the results as set out Donors: The United States Agency for International Development
herein. It is the sole responsibility and obligation (USAID), the David and Lucile Packard Foundation, the Gordon and Betty
of the reader of this report to satisfy Moore Foundation, the John D. and Catherine T. MacArthur
himself/herself as to the accuracy, suitability and Foundation, the Global Environment Facility, the United Nations
content of the information. Development Programme, and the Norwegian Agency for Development
Cooperation.
Forest Trends’ Ecosystem Marketplace (such
terms taken to also include its respective This report would not be possible without the data shared by individuals
affiliates, officers, directors, partners, and representing more than 200 organizations. The following pages also
employees) shall have no liability for any represent a compilation of the resources, insights, and knowledge of
inaccuracy, representation, or misrepresentation dozens of individuals. They include, in no particular order: Ellysar
set out herein. The reader further agrees to hold Baroudy, Mirko Serkovic, Marigold Norman, William Bierbower, Maud
Ecosystem Marketplace harmless from and Warner, Kristina Van Dexter, Phil Covell, Ben Feldman, Gena Gammie,
against any claims, loss, or damage in connection David Tepper, Benjamin Coleman, Gary Gero, David Antonioli, Andrea
with or arising out of any commercial decisions Welsh, Sean Carney, Zubair Zakir, Jeff Hayward, Toby Janson-Smith,
made on the basis of the information contained Christian Dannecker, Mike Korchinsky, Ollie Belton, Mark Belton, Martijn
herein. Wilder, Louisa Kiely, Chandler Van Voorhis, Bruno Ferraz, Maria Tereza
Umbelino, Charles Hall, Nick Martin, Mary Grady, John Ramey, Leslie
The reader of this report is strongly advised not Durschinger, Denis Slieker, Justin Whalen, Gonzalo Castro de la Mata,
to use the content of this report in isolation, but Roberto León Gómez Charry, Moriz Vohrer, Michael Sahm, Henriette
to take the information contained herein Lachenit, Joanna Silver, Jane Lloyd, Kathy Benini, Kate Townsend, Steve
together with other market information and to Baczko, Alex Langer, Pablo Reed, Miguel Rescalvo, Kyle Silon, Mark
formulate his/her own views, interpretations, Wilson, Brookly McLaughlin, Steve Dettman, Brent Davies, Rebecca
and opinions thereon. The reader is strongly Vonada, Mike Mitchell, and Alexa Morrison.
advised to seek appropriate legal and
professional advice before entering into Thank you also to the entire staff at Forest Trends for your continued
commercial transactions. support and contributions and to Michael Jenkins for his guidance.
Cover by Wenceslao Almazan. Layout by Anne Thiel and Ben Dappen.
Cover photo credit: Nathan Dappen.Executive Summary
The first seeds of the forest carbon markets were planted over thirty years ago… but it was not until 2010 that the
marketplace’s largest growth spurt came into view.
This year, a record number of project developers and secondary market suppliers from around the world shared data about
their projects and transactions. The information they provided revealed a market that has both increased the volume of its
transactions and matured in its structure. While the marketplace has taken root enough as to entice new developers and
investors to participate, many observers still remain cautious amid significant uncertainties. Despite growing confidence
around several nascent policies and compliance markets, the future shape, size, and scope of the global forest carbon
marketplace remains highly uncertain.
This second annual State of the Forest Carbon Markets tracks, reports, and analyzes trends in global transactions of
emissions reductions generated from forest carbon projects. The information in this report is primarily based on data
collected from respondents to Ecosystem Marketplace’s 2010 forest carbon project developer’s survey, combined with data
from the 2009 State of the Forest Carbon Market Report and the 2011 State of the Voluntary Carbon Markets report.
The data and analysis that follow cover forest carbon activity in compliance carbon markets—such as under the Kyoto
Protocol’s Clean Development Mechanism (CDM), the New Zealand Emissions Trading Scheme (NZ ETS), and the New
South Wales Greenhouse Gas Reduction Scheme (NSW GGAS)—as well as voluntary carbon markets—such as the voluntary
Over-the-Counter (OTC) market and the Chicago Climate Exchange (CCX). In total, we captured responses from 161 project
developers or project proponents in the primary forest carbon market and 48 suppliers in the secondary market covering
412 individual forest carbon projects.
Don’t Look Down – Volume and Value Climb to New Heights
In 2010, the global markets for forest carbon projects hosted the largest volume and value of credits contracted in history,
dramatically outpacing the market activity we observed in our last State of the Forest Carbon Markets report that covered
transactions up to mid-2009.
Growing from already record-breaking years in 2008 and 2009, respondents reported a total of 30.1 million metric tonnes
of carbon dioxide equivalent (MtCO2e) contracted across the primary and secondary1 markets in 2010. The estimated total
value of transactions in 2010 was $178 million (see Table 1). The historical scale of the forest carbon markets climbed to 75
MtCO2e, valued at an estimated $432 million with projects impacting more than 7.9 million hectares in 49 countries from
every region of the world. Consistent with previous years, the vast majority (>90%) of volumes reported in 2010 occurred in
the voluntary OTC market, as the CCX trading program wound down to a close, and the interest in contracting temporary
forest credits from the CDM shrank from a 2009 high. With 2010’s growth, forest carbon transactions now represent more
than 40% of the total voluntary OTC carbon market by volume.
The average price for offsets across the primary forest carbon markets rose from $3.8/tCO2e in 2008, to $4.5/tCO2e in 2009,
and up to $5.5/tCO2e in 2010. Prices continue to vary widely across the regulated and voluntary markets, as each market
transacts very different credits with unique supply- and demand-side drivers to go along with distinct project-level
characteristics. The value of forest credits in the CCX remained at historical lows just above $1.0/tCO2e, while OTC credits
jumped from $4.2/tCO2e in 2009 up to $5.6/tCO2e in 2010. Prices reported for CDM forest credits fell slightly from
1
The primary market refers to original transactions of credits directly from a project; the secondary market refers to all ensuing
transactions.
From Canopy to Currency | i$4.7/tCO2e in 2009 to $4.5/tCO2e in 2010, combined with a dip in volumes from 2009, leaving the market smaller this year
compared to last.
Table 1: Volume, Value, and Prices in the Forest Carbon Markets (Primary & Secondary Markets)
Reported Volume Reported Value Avg. Price
Market (MtCO2e) (million US$) (US$/tCO2e)
Historical Total 2010 Historical Total 2010 Historical 2010
Voluntary OTC 59.0 27.4 250.7 126.7 5.46 5.63
CCX 2.9 0.1 5.2 0.2 2.83 1.18
Total Voluntary Markets 61.9 27.6 256.0 126.9 5.36 5.60
CDM 9.0 1.4 37.6 6.3 4.28 4.49
NSW GGAS 3.1 1.1 11.8 0.0 12.26 *
NZ ETS 0.6 0.0 8.9 0.3 13.91 12.95
Total Regulated Markets 12.8 2.6 58.3 6.5 5.61 4.61
Total Global Markets 74.7 30.1 314.2 133.4 5.40 5.54
Total Primary Market 71.6 29.0 290.7 128.6 5.22 5.49
Total Secondary Market 3.2 1.2 23.5 4.8 9.69 7.56
Total Estimated Value 432.1 177.6
Notes: Average prices include transactions from primary and secondary markets. These may differ from average prices reported later by standard, etc., which
are based upon primary market transactions. All values and prices reported above except for “Total Estimated Value” include only those volumes with prices
reported directly by survey respondents. Total Estimated Value calculated by applying median price in each year to volumes reported without price by survey
respondents For 2010 and historical data, 81% and 86% of the total volume reported included matching price points, respectively. The relatively small response
from New Zealand projects likely under-represents the current and historical volumes and values of that marketplace.
* Too few data points to disclose average price for 2010.
Source: Ecosystem Marketplace
Riding the REDD Wave
The 2010 surge in the forest carbon market was fueled to a great extent by contracting from large Reduced Emissions from
Deforestation and Forest Degradation (REDD)2 projects. Following an early role kindling the carbon market, REDD re-
emerged as a major source of credits in 2007 (see Figure 1). Since then, REDD has followed a dramatic growth trajectory,
buoyed by strong international policy signals, emerging compliance markets, and several newly minted methodologies
enabling verification. In 2010, REDD clearly surpassed the volume supplied by any other project type, supplying 19.5
MtCO2e out of the total 29.0 MtCO2e contracted in the primary market.
Looking beyond REDD, supply continued to emerge from both Afforestation/Reforestation (AR) and Improved Forest
Management (IFM) projects. The storyline for AR, however, was one of retrenchment, as contracting for AR credits fell in
every single market tracked from 2009 to 2010. The unique hurdles to financing and commercializing AR projects continue
to persist and constrain the ability for the carbon markets to incentivize one of the oldest strategies for enhancing and
restoring environmental health—planting trees. IFM activities continue to supply the markets with modest and steady
growth driven largely by US-based projects. IFM is expected to build an increasingly global footprint in 2011 following the
approval of the first internationally applicable IFM-specific methodologies by a third-party standard in 2010 and 2011 under
the Verified Carbon Standard (VCS).
The Global Flow of Credits
Looking around the world, clear hotspots emerged in terms of the sources of credits and their destinations. Latin America
provided the lion’s share of supply, contributing more than half of the volume contracted in 2010 (see Figure 2), almost
entirely from 28 projects in Peru and Brazil. European buyers stepped in as the largest source of demand, taking at least
10.6 MtCO2e primarily from Latin America, Asia, and Africa. North America provided the second-largest sources of both
2
For the distinction between REDD and REDD+, refer to Box 3 in the main report.
ii |State of the Forest Carbon Markets 2011supply and demand in the market, with companies taking on 5.6 MtCO2e, just over the 4.9 MtCO2e supplied from projects
in the region. North American buyers were the primary source of demand for credits from North American projects, but
Europeans were also willing to take a substantial slice of the North American pie (0.5 MtCO2e).
Figure 1: Historical Volumes by Project Activity Type (Primary Market Only)
30
0.8
25
20
Volume (MtCO2e)
19.5
15 9.0
10
8.8
5.8
5 1.2 3.3
4.9 3.5
2.1
1.6 0.2 0.3 0.2 1.8 2.8
0.9 1.4 0.5 1.0 0.6
0 0.6
pre-2002 2002 2003 2004 2005 2006 2007 2008 2009 2010
Agro-forestry IFM AR REDD Not Reported
Note: This graph shows volumes contracted by each project type in the primary market. Data labels are omitted in years where volumeAfrica remains a relatively small player in terms of global supply, providing the fewest credits of any region with a voluntary OTC focus. African volumes were down from their peak at 5.1 MtCO2e contracted in 2009, producing just 1.9 MtCO2e contracted in 2010 from 14 projects. Nevertheless, the region is expected to follow its longer-term historical growth trend with a growing pipeline of large projects such as those begun by Wildlife Works in Kenya, and new deals, such as from ERA Ecosystem Restoration Associates in the Democratic Republic of Congo, which appear set to contribute a future boost in African supply beyond historical levels. Last year also saw a trend towards regions buying credits from their own backyards. Exemplified by Oceania, where buyers exclusively buy locally, this same trend can also be found in Asia and Latin America where local purchasing by new buyers is a growing trend to watch. Although both Asia and Latin America continue to supply more credits into the market than they consume, many market players and observers view the uptick in localized demand for forest carbon credits as a critical component to sustaining the growth of the forest carbon sector into the future. The Changing Face of Projects The private sector has emerged as a new torchbearer for forest carbon projects. Taking cues from the early and persistent progress of non-profit conservation organizations, a host of new private sector players are entering the marketplace, from project development companies to major financial firms such as BNP Paribas and Gazprom Marketing & Trading. On the ground, the impacts of this transition remain uncertain. The broad application of co-benefits certification under the Climate, Community & Biodiversity (CCB) Standards suggests that the market has set a key requirement that projects must deliver benefits to biodiversity and communities to find a broad appreciation among buyers, but the project-level approaches to doing so still vary widely. Projects continue to be developed using a variety of forest management strategies, species mixes, and across a broad spectrum of sizes. One of the most persistent challenges in forest governance, from well before carbon markets entered the scene, has been the resolution of conflicts regarding the land rights of local peoples and ensuring that carbon projects benefit local peoples with the best track record of forest conservation. In terms of land tenure, the data for 2010 indicate that there is an increasing attraction to siting projects on privately owned and managed lands. This preference showed up for both non- profit and for-profit developers, who developed 62% and 77% of projects in areas including private landholding, respectively. There has been less activity to date developing projects in areas with communal or customary ownership and tenure, and for-profit and non-profit developers showed different propensities for developing these projects. Although 30% of projects from non-profit developers included lands with communal or customary use or ownership rights within the project area, only 17% were exclusively on these types of lands; for for-profit developers, the contrast is more stark, with 25% of projects including communal or customary lands in the project area, but only 2% of projects developed exclusively on these lands. In their current implementation, most successful forest carbon projects have focused on projects where legal environments are relatively stable and ownership and land tenure are clear. Encouraging the resolution and clarification of land rights in areas of conflict holds immediate potential for improving forest governance and conservation, as well as offering expanded opportunities in the forest carbon markets by creating a more stable legal environment that project developers and investors need to bring carbon finance to bear at greater scale. From Trees to Tonnes The year of 2010 was filled with many firsts in the forest carbon sector. The move towards standardization using third-party verification found throughout the broader carbon markets has taken a strong place at the center of forest carbon market activity. In particular, the continued emergence of REDD+ on the international policy stage was matched by the unveiling of several groundbreaking REDD methodologies for offset projects and the issuance of the first VCS REDD credits. But REDD was not alone. A trend towards consolidated or widely applicable methodologies from standards requiring third-party iv |State of the Forest Carbon Markets 2011
verification is now apparent from all corners of the market, with an eye towards decreasing the burden on developers while
maintaining rigor in the marketplace. It now seems buyers have responded to the greater clarity in the methodology
landscape with an increased willingness to sign on the dotted line with new projects.

Among the highlights in 2010, the California Air Resources Board (ARB), charged with implementing the state’s cap-and-
trade scheme, gave the long-awaited blessing to forest protocols from the Climate Action Reserve (hereafter CAR or The
Reserve) for acceptance in the future compliance scheme. The Verified (formerly “Voluntary”) Carbon Standard released its
first five forest carbon methodologies, including a long-awaited modular approach to REDD accounting. At the same time,
the American Carbon Registry (ACR) released its first forest methodology and unveiled an innovative privately insured
version of the buffer pool in partnership with Finite Carbon.

In 2010, two additional carbon standards (Brasil Mata Viva, or BMV, and Forest Carbon Standard International, or FCSI)
popped on the radar for the first time with reports of substantial volumes contracted, but the dominance of market share
by VCS was seemingly unaffected (see Figure 3). Across the primary market, VCS was the standard of choice for 16 projects
with more than half of the volume project developers committed to deliver, covering 15.6 MtCO2e contracted in 2010. The
new standards BMV (with 9 new projects) and FCSI (with at least 2 new projects) took their first bold steps into the
marketplace, taking the second- and third-place spots for market share by volume with reports of 3.8 MtCO2e and 2.4
MtCO2e contracted in 2010, respectively.

                            Figure 3: Carbon Standards and Layering with Co-Benefits Standards, 2010
                        CCB Standards Market Share                                       Carbon Verification Standard Market Share

              CarbonFix +                                                                                                             CAR         NSW GGAS
Plan Vivo +      CCB                             No Co-                                                      FCSI
                                                                                                                       CDM            4.4%          3.9%
   CCB           0.1%                           Benefits                                       BMV           8.2%
                                                                                                                       5.4%                 ACR ISO-14064
   0.2%                                         Standard                                      13.1%
                                                                                                                                            3.4%    3.3%
                                                  Used
   CCB Alone                                     41.4%                                                                                           CCB Alone*
     0.7%                                                                                                                                           0.7%
                                                                                                                                                   Plan Vivo
   CDM + CCB                                                                                                                                         0.6%
     1.9%                                                                                                                                          Internal
                                                                                                                                                     0.6%
  ISO-14064 +                                                                                                                                         CCX
      CCB                                VCS + CCB                                                VCS                                                0.5%
     2.4%                                 53.2%                                                  53.8%                                            CarbonFix
                                                                                                                                                     0.1%
                                                                                                                                    Others       None
                                                                                                                                     2.0%        0.0%

 Notes: Percentages are based on market share by volume of primary market transactions contracted in 2010 (29.0 MtCO2e total). Projects must be verified
 under a carbon quantification standard in order to be issued verified offset credits.
 *Several projects reported contracting offsets and only applying the CCB Standards. CCB certification alone will not result in credit issuance. The label “CCB
 Alone” is solely intended to distinguish these transactions from those that have applied no standards at all.
                                                             Source: Ecosystem Marketplace

In 2010, only 3 projects reported contracting credits without the use of any carbon accounting or other standards and 14
reported using only an internal standard. The total volume contracted from projects using an internal or no standard fell
from 220,000 metric tonnes of carbon dioxide equivalent (tCO2e) in 2009 to 170,000 tCO2e in 2010, shrinking from 1.0% to
0.6% of the primary market. This decline suggests these projects may be having greater difficulty finding buyers as the
application of third-party standards is increasingly demanded in the marketplace.

Many projects are also now following a demand for certification of an array of project benefits beyond carbon. In 2010,
projects across the forest carbon sector reported applying only one supplementary “co-benefits” standard, that of the
Climate, Community and Biodiversity Alliance (CCBA, see Figure 3). Twenty-five projects that contracted credits in 2010
reported using the CCB Standards, covering over half the year’s total volume. Although there were at least 80 transactions

                                                                                                                               From Canopy to Currency | v
in 2010 from projects not reporting the use of the CCB Standards, the commitments from these projects represented less
total volume than their CCB-applying counterparts.
The Value of a Standard
The diverse array of standards applied in the marketplace also coincides with a spectrum of prices for credits developed
under each standard. Projects using no standard or only an internal standard were able to secure the highest prices,
although—as reported above—they did not contract significant volumes. Credits committed in 2010 under the CAR
standard were clustered fairly tightly in the range of $7-10/tCO2e, but were down slightly from prices reported in 2009.
California market players indicated these prices have already risen following approval of The Reserve’s two forest protocols
at the end of 2010 for use in the pending California cap-and-trade scheme.
Despite having the largest volumes contracted across the globe, VCS had the lowest average price per tonne, with the
exception of CCX, whose trading program swiftly wound down in 2010 (see Figure 4). While large volumes from the VCS
were contracted at across-market lows, however, many individual projects applying VCS reported contracting credits at
prices substantially higher than the volume-weighted average. While VCS showed volume-weighted average prices of
$4.0/tCO2e, the median price contracted in 2010 was much higher, bringing $8.5/tCO2e.
Figure 4: Price Distribution by Carbon Accounting Standard Applied in 2009 and 2010
34
32 2010
30 2009
28
26
24
Price ($/tCO2e)
22
20
18
16
14
12
10
8
6
4
2
0
(8) (17) (5) (4) (3) (4) (6) (5) (4) (3) (6) (5) (5) (5) (6) (14) (12) (16)
Internal None CarbonFix ISO-14064 Plan Vivo CAR CDM VCS CCX
Notes: For further explanation of the box-and-whisker format used in this graph, refer to Box 2 in the main text. The price distributions shown here
incorporate contracts signed across a range of stages in the project cycle (e.g., pre- and post- validation and verification) and with different delivery
terms. These values are also closely related to the size of the transactions, and the total volume contracted under each standard varies considerably.
Source: Ecosystem Marketplace
Projects applying the CarbonFix and Plan Vivo standards secured higher prices than many of their counterparts using other
standards, but have contracted relatively limited volume in terms of global market share. This may stem in part from the
narrower niche and smaller portfolio of projects focused on tree planting on the one hand (CarbonFix), and smallholder and
community engagement on the other (Plan Vivo). For projects moving volumes at very large scales (i.e., hundreds of
thousands of tonnes per year), these standards have found limited application to date. Nevertheless, the majority of
projects contracting offsets do not fit this largest scale, and both CarbonFix and Plan Vivo have grown in recent years,
attracting new projects that continue to successfully find buyers.
vi |State of the Forest Carbon Markets 2011Despite the common discussion of price premiums related to perceived differences in offset quality among available
standards, our analysis of the data and the consensus from project developers interviewed for this report support the
conclusion that there is no apparent price premium based on the perceived stringency of an offset standard. Instead, the
data we have collected, backed by market player interviews, support the assertion that many standards currently function
as gatekeepers to particular buyer segments rather than as price-setters.
Standing on the Shoulders of Project Developers to Peer into the Future
The picture that emerges from deeper examination of the surge in contracted tonnes over 2009 and 2010 is fundamentally
about a small—but growing—cadre of forward-looking buyers and investors making big bets on the future of the forest
carbon markets. Of the 20.1 MtCO2e for which project developers reported buyer motivations in 2010 (i.e., 69% of the total
primary market volume setting aside the volumes without reported motivations), 45% was contracted to buyers who plan
to resell the credits. Considering that 50% of the entire volume contracted in 2010 came from projects that have not yet
been validated under a third-party standard, the buyers and investors in these projects are clearly convinced that the future
of the forest carbon market is resolved enough to justify the calculated risk of upping financial support for these projects to
historic levels.
At the same time, nearly every project developer who predicted the future size of the forest carbon markets this year
envisioned growth. However, the overwhelming majority of these respondents this year failed to predict the scale of
growth seen in 2009 and 2010, even with 2009 already in the rearview. The fact that most project developers dramatically
underestimated the market activity in 2009 and 2010 suggests that fundamental data on the size and shape of the forest
carbon market is still not widely known.
To gauge the amount of credits in the pipeline, Ecosystem Marketplace asked project developers to provide the number of
credits they plan to generate from 2011 to 2015. Tallying up the five-year supply from a total of 287 projects, project
developers reported a total of 373 MtCO2e to be generated (see Table 2). The overwhelming source of anticipated supply
over the next five years comes from 60 REDD projects. A total of 213 AR, 14 IFM, and 9 Agro-forestry projects were also
planning to add to the mix, but collectively provide only 10% of the projected supply.
It is important to take both the Table 2: Supply Estimated for 2011-2015 by Project Developers
current market volumes and these Volume by Project Type (MtCO2e/5yr)
projected five-year supplies in Market
AR IFM REDD Agro-forestry TOTAL
context. Project developers and Voluntary OTC 11.4 6.4 331.0 3.5 352.2
buyers—including several CCX -- 0.9 -- -- 0.9
interviewed for this report—often Total Voluntary Markets 11.4 7.3 331.0 3.5 353.1
readily admit they tend to have a Australia 2.0 1.2 -- -- 3.4
rosy view of the credit volumes California (ARB/CAR)What to Watch The hard work of non-governmental organizations (NGOs) in the early days of the markets, followed more recently by standards organizations and the private sector, is now paying off through a dramatic uptick in supply coming from all over the world. Although it is impossible to tell how much of the volume contracted in 2010 and in the pipeline will actually make it to market, it is fairly certain that supply will continue to grow rapidly. Currently, buyers purchase most credits voluntarily, but regulatory drivers hold a critical key to unlock larger climate impacts and market demand. Across the global markets, a number of influential political choices remain to be made, and a host of market drivers remain uncertain. The consensus among dozens of market players interviewed for this report, including leaders of standards organizations and major buyers and project developers, is that the forest carbon market is entering a phase where growth will be fundamentally tied to finding and creating new demand for forest carbon credits. Many market players are keeping their eyes on international climate negotiations, looking to the upcoming United Nations Framework Convention on Climate Change (UNFCCC) meetings in Durban, South Africa for continued progress toward an international REDD+ mechanism and confirmation that it will be market-linked. Several buyers and project developers reported the billions of dollars in public pledges for building REDD+ readiness as a sign that forest carbon will ultimately be supported in whatever international market or incentive programs develop. Many policymakers are already taking more concrete steps in their own countries and states. Although still in early stages, promising developments are surfacing in emerging marketplaces in China and Japan with a welcoming role for forests in the fight against climate change. California is poised to open market trading for its cap-and-trade scheme in 2012 and is cracking open the door to be the first compliance carbon market to welcome international REDD credits. The technical capacity for accounting and delivering carbon reductions using a national or sub-national/jurisdictional accounting lens alongside project-level interventions (also known as “nesting”) is likely to be a critical dialogue to watch. Progress to deliver state-level forestry-based climate mitigation continues to be the order of the day for the Governors’ Climate and Forests Taskforce (GCF), which produced a groundbreaking commitment in November 2010 for the governments of California, Chiapas (Mexico), and Acre (Brazil) to work on establishing a framework for producing forest carbon credits. Both the GCF and VCS have working groups dedicated to the subject of jurisdictional accounting and project nesting that are populated with major decision-makers and movers in forest carbon policy and markets. In addition, The Reserve is preparing a protocol for forest carbon activities in Mexico utilizing a nested approach that is expected by the end of 2011. Answers to some of the bigger questions informing the market outlook, however, still remain unclear. For example, will these new policies arrive in time to bring the additional demand many observers see as necessary to sustain the current portfolio of projects? Policymakers are in the midst of developing funding for forest conservation at an unprecedented scale. A number of innovative solutions have evolved to both overcome many of the earlier hurdles facing market-based forest conservation efforts and attract private sector investment, but the scope of these markets is still relatively small in the face of global forest loss and a changing climate. The fate of these markets and projects will in large part rest in the hands of policymakers. 2010 was undoubtedly a critical year in the history of the forest carbon markets, but the most consequential chapters in this story still remain to be written. viii |State of the Forest Carbon Markets 2011
Table of Contents

Foreword...........................................................................................................................................................................1
Methodology ....................................................................................................................................................................3
The Global Overview ........................................................................................................................................................5
Market Snapshot: Voluntary OTC .................................................................................................................................11
Market Snapshot: Chicago Climate Exchange..............................................................................................................15
Market Snapshot: California ..........................................................................................................................................17
Market Snapshot: Clean Development Mechanism ...................................................................................................21
Market Snapshot: New Zealand....................................................................................................................................25
Market Snapshot: Australia ...........................................................................................................................................29
Market Snapshot: Emerging Asian Markets.................................................................................................................31
Supply: Project Types and Locations.............................................................................................................................33
Infrastructure: Standards & Registries..........................................................................................................................41
The Projects: Impact on the Land .................................................................................................................................47
Demand: Catering to the Buyer ....................................................................................................................................55
The Future: Developers’ Outlook ..................................................................................................................................59
Conclusion.......................................................................................................................................................................63
Appendix 1: Forest Carbon Offset Supplier List ...........................................................................................................65
Appendix 2: Overview of Forest Carbon Standards.....................................................................................................67

                                                                                                                                             From Canopy to Currency | ix
x |State of the Forest Carbon Markets 2011
Tables and Figures

List of Figures
Figure 1: Historical Volumes by Project Activity Type (Primary Market Only) ........................................................... iii
Figure 2: Locations of Buyers and Supply Contracted in 2010 (Primary Market Only).............................................. iii
Figure 3: Carbon Standards and Layering with Co-Benefits Standards, 2010 ............................................................. v
Figure 4: Price Distribution by Carbon Accounting Standard Applied in 2009 and 2010 .......................................... vi
Figure 5: Geographic Distribution of Survey Respondents ...........................................................................................4
Figure 6: Historical Forest Carbon Market Volume (Primary & Secondary Markets) .................................................5
Figure 7: Historical Forest Carbon Market Value (Primary & Secondary Markets).....................................................7
Figure 8: Historical Price Distributions (Primary Market) ..............................................................................................8
Figure 9: Historical Sales and Retirement (Primary & Secondary Markets) ................................................................9
Figure 10: Historical Scale of the Secondary Market ...................................................................................................10
Figure 11: Forest Carbon Share of Voluntary OTC Market (Primary & Secondary Markets) ...................................11
Figure 12: Cumulative Projects by Market ...................................................................................................................12
Figure 13: International Reach by Market....................................................................................................................12
Figure 14: CCX Forest Project Approvals ......................................................................................................................15
Figure 15: CCX Forest Credit Issuances and Sales ........................................................................................................16
Figure 16: CAR Forest Credit Volumes ..........................................................................................................................18
Figure 17: CDM Volumes and Prices Contracted .........................................................................................................22
Figure 18: NZU and CER Prices ......................................................................................................................................26
Figure 19: Credits from NSW GGAS Carbon Sequestration Projects.........................................................................30
Figure 20: Historical Volumes Contracted by Project Activity Type ...........................................................................34
Figure 21: Entry of New Projects into the Market .......................................................................................................34
Figure 22: Offset Origins in 2010 by Region and Project Type....................................................................................39
Figure 23: Carbon Verification Standard Market Share, 2010 ....................................................................................41
Figure 24: CCB Standards Market Share, 2010 ............................................................................................................42
Figure 25: Project Verification Status for Credits Contracted in 2010........................................................................43
Figure 26: Price Distribution by Carbon Accounting Standard Applied, 2009 and 2010 ..........................................45
Figure 27: Volumes Reported Registered and Contracted Involving Registries in 2010 ..........................................46
Figure 28: Historical Area Impacted by Projects ..........................................................................................................47
Figure 29: Historical Trends in Project Scale.................................................................................................................48
Figure 30: Historical Volumes by Project Developer Type ..........................................................................................49
Figure 31: Shifting Tenure and Ownership Trends ......................................................................................................51
Figure 32: Tenure and Ownership Preferences by Developer Type ..........................................................................51
Figure 33: Forest Management Strategies by Project Type ........................................................................................53
Figure 34: Use of Native Species in Tree Planting Activities........................................................................................53
Figure 35: Buyer Types in 2010 .....................................................................................................................................55

                                                                                                                                  From Canopy to Currency | xi
Figure 36: Buyer Location and Regional Preferences ..................................................................................................56 Figure 37: Buyer Motivations in 2010...........................................................................................................................57 Figure 38: Contract Types for 2010 Transactions ........................................................................................................58 Figure 39: Project Developer Predictions .....................................................................................................................60 Figure 40: 2011 Standard Plans.....................................................................................................................................61 List of Tables Table 1: Volume, Value, and Prices in the Forest Carbon Markets (Primary & Secondary Markets) ........................ ii Table 2: Supply Estimated for 2011-2015 by Project Developers .............................................................................. vii Table 3: Volume, Value, and Prices in the Forest Carbon Markets (Primary & Secondary Markets) ........................6 Table 4: California Allowance and Offset Levels ..........................................................................................................17 Table 5: Historical Project Counts and Contracted Volumes and Values by Project Type .......................................38 Table 6: The Top 10 Country Suppliers in 2010 ...........................................................................................................39 Table 7: Standard Trends, 2009 to 2010 ......................................................................................................................42 Table 8: Top Carbon Standards by Project Type, 2010................................................................................................44 Table 9: Supply Estimated for 2011-2015 by Project Developers ..............................................................................60 List of Boxes Box 1: How to Read a Box-and-Whisker Plot .................................................................................................................8 Box 2: Forest Carbon Project Typology.........................................................................................................................33 Box 3: So What About the “+” in REDD+? ....................................................................................................................36 Box 4: It’s a Small World After All..................................................................................................................................48 xii |State of the Forest Carbon Markets 2011
List of Acronyms

AAU      Assigned Amount Unit
ACR      American Carbon Registry
AFOLU    Agriculture, Forestry, and Other Land Use
AR       Afforestation/Reforestation
ARB      California Air Resources Board
BMV      Brasil Mata Viva
BOCM     Bilateral Offset Credit Mechanism (Japan)
CAR      Climate Action Reserve (also known as The Reserve)
CCBA     Climate, Community, and Biodiversity Alliance
CCB      Climate, Community, and Biodiversity (Standards)
CCX      Chicago Climate Exchange
CDM      Clean Development Mechanism
CER      Certified Emission Reduction
CFI      Carbon Farming Initiative (Australia) or
         Carbon Financial Instrument (used by the Chicago Climate Exchange)
CPRS     Carbon Pollution Reduction Scheme (Australia)
ERU      Emission Reduction Unit
EU ETS   European Union Emission Trading Scheme
FCSI     Forest Carbon Standard International
GCF      Governors’ Climate and Forests Taskforce
GHG      Greenhouse Gas
ICE      IntercontinentalExchange
ICROA    International Carbon Reduction and Offsets Alliance
IFM      Improved Forest Management
ISO      International Organization for Standardization
JI       Joint Implementation
lCER     Long-term Certified Emission Reduction
MAF      Ministry of Agriculture and Forestry (New Zealand)
MOEJ     Ministry of Environment (Japan)
MtCO2    Millions of metric tonnes of carbon dioxide equivalent
NCOS     National Carbon Offset Standard (Australia)
NDRC     National Development and Reform Commission (China)

                                                                       From Canopy to Currency | xiii
NGAC New South Wales Greenhouse Abatement Certificate NGO Non-Governmental Organization NSW GGAS New South Wales Greenhouse Gas Abatement Scheme NZ ETS New Zealand Emission Trading Scheme OTC Over-the-Counter (market) PES Payments for Ecosystem Services POD Pay-on-Delivery REDD Reduced Emissions from Deforestation and Forest Degradation ROW REDD Offset Working Group SMF Sustainably Managed Forests tCER Temporary Certified Emission Reduction tCO2e Metric tonne(s) of carbon dioxide equivalent UNFCCC United Nations Framework Convention on Climate Change VCS Verified Carbon Standard (formerly Voluntary Carbon Standard) VER Verified Emission Reduction WCI Western Climate Initiative xiv |State of the Forest Carbon Markets 2011
Foreword

For most of our readers, the concept that forests should be valued beyond their ability to produce timber or
other commodities is nothing new. For more than a decade, a variety of initiatives known as Payments for
Ecosystem Services (PES) have been popping up around the world, intent upon bringing the numerous values
that forests and other ecosystems provide (and the costs of losing them) onto the economic balance sheet.

In 2005, Forest Trends launched the Ecosystem Marketplace program in response to a call from an emerging
community of practice in the growing field of PES. Although an inspiring array of projects and programs were
being implemented around the world, including the use of novel market mechanisms to finance them, basic
information about these projects, and if and how the markets behind them were working remained
fundamentally limited in many critical respects.

Markets depend on transparent and reliable information to function. What is true for investors on Wall Street
is equally true for indigenous communities, non-governmental organizations (NGOs), government officials, and
all environmental market players dealing with carbon, water, and biodiversity. Ecosystem Marketplace was
thus created to offer transparent and reliable information on market mechanisms and initiatives that we now
know are channeling billions of dollars to protect and enhance the value provided by many of the world’s
ecosystems.

Global climate change has quickly emerged as one of the largest international environmental and social
challenges of our time. In response, a variety of strategies have now emerged for mitigating and adapting to a
warming planet. Among these, efforts to channel market forces to address climate change have taken center
stage, and an international carbon market rapidly transitioned from a curiosity for economists and valuation
studies, to pilot projects by early conservationists and utility companies, to a booming marketplace moving
billions of dollars around the world each year with the ultimate goal of reducing global greenhouse gas (GHG)
emissions.

Forests served as the earliest examples of GHG emissions trading in the form of offsets, but were largely pushed
aside in the rise of the world’s first international and legally-binding carbon market under the Kyoto Protocol.
Nevertheless, from their role as one of the largest sources of global carbon emissions to their potential for
accelerating the removal of GHGs from the atmosphere, forests have moved in from the periphery to feature
prominently in nearly every major contemporary national and international policy strategy for addressing
climate change.

Building on our experience documenting voluntary markets for carbon reductions in the State of the Voluntary
Carbon Markets reports, Ecosystem Marketplace responded to the growing interest in forestry by delivering our
first State of the Forest Carbon Markets report in January 2010. This report uncovered basic market and project
information for the first time on a global trade in forest-based emissions reductions stretching back more than
20 years.

Even as the markets for forest carbon mature and become increasingly sophisticated, they continue to evolve
rapidly and respond to a wide array of signals from international, regional, and domestic policies. The vast
majority of forest carbon market activity still occurs in a world of unique contracts negotiated privately between
project developers and several different types of buyers. The reality on the ground is that basic market
information on the shape, size, and movements of the forest carbon markets remains largely anecdotal. By

                                                                                          From Canopy to Currency | 1
engaging hundreds of organizations over the past five years to report on their projects and market activity, these reports help provide an unparalleled glimpse into the dynamic markets that are now attracting unprecedented attention from international policymakers and the private sector. The growing chorus and momentum behind several international and domestic climate policies seem unlikely to leave forests out of bounds again. At this critical juncture, we hope the report that follows can give answers to many of the fundamental questions policymakers, project developers, investors, and stakeholders have about what we have to show after more than 20 years of forest carbon projects and markets. Michael Jenkins, Katherine Hamilton, President and CEO, Forest Trends Director, Ecosystem Marketplace 2 | State of the Forest Carbon Markets 2011
Methodology

This report is designed to track global transactions of emissions reductions from forest carbon projects. It is primarily based
on data collected from forest carbon project developers. It covers both compliance carbon markets—such as the Kyoto
Protocol-based markets, the New Zealand Emissions Trading Scheme (NZ ETS), and the New South Wales Greenhouse Gas
Abatement Scheme (NSW GGAS)—in addition to voluntary carbon markets—such as the voluntary Over-the-Counter (OTC)
market and the Chicago Climate Exchange (CCX).

Accounting Framework
For the purpose of this report, we define a transaction as a signed contract between a seller and a buyer to deliver carbon
credits in exchange for funds. Respondents to the survey were asked to report market activity within the framework of
contracted transactions. Annual market volumes and prices are reported according to the years in which each contract was
signed. These volumes include contract types with future or optional delivery of credits and/or funds and thus are not
synonymous with already-executed transactions of credits in exchange for funds. Due to the complex nature and timing of
delivery under these contracts, we chose this accounting methodology as the most feasible for estimating aggregate market
activity. We also present information about the contract types used to further indicate the nature of these transactions.

These marketplaces host transactions of a wide variety of products and services commonly referred to as “carbon credits”
or “carbon offsets.” Although most projects in these markets now transact credits as financial instruments with specified
units (e.g., Verified Emissions Reductions or VERs, temporary Certified Emissions Reductions or tCERs, etc.), we have not
excluded projects or transactions where emission reduction benefits are conveyed to a buyer without the creation of credits
in a technical sense. The use of the terms “offsets” and “credits” throughout this report incorporates this broader scope of
emission reduction benefits being transacted in the marketplace.

This report provides analysis of forest carbon projects that are market-linked. It does not cover non-market-linked
government PES programs in which forest carbon assets are valued or the numerous “demonstration” projects that have
begun around the world that have no links to carbon markets.

Market participants, observers, and stakeholders will benefit from greater transparency and access to information about
forest carbon projects in general. We have therefore not applied any subjective filtering to exclude data based on perceived
quality of the offsets contracted, the type of contracts used, or of the projects themselves. Nevertheless, we did follow up
with dozens of respondents to confirm and clarify problematic or inconsistent survey responses.

Except where noted otherwise, volumes and values described in this report refer to the primary forest carbon market.3 The
volumes of transactions presented throughout this report are specified in units of metric tonnes of carbon dioxide
equivalent (tCO2e). Millions of metric tonnes of carbon dioxide equivalent are represented hereafter as MtCO2e. All
monetary values are reported in US Dollars unless otherwise noted. Conversion to US Dollars from other currencies was
calculated using OANDA annualized exchange rates.

Data Sources
The principal source of data for this report is an online survey designed for developers of forest carbon projects. This was
paired with the survey for the State of the Voluntary Carbon Markets 2011 report, which is the source of secondary market
data as well as some primary market data not provided through the forest carbon project developer’s survey. These

3
  The primary market refers to original transactions of credits directly from a project; the secondary market refers to all ensuing
transactions.

                                                                                                                 From Canopy to Currency | 3
surveys were both available online between January 28 and April 15, 2011. Invitations were sent to roughly 1,200
organizations identified as potential carbon market suppliers, including participants from previous carbon market reports by
Ecosystem Marketplace. Further notices were also advertised via electronic distribution lists and newsletters such as
Forests-L, Climate-L, Ecosystem Marketplace’s News Briefs, Carbon Monitor, CINCS Forestracker, and on Ecosystem
Marketplace’s Forest Carbon Portal website (www.forestcarbonportal.com).
Responses from project developers and other market players were complemented with data provided by structural market
service providers such as standards organizations and registry operators, including information retrieved from public
records as well as through direct communication with representatives at these organizations. These additional data sources
are referenced throughout the report where appropriate.
Confidentiality
This report presents data in an aggregated manner to prevent attribution to individual respondents. Price points are
presented only if more than three responses were available. Any data presented in this report that identifies specific
organizations has been confirmed and approved by that organization or was publicly available.
Many of the projects reported to the State of the Forest Carbon Markets 2011 survey have chosen to be featured in the
international Forest Carbon Project Inventory on Ecosystem Marketplace’s Forest Carbon Portal website. Project-level
details and contact information for each of these projects can be found at www.forestcarbonportal.com.
Survey Response Rates
The data presented in this report is built upon direct responses to the forest carbon project developers’ survey in 2010 from
127 organizations. Combining the data collected this year from both the voluntary and forest carbon market reports as well
as from previous years, this report captures a total set of responses from 161 project developers or project proponents in
the primary forest carbon market and 48 suppliers in the secondary market. These respondents reported 412 individual
forest carbon projects taking place in 49 countries around the world.
The largest number of responses was from organizations based in the United States (42), followed by the United Kingdom
(11), Canada (10), Australia (9), Germany (7), Brazil (6), and Mexico (4). All other countries contained 3 or fewer
organizations that responded to this survey. For the regional distribution of responding organizations, see Figure 5.
Figure 5: Geographic Distribution of Survey Respondents
60
50
40
# of Responses
30
20
10
0
Africa Asia Europe Latin America North America Oceania
Region where Organization is Headquartered
Source: Ecosystem Marketplace
4 | State of the Forest Carbon Markets 2011You can also read