Forest Management Solutions for Mitigating Climate Change in the United States
←
→
Page content transcription
If your browser does not render page correctly, please read the page content below
Forest Management Solutions for
Mitigating Climate Change in the
United States
       Robert W. Malmsheimer, Patrick Heffernan, Steve Brink,
       Douglas Crandall, Fred Deneke, Christopher Galik,
       Edmund Gee, John A. Helms, Nathan McClure,
       Michael Mortimer, Steve Ruddell, Matthew Smith, and
       John Stewart

About the Authors                                  enjoyed a variety of forestry employment in      mass for power generation. He graduated
Robert W. Malmsheimer                              Great Britain and the United States and is       from the University of California at Davis
Task Force Co-Chair, Associate Professor of For-   now part owner and manager of an experi-         with a degree in civil engineering. Prior to
est Policy and Law, SUNY College of Environ-       mental private forest in New Zealand. He         joining the California Forestry Association,
mental Science and Forestry, Syracuse, New York    has been an SAF member since 1990, served        he spent 36 years with the US Forest Service.
     Malmsheimer has been a professor at           as chapter and state chairs in Montana, and
SUNY ESF since 1999 and teaches courses            is currently on SAF’s National Policy Com-       Douglas Crandall
in natural resources policy and environmen-        mittee. He was involved during the forma-        Director of Legislative Affairs, US Forest
tal and natural resources law. His research        tive years of what has become the National       Service, Washington, DC
focuses on how laws and the legal system           Carbon Offset Coalition, where his interest            Crandall is currently director of Legis-
                                                   in promoting inclusive solutions to forest       lative Affairs for the US Forest Service. Pre-
affect forest and natural resources manage-
                                                   carbon sequestration posited an approach         viously, for eight years, he was the staff di-
ment, including how climate change and
                                                   for scientific net primary productivity calcu-   rector for the US House of Representatives
carbon sequestration policies affect forest
                                                   lations as a sound basis for forestry carbon
and natural resources. Prior to becoming a                                                          Subcommittee on Forests and Forest Health,
                                                   credit markets.
professor, Malmsheimer practiced law for                                                            with jurisdiction over most legislation and
six years. He has a Ph.D. in forest policy                                                          oversight concerning the Forest Service and
                                                   Steve Brink
from SUNY ESF, a J.D. from Albany Law                                                               Bureau of Land Management. He also served
                                                   Vice President–Public Resources, California
School, and a B.L.A. from SUNY ESF. He                                                              with the Society of American Foresters as
                                                   Forestry Association, Sacramento, California
was the 2007 chair of the SAF Committee                 Brink has been with the California For-     policy director, the National Forest Founda-
on Forest Policy and served on the commit-         estry Association since July 2005. He repre-     tion as vice president, and the American Forest
tee from 2005 to 2007. He has served on            sents most of the remaining solid wood mill      and Paper Association as director responsible
numerous national and state SAF commit-            infrastructure and many of the remaining         for national forest issues. Earlier in his career,
tees and task forces.                              biomass powerplants in the state. His focus      he spent 10 years managing a lumber com-
                                                   is on timber and biomass wood supply from        pany in Livingston, Montana, and four years
Patrick Heffernan                                  the national forests, which manage 50 per-       on the Brazilian Amazon, first as a forester and
Task Force Co-Chair, President, PAFTI, Inc.,       cent of the state’s productive forestland.       float-plane pilot, then as a plywood mill man-
Hungry Horse, Montana                              Since 2007, Brink has focused on forest car-     ager. Doug graduated with a B.S. in forestry
    Heffernan began his career in forestry         bon sequestration, carbon life-cycle model-      from Oregon State University. He has been a
in 1976 and graduated with a national di-          ing, forestry protocols, and the potential of    member and officer of numerous forestry, in-
ploma in forestry from the Cumbria College         renewable energy credits for forest landown-     dustry, conservation, and community organi-
of Agriculture and Forestry in 1981. He has        ers, wood manufacturing facilities, and bio-     zations.

                                                                                                    Journal of Forestry • April/May 2008         115
Fred Deneke                                               Gee is the national Woody Biomass Uti-       He is a 1983 graduate of the University of
Staff Advisor, 25x25 Renewable Energy Alli-         lization Team leader for US Forest Service and     Georgia with a B.S. in forest resources man-
ance, Prescott, Arizona                             the national partnership coordinator for forest    agement. Recent assignments include creat-
      Deneke is forestry staff advisor to the       management. He oversees the Woody Bio-             ing additional values from Georgia’s forests
25x25 Renewable Energy Alliance on woody            mass Utilization Team in the development of        through marketing and new product devel-
biomass and biomass energy. He also admin-          sustainable woody biomass strategic planning,      opment, facilitating the development of a
isters a woody biomass cooperative agreement        policy, and implementation of the plan as it       forest biomass energy industry, and initiating
involving the National Association of Conser-       relates to climate change. Gee works directly      Georgia’s new carbon sequestration registry, as
vation Districts, the US Forest Service, and the    with the Chief’s Office and the Washington         well as working with traditional forest prod-
Bureau of Land Management. Deneke retired           Staff Directors Woody Biomass Steering Com-        ucts industries.
from the US Department of Agriculture in            mittee to work across all deputy chief areas as
2005 after 32 years of service with the US For-     well as with the Departments of Interior, En-      Michael Mortimer
est Service and USDA Extension Service. Prior       ergy, and Defense, the Environmental Protec-       Director of Forest Policy, Society of American
to his retirement he was assistant director for     tion Agency, and other USDA agencies. He re-       Foresters, Bethesda, Maryland
the Cooperative Forestry Staff of the US Forest     ceived his B.S. degree in natural resource man-          Mortimer is currently the director of
Service in Washington, DC, where he served          agement from the University of California at       Forest Policy for the Society of American
as national lead for woody biomass utilization      Berkeley, a Certified Silviculturist from Ore-     Foresters. Previously he was on the faculty of
for State and Private Forestry on the US Forest     gon State University and University of Wash-       the Virginia Tech Department of Forestry,
Service Woody Biomass Team and the Inter-           ington, and an M.B.A. from the University of       where he carried out research and teaching
agency Woody Biomass Utilization Group              Phoenix. He has been a member of SAF since         in the areas of public and private land forest
(involving the Forest Service, Department of        1983.                                              management and regulation and published
Interior, Department of Energy, other federal                                                          in the areas of forest and biodiversity con-
agencies, and nongovernmental partners).            John A. Helms                                      servation. He also served as an assistant at-
Prior to his USDA service, Deneke was an as-        Professor Emeritus, University of California,      torney general for the Montana Department
sistant professor at Kansas State University. He    Berkeley, California                               of Natural Resources and Conservation,
                                                          Helms joined the faculty of the School of    where he advised and litigated on behalf of
is a graduate of Colorado State University with
                                                    Forestry, Berkeley, in 1964 and has M.S. and       the agency’s forestry programs. Mortimer
a B.S. in forestry science. He also has M.S. and
                                                    Ph.D. degrees from the University of               received his Ph.D. in forestry from the
Ph.D. degrees in horticulture from Kansas
                                                    Washington, Seattle. At Berkeley he was pro-       University of Montana, his J.D. from the
State University.
                                                    fessor of silviculture and became head of the      Pennsylvania State University, and a B.A.
                                                    department. Much of his research was in tree       from Washington and Jefferson College. He
Christopher Galik
                                                    physiology with emphasis on net uptake of car-     has been an active member and officer of
Research Coordinator for the Climate Change
                                                    bon dioxide by mature trees in relation to         various professional, forestry, and policy-re-
Policy Partnership, Duke University, Durham,
                                                    stresses from water availability, temperature,     lated organizations at both national and state
North Carolina
                                                    and air pollution. He served SAF as chair of the   levels.
      Galik currently serves as research coordi-    Forest Science and Technology Board for two
nator for the Climate Change Policy Part-           terms and as president in 2005. He gave testi-     Steve Ruddell
nership, a collaborative project intended to        mony twice before Congress in 2007 on cli-         Senior Program Officer, World Wildlife Fund,
leverage the resources of Duke University to        mate change effects on forests and wildfires.      Washington, DC
determine practical strategies to respond to cli-   He currently serves on the board of the Cali-           Ruddell is the senior program officer of
mate change. Within this partnership, Galik         fornia Forest Products Commission and in           the Forest Carbon Project for the World
has primary oversight over biological carbon        2007 was appointed a member of the Sustain-        Wildlife Fund’s Global Forests Program. He
sequestration, biofuel, and energy efficiency       able Forestry Initiative’s External Review         was previously the director of Forest Invest-
research activities. Previously, he spent several   Panel.                                             ments and Sustainability for Forecon, Inc.,
years in Washington, DC, as a policy analyst,                                                          a multidisciplinary forest and natural re-
specializing in a variety of environmental is-      Nathan McClure                                     sources consulting company. At Forecon,
sues, including species conservation and fed-       Director, Georgia Forestry Commission’s Forest     Inc., he consulted with clients on invest-
eral forest management and policy. He holds a       Products Utilization, Marketing, and Develop-      ments in forest conservation and sustainabil-
master of environmental management degree           ment Program, Macon, Georgia                       ity initiatives using market-based mecha-
from the Nicholas School of the Environment              McClure currently leads the Georgia           nisms, including carbon asset management
at Duke, with a concentration in forest re-         Forestry Commission’s Forest Products              strategies for trading forest carbon offset
source economics and policy. He received his        Utilization, Marketing, and Development            projects. Ruddell also conducted Chicago
B.A. in biology from Vassar College. Galik has      program and also serves as the director of         Climate Exchange (CCX) forest carbon as-
been an SAF member since 2001.                      Forest Energy for the agency. He has worked        set management services in North and South
                                                    in a variety of positions over the past 24         America, including forest offset project eco-
Edmund A. Gee                                       years with the commission. McClure is a            nomic analyses, development, quantifica-
National Woody Biomass Utilization Team             Georgia Registered Forester and a SAF              tion, verification, and reporting for access-
Leader, US Forest Service, Forest Management,       Certified Forester. He received the SAF            ing the CCX trading platform. He is a
National Forest System, Washington, DC              Presidential Field Forester Award in 2005.         designated trader for CCX carbon financial

116        Journal of Forestry • April/May 2008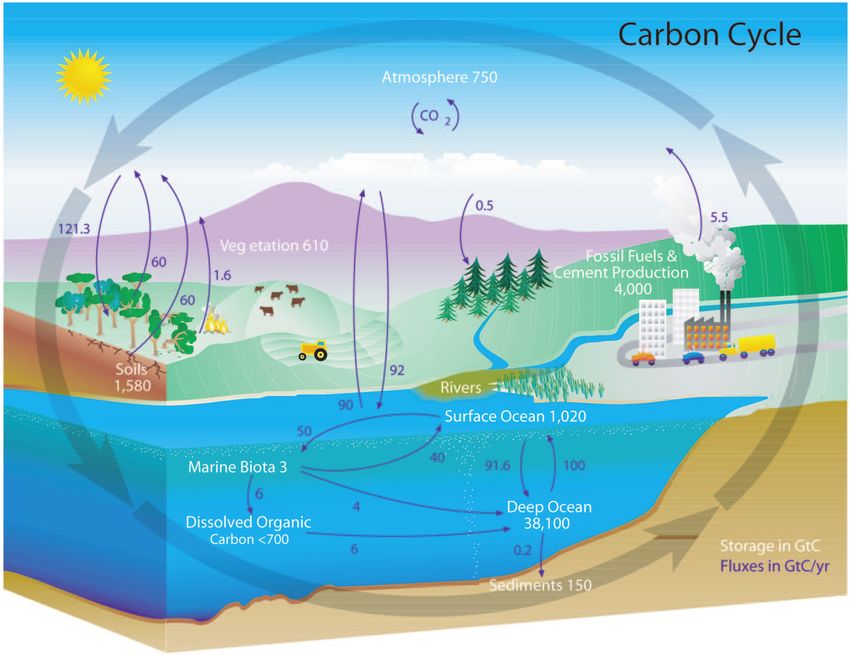
instruments. He is an officer of SAF’s Work-    management organizations and high net               John C. Stewart
ing Group on Bioenergy, Climate Change,         worth individuals. In 2004 Smith began work-        Biomass and Forest Health Program Manager,
and Carbon; the CCX Forestry Committee;         ing in the area of ecosystem services on behalf     Department of Interior, Office of the Secre-
the CCX Crediting Conservation Forestry         of these clients and has conducted forest car-      tary’s Office of Wildland Fire Coordination,
Projects Committee; and the CCX Verifiers       bon modeling and analysis, prepared managed         Washington, DC
Advisory Committee. Ruddell received his        forest carbon offset projects for the CCX mar-            Stewart, the Biomass and Forest Health
B.S. in forest management from Utah State       ket, and written about carbon sequestration         Program manager for the Department of In-
University, and an M.S. in forestry and an      for national audiences. He has served as a con-     terior, represents the department on biomass
M.B.A. in operations management from            sultant to state and local municipalities, forest   utilization for renewable energy under the
Michigan State University. He has com-          owner organizations, carbon registries, profes-     National Energy Plan and leads its efforts at
pleted three years of work toward a Ph.D. in    sional organizations, private landowners,           small wood utilization under the National
forest resource economics.                                                                          Fire Plan. Stewart also led an interdepart-
                                                CCX, and other groups. He also directs a team
                                                                                                    mental team in writing a joint woody bio-
                                                of ecosystem specialists working on market-
Matthew Smith                                                                                       mass policy for the Departments of Interior,
Director of Ecosystem Services, Forecon EcoM-   based incentives for biodiversity and water re-
                                                                                                    Energy, and Agriculture. Previously, Stewart
arket Solutions LLC., Falconer, New York        sources. Smith serves as the chair of the West-     was a forester with the Bureau of Land Man-
     Smith, ACF, CF, EMS-A, is the director     ern New York Chapter of SAF and is a                agement in Washington, DC. He had 22
of Ecosystem Services for Forecon EcoMarket     member of the Forest Carbon Education               years of experience with the US Forest Ser-
Solutions LLC.(Forecon EMS), an approved        Group, the 25x25 Carbon Working Group,              vice throughout California before joining
aggregator for the Chicago Climate Exchange     the Association of Consulting Foresters, and        BLM. Stewart received a B.S. degree from
(CCX), and director of Land Management for      the New York Forest Owners Association. He          the University of California at Berkeley and
Forecon, Inc., a forestry consulting company    holds a B.S. in forest resource management          also worked for Dr. Ed Stone doing basic
and CCX verifier. Since the mid-1990s he has    from the SUNY College of Environmental              research in seedling growth response and
managed the Land Management Department          Science and Forestry and is an auditor and          vegetation descriptions. He has been a mem-
for Forecon, Inc., working with large land      consultant for sustainable forest certification     ber of SAF since 1978 and served as the Bay
management clients such as timber investment    systems.                                            Area Chapter chair in 1990 and 1991.

                                                                                                    Journal of Forestry • April/May 2008    117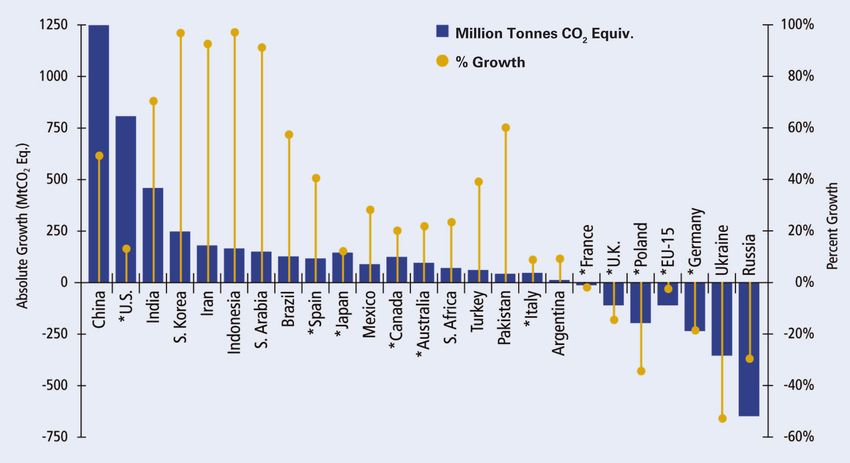
Abbreviations
    BTU       British thermal unit                                       MtC/yr    million tonnes of carbon per year
   CCAR       California Climate Action Registry                       MtCO2 eq.   million tonnes of carbon dioxide equivalents
    CCX       Chicago Climate Exchange                                     MW      megawatt
   CDM        Clean Development Mechanism                                  N2O     nitrous oxide
    CER       certified emission reduction                              NMVOC      nonmethane volatile organic compound; also VOC
    CFC       chlorofluorocarbon                                           NOx     nitrogen oxides
    CH4       methane                                                      OSB     oriented-strand board
     CO       carbon monoxide                                              OTC     over-the-counter market
    CO2       carbon dioxide                                               PFC     perchlorofluorocarbon
 CORRIM       Consortium for Research on Renewable Industrial               ppb    parts per billion
              Materials                                                    ppm     parts per million
    ERU       emission reduction unit                                     REIT     real estate investment trust
  EU ETS      European Union Emissions Trading Scheme                     RGGI     Regional Greenhouse Gas Initiative
      FT      Fischer-Tropsch (gasification process)                        SAF    Society of American Foresters
    GHG       greenhouse gas                                                SF6    sulfur hexafluoride
      Gt      gigatonne (1 billion tonnes)                                     t   tonne, or metric ton (1,000 kilograms, 2,205 pounds,
    GWP       global warming potential (an estimate of the pound-                  or 1.10231 short tons)
              for-pound potential of a gas to trap as much energy as      TDR      transfer of development rights
              carbon dioxide)                                               Tg     teragram (1,000,000 metric tonnes)
      HCFC    hydrochlorofluorocarbon                                    TIMO      timber investment management organization
       HFC    hydrofluorocarbon                                            ton     short ton (2,000 pounds, or 0.907184 metric tonnes)
      HWP     harvested wood product                                   UNFCCC      United Nations Framework Convention on Climate
      IPCC    Intergovernmental Panel on Climate Change                            Change
         JI   Joint Implementation                                         VER     voluntary (or verified) emission reduction
        Mt    million tonnes                                               VOC     volatile organic compound

118      Journal of Forestry • April/May 2008
Executive Summary
F
        orests are shaped by climate. Along        ucts from sustainably managed forests can                The technologies for converting woody
        with soils, aspect, inclination, and el-   be replenished continually, providing a de-        biomass to energy include direct burning,
        evation, climate determines what           pendable supply of both trees and wood             hydrolysis and fermentation, pyrolysis, gas-
will grow where and how well. Changes in           products while supporting other ecological         ification, charcoal, and pellets and bri-
temperature and precipitation regimes              services, such as clean water, clean air, wild-    quettes. Energy uses for wood include ther-
therefore have the potential to dramatically       life habitat, and recreation. The use of wood      mal energy for steam, heating, and cooling;
affect forests nationwide. Climate is also         products also avoids the emissions from the        electrical generation and cogeneration; and
shaped by forests. Eleven of the past 12 years     substituted products, and the forest carbon        transportation fuels.
rank among the 12 warmest in the instru-           remains in storage.                                      The United States may need to build
mental record of global surface temperature              Life-cycle inventory analyses reveal that    1,200 new 300-megawatt power plants dur-
since 1850. The changes in temperature             the lumber, wood panels, and other forest          ing the next 25 years to meet projected de-
have been associated with increasing con-          products used in construction store more           mand for electricity, and coal will likely con-
centrations of atmospheric carbon dioxide          carbon, emit less GHGs, and use less fossil        tinue to be a major source of energy for
(CO2) and other greenhouse gases (GHGs)            energy than steel, concrete, brick, or vinyl,      electricity production. Although some en-
in the atmosphere.                                 whose manufacture is energy intensive and          ergy needs can be met by solar and wind,
      Of the many ways to reduce GHG               produces substantial emissions.                    woody biomass presents a viable short- and
emissions and atmospheric concentrations,                Although wood product substitution           mid-term solution: it can be mixed with coal
the most familiar are increasing energy effi-      does not permanently eliminate carbon              or added to oil- and gas-generated electric
ciency and conservation and using cleaner,         from the atmosphere, it does sequester car-        production processes to reduce GHG emis-
alternative energy sources. Less familiar yet      bon for the life of the product. Landfill man-     sions.
equally essential is using forests to address                                                               Federal funds and venture capital are
                                                   agement can further delay the conversion of
climate change. Unique among all possible                                                             beginning to support the production of cel-
                                                   wood to GHG emissions, or the discarded
remedies, forests can both prevent and re-                                                            lulosic ethanol. Substituting cellulosic bio-
                                                   wood can be used for power generation (off-
duce GHG emissions while simultaneously                                                               mass for fossil fuels greatly reduces GHG
                                                   setting generation by fossil fuel–fired power
providing essential environmental and social                                                          emissions: for every BTU of gasoline that is
                                                   plants) or recycled into other potentially
benefits, including clean water, wildlife hab-                                                        replaced by cellulosic ethanol, total life-cycle
                                                   long-lived wood products. Regardless of the
itat, recreation, forest products, and other                                                          GHG emissions (CO2, methane, and ni-
                                                   particular pathway followed after a prod-
values and uses.                                                                                      trous oxide) are reduced by 90.9 percent.
                                                   uct’s useful life, wood substitution is a viable   The woody biomass is available from several
      Climate change will affect forest ecol-
ogy in myriad ways, with consequences for          technique to immediately address climate by        sources: logging and other residues, treat-
the ability of forests, in turn, to mitigate       preventing GHG emissions.                          ments to reduce fuel buildup in fire-prone
global warming. This report summarizes                   Biomass Substitution. The use of wood        forests, fuelwood, forest products industry
mitigating options involving US forests and        to produce energy opens two opportunities          wastes, and urban wood residues. Planta-
examines policies relating to forests’ role in     to reduce GHG emissions. One involves us-          tions of short-rotation, rapid-growing spe-
climate change. It also recommends mea-            ing harvest residue for electrical power gen-      cies, such as alder, cottonwood, hybrid pop-
sures to guide effective climate change miti-      eration, rather than allowing it to accumu-        lar, sweetgum, sycamore, willow, and pine,
gation through forests and forest manage-          late and decay on site or removing it by open      are another source.
ment, carbon-trading markets, and bio-             field burning. The other is the substitution             Wildfire Behavior Modification. Re-
based renewable energy.                            of woody biomass for fossil fuels.                 ducing wildland fires, a major source of
                                                         The use of biomass fuels and bio-based       GHG emissions, prevents the release of
Preventing GHG Emissions                           products can reduce oil and gas imports and        carbon stored in the forest. One modest
      Forests and forest products can prevent      improve environmental quality. Biomass             wildfire—the July 2007 Angora wildfire in
GHG emissions through wood substitution,           can offset fossil fuels such as coal, natural      South Lake Tahoe, on 3,100 acres of forest-
biomass substitution, modification of wild-        gas, gasoline, diesel oil, and fuel oil. At the    land—released an estimated 141,000 tonnes
fire behavior, and avoided land-use change.        same time, its use can enhance domestic eco-       of carbon dioxide and other GHGs into the
      Wood Substitution. Substituting wood         nomic development by supporting rural              atmosphere, and the decay of the trees killed
for fossil fuel–intensive products addresses       economies and fostering new industries             by the fire could bring total emissions to
climate change in several ways. Wood prod-         making bio-based products.                         518,000 tonnes. This is equivalent to the

                                                                                                      Journal of Forestry • April/May 2008       119
GHG emissions generated annually by                for forest use at $415 per acre and for urban       tend to have higher capacity for carbon up-
105,500 cars.                                      use at $36,216. Landowners generally con-           take and storage because of their higher leaf
      In 2006, wildfires burned nearly 10          vert forestland to residential and commercial       area.
million acres in the United States, and vir-       uses to capture increasing land values, but               Enhancement of sequestration capacity
tually all climate change models forecast an       when forests are damaged by wildfire, in-           depends on ensuring full stocking, main-
increase in wildfire activity. Under extreme       sects, or other disturbances, selling the land      taining health, minimizing soil disturbance,
fire behavior scenarios, which could be exac-      for development rather than investing for           and reducing losses due to tree mortality,
erbated by climate change, increased accu-         long-term reforestation can be attractive.          wildfires, insect, and disease. Management
mulations of hazardous forest fuels will           Since climate change may increase the prev-         that controls stand density by prudent tree
cause ever-larger wildfires. The proximity of      alence of such disturbances, forestland con-        removal can provide society with renewable
population centers to wildlands significantly      version may increase in the future.                 products, including lumber, engineered
increases the risk and consequences of wild-             Moreover, conversion of forests to agri-      composites, paper, and energy, even as the
fire, including the release of GHGs. Wild-         cultural lands is likely if energy policies favor   stand continues to sequester carbon. Above
fires in the United States and in many other       corn-based ethanol over cellulose-based eth-        all, enhancing the role of forests in reducing
parts of the world have been increasing in         anol. Tax policies that increase the cost of        GHGs requires keeping forests as forests, in-
size and severity, and thus future wildfire        maintaining forestland also promote con-            creasing the forestland base through affores-
emissions are likely to exceed current levels.     version, as do the short-term financial objec-      tation, and restoring degraded lands.
      Three strategies to reduce wildfires and     tives of some new forest landowners.                      Two active forest management ap-
their GHG emissions can address that trend:              Because it is unlikely that publicly          proaches to addressing climate change are 1)
      • pretreatment of fuel reduction ar-         owned forestland will increase, efforts to          mitigation, in which forests and forest prod-
eas—that is, removing some biomass before          prevent GHG releases from forestland con-           ucts are used to sequester carbon, provide
using prescribed fire;                             version must focus on privately owned for-          renewable energy through biomass, and
      • smoke management—that is, adjust-          ests. New products, such as cellulosic etha-        avoid carbon losses; and 2) adaptation,
ing the seasonal and daily timing of burns         nol and new engineered wood products,               which involves positioning forests to be-
and using relative low-severity prescribed         may add value to working forests. Sustain-          come healthier. Adaptive strategies include
fires to reduce fuel consumption; and              able utilization of working forests for a com-      increasing resistance to insects, diseases, and
      • harvesting small woody biomass for         bination of wood products, including bioen-         wildfires; increasing resilience for recovering
energy, or removing some larger woody ma-          ergy, can improve forest landowners’ returns        after a disturbance; and assisting migra-
terial (over 10 centimeters, or 4 inches, in       on their land, bolster interest in forest man-      tion—facilitating the transition to new
diameter) for traditional forest products and      agement, and prevent conversion to other            conditions by introducing better-adapted
burning residuals.                                 uses. Credits for forest carbon offset              species, expanding genetic diversity, en-
      Active forest and wildland fire manage-      projects, if trading markets develop, may           couraging species mixtures, and providing
ment strategies can dramatically reduce CO2        provide the additional income to encourage          refugia. This last kind of intervention is
emissions while also conserving wildlife hab-      private landowners to retain forests.               highly controversial, however, because ac-
itat, preserving recreational, scenic, and                                                             tion would be based on projections for
wood product values, and reducing the              Reducing Atmospheric GHGs                           which outcomes are highly uncertain.
threat of wildfires to communities and crit-            Forests can also reduce GHG concen-                  Traditional silvicultural treatments fo-
ical infrastructure.                               trations by sequestering atmospheric carbon         cused on wood, water, wildlife, and aesthetic
      Avoided Land-Use Change. More car-           in biomass and soil, and the carbon can re-         values are fully amenable to enhancing car-
bon is stored in forests than in agricultural or   main stored in any wood products made               bon sequestration and reducing emissions
developed land. Preventing land-use change         from the harvested trees. Because the area of       from forest management. Choices regarding
from forests to nonforest uses is thus another     US forests is so vast—33 percent of the land        even-aged and uneven-aged regimes, species
way to reduce GHGs. Globally, forestland           base— even small increases in carbon se-            composition, slash disposal, site prepara-
conversions released an estimated 136 bil-         questration and storage per acre add up to          tion, thinning, fertilization, and rotation
lion tonnes of carbon, or 33 percent of the        substantial quantities.                             length can all be modified to increase carbon
total emissions, between 1850 and 1998—                 Sequestration in Forests. The capacity         storage and prevent emissions. Because for-
more emissions than any other anthropo-            of stands to sequester carbon is a function of      ests are the most efficient land use for carbon
genic activity besides energy production.          the productivity of the site and the potential      uptake and storage, landowners with plant-
      Forest conversion and land develop-          size of the various pools—soil, litter, down        able acres and degraded areas that can be
ment liberate carbon from soil stocks. For         woody material, standing dead wood, live            restored to a productive condition have a
example, soil cultivation releases 20 to 30        stems, branches, and foliage. Net rates of          significant opportunity to sequester carbon.
percent of the carbon stored in soils. Addi-       CO2 uptake by broad-leaf trees are com-                   Storage in Wood Products. Harvest-
tional emissions occur from the loss of the        monly greater than those of conifers, but be-       ing temporarily reduces carbon storage in
forest biomass, both above-ground vegeta-          cause hardwoods are generally deciduous             the forest by removing organic matter and
tion and tree roots.                               while conifers are commonly evergreen, the          disturbing the soil, but much of the carbon
      In the United States, a major threat to      overall capacity for carbon sequestration can       is stored in forest products. The carbon in
forestland is the rise in land values for low-     be similar. Forests of all ages and types have      lumber and furniture, for example, may not
density development. Forestland in the US          remarkable capacity to sequester and store          be released for decades; paper products have
Southeast, for example, has been appraised         carbon, but mixed-species, mixed-age stands         a shorter life, except when disposed of in a

120        Journal of Forestry • April/May 2008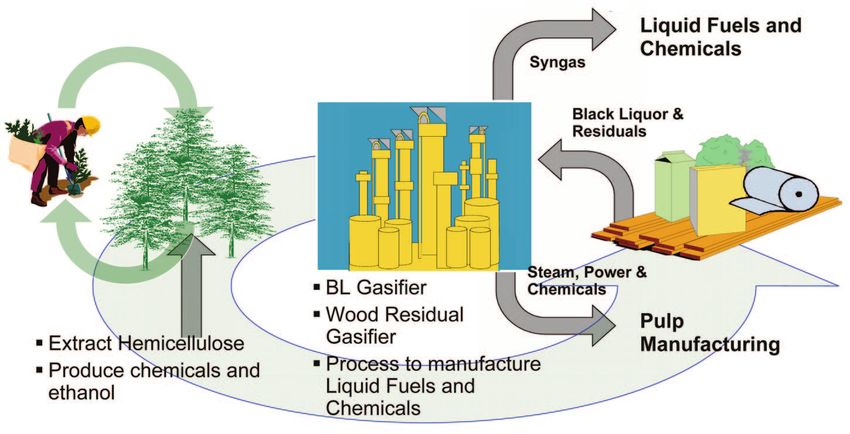
landfill. Storage of carbon in harvested wood      tiative, a cap-and-trade program, limits eli-          occurrence of wildfires and how they are
products is gaining recognition in domestic        gibility to afforestation. The other, the Cal-         managed.
climate mitigation programs, though ac-            ifornia Climate Action Registry, permits          3.   Forest management and use of wood
counting for the carbon through a product’s        credits for afforestation, managed forests,            products add substantially to the capacity
life cycle is problematic.                         and forest conservation. Voluntary markets             of forests to mitigate the effects of climate
      The climate change benefits of wood          for forest carbon include emissions trading            change.
products lie in the combination of long-           transactions through the Chicago Climate          4.   Greenhouse gas emissions can be re-
term carbon storage with substitution for          Exchange and over-the-counter transac-                 duced through the substitution of bio-
other materials with higher emissions. Be-         tions.                                                 mass for fossil fuels to produce heat, elec-
cause wood can substitute for fossil fuel-in-            All credit programs must ensure that             tricity, and transportation fuels.
tensive products, the reductions in carbon         the net amount of carbon sequestered is           5.   Avoiding forest conversion prevents the
emissions to the atmosphere are compara-           additional to what would have occurred                 release of GHG emissions, and adding to
tively larger than even the benefit of the car-    without the project. Methods are still be-             the forestland base through afforestation
bon stored in wood products. This effect—          ing developed to separate the effects of               and urban forests sequesters carbon.
the displacement of fossil fuel sources—           management action on a forest from those          6.   Existing knowledge of forest ecology and
could make wood products the most                  of environmental conditions, and deter-                sustainable forest management is ade-
important carbon pool of all.                      mining the net change in carbon stocks                 quate to enable forest landowners to en-
                                                   must include not only all management ac-               hance carbon sequestration if there are
Forest Carbon Offset Projects                      tions, such as harvesting, tree planting,              incentives to do so and if carbon and car-
      The role of forests and forest products      and fertilizing, but also the effects of               bon management have value that exceeds
in preventing and reducing GHGs is be-             weather, wildfire, insects, and disease.               costs.
ginning to gain recognition in market-based              A forest project must also demonstrate      7.   How global voluntary and mandatory
policy instruments for climate change miti-        permanence. Ensuring permanence can be                 markets develop will play a significant
gation. Forestry is one category of projects       difficult, however, since some sequestered             role in establishing the price of carbon
that can create carbon dioxide emission re-        carbon might be released through natural               dioxide and thus creating the incentives
duction credits for trading to offset emis-        events, such as wildfires and hurricanes. An-          to ensure that forests play a significant
sions from industrial and other polluters.         other issue is leakage—the indirect effects            role in climate change mitigation.
Depending on the program, several project
                                                   that a project might have in, for example,
types may be eligible: afforestation, refores-
                                                   altering the supply of forest products and              Given those facts, society’s current re-
tation, forest management to protect or en-
                                                   consequently the total area of forestland.        luctance to embrace forest conservation and
hance carbon stocks, harvested wood products
                                                         The current forest carbon accounting        management as part of the climate change
that store carbon, and forest conservation or
                                                   principles were developed before forest car-      solution seems surprising. It is beyond argu-
protection.
                                                   bon offsets were recognized as a way for di-      ment that forests play a decisive role in sta-
      Two types of renewable energy credits
                                                   rect emitters of CO2 to meet emission re-         bilizing the Earth’s climate and that prudent
are becoming available—for using wood-
                                                   duction targets. As a result, they do not         management will enhance that role. Forest
based building materials instead of concrete,
                                                   adequately address all aspects of using forests   management can mitigate climate change
steel, and other nonrenewable building ma-
                                                   to prevent and reduce GHG emissions.              effects and, in so doing, buy time to re-
terials; and for using wood-based biofuels,
                                                   Emerging standards for participation in car-      solve the broader question of reducing the
such as wood waste, instead of fossil fuels to
generate electric power.                           bon markets may provide consistent rules          nation’s dependence on imported fossil
      Global carbon markets, however, have         that are appropriate for managed forests and      fuels.
not yet fully embraced the potential of for-       promote additional and long-term forest                 The challenge is clear, the situation is
ests and forestry to mitigate climate change.      carbon sequestration benefits.                    urgent, and opportunities for the future
The Kyoto Protocol, for example, intro-                                                              are great. History has repeatedly demon-
duced the concept of trading GHG emis-
                                                   Opportunities and Challenges                      strated that the health and welfare of hu-
sions by sources for GHG removals by sinks,        for Society, Landowners, and                      man society are fundamentally dependent
but it limits the role of forestry to afforesta-   Foresters                                         on the health and welfare of a nation’s for-
tion and reforestation. Phase I of the Euro-            Seven conclusions are apparent from          ests. Society at large, the US Congress,
pean Union Emissions Trading Scheme al-            the analyses presented in this report:            state legislators, and policy analysts at in-
lows global trading in carbon dioxide                                                                ternational, federal, and state levels must
emission reductions to help EU countries           1. The world’s forests are critically impor-      not only appreciate this fact but also rec-
reach their targets, but forestry activities are      tant in carbon cycling and balancing the       ognize that the sustainable management of
not eligible.                                         atmosphere’s carbon dioxide and oxygen         forests can, to a substantial degree, miti-
      Domestic efforts to date include two            stocks.                                        gate the dire effects of atmospheric pollu-
regulated emissions trading programs. The          2. Forests can be net sinks or net sources of     tion and global climate change. The time
Northeast’s Regional Greenhouse Gas Ini-              carbon, depending on age, health, and          to act is now.

                                                                                                     Journal of Forestry • April/May 2008         121
Preface
I
     n March 2007, on the advice of the          plications for forests and their manage-           able energy to contribute to mitigation of
     Society of American Foresters’ Com-         ment;                                              greenhouse gas emissions, and strategies to
     mittee on Forest Policy, the SAF                 • briefly assess and summarize climate        minimize the vulnerability and promote ad-
Council created the Climate Change and           change mitigating options involving forests,       aptation of forests to impacts from climate
Carbon Sequestration Task Force. Coun-           including forests’ potential as a carbon sink      change.
cil charged the task force with evaluating       (with cost comparisons to other methods, if             Prior to publication, the manuscript
the implications of global climate change        information is available), and domestic and        of this report was reviewed, in whole or in
on forests and forest management, ad-            international policies relating to forests’ role   part, by more than 20 scientists. Members
dressing the role of forestry and forests in     in climate change; and                             of the task force thank all of the reviewers;
climate change, offering recommenda-                  • recommend possible policy measures          their efforts increased the report’s accu-
tions for SAF policy activities, and the fol-    to guide effective climate change mitigation       racy and scope. This report and the task
lowing tasks:                                    through forests and forest management, ad-         force’s other products are the result of
     • briefly assess and summarize the lit-     dressing existing and potential carbon-            hundreds of hours by dedicated SAF vol-
erature on the global climate change im-         trading markets, opportunities for renew-          unteers.

124       Journal of Forestry • April/May 2008
chapter 1

Global Climate Change
G
          lobal temperatures have fluctuated    natural forces are causing changes in the       compounds (NMVOCs, or simply VOC-
          over the past 400,000 years (Figure   Earth’s climate. Rather, our analysis focuses   s),and particulate matter or aerosols. NOx,
          1-1) (US EPA 2007b). Neverthe-        on how climate change may be affecting for-     VOCs, and CH4 contribute to the forma-
less, Earth is currently warmer than it has     ests and how managed forests can decrease       tion of another greenhouse gas, ozone
been in its recent past. The Intergovernmen-    atmospheric GHG emissions and prevent           (smog), in the troposphere. Most GHGs are
tal Panel on Climate Change (IPCC) found        GHGs from entering the atmosphere.              generally well mixed around the globe and
that “eleven of the last twelve years (1995–                                                    have global warming effects.
2006) rank among the 12 warmest years in        Greenhouse Gases and the                              GHGs have different atmospheric lives.
the instrumental record of global surface       Greenhouse Effect                               For example, water vapor generally lasts a
temperature (since 1850)” (Solomon et al.            The biophysical process altering Earth’s   few days, methane lasts approximately 12
2007, 5). The National Research Council         natural “greenhouse effect” begins when         years, nitrous oxide 114 years, and sulfur
concluded “with a high level of confidence      greenhouse gases in the “atmosphere allow       hexafluoride 3,200 years; carbon dioxide’s
that global mean surface temperature was        the Sun’s short wavelength radiation to pass    atmospheric life varies (Bjørke and Seki
higher during the last few decades of the       through to the Earth’s surface. . . . Once      2005).
20th century than during any comparable         the radiation is absorbed by the Earth and            GHGs also have different global cycles.
period during the preceding four centuries”     re-emitted as longer wavelength radiation,      For example, the carbon cycle (Figure 1-2)
and, with less confidence, that “tempera-       GHGs trap the heat in the atmosphere”           includes geologic, biologic, and atmospheric
tures at many, but not all, individual loca-    (Leggett 2007, 22).                             carbon pools and the cycling that occurs
tions were higher during the past 25 years           Greenhouse gases affected by human         among them (Harmon 2006). Human ac-
than during any period of comparable            activities include carbon dioxide (CO2),        tivities release carbon as carbon dioxide by
length since a.d. 900” (NRC 2006, 3).           methane (CH4), nitrous oxide (N2O), and         various methods (described below). These
      As Figure 1-1 indicates, changes in       certain fluorinated compounds— chlo-            releases alter carbon pools; the most impor-
Earth’s temperature have been associated        rofluorocarbons (CFC), hydrochlorofluoro-       tant of these alterations is the transfer of car-
with atmospheric carbon dioxide levels in       carbons (HCFC), hydrofluorocarbons              bon from its geologic pool to its atmospheric
the atmosphere. Research indicates that this    (HFC), perchlorofluorocarbons (PFC), and        pool. Forests play an important role in the
and other important gases have also in-         sulfurhexaflouride (SF6). Other GHGs not        carbon cycle because of photosynthesis.
creased recently (Solomon et al. 2007). For     directly affected by human activities include         Photosynthesis is the basic process by
example, between the preindustrial period       water vapor (the most abundant greenhouse       which plants capture carbon dioxide from
(c. 1750) and 2005, carbon dioxide in-          gas), plus carbon monoxide (CO), nitrogen       the atmosphere and transform it into sugars,
creased from about 280 parts per million        oxides (NOx), nonmethane volatile organic       plant fiber, and other materials. Within a
(ppm) to 379 ppm; methane increased from
about 715 parts per billion (ppb) to 1,774
ppb; and nitrous oxide increased from about
270 ppb to 319 ppb (Solomon et al. 2007).
      IPCC, “the preeminent international
body charged with periodically assessing
technical knowledge of climate change”
(Leggett 2007, 3) and the co-winner of the
2007 Nobel Peace Prize, concluded that
“the global increases in carbon dioxide are
due primarily to fossil fuel use and land use
change, while those of methane and nitrous
oxide are primarily due to agriculture,” and
that these human activities and their by-
products are causing Earth to warm (So-
lomon et al. 2007, 2). This report does not
evaluate the validity of those conclusions,
the certainty of the predictions, or whether    Figure 1-1. Changes in temperature and carbon dioxide (Source: US EPA 2008).

                                                                                                Journal of Forestry • April/May 2008        125
tremely slowly (when carbon is sequestered
                                                                                                                 in forest products). In addition to being se-
                                                                                                                 questered in vegetation, carbon is also se-
                                                                                                                 questered in forest soils. Soil carbon accu-
                                                                                                                 mulates as dead vegetation is added to the
                                                                                                                 surface or as roots “inject” it into the soil.
                                                                                                                 Soil carbon is slowly released to the atmo-
                                                                                                                 sphere as the vegetation decomposes (Gorte
                                                                                                                 2007).
                                                                                                                      Since GHGs affect the radiative balance
                                                                                                                 of Earth in similar ways, they can be com-
                                                                                                                 pared using two measures, radiative forcing
                                                                                                                 (externally imposed changes in Earth’s radi-
                                                                                                                 ative balance) or global warming potentials
                                                                                                                 (GWPs); Leggett (2007, 23) calls the latter
                                                                                                                 “an easier but imperfect approximation.”
                                                                                                                 GWPs are based on the properties of the
                                                                                                                 most important GHG, carbon dioxide,
                                                                                                                 which is emitted from human sources in by
                                                                                                                 far the greatest quantities (US EPA 2007b).
                                                                                                                 GWPs estimate the pound-for-pound po-
                                                                                                                 tential of a gas to trap as much energy as
                                                                                                                 carbon dioxide; thus a GWP of 23 indicates
Figure 1-2. Carbon cycle, c. 2004. Black numbers indicate how much carbon is stored in                           that 1 pound of this gas traps as much energy
various pools, in billions of tonnes (i.e., gigatonnes, Gt). Purple numbers indicate how much                    as 23 pounds of carbon dioxide (US EPA
carbon moves between pools each year. The diagram does not include the approximately                             2007b). The global warming potentials of
70 Gt of carbonate rock and kerogen (oil shale) in sediments (Source: http://                                    the other principal GHGs are methane, 23;
earthobservatory.nasa.gov/Library/CarbonCycle/carbon_cycle4.html).                                               nitrous oxide, 296; hydrofluorocarbons,
                                                                                                                 120 to 12,000; perfluorocarbons, 5,700 to
given land area, this process is known as                        ton ⫽ 1,000 kilograms ⫽ 2,205 pounds). In       11,900; and sulfur hexafluoride, 22,200
gross primary production. At the same time,                      the process of photosynthesis, trees and        (Gerrard 2007).
plant respiration, which is necessary for                        other plants take CO2 from the air and in
plant growth and metabolism, liberates car-                      the presence of light, water, and nutrients     Greenhouse Gas Emissions
bon dioxide back into the atmosphere. The                        manufacture carbohydrates that are used for           Both natural processes and human ac-
resulting net gain of solid carbon com-                          metabolism and growth of both above-            tivities produce GHGs. Here, drawing on
pounds in plant fiber, known as net primary                      ground and below-ground organs, such as         Leggett (2007), we address only the human-
production, can be measured using estab-                         stems, leaves, and roots. Concurrently with     related sources of the principal GHGs.
lished forest mensuration techniques. The                        taking in CO2, trees utilize some carbohy-            • Carbon dioxide: combustion of fossil
overall accumulation of carbon within the                        drates and oxygen in metabolism and give        fuels, solid waste, wood, and wood products;
ecosystem is known as net ecosystem pro-                         off CO2 in respiration. Vegetation removes      manufacture of cement, steel, aluminum,
duction (Table 1-1) and includes other net                       a net of 500 million MtCO2 (i.e., net pri-      etc.
carbon gains, many of which accrue in the                        mary production) from the atmosphere each             • Methane: coal mining, natural gas
soil and are difficult to measure accurately.                    year. When vegetation dies, carbon is re-       handling, trash decomposition in landfills,
      Trees and other vegetation store                           leased to the atmosphere. This can occur        and livestock digestion.
610,000 tonnes (Mt, or 610 gigatonnes, Gt)                       quickly (in a fire), slowly (as fallen trees,         • Nitrous oxide: nitrogen fertilizers, in-
of carbon (Figure 1-2) (1 tonne ⫽ 1 metric                       leaves, and other detritus decompose), or ex-   dustrial manufacturing, and combustion of
                                                                                                                 solid waste and fossil fuels.
Table 1-1. Ecosystem productivity terms.                                                                               • Hydrofluorocarbons, perfluorocarbons,
                                                                                                                 and sulfur hexafluoride: commercial, indus-
                                                                                                                 trial, and household products.
Term                                                                  Definition                                       Carbon dioxide is the most prevalent of
Net primary production Net uptake of carbon by plants in excess of respiratory loss.                             the GHGs produced by human-related ac-
Heterotrophic respiration Respiratory loss by above- and below-ground heterotrophs (herbivores, decomposers).    tivities. In 2000, it constituted approxi-
Net ecosystem production Net carbon accumulation within the ecosystem after all gains and losses are accounted   mately 72 percent of human-related GHG
                            for, typically measured using ground-based techniques.
Net ecosystem exchange Net flux of carbon between the land and the atmosphere, typically measured using          emissions. Methane (adjusted for GWP
                            eddy covariance techniques. The term is equivalent to net ecosystem production       equivalents) constituted 18 percent, and
                            but the quantities are not always identical because of measurement and scaling       (adjusted for GWP equivalents) nitrous ox-
                            issues.
                                                                                                                 ide constituted 9 percent (Leggett 2007).
Source: Birdsey, US Forest Service, pers. comm., January 2008.                                                   Table 1-2 indicates the human-related activ-

126            Journal of Forestry • April/May 2008
Table 1-2. Worldwide GHG emissions (CO2, CH4, N2O, PFCs, HFCs, SF6) by economic
sector, 2000.
Sector MtCO2 eq. Percentagea
Energy 24,722.3 59.4
Electricity 10,276.9 24.7
Transportation 4,841.9 11.6
Manufacturing 4,317.7 10.4
Other fuel combustion 3,656.5 8.8
Fugitive emissionsb 1,629.3 3.9
Land-use change and deforestation 7,618.6 18.3
Agriculture 5,603.2 13.5
Waste 1,465.7 3.5
Industrial processes 1,406.3 3.4
International bunker fuelsc 824.3 2.0 Figure 1-4. US GHG emissions (Source: US
Total 41,640.5 100.1
EPA 2007b, ES-4).
a
Percentages add up to more than 100 due to rounding.
b
NO2 data not available. Fugitive emissions include the leaking of refrigerants from air-conditioning and refrigeration systems.
c
Fuels used by aircraft and ships.
Source: Data from WRI 2007.
ities responsible for the 41,640.5 million
tonnes of carbon dioxide equivalents
Table 1-3. Ranking of emitters of GHGs (CO2, CH4, N2O, HFCs, PFCs, SF6), 2000. (MtCO2 eq.) of worldwide GHG emissions
in 2000 (WRI 2007).
Table 1-3 lists the national shares of the
Percentage of
Country MtCO2 eq. world GHGs world’s GHGs. Relatively few countries pro-
duce the most global GHG emissions, in ab-
1. United States 6,928 20.6 solute terms, but the “largest GHG emitters
2. China 4,938 14.7
3. Russia 1,915 5.7 have large economies, large populations, or
4. India 1,884 5.6 both” (Baumert et al. 2005, 11).
5. Japan 1,317 3.9 Developing countries have the highest
6. Germany 1,009 3.0
7. Brazil 851 2.5 emissions growth rates (Figure 1-3). For ex-
8. Canada 680 2.0 ample, Indonesia’s and South Korea’s GHG
9. United Kingdom 654 1.9
10. Italy 531 1.6
emissions increased 97 percent from 1990 to
Top 10 countries 20,707 61.5 2002, Iran’s increased 93 percent, and Saudi
Rest of world 12,958 38.5 Arabia’s 91 percent (Baumert et al. 2005).
Developed countries 17,355 52 China’s emissions grew by about 50 percent
Undeveloped countries 16,310 48
from 1990 to 2002, but estimates indicate
Note: The total world MtCO2 equivalent is different from that in Table 1-2 because Table 1-3 excludes land-use change, about 35 percent growth for 2003 and 2004
deforestation, and international bunker fuels (see Baumert et al. 2005, 12). This table presents the latest available GHG emissions
information; countries’ current GHG emissions may differ significantly. alone (Baumert et al. 2005). Although de-
Source: Adapted from Baumert et al. 2005, 12. veloped countries’ increases are significant in
absolute terms, their growth rates are smaller
than those of many undeveloped countries.
In 2005, US GHG emissions were
7,260.4 million (7,260.4 teragrams, Tg)
MtCO2 equivalents (US EPA 2007b). From
1990 to 2005, US emissions rose 16.3 per-
cent as the US gross national domestic prod-
uct increased by 55 percent (Figure 1-4) (US
EPA 2007b). However, because of the sheer
size of US emissions, even this relatively
small percentage increase in emissions (com-
pared with other countries) contributed
considerably to total GHG emissions. For
example, US GHG emissions increases from
1990 to 2002 “added roughly the same
amount of CO2 to the atmosphere (863
MtCO2) as the combined 64 percent emis-
sions growth from India, Mexico, and Indo-
Figure 1-3. Carbon dioxide emissions growth, 1990 –2002. * CO2 plus five other GHGs nesia (832 MtCO2)” (Baumert et al.
(Source: Baumert et al. 2005, 15). 2005, 13).
Journal of Forestry • April/May 2008 127Future Greenhouse Gas and nomic growth has been so fast that the date from 1.8° to 4.0°C (3.25° to 7.2°F) for the
Global Temperature Estimates was moved up to 2009 or 2010. In fact, the 2090 –2099 decade (Solomon et al. 2007).
Since “emissions projections require es- most recent reports indicated that China Decades after the first generally recog-
would surpass the United States’ CO2 out- nized indications of global warming, the sci-
timating factors such as population, eco-
put by the end of 2007 and that by 2032, ence of climate change remains contentious.
nomic growth, and technological change,
“CO2 emissions . . . from China alone will While some scientists contend that the
they are inherently uncertain. . . . Further-
be double the CO2 emissions which will Earth’s atmosphere is warming, polar ice
more, past projections have a weak success
come from . . . [the United States,] Canada, caps are shrinking, and sea levels are rising
record” (Baumert et al. 2005, 18). Never- Europe, Japan, Australia, and New Zealand because of anthropogenic increases in the
theless, all trends point to increasing GHG [combined]” (Vidal 2007). concentrations of greenhouse gases, some
emissions and global temperatures. For ex- IPCC estimates that emissions will re- say that the presumed causes are wrong, the
ample, the US Energy Information Admin- sult in global warming of about 0.2°C reports overstated, and the predictions mis-
istration’s “midrange” scenario projects that (about 0.36°F) per decade for the next two taken (e.g., Singer 2008; Bast and Taylor
global emissions will rise 57 percent from decades (and even if emissions were held at 2007; McKitrick et al. 2007). What is not at
2000 to 2025 (Baumert et al. 2005). 2000 levels, a warming of 0.1°C (about issue, however, is that forests play a central
The increases are not expected to occur 0.18°F) per decade) (Solomon et al. 2007). role in the balance of carbon stocks on Earth,
uniformly. For example, China was once ex- Longer-term predictions are much less cer- and the policies now being developed and
pected to surpass the United States as the tain, but IPCC scenario projections estimate implemented to address climate change will
world’s leading GHG emitter in 2020 (Ger- that global average surface temperature in- be the more effective the more they incorpo-
rard 2007). However, the country’s eco- creases (relative to 1980 –1999) will range rate forestry.
128 Journal of Forestry • April/May 2008chapter 2
Potential Effects of Climate
Change on Forests
F
orests are shaped by climate. Along costs of wildfire are expected to increase dra- under elevated atmospheric carbon dioxide
with soils, aspect, inclination, and el- matically. Importantly, the specific implica- concentrations, especially on nutrient-poor
evation, climate determines what tions of climate change for forests will vary sites (Oren et al. 2001; Wittig et al. 2005).
will grow where and how well. Changes in greatly from place to place. Apart from effects on individual productivity,
temperature and precipitation regimes increased atmospheric carbon dioxide concen-
therefore have the potential to dramatically Ecological Effects trations are also expected to alter leaf chemical
affect forests nationwide. Global mean surface air temperature is composition, affecting herbivore fitness as a re-
Climate is also shaped by forests. Forest expected to increase over the next century, as sult (Saxe et al. 1998). These latter ramifica-
stands act as windbreaks, and forest canopies described in Chapter 1. Temperature mini- tions have been shown to vary across species
influence the interactions of soil, water, and mums are expected to increase faster than and other environmental variables, such as
temperature. Forests can act as a carbon sink, maximums, and the growing season is likely temperature (Lincoln et al. 1993; Bezemer and
helping to offset greenhouse gas emissions; in to lengthen, especially in the middle and Jones 1998; Zvereva and Kozlov 2006).
2003, US forests sequestered more than 750 high latitudes (IPCC 2007). Changes in pre- Either in addition to or in concert with
million tonnes of CO2 equivalent (US EPA cipitation are likewise expected: tropical and increased concentrations of atmospheric car-
2005). Alternatively, afforestation in certain high-latitude areas may experience increases bon dioxide, climate change–induced shifts in
areas may reduce surface reflectivity, or albedo, in precipitation, and the subtropics and temperature and precipitation regimes are ex-
such that any reductions in radiative forcing middle latitudes are expected to experience pected to affect individual trees’ fitness and
(warming) gained from increases in carbon se- decreases (IPCC 2007). Heat waves will
productivity as well (Saxe et al. 1998; Nabuurs
questration are offset (Betts 2000). The inter- likely be greater in terms of frequency, inten-
et al. 2002; Sacks et al. 2007). Changes in ab-
relationship between forests and climate sity, and duration, while precipitation will
solute temperatures (e.g., frost, heat stress) as
means that dramatic change to one will influ- become more intense but with longer inter-
well as changes in the form, timing, and
ence the other. In some situations, this feed- vals between events.
amount of precipitation (e.g., snow versus
back is negative, dampening further iterations. Climate change and an increased concen-
rain, drought versus flood) can affect forests
In other situations, however, this feedback is tration of atmospheric carbon will affect forests
directly. In boreal, temperate, and Mediterra-
positive, building upon and exacerbating the on multiple levels. At the individual tree level,
an increase in atmospheric carbon dioxide nean European forests, temperatures are ex-
initial change (e.g., Woodwell et al. 1998;
Fleming et al. 2002). concentrations is expected to lead to increased pected to increase along with precipitation,
The role of climate as a driver in ecosys- levels of net primary productivity and an in- raising productivity (Nabuurs et al. 2002).
tem function is well established (e.g., Stenseth crease in overall biomass accumulation, pri- Other regions may experience increasing tem-
et al. 2002). A changing climate will affect for- marily in the form of fine root production but peratures along with a decrease in absolute pre-
ests in several ways, ranging from direct effects potentially also through allocation to woody cipitation or a shift in the form of precipita-
of temperature, precipitation, and increased biomass (Ainsworth and Long 2005; Calfapi- tion, possibly changing the seasonal
atmospheric concentrations of carbon dioxide etra et al. 2003; Norby et al. 2002, 2004, availability of water in the form of snowpack or
on tree growth and water use, to altered fire 2005). The exact response to elevated carbon snowmelt and causing seasonal water shortages
regimes and changes in the range and severity dioxide concentrations, however, may vary by (Barnett et al. 2005; Trenberth et al. 2007). A
of pest outbreaks. Climate change has the po- species and locale (Norby et al. 2002; Korner water shortage can also counteract any produc-
tential to transform entire forest systems, shift- et al. 2005; Handa et al. 2005). In forests tivity benefits from increased atmospheric car-
ing forest distribution and composition. Eco- where photosynthesis is limited by CO2 con- bon dioxide concentrations or a longer grow-
nomically, climate change is expected to centrations, the degree to which such an in- ing season (Wullschleger et al. 2002). Other
benefit the timber products sector (e.g., Irland crease can be sustained over time will be lim- atmospheric constituents can further exacer-
et al. 2001). Overall harvests in the United ited by other factors, such as the availability of bate temperature and precipitation stressors.
States are expected to increase. In terms of lost nitrogen or water (Kramer 1981; Norby et al. In particular, nitrogen deposition rates and
timber value, suppression costs, and loss of rec- 1999; J.G. Hamilton et al. 2002). Active fer- ozone concentrations, which are expected to
reation and ecosystem services, however, the tilization may allow for increased productivity rise (IPCC 2007; Nabuurs et al. 2002), can
Journal of Forestry • April/May 2008 129You can also read