Brunel Pension Partnership
2021 Carbon Metrics Report
←
→
Page content transcription
If your browser does not render page correctly, please read the page content below
Brunel Pension Partnership 2021 Carbon Metrics Report
Brunel Pension Fund
                        Carbon Metrics Report

Contents

Page 1        Executive Summary

Page 2        The Brunel Aggregate Portfolio and Custom Benchmark

Page 3        Definitions - Scope 1, 2 and 3 emissions

Page 4        Weighted Average Carbon Intensity (WACI)

Page 5        Fossil fuel related activities

Page 6        Fossil fuel reserves exposure

Page 7        Potential future emissions from reserves |

Page 8        Disclosure rates

Page 9        Brunel Aggregate Portfolio vs Custom Benchmark

Page 10       Summary high level overview of each Portfolio

Pages 11-20   Brunel Portfolios
              Brunel Active UK Portfolio
              Brunel Active Global High Alpha Portfolio
              Brunel Active Emerging Markets Portfolio
              Brunel Active Low Volatility Portfolio
              Brunel Passive Low Carbon Portfolio
              Brunel Passive Smart Beta Portfolio
              Brunel Passive UK Portfolio
              Brunel Passive World Developed Portfolio
              Brunel Global Sustainable Portfolio
              Brunel Global Smaller Companies Portfolio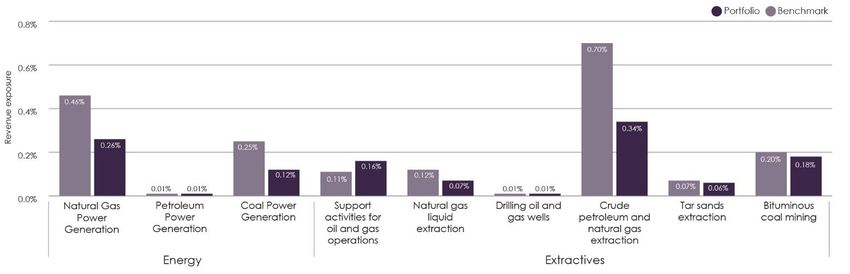
Brunel Pension Fund
                                  Carbon Metrics Report

                                                                      Holdings as at 31st December 2020

Key Info:             AUM in mGBP: 15,178                 Coverage: 98%                         29/04/2021

Carbon Metrics Report 2021

 •   This report illustrates key Carbon Metrics for the Brunel Aggregate Portfolio and the
     associated underlying Brunel Portfolios as of 31 December 2020

 •   This report builds on our baseline carbon metrics report published in December 2019,
     and documents the results of the decarbinsation work we have undertaken across our
     Portfolios.

 •   We have been working extensively on decarbonisnig our Portfolios alongside our
     managers.

 •   We extend our thanks to S&P Trucost who provided the footprinting data for this report.

Executive Summary

 •   The Brunel Aggregate Portfolio consists of the underlying Brunel Portfolios, weighted by assets under
     management as of 31 December 2020.

 •   Looking at the Weighted Average Carbon Intensity (WACI), the Brunel Aggregate Portfolio is less
     carbon intensive than its Custom Benchmark, with a relative efficiency of +22%.

 •   All Brunel Portfolios have lower carbon intensities than their respective benchmarks

 •   We have been working hard alongside our appointed managers to reduce the carbon intnesity of
     our Portfolios.

 •        The UK Active Portfolio saw a decline in carbon intensity, from 259 tCO2e/mGBP            as of
     December 2019 to 199 tCO2e/mGBP in December 2020 – a 23.2%             reduction.

 •        The carbon intensity of the Emerging Market Portfolio dropped from 522         tCO2e/mGBP in
     December 2019 to 402 tCO2e/mGBP in December 2020 – down             22.9%.

 •         The Active Low Volatility Portfolio fell from 259 tCO2e/mGBP in December 2019            to 194
     tCO2e/mGBP in December 2020 – a 25.1% reduction.

 •   Of the Brunel Portfolios within the Aggregate, the highest intensity was the Brunel Passive Smart Beta
     (419 tCO2e/mGBP), while the lowest was the Brunel Global High Alpha (143 tCO2e/mGBP).

 •   The Brunel Aggregate Portfolio is less exposed to both fossil fuel revenues (1.4% vs 2.2%) and future
     emissions from reserves (24.8 MtCO2 vs 46.2 MtCO2) than the Custom Benchmark.

 •   Disclosure is a key area of focus for our engagement programme. The rate of companies in the
     Brunel Aggregate Portfolio for which fully disclose carbon data was available was 61% (carbon
     weighted method) and 56% (investment weighted method), indicating scope for improved reporting
     among investees.

Page 1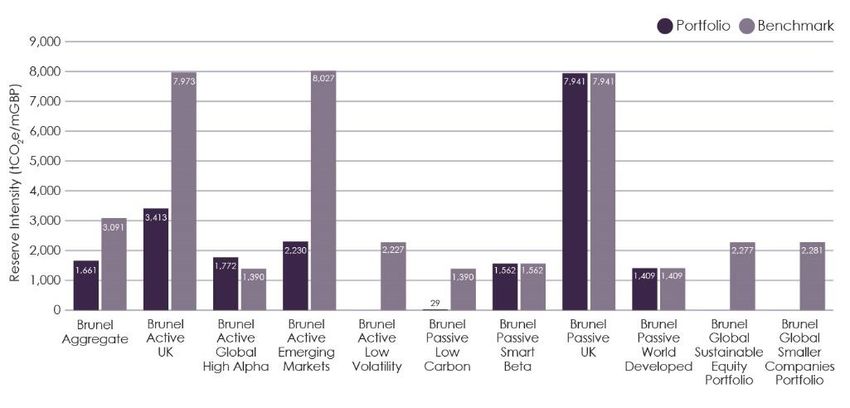
Brunel Pension Fund
                                      Carbon Metrics Report

                                                                         Holdings as at 31st December 2020

     The Brunel Aggregate Portfolio and Custom Benchmark

 •    This report includes a variety of carbon metrics, including the weighted average carbon
      intensity (WACI), fossil fuel activities, fossil fuel reserves and carbon data disclosure rates
      for each of the Brunel Active and Passive Portfolios.

 •    We also report on the Brunel Aggregate Portfolio. This consists of each of the underlying
      Brunel Portfolios weighted by assets under management as of 31 December 2020.
      Details of this Portfolio are illustrated below.

 •    We have also created a Custom Benchmark Portfolio in order to make a meaningful
      comparator. This Custom Benchmark consists of the benchmarks of the underlying Brunel
      Portfolios, weighted by investment as of 31 Decekber 2020.

         Brunel Aggregate Portfolio                              Brunel UK Active Portfolio

                                                                 Brunel Global High Alpha
                                     4%     9%
                               10%                               Brunel Emerging Market Equity

                                                                 Brunel Active Low Volatility

                                                       22%       Brunel Passive Low Carbon
                   19%
                                                                 Brunel Passive Smart Beta

                                                                 Brunel Passive UK

                                                                 Brunel Passive World Developed
                         5%                           9%
                                                                 Brunel Global Sustainable Equity Portfolio
                               6%                5%
                                      11%                        Brunel Global Smaller Companies Portfolio

         Brunel Custom Benchmark

                                                                         FTSE Allshare ex-IT
                                     4%     9%
                                                                         MSCI World
                         19%
                                                                         MSCI Emerging Markets

                                                                         MSCI ACWI

                   5%                                      33%           Brunel Passive Smart Beta

                                                                         Brunel Passive UK
                    6%

                                                                         Brunel Passive World Developed

                               15%                                       MSCI World Small Cap
                                            9%

Page 2
Brunel Pension Fund
                              Carbon Metrics Report

                        Scope 1, 2 and 3 emissions

 In this report we include scope 1, scope 2 and first tier scope 3 emissions in our calculations.
 The below graphic explains each of these.

Page 3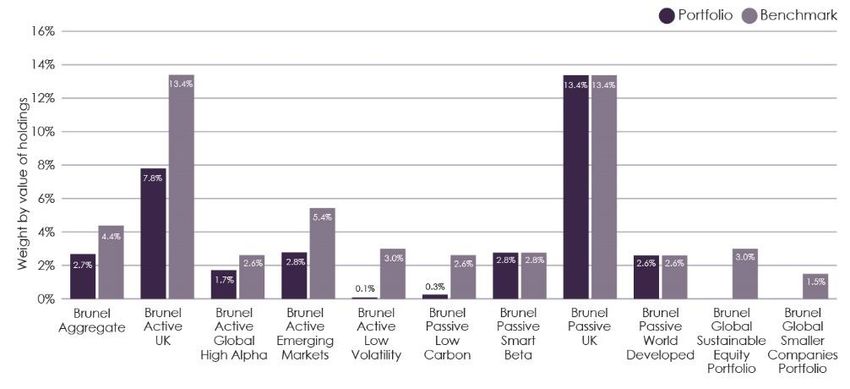
Brunel Pension Fund
                                Carbon Metrics Report

            Weighted Average Carbon Intensity (WACI)

 The WACI shows a portfolio's exposure to carbon intensive companies. This measure is determined
 by taking the carbon intensity of each company and weighting it based on its holding size within the
 Portfolio.

 The WACI is one of the measures recommended by the Task Force on Climate-related Financial
 Disclosures (TCFD). Because carbon intensive companies are more likely to be exposed to
 potential carbon regulations and carbon pricing, this is a useful indicator of potential exposure to
 transition risks such as policy interventions and changing consumer behaviours.

 In this report we illustrate the weighted average carbon intensity (WACI) of The Brunel Aggregate
 Portfolio and each of the underlying Brunel Portfolios, alongside their respective benchmarks.

                                                                We aim to reduce the carbon
                                                                intensity of our Portfolios by 7%
                                                                each year.

                                                                All active equity Portfolios have
                                                                achieved at least a 7% emissions
                                                                intensity reduction.

  As of 31 December 2020 the Brunel Aggregate Portfolio had an efficiency of 22% versus its
  Custom Benchmark. It saw an efficiency improvement of 15.4% versus 31 December 2019.

  Each of the underlying Active Brunel Portfolios have a WACI below their respective benchmarks.
  In this report we also illustrate how the WACI has changed year on year for each of our Portfolios
  (with the exception of Global Smaller Companies and Global Sustainable that were both launched
  in 2020.

  The Brunel Passive Portfolios (Passive Smart Beta, Passive UK and Passive World Developed)
  track their respective benchmarks. The priority for 2021 is looking at low-carbon, potentially Net
  Zero benchmarks for our index tracking Portfolios.

Page 4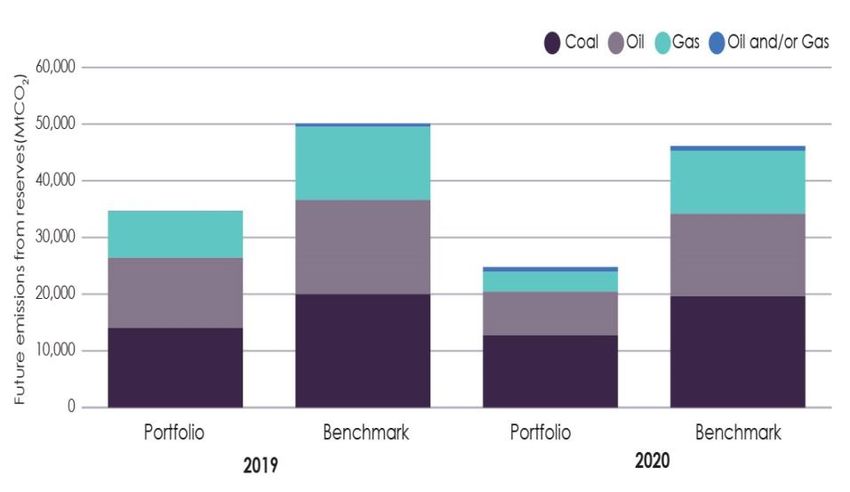
Brunel Pension Fund
                                  Carbon Metrics Report

                               Fossil Fuel Related Activities

 It is important to identify exposure to business activities in extractives industries in order to assess
 the potential risk of 'stranded assets'. Stranded assets are assets that may suffer premature write-
 downs and may even become obsolete due to changes in policy or consumer behaviour.

 We can identify the exposure to stranded asset risk in a number of ways. One way is to consider the
 fossil fuel related activities of the underlying companies within our Portfolios.

                                              We identify companies with exposure to fossil fuel
                                              related energy generation (gas power, petrol power and
                                              coal power) and fossil fuel related extraction related
                                              activities (definitions on the left). We can assess the
                                              revenue exposure that each company has to these
                                              activities - and aggregate this to get an overall Portfolio
                                              assessment.

                                              We illustrate this revenue exposure for all Brunel
                                              Portfolios and their respective benchmarks. We also
                                              provide an assessment of the Brunel Aggregate
                                              Portfolio.

 The Brunel Aggregate Portfolio - Fossil Fuel Revenue Exposure

   The Brunel Aggregate Portfolio is less exposed to fossil fuel revenues than its Custom
   Benchmark (1.4% vs 2.2%).

   The Portfolio is less exposed to fossil fuel related activities across all generation and extractives
   activities measured, with the exception of 'support activities for oil and gas operations'.

   Our Active Portfolios have significantly less exposure to fossil fuel related activities across most of
   these activity types compared to their respective benchmark. To view each Portfolio please see
   the analysis later on in this report.

Page 5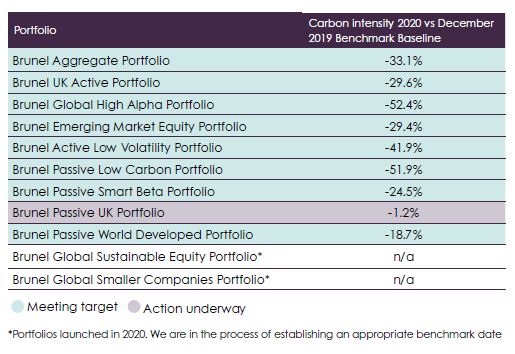
Brunel Pension Fund
                                 Carbon Metrics Report

                             Fossil Fuel Reserves Exposure

 As well as assessing the revenue exposure from fossil fuel related activities, another way to assess
 the risk of stranded assets is to consider fossil fuel reserves. This is the exposure to fossil fuels
 which have not yet been realised by companies.

 Fossil fuel reserves exposure give us a measure of companies that have disclosed their 'proven'
 reserves, as well as capturing companies that have 'probable' fossil fuel reserves.

 Proven reserves exposure - have a > 90% chance of being present
 Probable reserves exposure - have a >50% chance of being present

 We identify companies that have both proven and probable reserves - and can look at the
 aggregate exposure within each of our Portfolios, as well as the Brunel Aggregate Portfolio. Each
 Portfolio is illustrated in this report against its respective benchmark.

  Fossil Fuel Reserves Exposure

   The Brunel Aggregate Portfolio is less exposed to fossil fuel reserves (2.7%) compared to its
   Custom Benchmark (4.4%).

   Our Active Portfolios have significantly less exposure to fossil fuel reserves compared to their
   respective benchmarks.

   As expected our Passive Portfolios track their relevent indexes.

Page 6
Brunel Pension Fund
Carbon Metrics Report
Potential Emissions from Reserves
Taking the reserves exposures discussed above, we can look at an assessment of potential future
emissions that may incur from these reserves being realised. This metric is not included in the WACI
figure (which focuses on current intensity) - and so it is an important assessment of company's
potential contribution to emissions via its stockpile of fossil fuels.
We have been able to assess the potential emissions associated with the proven and probable
reserves for companies within our Portfolios, as well as an overall Portfolio assessment.
We illustrate the potential emissions from reserves for each of our Portfolios and their respective
benchmarks below, as well as the Brunel Aggregate Portfolio.
Future Emissions from Reserves
As well as an overall assessment of potential emissions from reserves, we are able to break
these potential emissions down by fossil fuel type. We provide this analysis for each Portfolio
against its benchmark, as well as how it has changed over time.
Below we display this analysis for the Brunel Aggregate Portfolio.
Future Emissions from Reserves by Fossil Fuel Type - Brunel Aggregate Portfolio
Page 7Brunel Pension Fund
Carbon Metrics Report
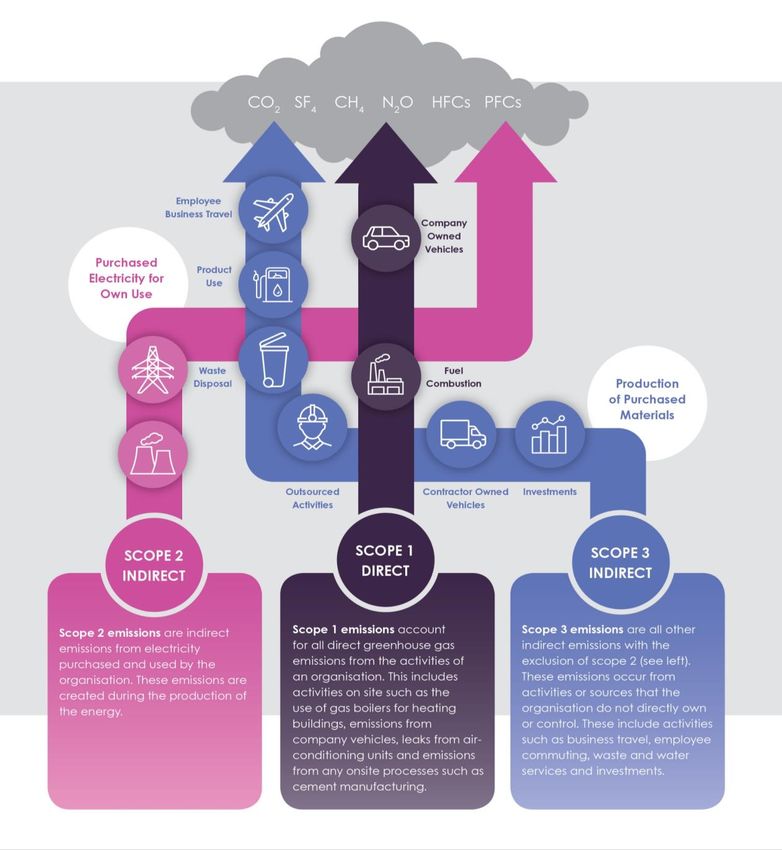
Disclosure Rates
In order to determine the carbon footprints and associated metrics in this report, Trucost collects
company information such as disclosure around greenhouse gas emissions and business activities.
To collect this data Trucost use a variety of sources such as annual reports and financial
statements, regulatory filings, Corporate Social Responsibility reports and information published on
company websites.
In the absence of this data, Trucost uses what is known as an 'input-output model' to estimate as
best as possible the data for a particular company. This model combines industry-specific
environmental impact data alongside macroeconomic data. Sometimes a company reports some
carbon or business activity data; in which case Trucost can partially model the company's footprints
and metrics. In the absence of usable or up to date disclosures Trucost fully models a company's
footprint and metrics.
Discloure Rates - by Investment Weight
Full Disclosure - companies fully reporting their own carbon data.
Partial Disclosure - the data disclosed by companies has been adjusted in some way. This may include using data from
previous years' disclosures as well as estimating changes in business activities.
Modelled - in the absence of usable or up to date disclosures, the data has been estimated by Trucost models.
Disclosure rates vary enormously across the world and this is one of the reasons Brunel
is a strong advocate for mandatory climate risk reporting for all companies. The higher the level of
direct disclosure, the higher the confidence in the data against which to take action.
Over time, we seek to increase the proportion of direct or ‘full disclosure’ of all our portfolios.
The level of company disclosures for the Brunel Aggregate Portfolio and each Brunel Sub-
Portfolio is illustrated above. Unsurprisingly companies under lower regulatory regimes such as
Smaller Companies and Emerging Markets have lower levels of disclosure rates.
In this report we provide a breakdown of the disclosure rates of each of the Brunel Portfolios and
the Brunel Aggregate Portfolio on both an investment weighted and greenhouse gas weighted
basis. We also show how it has changed over time.
Generally speaking all of our Portfolios tend to have higher disclosure rates than their respective
benchmarks.
Page 8Brunel Pension Partnership
Brunel Aggregate vs Brunel Custom Benchmark Holdings as at 31st December 2020
Weighted Average Carbon Intensity (WACI) Industry Breakdown of Fossil Fuel Related Activities
Natural Gas Power Generation
400
Energy
350 Petroleum Power Generation
Carbon Intensity (tCO2e/mGBP)
300 82 Coal Power Generation
Support activities for oil and gas
250 65
80 50 operations
200 50 Natural gas liquid extraction
64
45
150
Extractives
Drilling oil and gas wells
48
100 210 Crude petroleum and natural gas
157 171 extraction
50 112
Tar sands extraction
0
Bituminous coal mining
Portfolio Benchmark Portfolio Benchmark
FY 2019 FY 2020
0.0% 0.5% 1.0% 1.5%
Direct Scope 2 Tier 1 Scope 3 Portfolio Benchmark
Current Year Top Contributors to WACI Top Contributors to Weighted Fossil Fuel Revenues
Name Carbon-to-Revenue intensity Weight Contr. Name Weight Weighted FF Revenue
(tCO2e/mGBP) (%) (%) (%) (mGBP)
PT Semen Indonesia (Persero) Tbk 14,209 0.05% -3.25% Royal Dutch Shell PLC 0.54% 218
Rio Tinto Group 965 0.58% -1.94% BP p.l.c. 0.24% 91
NextEra Energy, Inc. 3,169 0.12% -1.60% BHP Group 0.49% 56
LafargeHolcim Ltd 6,862 0.05% -1.60% Berkshire Hathaway Inc. 0.48% 28
The Southern Company 5,873 0.05% -1.39% Chevron Corporation 0.09% 22
The WACI shows the portfolio exposure to carbon intensive companies. This The Industry Breakdown of Fossil Fuel Relatred Activities chart above breaks
metric takes the carbon intensity (total carbon emissions divided by total down the 'extractives' and 'energy' revenue exposure into specific industry
revenue) of each investee and multiplies it by its weight in the portfolio. exposures.
Disclosure Rates Future Emissions from Reserves
100% 60.000 4,500
90% 4,000
50.000
Future Emissions from Reserves (MtCO2)
80%
Reserves Intensity (tCO2/mGBP)
3,500
70%
40.000 3,000
60%
2,500
50% 30.000
2,000
40%
20.000 1,500
30%
20% 1,000
10.000
10% 500
0% 0.000 0
GHG VOH GHG VOH Portfolio Benchmark Portfolio Benchmark
FY 2019 FY 2020 FY 2019 FY 2020
Full Disclosure Partial Disclosure Modelled Coal Oil Gas Oil and/or Gas Intensity
Portfolio Disclosure Rates by Method Future Emissions from Reserves by Type (MtCO2)
Carbon disclosure GHG-weighted Value-weighted Source FY 2019 FY 2020
category disclosure disclosure Port. Ben. Port. Ben.
Full Disclosure 61% 56% Coal 14.08 20.00 12.77 19.61
Partial Disclosure 34% 26% Oil 12.35 16.63 7.69 14.59
Modelled 5% 18% Gas 8.17 12.88 3.47 11.12
Full Disclosure - Data disclosed by a company in an un-edited form.
Oil and/or Gas 0.09 0.61 0.87 0.84
Partial Disclosure - Trucost has used data disclosed by a company but has
Companies may disclose both 1P and 2P reserves (1P refers to those held with
made adjustments to match the reporting scope required by its research
90% confidence, 2P are those held with 50% confidence). Both 1P and 2P are
process. Values may also be derived from a previous year’s disclosed data using
used when assigning embedded emissions to a company.
changes in business activities and consolidated revenues.
Modelled - In the absence of usable disclosures, the data has been modelled
The chart above shows the total tonnes of apportioned CO2 from reserves,
using Trucost’s EE-IO model.
broken down by reserve type. It also shows the reserves 'intensity' by normalizing
the apportioned embedded emissions by the VOH.
Page 9Brunel Pension Partnership
Summary Sheet Holdings as at 31st December 2020
Weighted Average Carbon Intensity (WACI)
500 458
450 419 419
402
Carbon Intensity (tCO2e/mGBP)
400
350
286 278 273 278 278 273
300 269
244 244 246 246
250 224
199 194
200 174 179
143 145
150
100
50
0
Brunel Brunel UK Brunel Global Brunel Brunel Active Brunel Passive Brunel Passive Brunel Passive Brunel Passive Brunel Global Brunel Global
Aggregate Active Portfolio High Alpha Emerging Low Volatility Low Carbon Smart Beta UK World Sustainable Smaller
Market Equity Developed Equity Portfolio Companies
Portfolio
Portfolio Benchmark
Disclosure Rates
100% 2% 2%
12% 14% 14% 13%
90% 18% 18%
29% 31%
80% 32%
38% 21% 23% 23%
Disclosure rate by VOH
21% 24%
70% 26% 66%
60% 20%
50% 40%
40%
67% 63% 62% 66% 63%
30% 56% 60% 61%
48% 20%
20%
31%
10%
14%
0%
Brunel Brunel UK Brunel Global Brunel Brunel Active Brunel Passive Brunel Passive Brunel Passive Brunel Passive Brunel Global Brunel Global
Aggregate Active Portfolio High Alpha Emerging Low Volatility Low Carbon Smart Beta UK World Sustainable Smaller
Market Equity Developed Equity Portfolio Companies
Portfolio
Full Disclosure Partial Disclosure Modelled
Emissions from Reserves per million Invested
9,000
Reserves Intensity (tCO2/mGBP)
7,973 8,027 7,941
8,000
7,000
6,000
5,000
4,000 3,413
3,091
3,000 2,300 2,277 2,277 2,281
1,661 1,772 1,562
2,000 1,390 1,390 1,409
1,000
0 29 0 0
0
Brunel Brunel UK Brunel Global Brunel Brunel Active Brunel Passive Brunel Passive Brunel Passive Brunel Passive Brunel Global Brunel Global
Aggregate Active Portfolio High Alpha Emerging Low Volatility Low Carbon Smart Beta UK World Sustainable Smaller
Market Equity Developed Equity Portfolio Companies
Portfolio
Portfolio Benchmark
Reserves Exposure
16%
Weight by Value of Holdings
14% 13.4% 13.4%
12%
10%
7.8%
8%
6% 5.4%
4.4%
4% 2.7% 2.6% 2.8% 3.0% 2.6% 2.8% 2.6% 3.0%
1.7% 1.5%
2%
0.1% 0.3% 0.0% 0.0%
0%
Brunel Brunel UK Brunel Global Brunel Brunel Active Brunel Passive Brunel Passive Brunel Passive Brunel Passive Brunel Global Brunel Global
Aggregate Active Portfolio High Alpha Emerging Low Volatility Low Carbon Smart Beta UK World Sustainable Smaller
Market Equity Developed Equity Portfolio Companies
Portfolio
Portfolio Benchmark
Page 10Brunel Pension Partnership
Brunel UK Active Portfolio vs. FTSE All Share Ex-IT Holdings as at 31st December 2020
Weighted Average Carbon Intensity (WACI) Industry Breakdown of Fossil Fuel Related Activities
Natural Gas Power Generation
300
Energy
Petroleum Power Generation
250
Carbon Intensity (tCO2e/mGBP)
104 87
Coal Power Generation
101
200 Support activities for oil and gas
operations
48
45 76
150 Natural gas liquid extraction
40
Extractives
35 Drilling oil and gas wells
100
Crude petroleum and natural gas
133 143
118 extraction
50
88
Tar sands extraction
0
Bituminous coal mining
Portfolio Benchmark Portfolio Benchmark
FY 2019 FY 2020
0.0% 0.5% 1.0% 1.5%
Direct Scope 2 Tier 1 Scope 3 Portfolio Benchmark
Current Year Top Contributors to WACI Top Contributors to Weighted Fossil Fuel Revenues
Name Carbon-to-Revenue intensity Weight Contr. Name Weight Weighted FF Revenue
(tCO2e/mGBP) (%) (%) (%) (mGBP)
Rio Tinto Group 965 4.20% -16.91% Royal Dutch Shell PLC 2.82% 1,134
Mondi PLC 2,704 0.88% -11.24% BHP Group 3.63% 420
Tate & Lyle plc 2,366 0.77% -8.43% BP p.l.c. 0.98% 378
BHP Group 561 3.63% -6.88% SSE plc 0.21% 3
Royal Dutch Shell PLC 614 2.82% -6.08% EnQuest PLC 0.10% 1
The WACI shows the portfolio exposure to carbon intensive companies. This The Industry Breakdown of Fossil Fuel Relatred Activities chart above breaks
metric takes the carbon intensity (total carbon emissions divided by total down the 'extractives' and 'energy' revenue exposure into specific industry
revenue) of each investee and multiplies it by its weight in the portfolio. exposures.
Disclosure Rates Future Emissions from Reserves
100% 14.000 9,000
90% 8,000
12.000
Future Emissions from Reserves (MtCO2)
Reserves Intensity (tCO2/mGBP)
80% 7,000
10.000
70%
6,000
60% 8.000 5,000
50%
6.000 4,000
40%
3,000
30% 4.000
2,000
20%
2.000
10% 1,000
0% 0.000 0
GHG VOH GHG VOH Portfolio Benchmark Portfolio Benchmark
FY 2019 FY 2020 FY 2019 FY 2020
Full Disclosure Partial Disclosure Modelled Coal Oil Gas Oil and/or Gas Intensity
Portfolio Disclosure Rates by Method Future Emissions from Reserves by Type (MtCO2)
Carbon disclosure GHG-weighted Value-weighted Source FY 2019 FY 2020
category disclosure disclosure Port. Ben. Port. Ben.
Full Disclosure 63% 60% Coal 3.91 5.58 2.37 6.21
Partial Disclosure 37% 38% Oil 3.40 3.58 1.15 2.48
Modelled 0% 2% Gas 1.77 2.54 0.83 1.70
Full Disclosure - Data disclosed by a company in an un-edited form. Oil and/or Gas 0.08 0.01 0.10 0.04
Partial Disclosure - Trucost has used data disclosed by a company but has
Companies may disclose both 1P and 2P reserves (1P refers to those held with
made adjustments to match the reporting scope required by its research
90% confidence, 2P are those held with 50% confidence). Both 1P and 2P are
process. Values may also be derived from a previous year’s disclosed data using
used when assigning embedded emissions to a company.
changes in business activities and consolidated revenues.
Modelled - In the absence of usable disclosures, the data has been modelled
The chart above shows the total tonnes of apportioned CO2 from reserves,
using Trucost’s EE-IO model.
broken down by reserve type. It also shows the reserves 'intensity' by normalizing
the apportioned embedded emissions by the VOH.
Page 11Brunel Pension Partnership
Brunel Global High Alpha vs. MSCI World Holdings as at 31st December 2020
Weighted Average Carbon Intensity (WACI) Industry Breakdown of Fossil Fuel Related Activities
Natural Gas Power Generation
350
Energy
Petroleum Power Generation
300
Carbon Intensity (tCO2e/mGBP)
72 Coal Power Generation
250
Support activities for oil and gas
58 operations
200 45
Natural gas liquid extraction
41
150
Extractives
71 Drilling oil and gas wells
61
100
184 Crude petroleum and natural gas
38 145 extraction
41
50
Tar sands extraction
49 42
0
Bituminous coal mining
Portfolio Benchmark Portfolio Benchmark
FY 2019 FY 2020
0.0% 0.5% 1.0% 1.5%
Direct Scope 2 Tier 1 Scope 3 Portfolio Benchmark
Current Year Top Contributors to WACI Top Contributors to Weighted Fossil Fuel Revenues
Name Carbon-to-Revenue intensity Weight Contr. Name Weight Weighted FF Revenue
(tCO2e/mGBP) (%) (%) (%) (mGBP)
LafargeHolcim Ltd 6,862 0.15% -7.18% Berkshire Hathaway Inc. 0.94% 56
Nestle SA 545 1.93% -5.51% Glencore Plc 0.59% 44
Steel Dynamics, Inc. 1,043 0.74% -4.67% Suncor Energy Inc. 0.37% 37
Taiwan Semiconductor Manufacturing Company 407 Limited
2.15% -4.05% Anglo American Plc 0.76% 34
Anglo American Plc 870 0.76% -3.88% Halliburton Company 0.15% 26
The WACI shows the portfolio exposure to carbon intensive companies. This The Industry Breakdown of Fossil Fuel Relatred Activities chart above breaks
metric takes the carbon intensity (total carbon emissions divided by total down the 'extractives' and 'energy' revenue exposure into specific industry
revenue) of each investee and multiplies it by its weight in the portfolio. exposures.
Disclosure Rates Future Emissions from Reserves
100% 7.000 2,000
90% 1,800
6.000
Future Emissions from Reserves (MtCO2)
80% 1,600
Reserves Intensity (tCO2/mGBP)
70% 5.000 1,400
60% 1,200
4.000
50% 1,000
40% 3.000
800
30%
2.000 600
20%
400
10% 1.000
200
0%
GHG VOH GHG VOH 0.000 0
Portfolio Benchmark Portfolio Benchmark
FY 2019 FY 2020
FY 2019 FY 2020
Full Disclosure Partial Disclosure Modelled Coal Oil Gas Oil and/or Gas Intensity
Portfolio Disclosure Rates by Method Future Emissions from Reserves by Type (MtCO2)
Carbon disclosure GHG-weighted Value-weighted Source FY 2019 FY 2020
category disclosure disclosure Port. Ben. Port. Ben.
Full Disclosure 55% 61% Coal 3.31 1.30 4.72 1.47
Partial Disclosure 38% 21% Oil 1.13 2.34 1.08 2.04
Modelled 7% 18% Gas 0.00 1.20 0.00 1.02
Full Disclosure - Data disclosed by a company in an un-edited form. Oil and/or Gas 0.00 0.00 0.00 0.01
Partial Disclosure - Trucost has used data disclosed by a company but has
Companies may disclose both 1P and 2P reserves (1P refers to those held with
made adjustments to match the reporting scope required by its research
90% confidence, 2P are those held with 50% confidence). Both 1P and 2P are
process. Values may also be derived from a previous year’s disclosed data using
used when assigning embedded emissions to a company.
changes in business activities and consolidated revenues.
Modelled - In the absence of usable disclosures, the data has been modelled
The chart above shows the total tonnes of apportioned CO2 from reserves,
using Trucost’s EE-IO model.
broken down by reserve type. It also shows the reserves 'intensity' by normalizing
the apportioned embedded emissions by the VOH.
Page 12Brunel Pension Partnership
Brunel Emerging Market Equity vs. MSCI Emerging Markets Holdings as at 31st December 2020
Weighted Average Carbon Intensity (WACI) Industry Breakdown of Fossil Fuel Related Activities
Natural Gas Power Generation
600
Energy
79 Petroleum Power Generation
500
Carbon Intensity (tCO2e/mGBP)
86
90 Coal Power Generation
68
400 72 Support activities for oil and gas
80 operations
97
300 Natural gas liquid extraction
101
Extractives
Drilling oil and gas wells
200 401
364
293 Crude petroleum and natural gas
extraction
100 221
Tar sands extraction
0
Bituminous coal mining
Portfolio Benchmark Portfolio Benchmark
FY 2019 FY 2020
0.0% 0.5% 1.0% 1.5%
Direct Scope 2 Tier 1 Scope 3 Portfolio Benchmark
Current Year Top Contributors to WACI Top Contributors to Weighted Fossil Fuel Revenues
Name Carbon-to-Revenue intensity Weight Contr. Name Weight Weighted FF Revenue
(tCO2e/mGBP) (%) (%) (%) (mGBP)
PT Semen Indonesia (Persero) Tbk 14,209 0.56% -19.37% Petrobras SA 0.88% 218
Anhui Conch Cement Company Limited 11,690 0.23% -6.60% PJSC LUKOIL 0.37% 125
China Longyuan Power Group Corporation 3,251
Limited 0.68% -4.87% Public Joint Stock Company Rosneft
0.12%
Oil Company 63
PT Indocement Tunggal Prakarsa Tbk 14,923 0.13% -4.76% CNOOC Limited 0.24% 56
Ternium S.A. 3,651 0.27% -2.20% Anglo American Plc 0.58% 26
The WACI shows the portfolio exposure to carbon intensive companies. This The Industry Breakdown of Fossil Fuel Relatred Activities chart above breaks
metric takes the carbon intensity (total carbon emissions divided by total down the 'extractives' and 'energy' revenue exposure into specific industry
revenue) of each investee and multiplies it by its weight in the portfolio. exposures.
Disclosure Rates Future Emissions from Reserves
100% 14.000 14,000
90%
12.000 12,000
Future Emissions from Reserves (MtCO2)
80%
Reserves Intensity (tCO2/mGBP)
70% 10.000 10,000
60%
8.000 8,000
50%
6.000 6,000
40%
30%
4.000 4,000
20%
2.000 2,000
10%
0% 0.000 0
GHG VOH GHG VOH Portfolio Benchmark Portfolio Benchmark
FY 2019 FY 2020 FY 2019 FY 2020
Full Disclosure Partial Disclosure Modelled Coal Oil Gas Oil and/or Gas Intensity
Portfolio Disclosure Rates by Method Future Emissions from Reserves by Type (MtCO2)
Carbon disclosure GHG-weighted Value-weighted Source FY 2019 FY 2020
category disclosure disclosure Port. Ben. Port. Ben.
Full Disclosure 48% 31% Coal 0.96 5.29 0.43 3.58
Partial Disclosure 43% 40% Oil 1.91 2.84 1.66 3.08
Modelled 9% 29% Gas 2.84 4.28 0.39 3.86
Full Disclosure - Data disclosed by a company in an un-edited form. Oil and/or Gas 0.00 0.53 0.71 0.57
Partial Disclosure - Trucost has used data disclosed by a company but has
Companies may disclose both 1P and 2P reserves (1P refers to those held with
made adjustments to match the reporting scope required by its research
90% confidence, 2P are those held with 50% confidence). Both 1P and 2P are
process. Values may also be derived from a previous year’s disclosed data using
used when assigning embedded emissions to a company.
changes in business activities and consolidated revenues.
Modelled - In the absence of usable disclosures, the data has been modelled
The chart above shows the total tonnes of apportioned CO2 from reserves,
using Trucost’s EE-IO model.
broken down by reserve type. It also shows the reserves 'intensity' by normalizing
the apportioned embedded emissions by the VOH.
Page 13Brunel Pension Partnership
Brunel Active Low Volatility vs. MSCI ACWI Holdings as at 31st December 2020
Weighted Average Carbon Intensity (WACI) Industry Breakdown of Fossil Fuel Related Activities
Natural Gas Power Generation
400
Energy
350 Petroleum Power Generation
Carbon Intensity (tCO2e/mGBP)
300 73 Coal Power Generation
Support activities for oil and gas
250 59
51 operations
69
200 Natural gas liquid extraction
49
43
67
150
Extractives
Drilling oil and gas wells
100 210 41 Crude petroleum and natural gas
165 extraction
147
50
86 Tar sands extraction
0
Bituminous coal mining
Portfolio Benchmark Portfolio Benchmark
FY 2019 FY 2020
0.0% 0.5% 1.0% 1.5%
Direct Scope 2 Tier 1 Scope 3 Portfolio Benchmark
Current Year Top Contributors to WACI Top Contributors to Weighted Fossil Fuel Revenues
Name Carbon-to-Revenue intensity Weight Contr. Name Weight Weighted FF Revenue
(tCO2e/mGBP) (%) (%) (%) (mGBP)
Public Service Enterprise Group Incorporated
1,930 0.70% -6.34% NextEra Energy, Inc. 0.35% 26
NextEra Energy, Inc. 3,169 0.35% -5.40% Iberdrola, S.A. 0.65% 23
Fortis Inc. 2,572 0.25% -3.07% Endesa, S.A. 0.25% 12
Nestle SA 545 1.65% -3.04% Tokyo Gas Co.,Ltd. 0.24% 10
Waste Management, Inc. 2,372 0.21% -2.41% Public Service Enterprise Group Incorporated
0.70% 10
The WACI shows the portfolio exposure to carbon intensive companies. This The Industry Breakdown of Fossil Fuel Relatred Activities chart above breaks
metric takes the carbon intensity (total carbon emissions divided by total down the 'extractives' and 'energy' revenue exposure into specific industry
revenue) of each investee and multiplies it by its weight in the portfolio. exposures.
Disclosure Rates Future Emissions from Reserves
100% 1.800 3,500
90% 1.600
3,000
Future Emissions from Reserves (MtCO2)
80%
Reserves Intensity (tCO2/mGBP)
1.400
70% 2,500
1.200
60%
1.000 2,000
50%
0.800 1,500
40%
30% 0.600
1,000
20% 0.400
10% 500
0.200
0%
GHG VOH GHG VOH 0.000 0
Portfolio Benchmark Portfolio Benchmark
FY 2019 FY 2020
FY 2019 FY 2020
Full Disclosure Partial Disclosure Modelled Coal Oil Gas Oil and/or Gas Intensity
Portfolio Disclosure Rates by Method Future Emissions from Reserves by Type (MtCO2)
Carbon disclosure GHG-weighted Value-weighted Source FY 2019 FY 2020
category disclosure disclosure Port. Ben. Port. Ben.
Full Disclosure 71% 66% Coal 0.00 0.51 0.00 0.52
Partial Disclosure 21% 17% Oil 0.15 0.54 0.00 0.59
Modelled 9% 18% Gas 0.09 0.43 0.00 0.46
Full Disclosure - Data disclosed by a company in an un-edited form. Oil and/or Gas 0.00 0.03 0.00 0.04
Partial Disclosure - Trucost has used data disclosed by a company but has
Companies may disclose both 1P and 2P reserves (1P refers to those held with
made adjustments to match the reporting scope required by its research
90% confidence, 2P are those held with 50% confidence). Both 1P and 2P are
process. Values may also be derived from a previous year’s disclosed data using
used when assigning embedded emissions to a company.
changes in business activities and consolidated revenues.
Modelled - In the absence of usable disclosures, the data has been modelled
The chart above shows the total tonnes of apportioned CO2 from reserves,
using Trucost’s EE-IO model.
broken down by reserve type. It also shows the reserves 'intensity' by normalizing
the apportioned embedded emissions by the VOH.
Page 14Brunel Pension Partnership
Brunel Passive Low Carbon vs. MSCI World Holdings as at 31st December 2020
Weighted Average Carbon Intensity (WACI) Industry Breakdown of Fossil Fuel Related Activities
350 Natural Gas Power Generation
Energy
Petroleum Power Generation
300
Carbon Intensity (tCO2e/mGBP)
72 Coal Power Generation
250
Support activities for oil and gas
58 operations
200 45
Natural gas liquid extraction
41
150
Extractives
Drilling oil and gas wells
59 50
100
184 Crude petroleum and natural gas
38 35 145 extraction
50
Tar sands extraction
53 60
0
Bituminous coal mining
Portfolio Benchmark Portfolio Benchmark
FY 2019 FY 2020 0.0% 0.5% 1.0% 1.5%
Direct Scope 2 Tier 1 Scope 3 Portfolio Benchmark
Current Year Top Contributors to WACI Top Contributors to Weighted Fossil Fuel Revenues
Name Carbon-to-Revenue intensity Weight Contr. Name Weight Weighted FF Revenue
(tCO2e/mGBP) (%) (%) (%) (mGBP)
NextEra Energy, Inc. 3,169 0.32% -6.66% Schlumberger Limited 0.48% 103
Linde plc 1,746 0.28% -3.09% Berkshire Hathaway Inc. 0.62% 36
Dominion Energy, Inc. 2,750 0.13% -2.43% Halliburton Company 0.15% 27
Nestle SA 545 0.67% -1.87% NextEra Energy, Inc. 0.32% 24
Air Products and Chemicals, Inc. 3,996 0.06% -1.50% Mitsui & Co., Ltd. 0.18% 13
The WACI shows the portfolio exposure to carbon intensive companies. This The Industry Breakdown of Fossil Fuel Relatred Activities chart above breaks
metric takes the carbon intensity (total carbon emissions divided by total down the 'extractives' and 'energy' revenue exposure into specific industry
revenue) of each investee and multiplies it by its weight in the portfolio. exposures.
Disclosure Rates Future Emissions from Reserves
100% 3.000 2,000
90% 1,800
2.500
Future Emissions from Reserves (MtCO2)
80% 1,600
Reserves Intensity (tCO2/mGBP)
70% 1,400
2.000
60% 1,200
50% 1.500 1,000
40% 800
1.000
30% 600
20% 400
0.500
10% 200
0% 0.000 0
GHG VOH GHG VOH Portfolio Benchmark Portfolio Benchmark
FY 2019 FY 2020 FY 2019 FY 2020
Full Disclosure Partial Disclosure Modelled Coal Oil Gas Oil and/or Gas Intensity
Portfolio Disclosure Rates by Method Future Emissions from Reserves by Type (MtCO2)
Carbon disclosure GHG-weighted Value-weighted Source FY 2019 FY 2020
category disclosure disclosure Port. Ben. Port. Ben.
Full Disclosure 58% 63% Coal 0.00 0.72 0.00 0.75
Partial Disclosure 38% 23% Oil 0.03 1.29 0.02 1.04
Modelled 4% 14% Gas 0.06 0.66 0.02 0.52
Full Disclosure - Data disclosed by a company in an un-edited form. Oil and/or Gas 0.00 0.00 0.00 0.01
Partial Disclosure - Trucost has used data disclosed by a company but has
Companies may disclose both 1P and 2P reserves (1P refers to those held with
made adjustments to match the reporting scope required by its research
90% confidence, 2P are those held with 50% confidence). Both 1P and 2P are
process. Values may also be derived from a previous year’s disclosed data using
used when assigning embedded emissions to a company.
changes in business activities and consolidated revenues.
Modelled - In the absence of usable disclosures, the data has been modelled
The chart above shows the total tonnes of apportioned CO2 from reserves,
using Trucost’s EE-IO model.
broken down by reserve type. It also shows the reserves 'intensity' by normalizing
the apportioned embedded emissions by the VOH.
Page 15Brunel Pension Partnership
Brunel Passive Smart Beta Holdings as at 31st December 2020
Weighted Average Carbon Intensity (WACI) Industry Breakdown of Fossil Fuel Related Activities
Natural Gas Power Generation
600
Energy
Petroleum Power Generation
500 97 97
Carbon Intensity (tCO2e/mGBP)
Coal Power Generation
54 54
400 Support activities for oil and gas
79 79
operations
300 56 56
Natural gas liquid extraction
Extractives
Drilling oil and gas wells
200 402 402
Crude petroleum and natural gas
284 284
extraction
100
Tar sands extraction
0
Bituminous coal mining
Portfolio Benchmark Portfolio Benchmark
FY 2019 FY 2020
0.0% 0.5% 1.0% 1.5%
Direct Scope 2 Tier 1 Scope 3 Portfolio Benchmark
Current Year Top Contributors to WACI Top Contributors to Weighted Fossil Fuel Revenues
Name Carbon-to-Revenue intensity Weight Contr. Name Weight Weighted FF Revenue
(tCO2e/mGBP) (%) (%) (%) (mGBP)
The Southern Company 5,873 0.43% -5.63% Chevron Corporation 0.35% 86
American Electric Power Company, Inc. 6,885 0.33% -5.05% Exxon Mobil Corporation 0.42% 76
Duke Energy Corporation 4,655 0.44% -4.43% ConocoPhillips 0.19% 49
Ameren Corporation 5,685 0.31% -3.93% Duke Energy Corporation 0.44% 43
Xcel Energy Inc. 5,312 0.32% -3.81% Berkshire Hathaway Inc. 0.55% 33
The WACI shows the portfolio exposure to carbon intensive companies. This The Industry Breakdown of Fossil Fuel Relatred Activities chart above breaks
metric takes the carbon intensity (total carbon emissions divided by total down the 'extractives' and 'energy' revenue exposure into specific industry
revenue) of each investee and multiplies it by its weight in the portfolio. exposures.
Disclosure Rates Future Emissions from Reserves
100% 1.600 1,580
90% 1.400 1,560
Future Emissions from Reserves (MtCO2)
80%
1.200 1,540 Reserves Intensity (tCO2/mGBP)
70%
1.000 1,520
60%
50% 0.800 1,500
40%
0.600 1,480
30%
0.400 1,460
20%
10% 0.200 1,440
0%
GHG VOH GHG VOH 0.000 1,420
Portfolio Benchmark Portfolio Benchmark
FY 2019 FY 2020
FY 2019 FY 2020
Full Disclosure Partial Disclosure Modelled Coal Oil Gas Oil and/or Gas Intensity
Portfolio Disclosure Rates by Method Future Emissions from Reserves by Type (MtCO2)
Carbon disclosure GHG-weighted Value-weighted Source FY 2019 FY 2020
category disclosure disclosure Port. Ben. Port. Ben.
Full Disclosure 71% 62% Coal 0.33 0.33 0.47 0.47
Partial Disclosure 28% 24% Oil 0.74 0.74 0.61 0.61
Modelled 1% 14% Gas 0.33 0.33 0.39 0.39
Full Disclosure - Data disclosed by a company in an un-edited form. Oil and/or Gas 0.00 0.00 0.03 0.03
Partial Disclosure - Trucost has used data disclosed by a company but has
Companies may disclose both 1P and 2P reserves (1P refers to those held with
made adjustments to match the reporting scope required by its research
90% confidence, 2P are those held with 50% confidence). Both 1P and 2P are
process. Values may also be derived from a previous year’s disclosed data using
used when assigning embedded emissions to a company.
changes in business activities and consolidated revenues.
Modelled - In the absence of usable disclosures, the data has been modelled
The chart above shows the total tonnes of apportioned CO2 from reserves,
using Trucost’s EE-IO model.
broken down by reserve type. It also shows the reserves 'intensity' by normalizing
the apportioned embedded emissions by the VOH.
Page 16Brunel Pension Partnership
Brunel Passive UK Holdings as at 31st December 2020
Weighted Average Carbon Intensity (WACI) Industry Breakdown of Fossil Fuel Related Activities
Natural Gas Power Generation
300
Energy
Petroleum Power Generation
250
Carbon Intensity (tCO2e/mGBP)
104 104 87 87 Coal Power Generation
200 Support activities for oil and gas
operations
48 48
150 45 45 Natural gas liquid extraction
Extractives
Drilling oil and gas wells
100
Crude petroleum and natural gas
132 132 142 142
extraction
50
Tar sands extraction
0
Bituminous coal mining
Portfolio Benchmark Portfolio Benchmark
FY 2019 FY 2020
0.0% 0.5% 1.0% 1.5%
Direct Scope 2 Tier 1 Scope 3 Portfolio Benchmark
Current Year Top Contributors to WACI Top Contributors to Weighted Fossil Fuel Revenues
Name Carbon-to-Revenue intensity Weight Contr. Name Weight Weighted FF Revenue
(tCO2e/mGBP) (%) (%) (%) (mGBP)
Rio Tinto Group 965 2.95% -7.53% Royal Dutch Shell PLC 4.97% 1,998
CRH Plc 1,987 1.19% -7.43% BP p.l.c. 2.51% 968
Royal Dutch Shell PLC 614 4.97% -6.35% BHP Group 1.99% 230
Mondi PLC 2,704 0.41% -3.63% Glencore Plc 1.25% 92
Anglo American Plc 870 1.48% -3.21% Anglo American Plc 1.48% 67
The WACI shows the portfolio exposure to carbon intensive companies. This The Industry Breakdown of Fossil Fuel Relatred Activities chart above breaks
metric takes the carbon intensity (total carbon emissions divided by total down the 'extractives' and 'energy' revenue exposure into specific industry
revenue) of each investee and multiplies it by its weight in the portfolio. exposures.
Disclosure Rates Future Emissions from Reserves
100% 10.000 8,000
90% 9.000
7,900
Future Emissions from Reserves (MtCO2)
80% 8.000
Reserves Intensity (tCO2/mGBP)
70% 7.000
7,800
60% 6.000
50% 5.000 7,700
40%
4.000
30% 7,600
3.000
20%
2.000
10% 7,500
1.000
0%
GHG VOH GHG VOH 0.000 7,400
Portfolio Benchmark Portfolio Benchmark
FY 2019 FY 2020
FY 2019 FY 2020
Full Disclosure Partial Disclosure Modelled Coal Oil Gas Oil and/or Gas Intensity
Portfolio Disclosure Rates by Method Future Emissions from Reserves by Type (MtCO2)
Carbon disclosure GHG-weighted Value-weighted Source FY 2019 FY 2020
category disclosure disclosure Port. Ben. Port. Ben.
Full Disclosure 78% 66% Coal 4.12 4.12 3.39 3.39
Partial Disclosure 22% 32% Oil 2.63 2.63 1.36 1.36
Modelled 0% 2% Gas 1.87 1.87 0.93 0.93
Full Disclosure - Data disclosed by a company in an un-edited form. Oil and/or Gas 0.01 0.01 0.02 0.02
Partial Disclosure - Trucost has used data disclosed by a company but has
Companies may disclose both 1P and 2P reserves (1P refers to those held with
made adjustments to match the reporting scope required by its research
90% confidence, 2P are those held with 50% confidence). Both 1P and 2P are
process. Values may also be derived from a previous year’s disclosed data using
used when assigning embedded emissions to a company.
changes in business activities and consolidated revenues.
Modelled - In the absence of usable disclosures, the data has been modelled
The chart above shows the total tonnes of apportioned CO2 from reserves,
using Trucost’s EE-IO model.
broken down by reserve type. It also shows the reserves 'intensity' by normalizing
the apportioned embedded emissions by the VOH.
Page 17Brunel Pension Partnership
Brunel Passive World Developed Holdings as at 31st December 2020
Weighted Average Carbon Intensity (WACI) Industry Breakdown of Fossil Fuel Related Activities
Natural Gas Power Generation
350
Energy
Petroleum Power Generation
300
Carbon Intensity (tCO2e/mGBP)
73 73 Coal Power Generation
250
Support activities for oil and gas
59 59 operations
200 47 47
Natural gas liquid extraction
43 43
150
Extractives
Drilling oil and gas wells
100
183 183 Crude petroleum and natural gas
144 144 extraction
50
Tar sands extraction
0
Bituminous coal mining
Portfolio Benchmark Portfolio Benchmark
FY 2019 FY 2020
0.0% 0.5% 1.0% 1.5%
Direct Scope 2 Tier 1 Scope 3 Portfolio Benchmark
Current Year Top Contributors to WACI Top Contributors to Weighted Fossil Fuel Revenues
Name Carbon-to-Revenue intensity Weight Contr. Name Weight Weighted FF Revenue
(tCO2e/mGBP) (%) (%) (%) (mGBP)
NextEra Energy, Inc. 3,169 0.29% -3.46% Royal Dutch Shell PLC 0.26% 106
The Southern Company 5,873 0.12% -2.85% Chevron Corporation 0.31% 78
Duke Energy Corporation 4,655 0.13% -2.32% Exxon Mobil Corporation 0.34% 61
American Electric Power Company, Inc. 6,885 0.08% -2.14% BP p.l.c. 0.13% 51
Air Products and Chemicals, Inc. 3,996 0.12% -1.77% Berkshire Hathaway Inc. 0.85% 50
The WACI shows the portfolio exposure to carbon intensive companies. This The Industry Breakdown of Fossil Fuel Relatred Activities chart above breaks
metric takes the carbon intensity (total carbon emissions divided by total down the 'extractives' and 'energy' revenue exposure into specific industry
revenue) of each investee and multiplies it by its weight in the portfolio. exposures.
Disclosure Rates Future Emissions from Reserves
100% 6.000 2,000
90% 1,800
5.000
Future Emissions from Reserves (MtCO2)
1,600
Reserves Intensity (tCO2/mGBP)
80%
70% 1,400
4.000
60% 1,200
50% 3.000 1,000
40% 800
2.000
30% 600
20% 400
1.000
10% 200
0% 0.000 0
GHG VOH GHG VOH Portfolio Benchmark Portfolio Benchmark
FY 2019 FY 2020 FY 2019 FY 2020
Full Disclosure Partial Disclosure Modelled Coal Oil Gas Oil and/or Gas Intensity
Portfolio Disclosure Rates by Method Future Emissions from Reserves by Type (MtCO2)
Carbon disclosure GHG-weighted Value-weighted Source FY 2019 FY 2020
category disclosure disclosure Port. Ben. Port. Ben.
Full Disclosure 63% 63% Coal 1.45 1.45 1.40 1.40
Partial Disclosure 35% 23% Oil 2.35 2.35 1.80 1.80
Modelled 2% 13% Gas 1.21 1.21 0.89 0.89
Full Disclosure - Data disclosed by a company in an un-edited form. Oil and/or Gas 0.00 0.00 0.01 0.01
Partial Disclosure - Trucost has used data disclosed by a company but has
Companies may disclose both 1P and 2P reserves (1P refers to those held with
made adjustments to match the reporting scope required by its research
90% confidence, 2P are those held with 50% confidence). Both 1P and 2P are
process. Values may also be derived from a previous year’s disclosed data using
used when assigning embedded emissions to a company.
changes in business activities and consolidated revenues.
Modelled - In the absence of usable disclosures, the data has been modelled
The chart above shows the total tonnes of apportioned CO2 from reserves,
using Trucost’s EE-IO model.
broken down by reserve type. It also shows the reserves 'intensity' by normalizing
the apportioned embedded emissions by the VOH.
Page 18Brunel Pension Partnership
Brunel Global Sustainable Equity Portfolio vs. MSCI ACWI Holdings as at 31st December 2020
Weighted Average Carbon Intensity (WACI) Industry Breakdown of Fossil Fuel Related Activities
Natural Gas Power Generation
300
Energy
Petroleum Power Generation
250
59
Carbon Intensity (tCO2e/mGBP)
Coal Power Generation
200 Support activities for oil and gas
49
operations
150 45 Natural gas liquid extraction
Extractives
42 Drilling oil and gas wells
100
165 Crude petroleum and natural gas
extraction
50
87
Tar sands extraction
0
Bituminous coal mining
Portfolio Benchmark
FY 2020
0.0% 0.5% 1.0% 1.5%
Direct Scope 2 Tier 1 Scope 3 Portfolio Benchmark
Current Year Top Contributors to WACI Top Contributors to Weighted Fossil Fuel Revenues
Name Carbon-to-Revenue intensity Weight Contr. Name Weight Weighted FF Revenue
(tCO2e/mGBP) (%) (%) (%) (mGBP)
Republic Services, Inc. 2,711 0.62% -9.10% Enel SpA 0.45% 34
Waste Management, Inc. 2,372 0.62% -7.87% Orsted 1.44% 3
Linde plc 1,746 0.80% -7.31% L'Air Liquide S.A. 0.40% 2
Orsted 773 1.44% -5.02% National Grid PLC 0.30% 1
InterContinental Hotels Group Plc 953 0.86% -3.87%
The WACI shows the portfolio exposure to carbon intensive companies. This The Industry Breakdown of Fossil Fuel Relatred Activities chart above breaks
metric takes the carbon intensity (total carbon emissions divided by total down the 'extractives' and 'energy' revenue exposure into specific industry
revenue) of each investee and multiplies it by its weight in the portfolio. exposures.
Disclosure Rates Future Emissions from Reserves
100% 4.000 2,500
90%
3.500
Future Emissions from Reserves (MtCO2)
80% 2,000
3.000 Reserves Intensity (tCO2/mGBP)
70%
60% 2.500
1,500
50%
2.000
40%
1,000
1.500
30%
20% 1.000
500
10%
0.500
0%
GHG VOH
0.000 0
FY 2020 Portfolio Benchmark
Full Disclosure Partial Disclosure Modelled Coal Oil Gas Oil and/or Gas Intensity
Portfolio Disclosure Rates by Method Future Emissions from Reserves by Type (MtCO2)
Carbon disclosure GHG-weighted Value-weighted Source FY 2020
category disclosure disclosure Port. Ben.
Full Disclosure 90% 48% Coal 0.00 1.11
Partial Disclosure 3% 20% Oil 0.00 1.26
Modelled 6% 31% Gas 0.00 0.97
Full Disclosure - Data disclosed by a company in an un-edited form. Oil and/or Gas 0.00 0.09
Partial Disclosure - Trucost has used data disclosed by a company but has
Companies may disclose both 1P and 2P reserves (1P refers to those held with
made adjustments to match the reporting scope required by its research
90% confidence, 2P are those held with 50% confidence). Both 1P and 2P are
process. Values may also be derived from a previous year’s disclosed data using
used when assigning embedded emissions to a company.
changes in business activities and consolidated revenues.
Modelled - In the absence of usable disclosures, the data has been modelled
The chart above shows the total tonnes of apportioned CO2 from reserves,
using Trucost’s EE-IO model.
broken down by reserve type. It also shows the reserves 'intensity' by normalizing
the apportioned embedded emissions by the VOH.
Page 19Brunel Pension Partnership
Brunel Global Smaller Companies Portfolio vs. MSCI World Small Cap Holdings as at 31st December 2020
Weighted Average Carbon Intensity (WACI) Industry Breakdown of Fossil Fuel Related Activities
Natural Gas Power Generation
300
Energy
Petroleum Power Generation
250
Carbon Intensity (tCO2e/mGBP)
67
Coal Power Generation
200 Support activities for oil and gas
operations
56
150 Natural gas liquid extraction
68
Extractives
Drilling oil and gas wells
100
50
145 Crude petroleum and natural gas
extraction
50
61 Tar sands extraction
0
Bituminous coal mining
Portfolio Benchmark
FY 2020
0.0% 0.5% 1.0% 1.5%
Direct Scope 2 Tier 1 Scope 3 Portfolio Benchmark
Current Year Top Contributors to WACI Top Contributors to Weighted Fossil Fuel Revenues
Name Carbon-to-Revenue intensity Weight Contr. Name Weight Weighted FF Revenue
(tCO2e/mGBP) (%) (%) (%) (mGBP)
Befesa S.A. 1,253 0.79% -4.79% TGS-NOPEC Geophysical Company 0.39%
ASA 2
Marshalls plc 1,134 0.78% -4.19% Clean Harbors, Inc. 0.23% 0
Cabot Corporation 1,933 0.37% -3.63% Seven Group Holdings Limited 0.40% 0
NEXTDC Limited 2,130 0.28% -3.02%
Kronos Worldwide, Inc. 941 0.66% -2.81%
The WACI shows the portfolio exposure to carbon intensive companies. This The Industry Breakdown of Fossil Fuel Relatred Activities chart above breaks
metric takes the carbon intensity (total carbon emissions divided by total down the 'extractives' and 'energy' revenue exposure into specific industry
revenue) of each investee and multiplies it by its weight in the portfolio. exposures.
Disclosure Rates Future Emissions from Reserves
100% 1.400 2,500
90%
1.200
Future Emissions from Reserves (MtCO2)
80% 2,000
Reserves Intensity (tCO2/mGBP)
70% 1.000
60%
1,500
0.800
50%
40% 0.600
1,000
30%
0.400
20%
500
10%
0.200
0%
GHG VOH
0.000 0
FY 2020 Portfolio Benchmark
Full Disclosure Partial Disclosure Modelled Coal Oil Gas Oil and/or Gas Intensity
Portfolio Disclosure Rates by Method Future Emissions from Reserves by Type (MtCO2)
Carbon disclosure GHG-weighted Value-weighted Source FY 2020
category disclosure disclosure Port. Ben.
Full Disclosure 24% 14% Coal 0.00 0.60
Partial Disclosure 34% 20% Oil 0.00 0.27
Modelled 43% 66% Gas 0.00 0.30
Full Disclosure - Data disclosed by a company in an un-edited form. Oil and/or Gas 0.00 0.01
Partial Disclosure - Trucost has used data disclosed by a company but has
Companies may disclose both 1P and 2P reserves (1P refers to those held with
made adjustments to match the reporting scope required by its research
90% confidence, 2P are those held with 50% confidence). Both 1P and 2P are
process. Values may also be derived from a previous year’s disclosed data using
used when assigning embedded emissions to a company.
changes in business activities and consolidated revenues.
Modelled - In the absence of usable disclosures, the data has been modelled
The chart above shows the total tonnes of apportioned CO2 from reserves,
using Trucost’s EE-IO model.
broken down by reserve type. It also shows the reserves 'intensity' by normalizing
the apportioned embedded emissions by the VOH.
Page 20Brunel Pension Partnership
2021
Disclaimer
©2021 S&P Trucost Limited (“Trucost”), an affiliate of S&P Global Market Intelligence. All rights reserved.
The materials have been prepared solely for informational purposes based upon information generally available to the
public and from sources believed to be reliable. No content contained in these materials (including text, data, reports,
images, photos, graphics, charts, animations, videos, research, valuations, models, software or other application or output
therefrom or any part thereof (“Content”) may be modified, reverse engineered, reproduced or distributed in any form or
by any means, or stored in a database or retrieval system, without the prior written permission of Trucost or its affiliates
(collectively, S&P Global). S&P Global, its affiliates and their licensors do not guarantee the accuracy, completeness,
timeliness or availability of the Content. S&P Global, its affiliates and their licensors are not responsible for any errors or
omissions, regardless of the cause, for the results obtained from the use of the Content. THE CONTENT IS PROVIDED ON AN
“AS IS” BASIS. S&P GLOBAL, ITS AFFILIATES AND LICENSORS DISCLAIM ANY AND ALL EXPRESS OR IMPLIED WARRANTIES,
CONDITIONS, INCLUDING, BUT NOT LIMITED TO, ANY WARRANTIES OF MERCHANTABILITY OR FITNESS FOR A PARTICULAR
PURPOSE OR USE, FREEDOM FROM BUGS, SOFTWARE ERRORS OR DEFECTS, THAT THE CONTENT’S FUNCTIONING WILL BE
UNINTERRUPTED OR THAT THE CONTENT WILL OPERATE WITH ANY SOFTWARE OR HARDWARE CONFIGURATION. In no event
shall S&P Global, its affiliates or their licensors be liable to any party for any direct, indirect, incidental, exemplary,
compensatory, punitive, special or consequential damages, costs, expenses, legal fees, or losses (including, without
limitation, lost income or lost profits and opportunity costs) in connection with any use of the Content even if advised of
the possibility of such damages.
Trucost’s opinions, quotes and credit-related and other analyses are statements of opinion as of the date they are
expressed and not statements of fact or recommendations to purchase, hold, or sell any securities or to make any
investment decisions, and do not address the suitability of any security. Trucost assumes no obligation to update the
Content following publication in any form or format. The Content should not be relied on and is not a substitute for the skill,
judgment and experience of the user, its management, employees, advisors and/or clients when making investment and
other business decisions.
S&P Global keeps certain activities of its divisions separate from each other in order to preserve the independence and
objectivity of their respective activities. As a result, certain divisions of S&P Global may have information that is not
available to other S&P Global divisions. S&P Global has established policies and procedures to maintain the confidentiality
of certain non-public information received in connection with each analytical process.
S&P Global may receive compensation for its ratings and certain analyses, normally from issuers or underwriters of
securities or from obligors. S&P Global reserves the right to disseminate its opinions and analyses. S&P Global's public
ratings and analyses are made available on its Web sites, www.standardandpoors.com (free of charge) and
www.ratingsdirect.com (subscription), and may be distributed through other means, including via S&P Global publications
and third-party redistributors. Additional information about our ratings fees is available at
www.standardandpoors.com/usratingsfees.
This content is produced by the Brunel Pension Partnership Limited. It is for the exclusive use of the recipient and is neither directed to, nor
intended for distribution or use by, any person or entity who is a citizen or resident of or located in any locality, state ,country or jurisdiction where
distribution, publication, availability or use of this document would be contraryto law or regulation.This content is provided for information
purposes only and is Brunel’s current view, which may be subject to change.
This doc ument does not constitute an offer or a recommendation to buy, or sell securities or financial instruments, it is designed for the use of
professional investors and their advisers. It is also not intended to be a substitute for professional financial advice, specific advice should be taken
when dealing with specific situations.
Past performance is not a guide to future performance.You can also read