BUILDING MOMENTUM Low Carbon Oxford One Year Update 2010 2011
←
→
Page content transcription
If your browser does not render page correctly, please read the page content below
BUILDING MOMENTUM: Measuring, monitoring and reporting   1

BUILDING MOMENTUM
Measuring, monitoring and reporting
                    Low Carbon Oxford
                    One Year Update
LOW CARBON OXFORD   2010 - 2011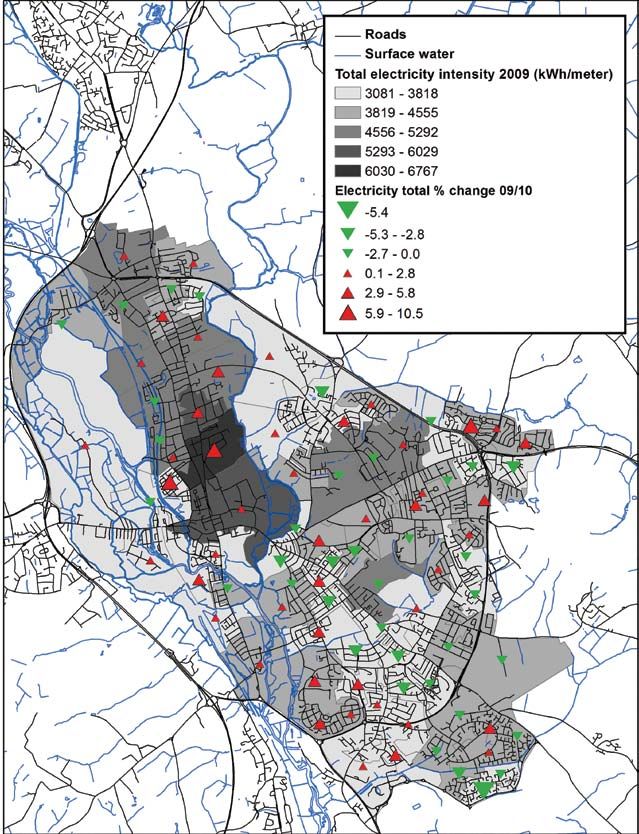
2

    Table of Contents                                                                              Foreword
    Foreword                                                                             3         Building Momentum is an important step for Low Carbon Oxford. This report
    Executive Summary                                                                    4         allows us to better understand CO2 emissions in Oxford and by doing this to take
                                                                                                   concerted and effective action together.
    Introduction                                                                         6
    City of Oxford Emissions                                                             8         In a very short time Low Carbon Oxford has succeeded in bringing together
                                                                                                   29 Pathfinders who represent a significant proportion of the carbon emissions from
    Buildings – Commercial and Industrial                                               10         Oxford City in order to collaborate in taking action to move towards a sustainable future
    Transport                                                                           19         for the city. LCO is an important and groundbreaking initiative of which we can all be
                                                                                                   proud.
    Domestic                                                                            24
    Recommendations                                                                     33         This report is an important start; it provides an initial CO2 emissions baseline for
                                                                                                   Pathfinders and begins to show trends in carbon emissions. Instead of relying on
    Appendix 1: Low Carbon Oxford Charter                                               35
                                                                                                   national statistics we have worked with individual Pathfinders to gather data about what
    Appendix 2: List of Low Carbon Oxford Pathfinders                                   36         the picture on emissions really looks like on the ground in Oxford.
    Appendix 3: Summary Data from Pathfinders                                           38         Alongside the measuring, monitoring and reporting, captured here are some wonderful
                                                                                                   case studies showcasing examples of best practice in carbon reduction in Oxford from
                                                                                                   the great work that Pathfinders are doing. My real hope is that this will inspire others to
                                                                                                   action.

                                                                                                   We are building momentum for positive change and I congratulate all the Pathfinder
                                                                                                   organisations who feature in this report.
    Acknowledgements. This report was commissioned by Oxford City Council on behalf of
    Low Carbon Oxford. It was written by Emma Alexander, Katie King and Julia Patrick with input
    from a range of Low Carbon Oxford Pathfinders. It was edited by Jo Colwell, Ian Halliday,
    Paul Robinson and Jenny Carr of Oxford City Council. The design work is by Nicky Downes.
    Photographs were supplied by MINI Plant Oxford, Oxford Brookes University, CAG Oxfordshire,
                                                                                                   DR BARBARA HAMMOND
    Oxford Bus Company, Oxfordshire County Council, Lucy Properties, Oxford City Council and
                                                                                                   Director, Low Carbon Oxford
    Low Carbon West Oxford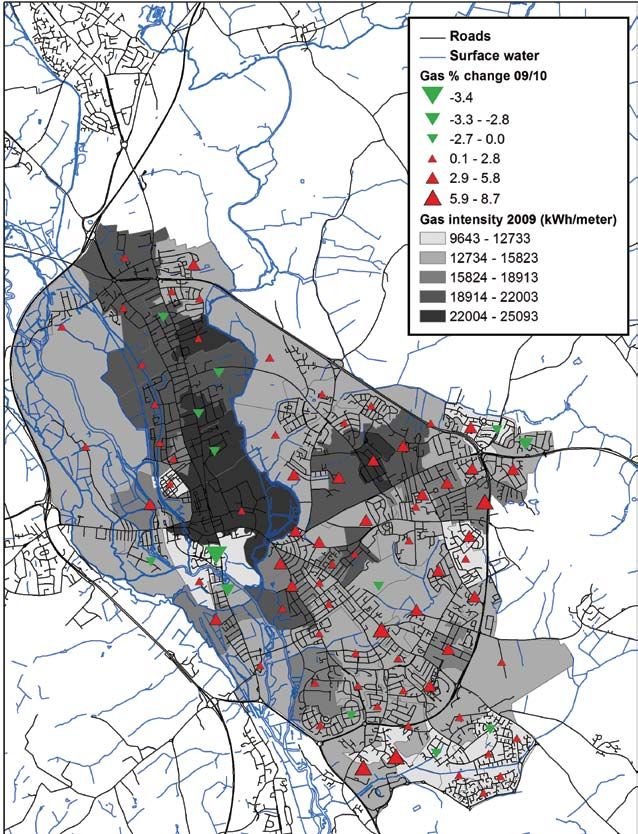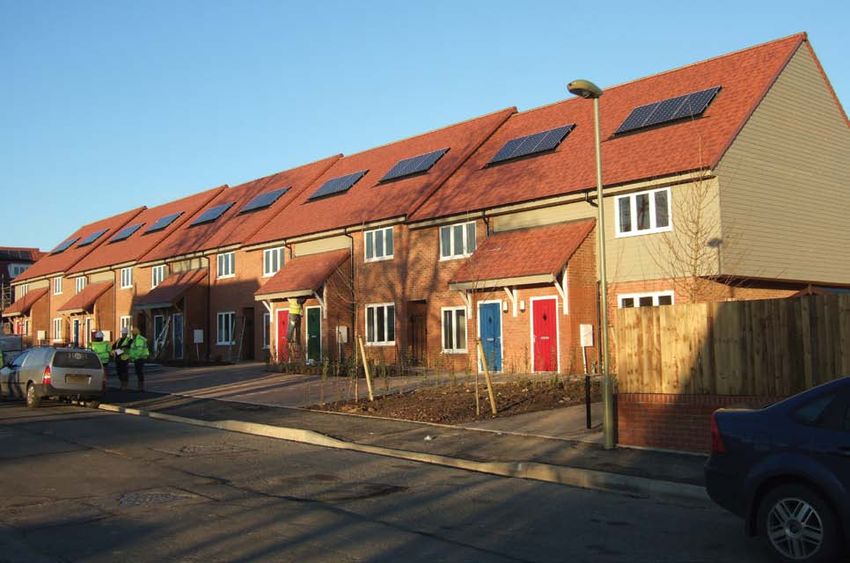
4 BUILDING MOMENTUM: Measuring, monitoring and reporting BUILDING MOMENTUM: Measuring, monitoring and reporting 5
Executive Summary
2
Background reduce the carbon footprint of Oxford City. We reduction in both gas and electricity (due Households and communities The benefits of sharing and
The Low Carbon Oxford (LCO) programme was recognise that there are some limitations to the to the timescales involved in reporting not Measuring energy consumption and emissions collaboration
launched in October 2010 with 15 Pathfinder data collection process and we aim to improve all Pathfinders were able to report on gas in the domestic sector is carried out at national One of the key benefits of being involved in LCO
1 4
organisations initially signed up . As momentum this in future years. and electricity consumption for 2011). This level by DECC (the dataset formerly used for is that Pathfinders are able to share examples
grew in the first year, membership increased to is extremely encouraging and demonstrates indicator NI 186). In Oxford, we are starting to of best practice and initiatives with one-another
25 organisations representing a large proportion Summary of key trends that even at this early stage Pathfinders are see initiatives in communities and in the private and across different sectors. We hope the case
of Oxford City’s carbon emissions. In this report Data from the Department of Energy and reducing their CO2 emissions and contributing and social rented sectors to measure energy use studies within this report inspire others to get
we present data on Pathfinders’ CO2 emissions Climate Change (DECC) tells us that the City to reducing the carbon footprint of Oxford. Of and carbon emissions in a systematic way, and involved and be part of this exciting project to
for the first time. of Oxford emissions are generally declining the four Pathfinders that provided transport data use these measurements to inform and drive reduce the carbon footprint of Oxford.
over time, showing an 11% reduction from for 2010 and 2011, two reported a reduction in carbon reductions at a local level.
3
This report is a starting point. It provides an 2005 to 2009. They also suggest that, in the CO2 emissions . How to get involved
initial CO2 emissions baseline for Pathfinders industrial and commercial sector, emissions from In the Domestic section we therefore discuss If you would like to find out more about
and begins to show trends in carbon emissions.
As LCO was only launched in October 2010,
electricity are more volatile and will need to be
addressed to hit 2020 targets. Taking action
specific initiatives from the six Pathfinder
organisations representing the sector: Lucy
LCO and get involved, please visit our
website, www.lowcarbonoxford.org
“The Hub and Low Carbon
Oxford pushed forward this
this report presents a baseline and reports on Pathfinders are implementing a great number Properties (private rental sector), A2Dominion or contact Jennifer Carr on 01865 252564
idea ofcollaboration and
progress for a limited number of Pathfinders. In Pathfinder data in the commercial and industrial and variety of actions, only some of which we (housing association), Oxford City Council or email lowcarbonoxford@oxford.gov.uk.
future years we will be able to report on progress sector show how Pathfinders significantly are able to highlight in this report. In future (social housing), Low Carbon West Oxford how to work with the limited
for the majority of Pathfinders and show the impact Oxford’s carbon footprint. In 2009 LCO years we will report on further examples of best (local community charity), West Oxford resources. We’re now working
impact that LCO is having on carbon emissions Pathfinders represented just under half of the practice and will report in more detail on the CO2 Community Renewables, WOCoRe (local a lot closer than before which
in the City. Industrial and Commercial Footprint in Oxford savings from these individual initiatives. community renewable energy enterprise) and I think it great. It’s really, really
and 9% of the total Oxford transport footprint The Community Action Group, CAG (network of
important because everyone
We are proud to have reached this point. As (the latter to be expected because Pathfinders We found that for the majority of Pathfinders, local voluntary groups in Oxfordshire engaging in
well as presenting data, this report is about are mostly reporting only fleet and business carbon emissions have an impact on business carbon reduction activities). has got limited funding, limited
celebrating achievements and showcasing miles). decisions and a significant proportion of resources [and] limited time.”
examples of best practice in carbon reduction Pathfinders are publicly reporting emissions, LCO Pathfinder
in Oxford. We hope that it will inspire others Of the nine organisations that reported data demonstrating openness and willing to share
to get involved in this collective movement to for 2010 and 2011, all of them reported a performance.
1 4
2Degrees, A2Dominion, B&Q, Blake Lapthorn, Grafton plc (Buildbase), Low Carbon West Oxford, Marks and Spencer, MINI Plant Oxford, Oxford Brookes University, Oxford City Council, Oxfordshire County The NI 186 indicator data set was developed by government to support local authority carbon reduction, providing a nationally consistent data set with a 2005 baseline. Although the national indicators
Council, Serco, Stagecoach, Unipart and University of Oxford are no longer used to monitor local authority performance by central government the dataset is still published annually by DECC. The data provides estimates of emissions from industrial and commercial,
2
Oxford City Council -10.9%, Oxford University Hospitals NHS Trust -5.6%, Oxfordshire Community & Voluntary Action -11.5%, Oxford County Council (excluding schools) -10.4% Oxford County Council domestic and road transport but excludes aviation, shipping, ETS sites and motorways because these are not considered to be within the influence of local authorities.
Schools -15.5%, The Oxford Bus Company - 8.1%, Unipart Group -17.7%, MINI Plant Oxford -12.4% and Linacre College -11.9%
3
Oxford City Council and Oxfordshire Community & Voluntary Action
6 BUILDING MOMENTUM: Measuring, monitoring and reporting BUILDING MOMENTUM: Measuring, monitoring and reporting 7
Introduction
Low Carbon Oxford (LCO) brings together In order to realise the Charter commitments, against the 2005 baseline by 2020. Targets to Latest data for 2009 shows that CO2 emissions from road transport across the City. that organisations, communities and households
private, public and non-profit organisations in Low Carbon Oxford needs to develop into a 2020 are shown in the box below, based on are 11% lower than in 2005, an average can have in reducing the carbon footprint of
6
a programme of collaboration, with the aim of strategy that will deliver 40% carbon reductions DECC Local Authority data . 2.7% reduction per year, with each category This report is a starting point. It provides Oxford. We have included some quotes that
reducing the City of Oxford’s carbon footprint. contributing as follows: a bottom-up CO2 emissions baseline for Pathfinders have made and hope that these
LCO members, or Pathfinders, have signed up • The industrial and commercial footprint is 10% Pathfinders and begins to show trends in inspire others to get involved.
to a Charter (see appendix 1) with the following Low Carbon Oxford – lower than 2005 although the emissions have carbon emissions. As LCO was only launched
commitments: -40% Targets for 40% reduction by 2020
been fairly volatile with emissions in 2006 and in October 2010, this report presents a baseline The data presented in the following pages was
• Collaborate to reduce our carbon footprints BY 2020 2008 higher than the 2005 baseline year; and reports on progress for a limited number gathered from Pathfinders via a questionnaire
across our sites and operations in Oxford City • The domestic footprint is 15% lower and of Pathfinders. In future years we will be able to and feedback event. Our analysis is split into
by a minimum of 3% average, every year, for at Industrial and commercial footprint report on progress for the majority of Pathfinders four sections:
shows a consistent tracking down;
least the next ten years; Businesses to work individually and collectively to reduce the and show the impact that LCO is having on 1. Summary of carbon emissions for the City of
• The transport footprint is 8% lower than in
• Create a low carbon, sustainable economy in industrial and commercial footprint from 563,000 tonnes of CO2 carbon emissions in the City. We recognise that Oxford (DECC dataset);
2005.
the Oxford area which will be an example to in 2005 to 338,000 tonnes in 2020. there are some limitations to the data collection 2. Non-domestic buildings: CO2 emissions
cities across the country; process and we will improve on this in future related to energy consumed in the form of
Domestic footprint As the economy picks up and once many of
years. gas and electricity in commercial, industrial
• Collaborate on creating more green jobs, Households to work individually and as part of their communities to the easiest measures have been implemented,
increased prosperity and opportunity for all; collaboration under LCO’s Energy Efficiency and public sector buildings;
reduce the domestic footprint from 308,000 tonnes of CO2 in 2005 We are proud to have reached this point. As
• Support a programme of best practice sharing to 185,000 tonnes in 2020. This target means that: Forum and similar initiatives will become 3. Transport: CO2 emissions from fuel
well as presenting data, this report is about
and piloting of sustainable innovations; Either one third of the City housing stock of 63,000 houses has increasingly important to maintain these trends consumed by road transport;
celebrating achievements and showcasing
and to meet the 2020 targets. 4. Domestic: CO2 emissions from housing and
• Report each year on the progress we are to be retrofitted to achieve 80% reductions in carbon emissions by examples of best practice in carbon reduction in
making. 2020; Oxford. We hope that it will inspire others to get local communities.
In the LCO ‘one year on’ report published in
Or the whole stock of 63,000 houses has to be retrofitted to achieve involved in this collective movement to reduce
2011, LCO made a commitment to set up a Each of these areas is discussed in turn in the
The LCO programme was launched in October 40% reductions in carbon emissions by 2020. the carbon footprint of Oxford City.
Measuring, Monitoring and Reporting process following sections.
2010 with 15 Pathfinder organisations initially
5 Transport footprint and to produce the first report presenting data
signed up . As momentum grew in the first year, The data and information we have collected is
City and County Councils to work with key actors to reduce road on Pathfinders CO2 emissions. In this report,
membership increased to 25 organisations (see presented and analysed in the following pages.
transport emissions from 145,000 tonnes of CO2 in 2005 to 87,000 for the first time, we present data from 12
appendix 1) representing a large proportion of We have highlighted examples of successful
Pathfinders representing just under 50% of the
Oxford City carbon emissions. In this report we tonnes in 2020. carbon reduction activities across all sectors and
industrial and commercial CO2 emissions and
present data on Pathfinders’ CO2 emissions for this report starts to build a picture of the impact
eight Pathfinders representing CO2 emissions
the first time.
5
Degrees, A2Dominion, B&Q, Blake Lapthorn, Grafton plc (Buildbase), Low Carbon West Oxford, Marks and Spencer, MINI Plant Oxford, Oxford Brookes University, Oxford City Council, Oxfordshire County
Council, Serco, Stagecoach, Unipart and University of Oxford.
6
“Emissions within the scope of influence of Local Authorities for 2005-2009”, previously NI 186 data.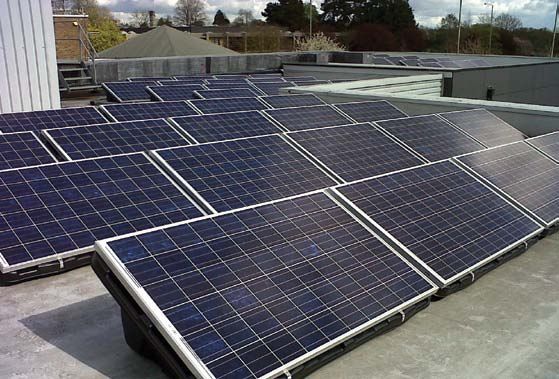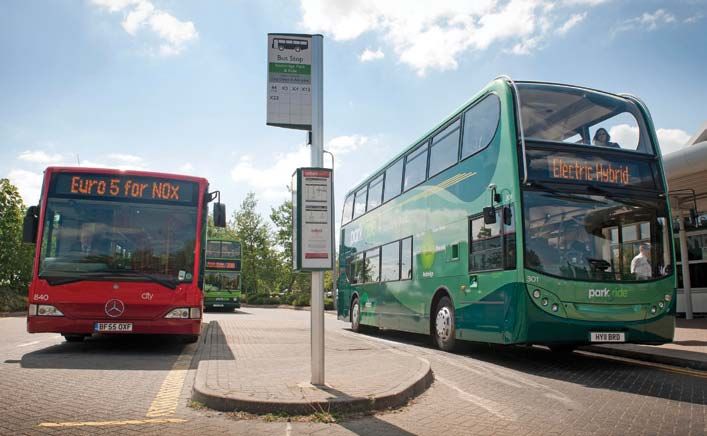
8 BUILDING MOMENTUM: Measuring, monitoring and reporting BUILDING MOMENTUM: Measuring, monitoring and reporting 9
City of Oxford Emissions and the National Context
City of Oxford Emissions and the National Context
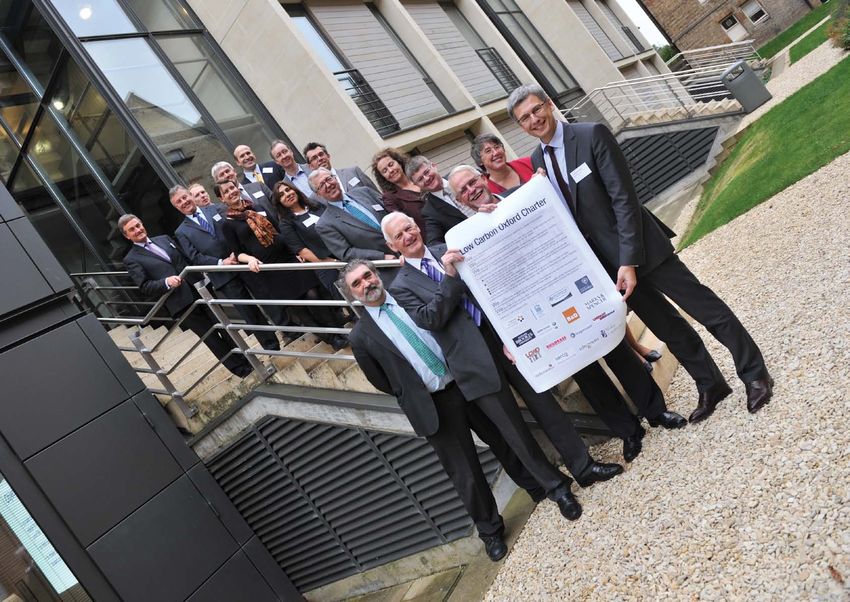
DECC publishes the local CO2 emissions Indicators of more recent change are available This additional data will feed into the wider work
7
dataset which provides a time-series of CO2 Oxford CO2 emissions (NI186 equivalent) in the DECC sub-national gas and electricity plan for the Oxford Low Emissions Strategy
emissions from 2005 to 2009 split into Industrial consumption data which are also available for (LES). Oxford City Council is developing an
& Commercial (non-domestic), Transport and 2010. The data show that total commercial integrated database of air quality and climate
8
Domestic emissions . This dataset is equivalent and industrial gas consumption has reduced change emissions and an updated LES action
to that previously used for National Indicator by 18.4% from 2005 to 2010 (and 0.8% from plan for the city. The Pathfinders’ reported
9
186 . Oxford’s total emissions are shown in 2009 to 2010) but electricity usage has been emissions and actions will be included within the
the graph in Figure 1. This shows dominance more volatile and increased by 1.6% from 2005 database which will be used to monitor progress
by the Industrial and Commercial sector (56% to 2010 (and increased by 1.3% from 2009 to across all sectors in the city and provide further
in 2009) which also includes public sector 2010). In the domestic sector gas consumption context for assessing the impact of LCO and its
emissions. It compares with a national average has reduced by 18.9% and electricity by 7.8% Pathfinders.
of 41% industrial and commercial emissions from 2005 to 2010 (gas reducing by 1.4% and
across all Local Authorities in the DECC dataset. electricity by 0.3% from 2009 to 2010).
Compared with the national average, Oxford
therefore has a lower domestic contribution to These data therefore show a mixed picture
the total and a significantly lower road transport most likely the result of a number of factors
contribution. which cannot be disaggregated. However, they
suggest that, in the industrial and commercial
Emissions are generally declining over time, sector in Oxford, emission from electricity will
showing an 11% reduction from 2005 to 2009 need to be tackled to maintain overall emission
equivalent to 2.7% per year. This compares with Figure 1 – Oxford CO2 emissions from DECC, 2009 reduction trends and reach carbon reduction
an overall reduction of 13% across all sectors targets. In future years, further data collection
nationally. The difference is due to slower and analysis of trends, and a comparison of
reductions in the industrial and commercial Pathfinder data with national data, will provide a
sector than nationally. Reductions in the clearer picture of the impact of LCO emissions
domestic sector in Oxford have been faster than reduction initiatives.
nationally, and in transport they have been at the
same rate.
7
http://www.decc.gov.uk/en/content/cms/statistics/local_auth/co2_las/co2_las.aspx
8
These data are calculated from a combination of sub-national energy consumption data collated by DECC and estimates made as part of the National Atmospheric Emissions Inventory (www.naei.org.uk).
9
The NI 186 indicator data set was developed by government to support local authority carbon reduction, providing a nationally consistent data set with a 2005 baseline. Although the national indicators
are no longer used to monitor local authority performance by central government the dataset is still published annually by DECC. The data provides estimates of emissions from industrial and commercial,
domestic and road transport but excludes aviation, shipping, ETS sites and motorways because these are not considered to be within the influence of local authorities.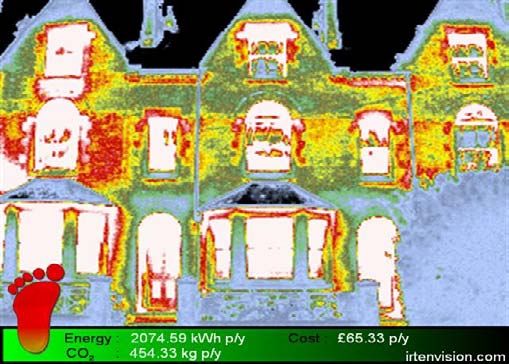
8   BUILDING MOMENTUM: Measuring, monitoring and reporting                                                                                                                                                                                                                                                     BUILDING MOMENTUM: Measuring, monitoring and reporting   9

      City of Oxford Emissions and the National Context
      City of Oxford Emissions and the National Context
      DECC publishes the local CO2 emissions                                                                                                                                                                       Indicators of more recent change are available       This additional data will feed into the wider work
              7
      dataset which provides a time-series of CO2                                        Oxford CO2 emissions (NI186 equivalent)                                                                                   in the DECC sub-national gas and electricity         plan for the Oxford Low Emissions Strategy
      emissions from 2005 to 2009 split into Industrial                                                                                                                                                            consumption data which are also available for        (LES). Oxford City Council is developing an
      & Commercial (non-domestic), Transport and                                                                                                                                                                   2010. The data show that total commercial            integrated database of air quality and climate
                            8
      Domestic emissions . This dataset is equivalent                                                                                                                                                              and industrial gas consumption has reduced           change emissions and an updated LES action
      to that previously used for National Indicator                                                                                                                                                               by 18.4% from 2005 to 2010 (and 0.8% from            plan for the city. The Pathfinders’ reported
          9
      186 . Oxford’s total emissions are shown in                                                                                                                                                                  2009 to 2010) but electricity usage has been         emissions and actions will be included within the
      the graph in Figure 1. This shows dominance                                                                                                                                                                  more volatile and increased by 1.6% from 2005        database which will be used to monitor progress
      by the Industrial and Commercial sector (56%                                                                                                                                                                 to 2010 (and increased by 1.3% from 2009 to          across all sectors in the city and provide further
      in 2009) which also includes public sector                                                                                                                                                                   2010). In the domestic sector gas consumption        context for assessing the impact of LCO and its
      emissions. It compares with a national average                                                                                                                                                               has reduced by 18.9% and electricity by 7.8%         Pathfinders.
      of 41% industrial and commercial emissions                                                                                                                                                                   from 2005 to 2010 (gas reducing by 1.4% and
      across all Local Authorities in the DECC dataset.                                                                                                                                                            electricity by 0.3% from 2009 to 2010).
      Compared with the national average, Oxford
      therefore has a lower domestic contribution to                                                                                                                                                               These data therefore show a mixed picture
      the total and a significantly lower road transport                                                                                                                                                           most likely the result of a number of factors
      contribution.                                                                                                                                                                                                which cannot be disaggregated. However, they

           suggest that, in the industrial and commercial
      Emissions are generally declining over time,                                                                                                                                                                 sector in Oxford, emission from electricity will
      showing an 11% reduction from 2005 to 2009                                                                                                                                                                   need to be tackled to maintain overall emission
      equivalent to 2.7% per year. This compares with                                Figure 1 – Oxford CO2 emissions from DECC, 2009                                                                               reduction trends and reach carbon reduction
      an overall reduction of 13% across all sectors                                                                                                                                                               targets. In future years, further data collection
      nationally. The difference is due to slower                                                                                                                                                                  and analysis of trends, and a comparison of
      reductions in the industrial and commercial                                                                                                                                                                  Pathfinder data with national data, will provide a
      sector than nationally. Reductions in the                                                                                                                                                                    clearer picture of the impact of LCO emissions
      domestic sector in Oxford have been faster than                                                                                                                                                              reduction initiatives.
      nationally, and in transport they have been at the
      same rate.

      7
        http://www.decc.gov.uk/en/content/cms/statistics/local_auth/co2_las/co2_las.aspx
      8
        These data are calculated from a combination of sub-national energy consumption data collated by DECC and estimates made as part of the National Atmospheric Emissions Inventory (www.naei.org.uk).
      9
        The NI 186 indicator data set was developed by government to support local authority carbon reduction, providing a nationally consistent data set with a 2005 baseline. Although the national indicators
      are no longer used to monitor local authority performance by central government the dataset is still published annually by DECC. The data provides estimates of emissions from industrial and commercial,
      domestic and road transport but excludes aviation, shipping, ETS sites and motorways because these are not considered to be within the influence of local authorities.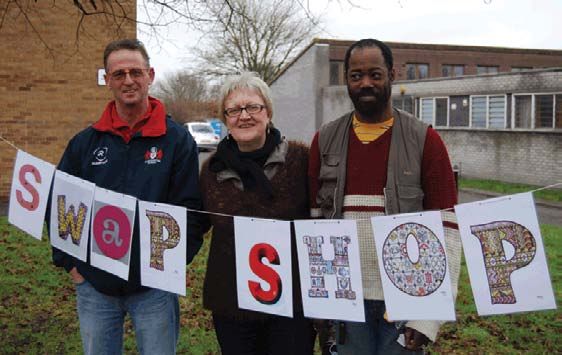
10 BUILDING MOMENTUM: Measuring, monitoring and reporting BUILDING MOMENTUM: Measuring, monitoring and reporting 11
Buildings – Commercial and Industrial Electricity 2010
KEY
Oxford commercial 1 Oxford Brookes University
LCO share of Oxford’s carbon footprint electricity 2 Oxford City Council
Pathfinder data in the commercial and industrial Commercial & industrial energy CO2 2009 3 Oxford University Hospitals NHS Trust
sector show how Pathfinders significantly 4 Oxfordshire Community & Voluntary Action
impact Oxford’s carbon footprint. In 2009 LCO Oxford commercial 5 Oxfordshire County Council
Pathfinders represented just under half of the & industrial CO2 6 Oxfordshire County Council schools
Industrial and Commercial Footprint in Oxford, 7 The Oxford Bus Company
see Figure 2. Absolute CO2 emissions for each 8 Unipart Group
organisation are shown in brackets. 9 University of Oxford
10 MINI Plant Oxford
Figures 3 and 4 show that a higher proportion
of gas consumption is represented by LCO
10
Pathfinders than for electricity . For electricity,
Pathfinders represent 46% of the total Oxford Figure 3 – Pathfinders contribution to electricity consumption in Oxford, 2010
footprint and for gas, Pathfinders represent
63%. This is likely to be because Pathfinders
KEY Gas 2010
represent some of the larger gas consuming 1 Oxford Brookes University (11194t) KEY
businesses in Oxford, for example, due to the 2 Oxford City Council (5453t)
1 Oxford Brookes University
nature of its business, the MINI Plant Oxford is 3 Oxford University Hospitals NHS Trust (41692t)
2 Oxford City Council
a large consumer of gas. 4 Oxfordshire Community & Voluntary Action (7.7t) Oxford 3 Oxford University Hospitals NHS Trust
5 Oxfordshire County Council (6041t) commercial gas 4 Oxfordshire Community & Voluntary Action
6 Oxfordshire County Council schools (5712t)
5 Oxfordshire County Council
7 The Oxford Bus Company (459t)
“Much more inspiring and 8 Unipart Group (6015t)
6
7
Oxfordshire County Council schools
The Oxford Bus Company
much more promising 9 University of Oxford (68093t)
Figure 2 – Pathfinders contribution 8 Unipart Group
because it does bring to commercial and Industrial 10 MINI Plant Oxford (96713t)
9 University of Oxford
business into that formula energy CO2 emissions, 2009 13 Linacare College (630t)
10 MINI Plant Oxford
of community and local
government. ”
LCO Pathfinder
Figure 4 – Pathfinders contribution to gas consumption in Oxford, 2010
10
Linacre College is not included in these charts, as data on energy consumption was unavailable.10 BUILDING MOMENTUM: Measuring, monitoring and reporting BUILDING MOMENTUM: Measuring, monitoring and reporting 11
Buildings – Commercial and Industrial Electricity 2010
KEY
Oxford commercial 1 Oxford Brookes University
LCO share of Oxford’s carbon footprint electricity 2 Oxford City Council
Pathfinder data in the commercial and industrial Commercial & industrial energy CO2 2009 3 Oxford University Hospitals NHS Trust
sector show how Pathfinders significantly 4 Oxfordshire Community & Voluntary Action
impact Oxford’s carbon footprint. In 2009 LCO Oxford commercial 5 Oxfordshire County Council
Pathfinders represented just under half of the & industrial CO2 6 Oxfordshire County Council schools
Industrial and Commercial Footprint in Oxford, 7 The Oxford Bus Company
see Figure 2. Absolute CO2 emissions for each 8 Unipart Group
organisation are shown in brackets. 9 University of Oxford
10 MINI Plant Oxford
Figures 3 and 4 show that a higher proportion
of gas consumption is represented by LCO
10
Pathfinders than for electricity . For electricity,
Pathfinders represent 46% of the total Oxford Figure 3 – Pathfinders contribution to electricity consumption in Oxford, 2010
footprint and for gas, Pathfinders represent
63%. This is likely to be because Pathfinders
KEY Gas 2010
represent some of the larger gas consuming 1 Oxford Brookes University (11194t) KEY
businesses in Oxford, for example, due to the 2 Oxford City Council (5453t)
1 Oxford Brookes University
nature of its business, the MINI Plant Oxford is 3 Oxford University Hospitals NHS Trust (41692t)
2 Oxford City Council
a large consumer of gas. 4 Oxfordshire Community & Voluntary Action (7.7t) Oxford 3 Oxford University Hospitals NHS Trust
5 Oxfordshire County Council (6041t) commercial gas 4 Oxfordshire Community & Voluntary Action
6 Oxfordshire County Council schools (5712t)
5 Oxfordshire County Council
7 The Oxford Bus Company (459t)
“Much more inspiring and 8 Unipart Group (6015t)
6
7
Oxfordshire County Council schools
The Oxford Bus Company
much more promising 9 University of Oxford (68093t)
Figure 2 – Pathfinders contribution 8 Unipart Group
because it does bring to commercial and Industrial 10 MINI Plant Oxford (96713t)
9 University of Oxford
business into that formula energy CO2 emissions, 2009 13 Linacare College (630t)
10 MINI Plant Oxford
of community and local
government. ”
LCO Pathfinder
Figure 4 – Pathfinders contribution to gas consumption in Oxford, 2010
10
Linacre College is not included in these charts, as data on energy consumption was unavailable.12 BUILDING MOMENTUM: Measuring, monitoring and reporting BUILDING MOMENTUM: Measuring, monitoring and reporting 13
Emerging trends at this stage due to the short data trends being to relate any energy consumption trends to
Percentage change Tonnes of CO2 Tonnes of CO2 Tonnes of CO2
Pathfinder Of the eight organisations that reported data for analysed, this shows a positive trend in the right economic growth and business changes.
in CO2 2010 - 2011 2011 2010 2009
2010 and 2011, all of them reported a reduction direction. The reporting process should include more
Buildbase Data for 2011 only 448 n/a n/a in both gas and electricity (due to the timescales in depth dialogue between Pathfinders to
involved in reporting not all Pathfinders were able Based on the data collected thus far we are not discuss data trends and factors that may
Oxford Brookes Data for 2009 and
University n/a 10,717 11,194 to report on gas and electricity consumption yet in a position to directly compare the above influence these. We may also wish to correct
2010 only
for 2011). This is extremely encouraging and emissions savings with the data for Oxford City data for weather influences. This would give
Oxford City Council -10.9 4,579 5,141 5453 demonstrates that even at this early stage available in the DECC NI186 dataset. This is context to the emissions changes and account
Pathfinders are reducing their CO2 emissions because DECC data are not yet available for for influences other than energy efficiency
Oxford University and contributing to reducing the carbon footprint 2011 and the Pathfinders data cannot yet be initiatives, and generally allow more meaningful
Hopsitals NHS Trust -5.6 41,616 44,083 41,692
of Oxford. corrected for the weather related increases in interpretation of data.
Oxfordshire Community 2010 (without more detailed understanding
-11.5 7.0 7.9 7.7
Case study 1 gives an example of how MINI of the proportion of gas used for heating). Similarly, whilst the 3% yearly reduction target is
& Voluntary Action
Plant Oxford is reducing carbon by identifying However it can be suggested that 2009 to an important benchmark for Pathfinders, LCO
Oxfordshire County -10.4 5244 5852 6041 ‘enablers’ in its production process, case study 2010 increases in gas emissions are likely to is likely to gain more meaningful indications of
Council 2 shows how Oxford City Council has reduced be mostly related to weather factors and that success over slightly longer time periods, for
its carbon emissions by putting carbon reduction this trend is likely to be reversed in 2011 across example every three years.
Oxfordshire County
Council - schools
-15.5 5112 6048 5712 at the heart of everything they do and case the City, illustrated by the data above and also
The Oxford Bus -8.1 445 484 459
study 3 shows how Oxford Brookes University
has reduced carbon emissions through
shown in the provisional national data for the
UK, published earlier this year by DECC .
12 “At least from my knowledge, and
from the networks I was involved
Company embracing corporate responsibility as a core 2009 to 2010 increases in Pathfinder electricity
in so far, it’s not very often you
value and implementing a strong governance emissions mirror DECC Oxford City data and
Unipart Group -17.7 5,817 7070 6,015
structure. may again suggest electricity emissions as an
have a network with the whole
Data for 2009 and area to target, with figures for 2010 to 2011 variety of companies, branches,
University of Oxford n/a 68,567 68,093
2010 only Table 1 shows these emerging trends in more showing movement in the right direction. Again, businesses, public bodies, from
MINI Plant Oxford -12.4 86,809 99,152 96,713 detail: of the eight organisations that provided further data collection and analysis of trends a city council to a university, a
data for 2010 and 2011, all of them reported a over more years will provide a clearer picture of hospital, a bus company, a car
B&Q Data for 2011 only 413 n/a n/a 11
reduction in CO2 emissions , despite several the impact of emissions reduction initiatives. manufacturer: a wide range…but
LInacre College
-11.9 496 563 630
of them reporting increases between 2009 and
2010 (the year before LCO began,) likely to be Reporting in future years could be further
under a common goal. ”
because of the cold start and end to 2010. improved by asking Pathfinders to provide LCO Pathfinder
Table 1 – Percentage change in Pathfinder’s contribution to commercial and industrial buildings CO2 Whilst it is difficult to draw many conclusions more commentary on data trends, for example
emissions 2010 to 2011 and tonnes of CO2 produced in 2009, 2010 and 2011
11 12
Oxford City Council -10.9%, Oxford University Hospitals NHS Trust -5.6%, Oxfordshire Community & Voluntary Action -11.5%, Oxfordshire County Council -10.4%, Oxfordshire County Council Schools http://www.decc.gov.uk/assets/decc/11/stats/climate-change/4817-2011-uk-greenhouse-gas-emissions-provisional-figur.pdf
-15.5%, The Oxford Bus Company - 8.1%, Unipart Group -17.7%, MINI Plant Oxford -12.4% and Linacre College -11.9%12 BUILDING MOMENTUM: Measuring, monitoring and reporting BUILDING MOMENTUM: Measuring, monitoring and reporting 13
Emerging trends at this stage due to the short data trends being to relate any energy consumption trends to
Percentage change Tonnes of CO2 Tonnes of CO2 Tonnes of CO2
Pathfinder Of the eight organisations that reported data for analysed, this shows a positive trend in the right economic growth and business changes.
in CO2 2010 - 2011 2011 2010 2009
2010 and 2011, all of them reported a reduction direction. The reporting process should include more
Buildbase Data for 2011 only 448 n/a n/a in both gas and electricity (due to the timescales in depth dialogue between Pathfinders to
involved in reporting not all Pathfinders were able Based on the data collected thus far we are not discuss data trends and factors that may
Oxford Brookes Data for 2009 and
University n/a 10,717 11,194 to report on gas and electricity consumption yet in a position to directly compare the above influence these. We may also wish to correct
2010 only
for 2011). This is extremely encouraging and emissions savings with the data for Oxford City data for weather influences. This would give
Oxford City Council -10.9 4,579 5,141 5453 demonstrates that even at this early stage available in the DECC NI186 dataset. This is context to the emissions changes and account
Pathfinders are reducing their CO2 emissions because DECC data are not yet available for for influences other than energy efficiency
Oxford University and contributing to reducing the carbon footprint 2011 and the Pathfinders data cannot yet be initiatives, and generally allow more meaningful
Hopsitals NHS Trust -5.6 41,616 44,083 41,692
of Oxford. corrected for the weather related increases in interpretation of data.
Oxfordshire Community 2010 (without more detailed understanding
-11.5 7.0 7.9 7.7
Case study 1 gives an example of how MINI of the proportion of gas used for heating). Similarly, whilst the 3% yearly reduction target is
& Voluntary Action
Plant Oxford is reducing carbon by identifying However it can be suggested that 2009 to an important benchmark for Pathfinders, LCO
Oxfordshire County -10.4 5244 5852 6041 ‘enablers’ in its production process, case study 2010 increases in gas emissions are likely to is likely to gain more meaningful indications of
Council 2 shows how Oxford City Council has reduced be mostly related to weather factors and that success over slightly longer time periods, for
its carbon emissions by putting carbon reduction this trend is likely to be reversed in 2011 across example every three years.
Oxfordshire County
Council - schools
-15.5 5112 6048 5712 at the heart of everything they do and case the City, illustrated by the data above and also
The Oxford Bus -8.1 445 484 459
study 3 shows how Oxford Brookes University
has reduced carbon emissions through
shown in the provisional national data for the
UK, published earlier this year by DECC .
12 “At least from my knowledge, and
from the networks I was involved
Company embracing corporate responsibility as a core 2009 to 2010 increases in Pathfinder electricity
in so far, it’s not very often you
value and implementing a strong governance emissions mirror DECC Oxford City data and
Unipart Group -17.7 5,817 7070 6,015
structure. may again suggest electricity emissions as an
have a network with the whole
Data for 2009 and area to target, with figures for 2010 to 2011 variety of companies, branches,
University of Oxford n/a 68,567 68,093
2010 only Table 1 shows these emerging trends in more showing movement in the right direction. Again, businesses, public bodies, from
MINI Plant Oxford -12.4 86,809 99,152 96,713 detail: of the eight organisations that provided further data collection and analysis of trends a city council to a university, a
data for 2010 and 2011, all of them reported a over more years will provide a clearer picture of hospital, a bus company, a car
B&Q Data for 2011 only 413 n/a n/a 11
reduction in CO2 emissions , despite several the impact of emissions reduction initiatives. manufacturer: a wide range…but
LInacre College
-11.9 496 563 630
of them reporting increases between 2009 and
2010 (the year before LCO began,) likely to be Reporting in future years could be further
under a common goal. ”
because of the cold start and end to 2010. improved by asking Pathfinders to provide LCO Pathfinder
Table 1 – Percentage change in Pathfinder’s contribution to commercial and industrial buildings CO2 Whilst it is difficult to draw many conclusions more commentary on data trends, for example
emissions 2010 to 2011 and tonnes of CO2 produced in 2009, 2010 and 2011
11 12
Oxford City Council -10.9%, Oxford University Hospitals NHS Trust -5.6%, Oxfordshire Community & Voluntary Action -11.5%, Oxfordshire County Council -10.4%, Oxfordshire County Council Schools http://www.decc.gov.uk/assets/decc/11/stats/climate-change/4817-2011-uk-greenhouse-gas-emissions-provisional-figur.pdf
-15.5%, The Oxford Bus Company - 8.1%, Unipart Group -17.7%, MINI Plant Oxford -12.4% and Linacre College -11.9%14 BUILDING MOMENTUM: Measuring, monitoring and reporting BUILDING MOMENTUM: Measuring, monitoring and reporting 15
Case study 1 Case study 2
MINI Plant Oxford - Identifying ‘enablers’: Oxford City Council – Carbon Reduction at the Heart of everything we do
a new philosophy to decarbonise processes
Oxford City Council is a non-metropolitan its estate and operations as efficiently and
district council. Driven by the Council’s effectively as possible.
MINI Plant Oxford’s approach to sustainability The Energy Efficiency Forum ambition to reduce its environmental impact
combines a longer term focus on technological MINI Plant Oxford seeks to work with and the amount of fossil fuels it consumes, Most carbon reduction capacity in Oxford
innovations and opportunities with ongoing other companies and organisations like Oxford City Council adopted its first Carbon City Council to date has come from a range
efforts to reduce energy consumption within the Universities and City Council. As part Management Strategy and Implementation of initiatives such as:
manufacturing processes. of Low Carbon Oxford MINI Plant Oxford Plan (Getting our House in Order) in 2008/09 • Pool covers, lighting upgrades, Variable
hosted the Energy Efficiency Forum to share which mapped out a path to a lower carbon Speed Drives (invertors), insulation A phased installation of the lower energy
Over the last year MINI Plant Oxford has knowledge and experience in reducing energy council over five years. Baseline year (2005/6) measures; lamps was carried out leading to a greater
introduced a new ‘enabler tree’ approach in consumption. The forum was centered on CO2 emissions for the original scope were • Staff awareness programmes and active than 40% reduction in energy consumption
order to map its energy consuming processes a number of common interest projects, in around 10,000t CO2. By March 2011, carbon champions network; saving an estimated £33,000 and 178t CO2/
and look at the key drivers for consumption particular, LED lighting, radiant heating, the Council had met its first key target to • Fleet energy reductions; year. The profile chart below shows the
– the ‘enablers’. With the process mapped in data centre energy optimization and staff implement a range of carbon reduction • Reductions in council generated waste sent change in consumption comparing annual
this way, [MINI] Plant Oxford has been able engagement. During 2011 three events took measures to reduce CO2 emissions by 25% to landfill; consumption in 2011/12 after full completion
to identify and predict how changing one place where various ideas were shared. by the end of March 2011 and 3% year on • Renewable energy installations (e.g. of the project with consumption during the
parameter can affect an entire process. The year thereafter. photovoltaics at leisure centres & sheltered baseline year (2005/06).
enabler tree approach is helping the plant’s housing).
managers to understand the underlying
factors that influence energy consumption
“As one of the largest employers in The Carbon reduction plan is now being
updated with an expanded scope and Highlighting one of the Council’s larger scale
Oxfordshire we are committed to making Westgate Car Park electricity consumption before
and business results, and thereby identify a stretch target to achieve 5% per year projects completed as part of its carbon
our contribution towards a lower carbon and after lighting upgrade
processes that can be optimized. In the CO2 reduction for the next five years. The management programme is a major lighting 2005-06
community. This initiative fits in perfectly 2011-12
paint shop, for example, refinements to intention is to accelerate the Council’s own upgrade at Westgate multi-storey car park. 80000
with our BMW Group objectives to establish carbon reductions and also to demonstrate Over 1000 old style T8 fluorescent lamps 70000
the ventilation system mean that warm 60000
air that was previously vented into the sustainable business practices. We are leadership to other LCO members by going were upgraded to T5 lower energy lamps. 50000
keen to share best practice in energy beyond the 3% per year target that LCO The site consumed around 780,000 kWh of
kWh
atmosphere is now fed back into the system 40000
to supply the main paint spray booths. This reduction with other local businesses to Pathfinders sign up to. The plan outlines the electricity per year, costing around £70,000 30000
20000
measure contributed to energy savings of
approximately 6,000 MWh and CO2 savings
help us all reduce our carbon footprint. ” Council’s vision to place “Carbon Reduction
at the Heart of everything we do” and
per year, prior to the lighting upgrade with
lighting being the main source of electricity
10000
2
Dr Jochen Lorenzen, Director of Finance and continue to reduce carbon emissions in consumption at the site.
of around 1,250t in 2011. r ay un ul ug ep ct ov ec an eb ar
Production Control at MINI Plant Oxford Ap M J J A S O N D J F M
Month14 BUILDING MOMENTUM: Measuring, monitoring and reporting BUILDING MOMENTUM: Measuring, monitoring and reporting 15
Case study 1 Case study 2
MINI Plant Oxford - Identifying ‘enablers’: Oxford City Council – Carbon Reduction at the Heart of everything we do
a new philosophy to decarbonise processes
Oxford City Council is a non-metropolitan its estate and operations as efficiently and
district council. Driven by the Council’s effectively as possible.
MINI Plant Oxford’s approach to sustainability The Energy Efficiency Forum ambition to reduce its environmental impact
combines a longer term focus on technological MINI Plant Oxford seeks to work with and the amount of fossil fuels it consumes, Most carbon reduction capacity in Oxford
innovations and opportunities with ongoing other companies and organisations like Oxford City Council adopted its first Carbon City Council to date has come from a range
efforts to reduce energy consumption within the Universities and City Council. As part Management Strategy and Implementation of initiatives such as:
manufacturing processes. of Low Carbon Oxford MINI Plant Oxford Plan (Getting our House in Order) in 2008/09 • Pool covers, lighting upgrades, Variable
hosted the Energy Efficiency Forum to share which mapped out a path to a lower carbon Speed Drives (invertors), insulation A phased installation of the lower energy
Over the last year MINI Plant Oxford has knowledge and experience in reducing energy council over five years. Baseline year (2005/6) measures; lamps was carried out leading to a greater
introduced a new ‘enabler tree’ approach in consumption. The forum was centered on CO2 emissions for the original scope were • Staff awareness programmes and active than 40% reduction in energy consumption
order to map its energy consuming processes a number of common interest projects, in around 10,000t CO2. By March 2011, carbon champions network; saving an estimated £33,000 and 178t CO2/
and look at the key drivers for consumption particular, LED lighting, radiant heating, the Council had met its first key target to • Fleet energy reductions; year. The profile chart below shows the
– the ‘enablers’. With the process mapped in data centre energy optimization and staff implement a range of carbon reduction • Reductions in council generated waste sent change in consumption comparing annual
this way, [MINI] Plant Oxford has been able engagement. During 2011 three events took measures to reduce CO2 emissions by 25% to landfill; consumption in 2011/12 after full completion
to identify and predict how changing one place where various ideas were shared. by the end of March 2011 and 3% year on • Renewable energy installations (e.g. of the project with consumption during the
parameter can affect an entire process. The year thereafter. photovoltaics at leisure centres & sheltered baseline year (2005/06).
enabler tree approach is helping the plant’s housing).
managers to understand the underlying
factors that influence energy consumption
“As one of the largest employers in The Carbon reduction plan is now being
updated with an expanded scope and Highlighting one of the Council’s larger scale
Oxfordshire we are committed to making Westgate Car Park electricity consumption before
and business results, and thereby identify a stretch target to achieve 5% per year projects completed as part of its carbon
our contribution towards a lower carbon and after lighting upgrade
processes that can be optimized. In the CO2 reduction for the next five years. The management programme is a major lighting 2005-06
community. This initiative fits in perfectly 2011-12
paint shop, for example, refinements to intention is to accelerate the Council’s own upgrade at Westgate multi-storey car park. 80000
with our BMW Group objectives to establish carbon reductions and also to demonstrate Over 1000 old style T8 fluorescent lamps 70000
the ventilation system mean that warm 60000
air that was previously vented into the sustainable business practices. We are leadership to other LCO members by going were upgraded to T5 lower energy lamps. 50000
keen to share best practice in energy beyond the 3% per year target that LCO The site consumed around 780,000 kWh of
kWh
atmosphere is now fed back into the system 40000
to supply the main paint spray booths. This reduction with other local businesses to Pathfinders sign up to. The plan outlines the electricity per year, costing around £70,000 30000
20000
measure contributed to energy savings of
approximately 6,000 MWh and CO2 savings
help us all reduce our carbon footprint. ” Council’s vision to place “Carbon Reduction
at the Heart of everything we do” and
per year, prior to the lighting upgrade with
lighting being the main source of electricity
10000
2
Dr Jochen Lorenzen, Director of Finance and continue to reduce carbon emissions in consumption at the site.
of around 1,250t in 2011. r ay un ul ug ep ct ov ec an eb ar
Production Control at MINI Plant Oxford Ap M J J A S O N D J F M
MonthYou can also read