JUNE 2020 INVESTOR PRESENTATION - NEXTERA ...

Page created by Marvin Holland
 
CONTINUE READING
JUNE 2020 INVESTOR PRESENTATION - NEXTERA ...
June 2020 Investor Presentation
JUNE 2020 INVESTOR PRESENTATION - NEXTERA ...
Cautionary Statements And Risk Factors That May Affect
Future Results
These presentations include forward-looking statements within the meaning of the federal
securities laws. Actual results could differ materially from such forward-looking statements.
The factors that could cause actual results to differ are discussed in the Appendix herein
and in NextEra Energy’s and NextEra Energy Partners’ SEC filings.

Non-GAAP Financial Information
These presentations refer to certain financial measures that were not prepared in
accordance with U.S. generally accepted accounting principles. Reconciliations of those
non-GAAP financial measures to the most directly comparable GAAP financial measures
can be found in the Appendix herein.

Other
See Appendix for definition of Adjusted Earnings, Adjusted EBITDA and CAFD
expectations.

2
JUNE 2020 INVESTOR PRESENTATION - NEXTERA ...
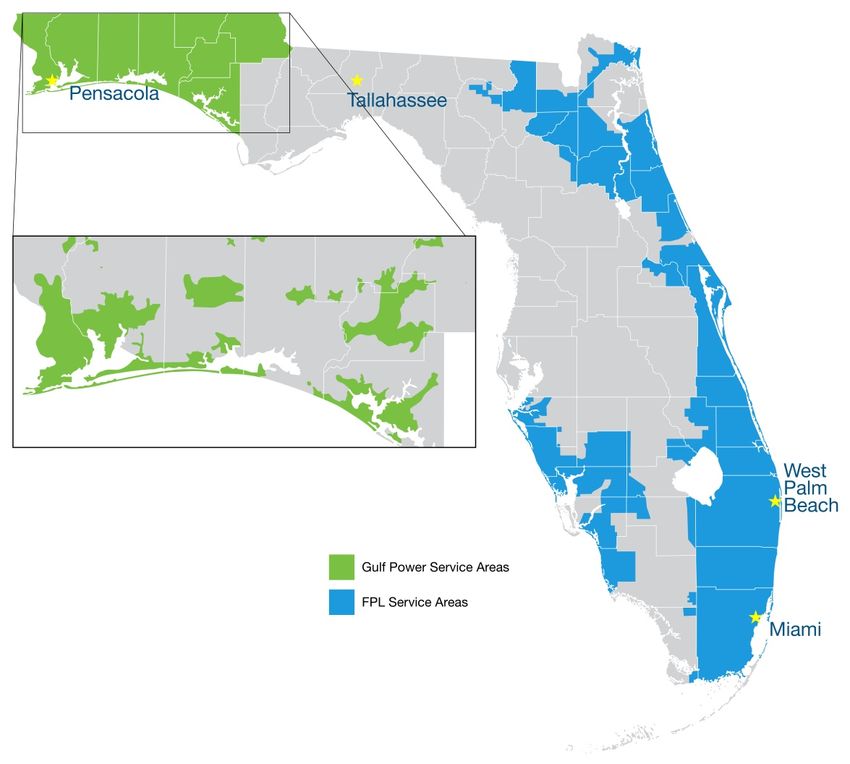
NextEra Energy is comprised of strong businesses
    supported by a common platform

                                                                    • ~$125 B market capitalization(1)
                                                                    • ~54 GW in operation(2)
                                                                    • ~$121 B in total assets(3)

                                   • The largest electric utility
                                     in the United States by
                                     retail MWh sales

                                   • Provides electric service                                • The world leader in
                                     to over 470,000 customers                                  electricity generated
                                     in northwest Florida                                       from the wind and sun

                                       Engineering & Construction
                                              Supply Chain
                                    Wind, Solar, and Fossil Generation
                                           Nuclear Generation
     1) As of May 29, 2020; Source: FactSet
     2) Megawatts shown includes assets operated by Energy Resources owned by NextEra Energy Partners as of
        March 31, 2020
3    3) As of March 31, 2020
JUNE 2020 INVESTOR PRESENTATION - NEXTERA ...
NextEra Energy is focused on delivering on its commitments
during this challenging time

              NextEra Energy COVID-19 Response
•   Safety of our employees and the community remains our number
    one priority
•   We are committed to doing the right thing
    – FPL and Gulf Power suspended disconnects and customers received an
      accelerated flow back of fuel savings in May
•   NextEra Energy’s culture and people continue to be our most
    important assets
    – Despite disruption of their daily lives, employees’ focus on doing their jobs
      and delivering an essential resource for customers has been unwavering
•   We continue to execute in all areas of the business
    – Pandemic has not impacted performance of the generating fleet or T&D
      system
    – Outstanding performance with nuclear refueling outages
    – Largest construction program in our history remains on schedule and on
      budget

4
JUNE 2020 INVESTOR PRESENTATION - NEXTERA ...
NextEra Energy’s strategic focus remains unchanged

                                NextEra Energy Strategic Focus
•    FPL and Gulf Power remain focused on delivering outstanding
     customer value
       – Value of FPL’s smart capital investments has never been more clear
       – Ongoing capital investment program at both companies remains on track
•    Energy Resources continues to capitalize on the outstanding
     renewables development environment
       – Announced ~1,600 MW added to backlog, including 600 MW of 2022+
         wind on 1st quarter earnings call
       – Expect all of our 2020 wind and solar projects will achieve their in-service
         dates this year
•    NextEra Energy’s balance sheet strength and access to capital
     remain a core strategic focus
      – Issued $2.5 billion in equity units in mid-February and ~$4 B(1) in longer-
         term financings since the market disruption began
      – Maintain net liquidity position of ~$12 B(2)
        NextEra Energy is resilient and very well-positioned to deliver for
    customers and shareholders regardless of economic or market conditions

      1) As of April 22, 2020
5     2) As of March 31, 2020; see Appendix for additional details
JUNE 2020 INVESTOR PRESENTATION - NEXTERA ...
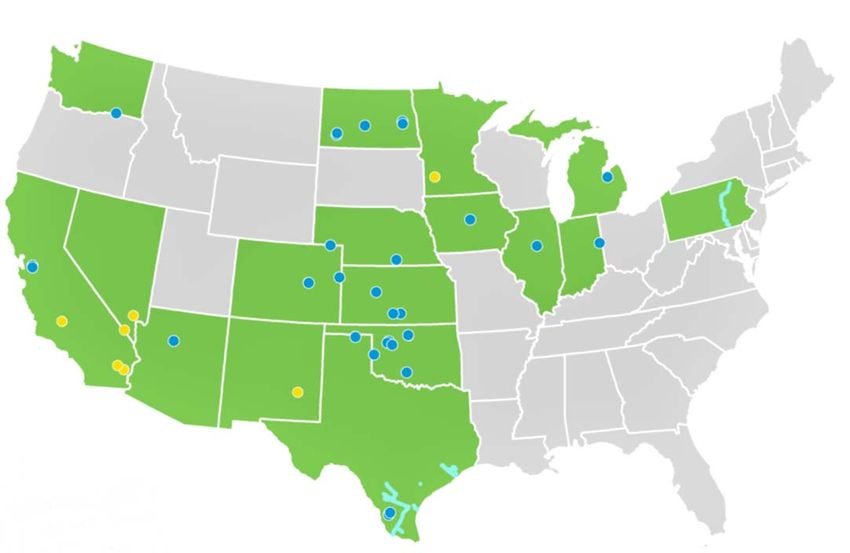
We have a long-term track record of delivering value to
            shareholders

            Adjusted Earnings Per Share                                                 Total Shareholder Return(1)
                                                                             $8.37   50%                                       119%
                                                                                                43%                120%
                                                                                     40%                           100%
                                                                                                             32%
                                                                                     30%               26%         80%
$2.49                                                                                                              60%                48% 53%
                                                                                     20%
                                                                                                                   40%
                                                                                     10%
                                                                                                                   20%
 '04 '05 '06 '07 '08 '09 '10 '11 '12 '13 '14 '15 '16 '17 '18 '19
                                                                                      0%                            0%
                                                                                                  One Year                      Three Year

                 Dividends Per Share                                                 180%
                                                                                     160%
                                                                                                162%               600%
                                                                                                                               530%
                                                                             $5.00                                 500%
                                                                                     140%
                                                                                     120%                          400%
                                                                                     100%
                                                                                                             74%   300%                    257%
                                                                                      80%              63%                          205%
                                                                                      60%                          200%
$1.30                                                                                 40%
                                                                                                                   100%
                                                                                      20%
                                                                                       0%                        0%
                                                                                                 Five Year                       Ten Year
'04 '05 '06 '07 '08 '09 '10 '11 '12 '13 '14 '15 '16 '17 '18 '19
                                                                                            ■    NEE ■ S&P 500 Utility Index    ■  S&P 500

             No management team in the industry is more aligned with shareholders

        6    1) Source: FactSet; includes dividend reinvestment as of 12/31/2019
JUNE 2020 INVESTOR PRESENTATION - NEXTERA ...
Over a sustained period of time, our growth strategy has led
    to real change in relative position

      Top 20 Global Utility Equity Market Capitalization(1)
                     As of 6/1/2001 ($ MM)                      As of 5/29/2020 ($ MM)
           Rank            Market Cap                    Rank      Market Cap
             1              $38,574                        1         $125,084    NextEra Energy
             2              $38,185                        2         $78,043
             3              $34,476                        3         $71,345
             4              $34,111                        4         $69,547
             5              $30,955                        5         $62,925
             6              $23,906                        6         $60,263
             7              $21,537                        7         $53,541
             8              $20,093                        8         $49,361
             9              $17,297                        9         $42,248
            10              $16,873                       10         $40,181
            11              $16,279                       11         $37,330
            12              $15,884                       12         $36,932
            13              $15,785                       13         $34,143
            14              $14,601                       14         $28,935
            15              $14,461                       15         $28,809
            16              $14,223                       16         $28,474
            17              $13,773                       17         $28,160
            18              $13,550                       18         $27,929
            19              $13,136                       19         $27,467
            20              $12,934                       20         $26,944

            30              $10,206     NextEra Energy
7     1) Source: Factset
JUNE 2020 INVESTOR PRESENTATION - NEXTERA ...
We have established a target to reduce our carbon emissions
     rate by 67% by 2025, off a 2005 base
                Creating a Sustainable Energy Future for America
                                                                                               Investing in our Team
             Respecting the Environment                                                     & Sustaining Communities(2)
   2,500                  CO2 Emissions Rate(1)
   2,000
                                                                                          1.1 MM Hours of employee training
Lbs
Per 1,500
                                                                                            +80% Improved safety performance since 2003
                                                               NextEra
MWh
   1,000                                                       Energy                    ~$100 B Capital invested from 2009 - 2018
     500                                                                                $663 MM Property taxes paid to support local communities
                     Top 50 Power Producers in U.S.
         0                                                                                 85,000 Employee volunteer hours

             Outstanding Customer Value(3)                                                   Commitment to Excellence
       $1,100                                                            $10
       $1,000
         $900                                                            $8
         $800
 Annual $700                                                                  Cumulative
  Fuel $600                                                              $6 Savings
 Savings
         $500                                                                   ($ B)
 ($ MM) $400                                                             $4
         $300
         $200                                                            $2
         $100
          $-                                                             $-
                  2002 2004 2006 2008 2010 2012 2014 2016 2018
                   Annual Fuel Savings             Cumulative Savings
             1) MJ Bradley & Associates report released June 2018: “Benchmarking the Largest 100 Electric Power Producers in
                the U.S.”
             2) As of year-end 2018
             3) Historical fuel savings were computed using the actual fossil fuel costs in each year compared to what the fuel cost
     8          would have been using the 2001 heat rate and the actual price of fuel in each year; savings reflect the value of
                efficiency improvements
JUNE 2020 INVESTOR PRESENTATION - NEXTERA ...
NextEra Energy was the first to receive a “Best In Class”
    assessment from S&P’s evaluation on ESG preparedness

                                       2019 S&P ESG Evaluation(1)
    •     “…high performance and innovative culture demonstrates
          excellent commitment to long-term sustainability”
    •     Factors in report distinguishing NextEra Energy from peers:
             Environmental                                          Social                                   Governance
    •    Emphasis on                               •    High customer                             •    Strong checks and
         decarbonizing                                  satisfaction driven by                         balances including
         generation fleet                               technological                                  an effective and
    •    99% of water recycled                          innovations, reliability                       rotating lead
         and 80% from non-                              and low bills                                  independent director
         potable sources                           •    Strong safety                             •    Independent and
    •    Preventative measures                          management plan                                proficient board
         to minimize impact on                     •    More proactive than
         wildlife                                       peers in addressing
                                                        diversity

    In our view, no one in any industry has done more than NextEra Energy to
                              address CO2 emissions

        1) Source: “Environmental, Social, and Governance (ESG) Evaluation: NextEra Energy Inc.” report published by
9          S&P Global Ratings on June 17, 2019
JUNE 2020 INVESTOR PRESENTATION - NEXTERA ...
We are well positioned to continue our track record of growth
                     Wholesale                            FPL              FPL
        Gas          & Service        FPL Coal           Energy           Under-
       Utility        Territory      Retirements        Services        grounding
                     Expansion

                   FPL
                                  FPL            FPL T&D        FPL New
                 Battery                      Infrastructure
                 Storage
                                  Solar                        Generation                Expect
                                                                                     $50 B - $55 B
                                                                                        of capital
                                                            FPL
      Capital          Gulf                              Generation         Asset     deployment
     Recycling        Power           Growth            Modernization       M&A
                                                                                       from 2019
                                                                                    through 2022;
                                                                                    ~$12 B - $14 B
                                                                                        per year
                                          Battery      Distributed    Competitive
       New Wind        New Solar
                                          Storage      Generation    Transmission

                                                       Customer
                         Gas               Gas
                                                        Supply
                       Pipelines     Infrastructure
                                                       & Trading

           We believe we have the industry’s leading growth
                             prospects
10
We expect the industry’s disruptive factors will further
 expand and accelerate over the coming years

                          Disruptive Industry Changes Today
                                                                            Potential Cost per MWh Post-2023/2024(1)
                           AI /                                                                        ($/MWh)
                         Machine
                         Learning                                               Near-Firm Wind                              $20 - $30
        Big Data                        Renewables /
                                          Storage                               Near-Firm Solar                                     $30 - $40
                                                                                      Natural Gas                       $30 - $40
                                                                                    Existing Coal                           $35 - $50
                                                   ESG &
Smart                                            Renewable                     Existing Nuclear                             $35 - $50
 Grid                                              Policy
                                                 Tailwinds                                                      Storage Adder
                                                                             U.S. Electricity Production by Fuel Type(2)
    Shale                                       Cost
     Gas                                    Restructuring

                                                                                          2019                               2030E
             Shareholder        Generation
              Activism         Restructuring

                                                                         Wind & Solar          Natural Gas         Coal & Nuclear        Other

   1) Represents projected cost per MWh for new build wind, solar, and natural gas; excludes PTC for wind and
      assumes 10% ITC for solar; projected per MWh operating cost including fuel for existing nuclear and coal; based
      on NextEra Energy internal estimates
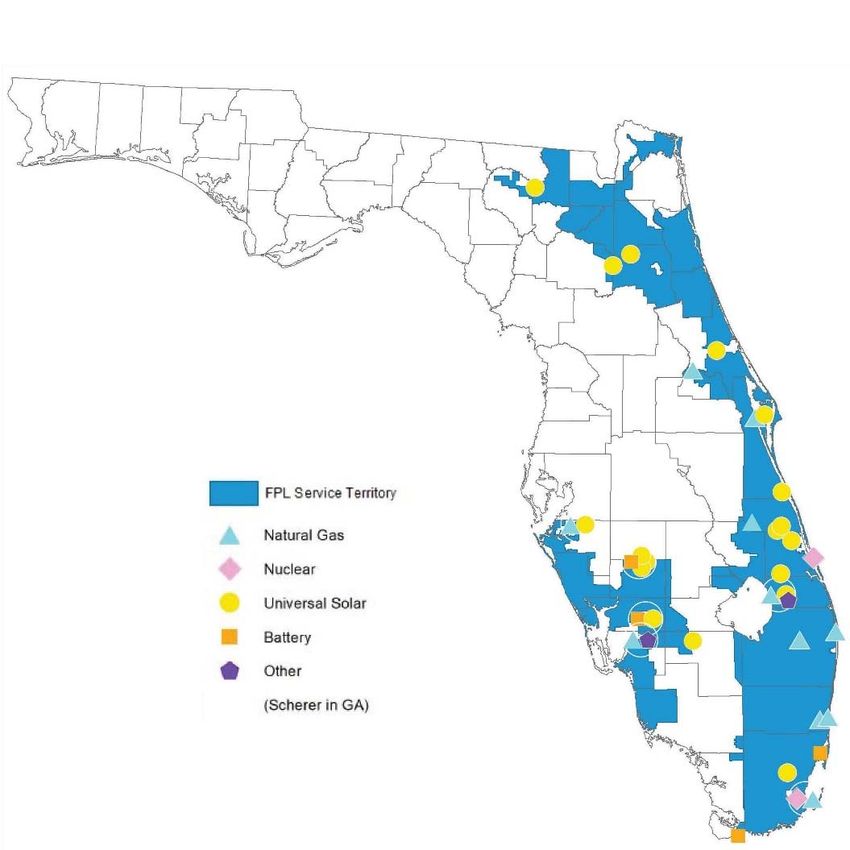
11 2) 2019 source: U.S. EIA; 2030 estimate source: National Renewable Energy Laboratory (NREL)
Florida Power & Light is recognized as one of the best utility
 franchises in the U.S.

                                Florida Power & Light Company
 • One of the largest electric
   utilities in the U.S.
 • Vertically integrated, retail
   rate-regulated
 • 5+ MM customer accounts
 • ~28 GW in operation
 • ~$12 B in operating
   revenues
 • ~$58 B in total assets

12 Note: All data is as of March 31, 2020, except operating revenues which are for full-year 2019
FPL continues to identify smart capital investments to further
enhance its already best-in-class customer value proposition
                     FPL Development Highlights
 •    Recently filed Ten Year Site Plan reflects FPL and Gulf Power
      beginning to operate as an integrated electric system in 2022
       – Expect to take steps to merge two companies over the coming months
         and file combined rate case in 2021 for new rates effective in 2022
 •    Ten Year Site Plan projects ~70% increase in the amount of
      zero-emission electricity generation in 2029
       – More than 10,000 MW of installed solar capacity
             Includes ~1,500 MW built under recently approved SolarTogether
             program, the country’s largest community solar program
       – ~1,200 MW of battery storage
       – Elimination of essentially all of the coal on FPL’s combined system
 •    All of FPL’s major capital projects remain on track and on
      budget
     FPL and Gulf Power’s fleet modernizations support CO2 emissions rate
      reduction target of 67% below the 2005 U.S. industry average by 2030

13
FPL has significant investment opportunities across its
 system that are expected to generate customer savings and
 further enhance reliability
                       FPL 2019 – 2022 Capital Expenditures
                                                                                       Projected                      Recovery
 Opportunity                                            Status
                                                                                     Investment(1)                   Mechanism
 Dania Beach Clean Energy                 Final regulatory approval granted
                                                                                        ~$900 MM(2)           Base rates
 Center                                   in Q4 2018; expected COD in 2022

 2020 SoBRA                               Completed 2Q 2020                              ~$390 MM             Solar Base Rate Adjustment

                                          Twenty sites projected to be                                        Base rates w/ participant
 SolarTogether                                                                            ~$1.8 B
                                          completed in 2020 and 2021                                          contributions as offset(3)
                                          Site control; early stage
 Additional solar investments                                                          ~$1.0 - $1.5 B         Base rates
                                          development

 Battery storage                          Various battery storage projects               ~$420 MM             Base rates

 500 kV transmission project(4)           Ongoing                                      ~$1.0 - $1.5 B         Base rates

 Transmission & distribution                                                                                  Storm protection plan cost
                                          Investments from 2019 – 2022                 ~$3.0 - $4.0 B
 storm hardening                                                                                              recovery clause / base rates(5)
 All other transmission &
                                          Investments from 2019 – 2022                 ~$7.0 - $8.0 B         Base rates
 distribution
 Maintenance of existing assets,
                                          Ongoing                                      ~$5.5 - $6.5 B         Base rates
 nuclear fuel, and other

                      Total projected capital deployment of $23 B to $25 B
                                    from 2019 through 2022
   1)   Includes amount invested in 2019 through 2022, unless otherwise noted
   2)   Reflects total investment for Dania Beach Clean Energy Center including investment made pre-2019
   3)   Proposed tariff subject to approval by the Florida Public Service Commission
14 4)
   5)
        Replacement of 500 kV foundations and structures across the service territory
        Regulations regarding storm protection plan cost recovery clause, including recoverable investments
Growth in regulatory capital employed is expected to drive
 FPL’s net income growth through 2022
         FPL Regulatory                                         2019-2022
        Capital Employed(1)                                Capital Expenditures
$B
$50                                       $47.0 - $49.0

$40
            $33.7
                                                                              $23 B -
$30                                                                           $25 B

$20

$10
                                                          T&D Storm Hardening             All Other T&D
 $0                                                       Solar                           Other Generation
                                                          Other, Including Nuclear Fuel
            2018                               2022E

    FPL expects regulatory capital employed to grow at a CAGR of roughly
                         9% from 2018 through 2022

15 1) Excludes accumulated deferred income taxes
At FPL, we will continue to focus on the long-term strategy
 that has delivered our best-in-class customer value
 proposition
                                   FPL Customer Value Focus
               Operational                                                                 Service
           Cost Effectiveness(1)                                                          Reliability(2)
                      $/Retail MWh                                                              minutes

                                     ~$11.10 –                                      ~55
                           ~5%                                                                                ~50
             $11.78                   $11.75(4)                                                ~10%
Good                     Reduction                                       Good                Improvement
                          in real$

              2018                      2021E                                       2018                   2021E
                  1000-kWh
               Residential Bill(3)                                                 CO2 Emissions Rate
                                                                                               CO2 Lbs./MWh
                                        ~$95 –                                     ~670
              ~$99                      $100(4)
The acquisition of Gulf Power expanded NextEra Energy’s
     Florida footprint and regulated operations

                                                                 Gulf Power
•    Acquisition closed 1/1/2019
•    Located in Northwest Florida
•    ~470,000 customers
•    ~2,300 MW of generation in
     operation
         – ~1,600 MW coal
         – ~700 MW natural gas
•    $1.5 B in operating revenues
•    $6.2 B total assets

    17   Note: All data is as of March 31, 2020, except operating revenues which are for full-year 2019
Significant opportunities exist to improve the Gulf Power
       customer value proposition
       2018 Operational Cost Effectiveness(1)                                              1,000-kWh Residential Bill(2)
  $100                                                                                                                                 ~$143
                                                    Adjusted Regressed
                                                    Top Quartile                                           ~$129
               Gulf Power 2018                                                                                              ~$119
                = $29.31/MWh                        Top Decile
                                                                                              ~$101

                                                                                Good
$/Retail
 MWh                                                        FPL 2018 =
                                                            $11.78/MWh
                                                            FPL 2019 =
                                                            $11.16/MWh
    $10       Log/Log
     1,000,000        10,000,000           100,000,000        1,000,000,000                    FPL       Gulf Power         FL IOUs    National
                                                                                               2019         2019            Average    Average
                                  Retail MWh

           2019 Generation Mix Comparison(3)                                               2019 CO2 Emissions Rate(4)
                                       MWh                                                                      Lbs/MWh
                                                                                                 1,718
                                                    22%
                       46%

                                                                                                                                      901
                       27%                          74%                                                            665

                       27%

                  Gulf Power                       FPL                                       Gulf Power            FPL              Industry
            Natural Gas Nuclear         Coal     Solar Purchased Power                                                              Average
        1) FERC Form 1 non-fuel O&M; industry 2018, Gulf Power/FPL 2018; per calculations based on preliminary FERC
           Form 1 data for 2019 FPL; excludes pensions and other employee benefits; includes holding companies with
           >100,000 customers and utility owned generation
        2) Based on a typical 1,000 kWh monthly residential bill for February 2019; FL IOUs Average consists of data from
           FPL, TECO, Duke Energy Florida, FPUC and Gulf Power; as of February 2019; National Average Source: EEI; as
           of July 2018 based on reporting utilities
     18 3) As of December 31, 2019
        4) Industry average from the Department of Energy’s Energy Information Administration
Despite growing regulatory capital employed at roughly half
 the rate of FPL over the past 10 years, Gulf Power’s bill has
 increased significantly while FPL’s has declined
                         2008 vs. 2018 Historical Comparison
Regulatory Capital Employed(1)                                                  1,000-kWh Residential Bill(2)
                                                   $33.7 B                                 ~$137

                                                                              ~$106                                   ~$106
                                                                                                                                  ~$99

         ~5%                                  ~10%
         CAGR                                   CAGR
                                                                                    ~30%                                      ~6%
                                                                                   Increase                              Reduction
                                       $13.2 B

                $3.0 B
     $1.8 B

      Gulf       Gulf                    FPL         FPL                       Gulf         Gulf                       FPL        FPL
     Power      Power                    2008        2018                     Power        Power                       2008       2018
      2008       2018                                                          2008         2018
                                                                              Base Rate O&M                       Other Base Rate
                                                                              Fuel                                Environmental Cost Recovery
                                                                              Other

      1) 13-month average; includes retail rate base, wholesale rate base, clause-related investments and AFUDC
         projects; excludes accumulated deferred income taxes
19    2) Based on a typical 1,000 kWh monthly residential bill and internal calculations
We have identified several opportunities to improve the
 customer value proposition through smart capital
 investments
                   Gulf Power 2019 – 2022 Capital Initiatives
 Opportunity                                           Status                        Projected                          Recovery
                                                                                   Investment(1)                       Mechanism
 North Florida Resiliency                Development in process; target                ~$400 MM                         Base rates
 Connection                                     in-service 2021
 Plant Crist conversion to               Development in process; target            ~$150 - $175 MM                      Base rates
 natural gas and gas lateral                    in-service 2020
 New Plant Crist combustion                   Projected for 2021 COD               ~$400 - $500 MM                      Base rates
 turbines
 Plant Smith combustion                           2019 completion                      ~$50 MM                          Base rates
 turbine upgrades
 2020 solar investments                   Three sites projected for 2020               ~$300 MM                         Base rates
                                                       COD
 2019 customer systems                      Implementation in process                  ~$70 MM                          Base rates
 Transmission & distribution                                                                                  Storm protection plan cost
 storm hardening                          Investments from 2019 – 2022             ~$100 - $200 MM
                                                                                                            recovery clause / base rates(2)
  All other transmission &                                                         ~$650 - $800 MM                      Base rates
                                           Investments from 2019 – 2022
  distribution
 Environmental clause                                 Ongoing                          ~$200 MM             Environmental cost recovery
 investments                                                                                                         clause
 Maintenance of existing assets                       Ongoing                      ~$400 - $600 MM                      Base rates
 and other

                      Total projected capital deployment of $2.9 B to $3.3 B
                                     from 2019 through 2022

     1) Projected investment includes AFUDC
     2) Regulations regarding storm protection plan cost recovery clause, including recoverable investments, not yet
20      finalized
In the first year of ownership, NextEra Energy successfully
 executed on its strategy at Gulf Power

              Gulf Power 2019 Execution Summary
           Operational                   Regulatory
       Cost Effectiveness(1)         Capital Employed(2)
                          $/Retail MWh

              ~$32
                                                                                                                 ~$3.3 B
                             ~20%                                                                       ~11%
                           Reduction                                                    ~$3.0 B       Increase
Good
                                            ~$25

               2018                          2019                                         2018                         2019
                      2021 Target(3):                                                                2021 Target(3):
                     ~50% Reduction                                                                   ~16% CAGR

    1) GAAP O&M per retail MWh
    2) 13-month average; includes retail rate base, wholesale rate base, clause-related investments and AFUDC
       projects; excludes accumulated deferred income taxes
 21 3) Off a 2018 base; O&M target applies to base O&M reduction
Execution of our plans at Gulf Power generated significant
 value creation for our customers and our shareholders in 2019
                         Gulf Power 2019 Execution Summary
             Service                                       OSHA                                              Adjusted
            Reliability(1)                            Recordable Rate(2)                                     Earnings
                  (Minutes)                                                                                       ($ MM)

         ~101                                            ~1.84                                                               $200

                              ~81                                                                          $160

                                                                             ~1.15

Good               ~20%                        Good                 ~40%                                           25%
                 Improvement                                      Reduction                                       Increase

                                                                                               Good

          2018                2019                        2018                 2019                        2018              2019
             2021 Target:                                    2021 Target(3):                                  2021 Target(3):
        Further Improvements                                ~50% Reduction                                     ~16% CAGR

       1) System Average Interruption Duration Index
       2) OHSA Recordable Rate equals number of Occupational Safety and Health Administration Recordable
          injuries/illnesses * 200,000/Total Hours Worked
 22    3) Off a 2018 base
Successfully executing our strategy at Gulf Power will
 produce meaningful customer benefits over time

                           Typical 1000-kWh Residential Bill(1)

                      ~$137
                                             ~9%
                                          Reduction              ~$134
                                              in real
                                              2018 $
                                                                                      ~20%
                                                                                   Reduction               Mid-
                                                                                       in real            ~$120s
                                                                                       2018 $

                        2018                                     2021E                                 Mid-2020s
                                                                                                        2020s
                                                                                                        Target

 Customer bills are expected to decline through reduced O&M costs, more
  efficient, clean generation, and the eventual roll-off of high cost PPAs

     1) Based on a typical 1,000 kWh monthly residential bill; 2018 excludes benefit of accelerated flow back of
23      unprotected deferred income taxes of ~$9 per month; 2021 excludes $8 per month surcharge related to
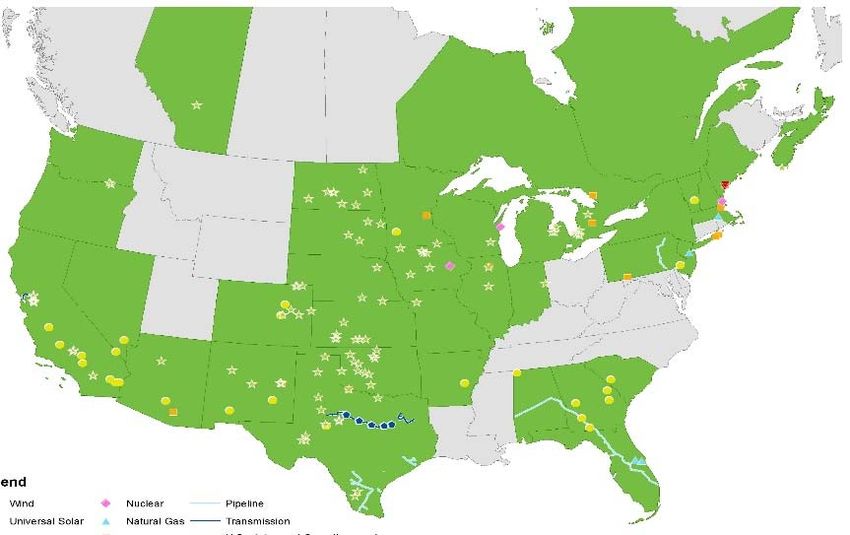
        Hurricane Michael
Energy Resources is the leading North American clean
 energy company

                                                Energy Resources
•     World leader in electricity
      generated from the wind and sun
•     ~24 GW(1) of generation in                                                                                             Wind
      operation                                                                                                              Natural Gas

                                                                                                                             Nuclear
        – ~16 GW wind                                                                                                        Universal
                                                                                                                             Solar
        – ~3 GW solar                                                                                                        Storage

                                                                                                                             Other
        – ~3 GW nuclear                                                                                                      Pipeline

        – ~2 GW natural gas/oil                                                                                              Transmission

                                                                                                                             Substation

•     ~13 GW of renewables in                         backlog(2)                         Generation Capacity(1)
•     ~6 Bcf of natural gas pipeline
      capacity operating or under                                                                       Wind
                                                                                                        67%
      development(3)
                                                                                                                     Solar
•     ~$1.7 B(4) in adjusted earnings                                                                                 12%
•     ~$51 B in total assets                                                                            Natural Nuclear
                                                                                                         Gas     11%
     1) MW capacity owned and/or operated by Energy Resources                                             7%
     2) Includes signed contracts as of March 22, 2020
     3) Includes ~4.3 Bcf Texas Pipelines operated by Energy Resources for NextEra Energy Partners;            Oil
         reflects net Bcf for pipelines where Energy Resources and NextEra Energy Partners’ ownership
         stake is less than 100%                                                                               3%
     4) Full-year 2019
24   Note: All other data as of March 31, 2020
We believe Energy Resources’ renewables development
 opportunities have never been stronger
                             Low Cost              Battery
                                                    Battery
                            Renewables             Storage
                                                    Storage

                                                                 Nuclear/Coal-
                                                                  Nuclear/Coal-
             Technology                                         to-Renewables
                                                                 to-Renewables
            Improvements          Buy           Build              Switching
                                                                    Switching
                                Cheaper        Cheaper

                                       ~80 GW
      Federal Tax      Development       U.S.            Operate         Increased
                                                                          Increased
      Incentives          Skills      Renewable          Cheaper          State RPS
                                                                         State RPS
                                       Demand
                                       through
                                      2019 - 2022
                           Innovate                   Finance
         Low
          Low U.S.
               U.S.                                                     Solar &
                             Better                   Cheaper
        Renewables
         Renewables                                                 FERC   Orders
                                                                     Storage Under
         Penetration                    Identify                      845 & 841
                                                                     Existing Wind
        Penetration
                                       Customer
                                       Solutions
                           Wind
                           Wind                      C&IC&I
                                                         Demand
                        Repowering
                        Repowering                     for ESG
                                                      Demand
                                                      Platforms

     Energy Resources’ execution track record, people and
      culture are key drivers to our development success
25
Technology improvements and capital cost declines have
       significantly improved wind and solar economics

                                            Wind & Solar Technology
                    Levelized Cost of                                                               Levelized Cost of
                  Electricity from Wind                                                           Electricity from Solar
               (Including Production Tax Credits)                                               (Including Investment Tax Credits)
$/MWh                                                                         $/MWh
  $70                                                                          $160
                                                                                       $140-$150
        $55-$65                                                                $140
 $60

                                                                               $120
 $50
                                                                               $100              $95-$105
 $40              $36-$42
                                                                                $80                         $73-$83
 $30
                            $21-$27                                             $60
 $20                                  $16-$22                                                                         $39-$47
                                                $15-$20             $11-$18     $40                                             $34-$41
                                                          $10-$15                                                                         $25-$35 $24-$30
 $10                                                                            $20

  $0                                                                             $0
                                                                                                                                                (4)       (4)
        2010 (1) 2012 (1) 2014 (1) 2016 (1) 2018(2) 2020E(4) 2022E(4)                   2010 (3) 2012 (3) 2014 (3) 2016 (2) 2018(2) 2020E             2022E

      1) Source: U.S. Department of Energy, Wind Technologies Market Report
      2) Source: Bloomberg New Energy Finance
      3) Source: IHS Markit. The use of this content was authorized in advance. Any further use or redistribution of this
         content is strictly prohibited without written permission by IHS Markit. All rights reserved
   26 4) Energy Resources’ estimate
Wind is expected to be the cheapest source of electric
     generation even after production tax credits phase down

                          Expected Drivers of Future Wind
                    Levelized Cost of Energy (LCOE) Reductions
•        Increased generation as a result of                                             Unsubsidized Wind LCOE Roadmap(1)
         larger turbines                                                                                              $/MWh

          – Viability of larger post-2024 rotor                                  $30 - $35
            diameters confirmed by OEMs
          – Influence technology design and be
            early adopters
•        Capital cost savings                                                                      ~$20                                            $20 - $25
          – Larger turbine size results in fewer
            turbines and lower balance of system
            (BoS) costs
          – Benefits from manufacturing scale
          – Additional BoS cost saving initiatives                                              ~$10 - $15
•        Continued O&M cost reductions
          – Advanced analytics expected to drive
            meaningful cost reductions                                              2020
                                                                                    LCOE
                                                                                              Increased
                                                                                              Generation
                                                                                                            Capex
                                                                                                           Savings
                                                                                                                       Other
                                                                                                                       Capex
                                                                                                                                O&M
                                                                                                                                 Cost
                                                                                                                                          Financing Post-2024
                                                                                                                                         Efficiencies LCOE
•        Financing efficiencies                                                                  Per
                                                                                               Turbine
                                                                                                             from
                                                                                                            Larger
                                                                                                                      Savings Reductions

          – No need for more expensive tax                                                                 Turbines

            equity when tax credits phase down                                                                 PPA Value        PTC Value(2)

           1) Energy Resources’ estimate
    27     2) Pre-tax value of production tax credit levelized over the life of the project
Solar is expected to be the cheapest source of electric
     generation other than wind after investment tax credit steps
     down
                          Expected Drivers of Future Solar
                    Levelized Cost of Energy (LCOE) Reductions
•   Continued module cost declines                                                                  Solar LCOE Roadmap(1)
                                                                                                                   $/MWh
•   Continued balance of system (BoS)
    savings from improved technology                                             $42 - $52
    and engineering innovation
         – ~30% decline expected by 2022
•   Drivers                                                                                      ~$17
         – Innovative racking systems and                                                                                                        $30 - $35
           installation methods                                                                                                        ~$4
         – Design optimization
                                                                                              ~$25 - $35
         – Increased module power rating
           reduces BoS costs for associated site                                                                                    ~$25 - $30
           prep, racking and cabling
•   Continued O&M cost reductions
         – Goal of operating almost all solar fleet                                 2020      Module       Capex     Other    O&M       Financing Post-2023
           remotely                                                                 LCOE       Cost
                                                                                              Decline
                                                                                                          Savings
                                                                                                            from
                                                                                                                     Capex     Cost
                                                                                                                    Savings Reductions
                                                                                                                                       Efficiencies LCOE

•   Financing efficiencies                                                                              Higher Watt
                                                                                                         Modules

         – No need for more expensive tax equity                                                              PPA Value      ITC Value(2)
           when ITC phases down
           1) Energy Resources’ estimate
    28     2) Pre-tax value of investment tax credit levelized over the life of the project
Increased manufacturing capacity has resulted in energy
    storage cost declines and the ability to create low-cost
    near-firm wind and solar
                                              Energy Storage Costs
               Battery Pack                                                                           4-Hour
         Cost Relative to Capacity(1)                                                        Battery Storage Adder(2)
 $/kWh                                                            GWh      $/MWh
$1,400                                                             350      $80 $71-$81

                                                                             $70
$1,200                                                             300
                                                                             $60
$1,000                                                             250
                                                                                             $45-$55
                                                                             $50
 $800                                                              200                                  $38-$48
                                                                             $40
 $600                                                              150
                                                                             $30
                                                                                                                $19-$29
 $400                                                              100
                                                                             $20
                                                                                                                           $9-$16   $8-$14
 $200                                                              50        $10                                                             $4-$9

   $0                                                              0           $0
          2010 2011 2012 2013 2014 2015 2016 2017 2018 2019                           2010     2012      2014       2016   2018     2020E 2022E
             Battery Pack Cost           Installed Capacity

         1) Source: Bloomberg New Energy Finance
         2) Energy Resources’ estimate; assumes: 4-hour battery storage at 25% of nameplate solar capacity; total
   29       battery system costs calculated as two times Bloomberg New Energy Finance battery pack cost
Continued declines in battery costs are expected to result
     in the ability to generate near-firm wind and solar at low
     costs even after tax credits phase down
                                    Expected Drivers of Future
                                  Energy Storage Cost Reductions
                                                                                             Storage Adder Roadmap(1)
                                                                                                                $/MWh
•   Continued battery pack cost
    declines and efficiency
    improvements                                                            $11 - $17

         – Automotive investment will continue to
           drive innovation and reduce costs
                                                                                            ~$3
•   Continued balance of system (BoS)
                                                                                                                                               $5 - $9
    savings from improved technology
    and engineering innovation
                                                                                                                                    ~$1
                                                                                           ~$8 - $14
         – Innovations on enclosures, DC-DC
           converters, and integration with solar
           equipment                                                                                                           ~$4 - $8

•   Improved financing efficiencies
                                                                               2020      Battery  BoS Cost      Improved   O&M       Financing Post-2023
                                                                              Storage   Pack Cost Decline        Energy     Cost    Efficiencies Storage
                                                                               Adder     Decline                 Density Reductions               Adder

                                                                                                         PPA Value         ITC Value(2)

           1) Energy Resources’ estimate; assumes 25% of facility’s generating capacity for a 4-hour duration
    30     2) Pre-tax value of investment tax credit levelized over the life of the project
Energy Resources increasingly sees battery storage as an
   important stand-alone business

                                      Battery Storage Opportunity
          Battery Storage Portfolio                                       •   Pairing storage at existing solar
                               MW
                                                                              sites to take advantage of ITC
                                                   ~460 ~1,900
                                                                              and enhance customer value
                                         ~340
                                                                              – ~7 GW solar portfolio (including
                                                                                backlog) provides significant
                               ~340                                             opportunity

                     ~200
                                                                          •   Recent backlog additions
           ~50
                                                                              highlight rapid transition to
 ~500                                                                         next phase of renewables
                                                                              development
                                                                          •   Energy Resources has unique
 Q4 2018 Q1 2019
Operating
                     Q2 2019   Q3 2019   Q4 2019   Q1 2020    Current
                                                              Portfolio       skills to combine wind, solar
& Backlog                                                    including
                                                              Backlog
                                                                              and storage into integrated
         Operating          Backlog         Backlog Additions                 near-firm low cost products
     NextEra Energy’s battery storage investments in 2021 are now expected
                              to exceed $1 billion(1)

  31 1) Includes capex at FPL related to Manatee Energy Storage Center
Low cost, near-firm renewables are expected to create
 significant long-term demand

                               Wind & Solar Market Potential(1)
                   Average Annual                                                             Average Annual
                   Wind Additions                                    Market                   Solar Additions
                                                                    Growing
                                                                    ~15%
                                                                  annually on                                      ~18 – 20
                                                                    average                                        GW/Year

                                             ~12 – 15
                                             GW/Year
                                                                                     ~10 GW/Year
          ~10 GW/Year

            2019 - 2022                     2023 - 2030                                2019 - 2022                2023 - 2030

     We believe we are in the best renewables development environment in
          our history and expect to maintain our leadership position

   1) 2019 – 2022 source: average of National Renewable Energy Laboratory (NREL), MAKE, Bloomberg New
      Energy Finance, IHS Markit and U.S. Energy Information Administration capacity addition estimates; 2023 –
32    2030 source: NREL capacity addition estimates
Energy Resources’ competitive advantages position us to
continue to capitalize on what we believe is the best
renewables development environment in our history
                Energy Resources Development Program(1)
                                       (Signed Contracts as of April 22, 2020)

                               2019 – 2020         2019 – 2020           2021 – 2022 2021 – 2022             2019 – 2022
                                 Signed              Current               Signed      Current                 Current
                                Contracts          Expectations           Contracts Expectations             Expectations
Wind(2)                             3,826          3,000 – 4,000+             1,082          2,000 – 3,800    5,000 – 7,800
Solar(2)                            1,528           1,000 – 2,500             2,921          2,800 – 4,800    3,800 – 7,300
Energy Storage(2)                     30               50 – 150               1,040           650 – 1,250     700 – 1,400
Wind Repowering                     2,618               >2,000                  0                      0         >2,000
Total                               8,002           6,050 – 8,650             5,043          5,450 – 9,850   11,500 – 18,500
Build-Own-Transfer                   674                                       110

     With over two and half years remaining in the period, we are now well
           within the 2019 to 2022 renewables development ranges

   1) MW capacity expected to be owned and/or operated by Energy Resources
33 2) Excludes 430 MW of wind 2,011 MW of solar, and 786 MW of storage signed for post-2022 delivery
We remain well positioned to continue our strong adjusted EPS
growth
                              NextEra Energy’s
                  Adjusted Earnings Per Share Expectations

                                                                            •     Expect 6% - 8% growth
                                                         $10.00 -                 through 2021 off our 2018 base
                                           $9.40 -
                                                         $10.75                   of $7.70, plus the expected
                             $8.70 -       $9.95                                  accretion from the Florida
                             $9.20                                                acquisitions of $0.15 and $0.20
 $7.70
               $8.37
                                                                                  in 2020 and 2021, respectively
                                                                            •     For 2022, expect 6% - 8%
                                                                                  growth off 2021 adjusted EPS
                                                                            •     Expect 12% dividend per share
                                                                                  growth in 2020, ~10% annual
                                                                                  growth thereafter through at
                                                                                  least 2022(2)
 2018          2019         2020E         2021E          2022E
           Expected accretion from FL acquisitions(1)

 Will be disappointed if we are not able to deliver financial results at or near
 the top end of our adjusted EPS expectations ranges for 2020, 2021 & 2022

      1) Includes Gulf Power, Florida City Gas, and the Stanton and Oleander natural gas power plants
      2) Off a 2020 base, which is expected to be $5.60 per share; dividend declarations are subject to the discretion of
 34      the Board of Directors of NextEra Energy
NextEra Energy presents a compelling investment opportunity

                           NextEra Energy Value Proposition
     Drill-down of S&P 500 Companies                                                        Annual Total Return Potential
                          355                            Investment grade(1)                       10% - 12%

                                                                                                                       6%
                          211                  Market capitalization > $20 B

                          116            Adj. EPS CAGR > 8% past 5 years
                                                                                                      NEE
                                                                                                            (4)                (2)
                                                                                                                  Median S&P 500

                           36       ‘19 – ‘22E Annual Total Return(2) > 10%
                                                                                                         DPS Growth(3)
                                                                                                      11%

                            7                ‘19 – ‘22E DPS CAGR(3) > 10%
                                                                                                                       5%

                            1                       Beta past 5 years < .70

                                                                                                      NEE         Median S&P 500

     1) S&P credit rating as of 12/31/2019
     2) Consensus 2019 – 2022 adjusted EPS compound annual growth rate plus 5/29/2020 dividend yield
     3) Based on consensus estimate 2019 – 2022 compound annual growth rate
     4) NextEra’s 2019 – 2022 adjusted EPS compound annual growth rate guidance plus 5/29/2020 dividend yield
35   Source: FactSet as of 5/29/2020
36
NextEra Energy Partners is a best-in-class diversified clean
    energy company

                             NextEra Energy Partners’ Portfolio(1)
•    Stable cash flows supported by:
         – Long-term contracts with credit-
           worthy counterparties
         – Geographic and asset diversity
•    ~5,330 MW of renewables
         – ~4,575 MW wind
         – ~750 MW solar
•    ~4.3(2) Bcf total natural gas
     pipeline capacity
         – Eight natural gas pipelines
         – ~727 miles                                                                                          Wind assets
                                                                                                               Solar assets
         – ~3.5(2) Bcf of contracted capacity                                                                  Pipeline assets

                      Solid distribution growth through accretive acquisitions

          1) Current portfolio as of March 31, 2020
          2) Reflects net Bcf for pipelines where NextEra Energy Partners’ ownership stake is less than 100%
    37
NextEra Energy Partners remains well-positioned to execute
on its long-term strategic objectives

              NextEra Energy Partners COVID-19 Response
•       As a result of the actions taken in 2019, NEP entered 2020
        particularly well-positioned
•       NEP maintains significant liquidity to achieve its objectives
          – Net liquidity position, including cash on hand, of ~$650 MM(1)
          – $300 MM convertible debt maturity in September 2020(1), no other
            corporate level debt maturities until 2024
•       Expect NEP’s financing flexibility will provide continued access
        to capital regardless of market conditions
          – Private infrastructure capital demand for high quality, long-term
            contracted clean energy assets provides attractive financing source
•       NEP remains uniquely positioned to take advantage of the
        disruptive factors reshaping the energy industry

NEP has flexibility to achieve its distribution growth objectives without the
 need for acquisitions until 2022, one year later than previously disclosed

     1) As of March 31, 2020
     2) Convertible debt may be converted to NEP units if the conversion price is achieved
38
NEP’s value proposition is built upon four core strengths

                        NextEra Energy Partners’ Core Strengths
              High-Quality Portfolio(1)                                            Financial Strength and Flexibility
                                                                                                               Issuer Credit
                              Diversified              ~5.3 GW                      Ability to                   Rating(4)          Payout Ratio
   15-Yr                     Portfolio with          Renewables Capacity        opportunistically          Ba1/BB/BB+              Mid-70%
  Remaining
 Contract Life(2)
                                 ~50                  ~4.3(3) Bcf                  access the
                                                                                 capital markets           supports 4x-5x             on 2020
                             counterparties            Pipeline Capacity                                   Holdco debt / project   Distributions(5)
                                                                                                                  CAFD

     Tax-Advantaged Structure(6)                                                          Opportunities For Growth
                             ≥8 years                 Treated as C-Corp                                        Clean energy
                                                                                                                 assets at
≥15 years                  Potential return of        for U.S federal tax         Organic                  Energy
 Not expected to
                            capital treatment           purposes with
                                                                                prospects for Texas                                3rd Party
 pay significant
                           for distributions to
                               the extent of
                                                     Form 1099                     Pipelines and          Resources,                acquisitions
U.S. federal taxes                                      for investors              Repowerings                including future
                              investor’s tax                                                                    development
                                   basis                   (vs K-1)

        1) Current portfolio as of March 31, 2020
        2) Weighted on calendar year 2021 Cash Available for Distribution (CAFD) expectations for current portfolio
        3) Reflects net Bcf for pipelines where NextEra Energy Partners’ ownership stake is less than 100%
        4) Moody’s, Standard & Poor’s, and Fitch ratings, respectively
        5) Reflects calendar year 2020 CAFD expectations for portfolio as of 12/31/19 (excluding Desert Sunlight CAFD)
           and 12-15% annual growth in LP distributions from Q4 2019 annualized distribution of $2.14, plus distributions
           made to the Series A Preferred Units
        6) As of December 31, 2019; should not be construed as tax advice
   39
NEP continues to focus on investing in long-term contracted
    clean energy assets with strong creditworthy counterparties
    and attractive cash flows
                                             Growth Strategy

                 Wind
                  Wind                       Solar
                                                                      Organic
                             Long-Term                                Growth
                              Contract
                                             Clean
                Strong
                                             Energy
               Operations                  Technology
                                                                    Acquisitions
                             Attractive                   Battery
 Competitive
Transmission                 Asset to                     Storage
                                                                    from Energy
                                NEP                                  Resources
                Limited or                 Creditworthy
               Monetized                    Customer
               Tax Credits
                                Stable
                              Regulatory                             3rd Party
                  Other
                             Environment
                                                                    Acquisitions
                                             Natural
                 Clean
                                              Gas
                 Energy
                                            Pipelines
                 Assets

          Renewables are expected to be the primary driver of NEP’s growth

    40
Acquisitions from Energy Resources provide clear visibility to
     continued growth at NEP

                              Energy Resources’ Renewable
                               Portfolio Since NEP’s IPO(1)
GW                                                                                                            ~25 GW -
                                                                                             ~7 GW             32 GW
30
                                                                            ~12 GW
25

20                              ~8 GW                 ~5 GW
15

10        ~10 GW

 5

 0
           NEER's            MW Placed in        MW Sold to NEP             Current         Additional     Current Portfolio
        Renewables             Service             since IPO             Renewables       Potential 2019- including Backlog
      Portfolio after IPO                                                   Backlog (2)    2022 Growth (3)     & Growth
                                                                       (ex. Repowering)

           Energy Resources’ portfolio alone provides one potential path to
                     12% - 15% growth per year through 2024

       1) Current portfolio as of March 31, 2020
       2) Includes renewables backlog of 13 GW less 1.2 GW of repowering backlog
       3) Assuming top end of remaining 2019 – 2022 renewables development expectations
 41
NEP is well positioned to benefit from the significant wind
     and solar growth that is expected over the coming years
                          NEP & Long-Term Renewables Demand
          U.S. Renewable Energy
          Capacity through 2030                                                  U.S. Renewables Penetration
                                                              ~500 GW

                                                                                                                      ~40%

                                                                                                          ~15%
                                                                                                           CAGR
                                                                                                          in MWh
                                                                                                         generation
                                               ~200 GW

                                ~100 GW                                                  9%
                 ~25 GW
                 – 32 GW
  ~5 GW
Current NEP        NEER          Other         Expected       Expected                  2019                          2030
 Portfolio (1)    Portfolio     Existing         2022           2030
                 including      Capacity (3)   Installed      Installed
                  Backlog                      Capacity (4)   Capacity (4)
                 & Growth (2)

                 NEP is well positioned to capture a meaningful share of future
                                      renewables growth
          1) Current portfolio as of March 31, 2020
          2) Includes renewables backlog of 13 GW less 1.3 GW of repowering backlog plus top end of remaining 2019
             – 2022 development expectations
          3) Source: IHS Markit
    42    4) Source: Additional installed capacity from National Renewable Energy Laboratory (NREL)
NEP’s balance sheet and financing flexibility are expected
    to create a sustainable base for future growth

                                                Financial Flexibility
•     Financing and construction for
      previously announced organic
      growth investments remain on                                       Convertible   PAYGO Tax        High-Yield
      track                                                                 Equity
                                                                           Portfolio
                                                                                         Equity            Debt

•     Genesis financing capacity and                                      Financing
                                                                                                                     Revolving
      expected release of Desert                                                                                      Credit
                                                                                                                      Facility
      Sunlight trapped cash provide                               Convertible
                                                                   Preferred
                                                                                          Financing
                                                                                          Flexibility
      potential sources of capital and
      liquidity(1)                                                                                                    Bank
                                                                                                                      Term

•     Over the past year, NEP’s                                        Convertible
                                                                         Debt
                                                                                                      Project
                                                                                                    Financing/
                                                                                                                      Loans

      revolving credit facility was                                                    Equity
                                                                                                   Refinancing
      upsized by $500 MM to $1.25 B
      and term was extended to 2025
        – Net liquidity position, including
          cash on hand, of ~$650 MM(2)

         Access to low-cost financing is a key competitive advantage for NEP

       1) Assuming favorable resolution for PG&E-related assets
    43 2) As of March 31, 2020
By leveraging private infrastructure capital, CEPFs are
  expected to provide a more efficient way for NEP to issue
  equity
            Comparison of Common Equity to CEPFs
                 Common Equity              CEPF
Efficient access
    to capital      New   issuance limited by
                     trading liquidity                Significant infra. fund capital
                                                       drives demand
  No Issuance
   Discount         historical equity issuances
                     ~7% discount realized in
                                                      Buyout equity issued at then-
                                                       current market price
                                                       Current LP unitholders retain
 Retained unit
 price upside       No  retained upside by
                     current LP unitholders           all upside as NEP executes
                                                       on growth objectives
                     NEP pays higher cash
Low initial cash
     cost           LP distribution rate, plus
                     growth and IDRs
                                                      Initial effective coupons of
                                                       between
Although the base case buyout assumes equity issuance,
CEPFs provide a significant amount of flexibility in managing
the buyout
          CEPF Financing Flexibility – Potential Options

 Base Case             Alternative 1      Alternative 2       Alternative 3

                           Time              Re-lever            Choose
       Issue                                                   whether to
        NEP               buyout            unlevered
                          around            assets to          buyout at
      equity at                                                   all or
       higher           temporary             fund
                           price            buyout in           redeploy
      prices in                                                  capital
     the future          volatility           cash
                                                               elsewhere

     Any or all of these components can occur as part of the transaction and
                           are at NEP’s sole discretion

45
NEP does not expect to need any acquisitions until 2022 to
  achieve its targeted distribution growth expectations
                            NextEra Energy Partners
                    Adjusted EBITDA and CAFD Expectations

                                            Adjusted                                  CAFD(3)                              CAFD
                                            EBITDA(2)                                 (Including                        (Excluding Desert
                                                                                    PG&E-Related)                        Sunlight CAFD)

12/31/20 Run Rate(1)                 $1,225 – $1,400 MM                        $560 – $640 MM                       $505 – $585 MM

                                                                        Unit Distributions
         2020(4)                                    $2.40 - $2.46 annualized rate by year-end
   2019 – 2024(5)                                          12% - 15% average annual growth

    Expect to achieve 2020 distribution growth while maintaining a TTM(6)
  payout ratio in mid-70% range, even after excluding Desert Sunlight CAFD
     1) Reflects calendar year 2021 expectations for forecasted portfolio as of 12/31/20 assuming normal weather and
        operating conditions
     2) Includes full contributions from projects related to PG&E as revenue is expected to continue to be recognized
     3) Assuming favorable resolution of PG&E bankruptcy and associated events of default for NEP’s PG&E-related
        assets
     4) Represents expected fourth quarter annualized distributions payable in February of the following year
     5) From a base of NEP’s fourth quarter 2019 distribution per common unit at an annualized rate of $2.14
  46 6) Trailing twelve month
NextEra Energy Partners presents a compelling investment
  opportunity

               NextEra Energy Partners Value Proposition
Drill-down of S&P 1000 Companies & NEP                                                    Total Return Potential
                                                                                                       ~4%          16% - 19%
                         635                    Debt / EBITDA(1) < 5.25x

                                                                                     12% - 15%
                          76                        Dividend yield > 3%

                           8          DPS growth > 100% past 4 years

                           3             ‘18 – ‘22E DPS CAGR(2) > 12%

                                                   Growth expectations
                           1                             through 2024                 Distribution   Distribution     Annual
                                                                                    Growth Through      Yield (3)   Total Return
                                                                                     At Least 2024

  Opportunity to earn an after-tax total return of 16% - 19% per year through
                                 at least 2024
      1) S&P’s preliminary 2019 metric based on NextEra Energy Partners’ calculation used for NEP
      2) Based on consensus estimates
      3) Based on NextEra Energy Partners distribution yield as of 4/22/2020
 47   Source: FactSet as of 4/22/2019
Appendix

48
49
NextEra Energy has implemented its Pandemic Plan and is
  continuing to safely deliver on its commitments

                         COVID-19 Pandemic Response
 Active Pandemic
  Planning and                Employees                 Customers                 Community
    Execution
• Leveraging extensive   • Established             • Continuing to provide    • NextEra Energy
  experience in            temperature screening     clean, affordable and      companies and
  emergency planning       locations at critical     reliable service           employees have
                           function work areas                                  committed more than
• Activated ~40 person                             • FPL and Gulf Power         $4.0 million in
  cross-functional       • Implemented testing       voluntarily suspended      emergency assistance
  pandemic team            sites in coordination     electrical                 funds to provide
                           with medical provider     disconnections during      critical support to
• Sub-team working         partners                  state of emergency         most vulnerable
  groups to address                                                             members of the
  specific challenges    • Control centers split   • Accelerated flow back      community
  throughout               between primary and       of lower fuel costs
  businesses               backup locations and      resulting in ~25% and    • Focused on
                           utilizing staggered       ~40% one-time bill         supporting Florida’s
• Daily rhythm with        shift start times         decrease for typical       rapid recovery from
  executive team                                     FPL and Gulf Power         the pandemic
                         • Use of social             residential customers,
• Top focus on the         distancing protocols      respectively             • Employee-led group
  safety of our            along with personal                                  producing face shields
  employees and the        protective equipment,                                for local health care
  community                where appropriate                                    workers
• Invaluable guidance    • Leveraging remote
  from company medical     working capabilities,
  leadership               where possible

   50
Weather-normalized usage at FPL has improved as
   stay-at-home orders have been lifted
                                    FPL - Weekly Usage
                            Variance vs. Prior Two Year Average

                                                                                                                      April       May(1)
                                                                               Weather Normalized Variance – FPL     (4.2%)       (0.4%)
                            20.3%
                                                                               Actual Variance - FPL                     5.4%     (2.4%)

                 14.5%
                                                                          13.1%
                                                              12.2%
                                         9.5%

                         2.9%
             1.8%
                                                                                                                         0.8% 0.7% 1.4%

(1.2%)                                               (1.4%)                                                                           (0.6%)
                                    (2.2%)                                               (1.7%)
    (2.5%)                                                (3.0%)                              (3.3%)        (3.2%)
                                                (5.0%)                (5.1%)
                                                                                  (6.3%)           (6.9%)       (6.8%)

   3/12        3/19        3/26        4/2         4/9      4/16        4/23          4/30        5/7         5/14         5/21      5/28
                                                    Week Ending
                                        Weather-Normalized Usage                           Actual Usage

        1) May preliminary data through 5/28
   51
Weather has continued to have a large impact on Gulf Power
retail sales during the 2nd quarter
                                    Gulf Power - Weekly Usage
                               Variance vs. Prior Two Year Average

                                                                                                                          April       May(1)
                                                                                 Weather Normalized Variance – Gulf      (7.9%)       (3.3%)

                                                                                 Actual Variance - Gulf                  (4.6%)       (5.0%)
                                 12.6%
                      9.6%
                                            6.5%
                                                         3.8%               3.2%
1.8%           2.3%

      (2.7%)                                                                                                    (3.2%)       (3.5%)
                                                            (7.2%)                                                                    (5.5%)
                             (6.8%)                                                                (7.3%)
                                                (8.7%)           (7.7%) (8.1%)            (9.0%)                                           (6.7%)
                                      (12.7%)                                         (9.7%)
                                                                                                                                (13.1%)
                                                                                                      (14.6%)
                                                                                                                   (17.6%)

 3/12            3/19          3/26       4/2       4/9         4/16      4/23           4/30         5/7         5/14         5/21       5/28
                                                     Week Ending
                                         Weather-Normalized Usage                       Actual Usage

      1) May preliminary data through 5/28
 52
NextEra Energy is well-positioned to withstand potential
   changes in load from the COVID-19 pandemic

                                                  Sales & Usage Sensitivities

                                             Commentary                                              Retail Sales Composition(1)   Impact of 1% Change in Sales(1)
                 • Reserve amortization provides flexibility to offset changes in usage                     kWh       Revenues      Revenues ($ MM)         EPS ($0.000)
                 • Q1 2020 remaining reserve amortization balance of ~$744M                           R:     54%         64%              $44
                                                                                                                                                        No expected impact
                 • ~40% of load is cooling related                                                    C:     43%         35%              $25            due to utilization of
   FPL
                 • Less than 3% of revenues from industrial customers                                  I:    3%          1%
NextEra Energy maintains its strong liquidity position

                            NextEra Energy’s Liquidity Position
           Liquidity as of 3/31/2020                                    •     Largest core credit facility, with
                                ($ B)                                         most credit providers in the
$11.7       ($1.5)                                $3.3   $11.9                industry(2)
                                                                                – Core FPL, Gulf and NEECH credit
                          $10.2       ($1.6)                                      facilities mature February 2025(3)
                                                                                – FPL and NEECH Global credit facilities
                                                                                  (totaling $1.5 B) mature in 2022
                                                                        •     Cash position bolstered by recent
                                                                              $6.6 B in bank and capital market
                                                                              issuances
                                                                                –   $2.5 B equity units(4)
                                                                                –   $1.25 B NEECH debentures(5)
                                                                                –   $1.1 B FPL first mortgage bonds
                                                                                –   $1.8 B NEECH bank term loans(5)
                                                                        •     NextEra remains committed to
 Total
 RCF (1)
           Borrowings +
               LCs
                          Net RCF
                          Capacity
                                     Commerical
                                       Paper
                                                  Cash     Total
                                                         Liquidity
                                                                              maintaining strong credit ratings
            Oustanding                                                        and metrics
    1) Revolving credit facility
    2) 73 total banks participate in the FPL, Gulf and NEECH credit facilities
    3) ~$6.4 B matures in 2025, balance of ~$320 MM matures prior to 2025; please refer to NextEra Energy’s SEC
       filings for full financing terms
    4) Equity will convert in 2023
 54 5) $1.25 B NEECH debentures & $475 MM of NEECH bank term loans issued after 3/31/2020
NextEra Energy’s credit metrics remain on track

                                               Credit Metrics
                                       A-        Downgrade   Actual    Target
  S&P                                 Range      Threshold   2019(1)    2020
  FFO/Debt                        13%-23%          21%       22.8%     >21%

  Debt/EBITDA                     3.5x-4.5x                     3.6x   18%
  CFO-Div/Debt                        9%-17%                 14.0%     >12%

                                     A           Downgrade   Actual    Target
  Fitch                           Midpoint       Threshold   2019(1)    2020
  Debt/FFO                             3.5x        4.25x        4.0x   5.0x

55 1) Based on NextEra calculations
NextEra Energy is a leader amongst its peers in many key
 financial metrics, including S&P’s FFO-to-Debt Ratio

                                        2019 FFO-to-Debt(1)
25%

20%

15%

      23%
10%           21%
                       19%
                                 17%    16%     16%     15%     15%     15%    14%   14%    14%
                                                                                                   13%
5%                                                                                                        11%

0%
      NEE      A      B           C      D       E       F       G       H      I     J      K       L     M
      (A-)   (BBB+) (BBB+)       (A-)   (A-)   (BBB+)   (A-)   (BBB+)   (A-)   (A)   (A-)   (A-)   (BBB) (BBB+)

      1) Source: S&P Global Ratings
 56
FPL and Gulf Power are rated higher than all but four of the
       148 S&P-rated U.S. Electric Utility OpCos; no publicly-
       traded HoldCo is rated higher than NextEra Energy
        U.S. Electric Utility OpCo and HoldCo Credit Ratings(1)
              80

              70

              60

              50
 Number
of Entities                                                         FPL
              40                                                     &
                                                                    Gulf
              30                                                   Power
                                                                          NEE
              20

              10

               0
                    AAA      AA+       AA       AA-       A+        A        A-     BBB+      BBB      BBB-      BB+   BB     BB-        B+
                        U.S. Publicly-Traded Electric Utility Holding Companies              U.S. Electric Utility Operating Companies

              1) Source: S&P Global Ratings; Foreign Currency Long-Term Issuer Credit Ratings as of April 17, 2020
      57
NextEra Energy’s credit rating ranks within the top third of
   all S&P 500 Companies

                        S&P 500 Constituents’ Credit Ratings(1)
           100

            90

            80

            70

Number      60
  of
Entities    50

            40

            30

            20

            10

             0
                  AAA AA+          AA     AA-      A+      A       A-    BBB+ BBB BBB- BB+                BB      BB-   B+   B    Not
                                                                                                                                 Rated

           1) Source: S&P Global Ratings; Foreign Currency Long-Term Issuer Credit Ratings as of April 17, 2020
   58
Contracted Wind and Solar Development Program(1)
Wind                         Location       MW        Solar                           Location     MW      Solar                          Location     MW
2019:                                                 2019:                                                Post – 2022:
Emmons-Logan                     ND           216     Quitman                             GA        150    Proxima                            CA          50
Crowned Ridge I                   SD          200     Shaw Creek                          SC         75    Skeleton Creek                     OK         250
Blue Summit III                   TX          201     Dougherty                           GA        120    Chariot                            NH          50
Sholes                            NE          160     Grazing Yak                         CO         35    Florida                             FL        373
Bronco Plains                    CO           200     Distributed Generation            Various     131    Alabama Power                       AL        240
Pegasus                           MI           49                              Total 2019 Solar:    511    Sonoran                             AZ        250
                      Total 2019 Wind:      1,026                                                          Storey                              AZ         88
                                                      2020:                                                CT DEEP                             CT         80
2020:                                                 New England                       Various       69   Pandora                             TX        250
Burke                             ND          200     Blythe III                          CA         125   North Side                         NY         180
Roundhouse                        WY          225     Blythe IV                           CA         125   Garnet                             NY         200
Soldier Creek                      KS         300     Chicot                              AR         100                    Total Post – 2022 Solar:   2,011
White Hills                        AZ         350     Florida                              FL        149
Pegasus                            MI         102     Saint                                AZ        100
Cerro Gordo                        IA          40     Two Creeks (BOT)                     WI        150
Skeleton Creek                    OK          250     Bluebell II                          TX        100
Jordan Creek                       IN         400     Distributed Generation            Various       99
Bronco Plains                     CO          100                              Total 2020 Solar:   1,017
Cedar Springs                     WY          200
Wheatridge                        OR          200     2021 – 2022:
Wheatridge (BOT)                  OR          100     Point Beach                        WI          100
Cedar Springs                     WY          133     Route 66                          NM            50
Contracted, not yet announced                 200     Dodge Flat                        NV           200
                       Total 2020 Wind:     2,800     Fish Springs Ranch                NV           100
                                                      Arlington                         CA           131
2021 – 2022:                                          High River                        NY            90
Buffalo Ridge                     MN          109     East Point                        NY            50
Borderlands                       NM          100     Bellefonte                         AL          150
Walleye                           MN          111     Elora                             TN           150
Niyol                             CO          200     Wheatridge                        OR            50
Eight Point                        NY         102     New England                     Various        174
Contracted, not yet announced                 460     Excelsior                         NY           280
                Total 2021 – 2022 Wind:     1,082     Trelina                           NY            80
                                                      Watkins Glen                      NY            50
Post – 2022                                           Arlington                         CA           233
Contracted, not yet announced                 430     Thunder Wolf                      CO           200
                Total Post – 2022 Wind:       430     Neptune                           CO           250
                                                      Quitman II                        GA           150
                                                      Cool Springs                      GA           213
                                                      Buena Vista                       NM           120
                                                      Wilmot                             AZ          100
                                                                      Total 2021 – 2022 Solar:     2,921
            1) 2019+ COD and current backlog of projects with signed long-term contracts, all projects are subject to
       59      development and construction risk
Energy Storage Development Program(1)
Project                                Location       MW        Duration       Project                                  Location   MW    Duration
2019:                                                                          Post – 2022:
Montauk                                    NY           5          8.0         Proxima                                    CA        5      4.0
Minuteman                                 MA            5          2.0         Alabama Power                              AL       240     2.0
                                     Total 2019:       10                      Sonoran                                    AZ       250     4.0

2020:                                                                          Storey                                     AZ       88      3.0

Rush Springs                              OK           10          2.0         CT DEEP                                    CT        3      5.0

Distributed Generation                  Various        10          4.0         Skeleton Creek                             OK       200     4.0
                                     Total 2020:       20                                                    Total Post – 2022:    786

2021 – 2022:
Dodge Flat                                 NV          50          4.0
Fish Springs Ranch                         NV          25          4.0
Arlington                                  CA         110          4.0
Wheatridge                                OR           30          4.0
Excelsior                                  NY          20          4.0
Thunder Wolf                              CO          100          4.0
Neptune                                   CO          125          4.0
Cool Springs                              GA           40          2.0
Buena Vista                               NM           50          4.0
Wilmot                                     AZ          30          4.0
Contracted, not yet announced                         460          4.0
                             Total 2021 – 2022:      1,040

            1) 2019+ COD and current backlog of projects with signed long-term contracts, all projects are subject to
     60        development and construction risks
U.S. Federal tax incentives for completed renewables projects
have been extended into the next decade

                              Extended U.S. Federal Tax Credits
                 Wind Production                                                              Solar Investment
                 Tax Credit (PTC)                                                             Tax Credit (ITC)
        Start of                                                                       Start of
      Construction                 COD                 Wind                          Construction                    COD           Solar
         Date                     Deadline             PTC                              Date                        Deadline        ITC
     During 2016                12/31/2021             100%                       During 2019                     12/31/2023       30%
     During 2017                12/31/2022              80%                       During 2020                     12/31/2023       26%
     During 2018                12/31/2022              60%                       During 2021                     12/31/2023       22%
     During 2020                12/31/2023             60%(1)                     Before 2022                  1/1/2024 or After   10%
     During 2020                12/31/2024              60%

•    Solar ITC guidance published by IRS in 2018 is consistent with
     previous wind PTC guidance
     – Safe harbor is deemed satisfied if taxpayer incurs 5% of the construction
       costs and property is placed in service within four calendar years
     – ITC guidance covers storage that is at least 75% charged by the solar
       ITC facility
     1) Wind projects that satisfy the 5% safe harbor guidance in 2019 will qualify for a 40% PTC if the project is placed
        in service in 2023
61
Reconciliation of GAAP Net Income to Adjusted Earnings
                 Attributable to NextEra Energy, Inc.
                                      (Twelve Months Ended December 31, 2019)
                                                                            Florida Pow er        Gulf              Energy       Corporate &         NextEra
(m illions, except per share am ounts)                                         & Light           Pow er           Resources         Other          Energy, Inc.
Net Incom e (Loss) Attributable to NextEra Energy, Inc.                     $        2,334   $            180    $      1,807    $       (552)    $       3,769
Adjustments - pretax:
  Net losses (gains) associated w ith non-qualifying hedges                                                               89              457              546
  Change in unrealized losses (gains) on equity securities held in NEER's
  nuclear decommissioning funds and OTTI - net                                                                           (249)                             (249)
  Impact of income tax rate change on differential membership interests                                                   120                               120
  NEP investment gains - net                                                                                             (124)                             (124)
  Operating loss (income) of Spain solar projects                                                                          (8)                               (8)
  Acquisition-related                                                                                      27               8              19                54
  Less related income tax expense (benefit)                                                                (7)             52             (91)              (46)
Adjusted Earnings (Loss)                                                    $       2,334    $            200    $      1,695    $       (167)    $       4,062

Earnings (Loss) Per Share
Attributable to NextEra Energy, Inc. (assum ing dilution)                   $        4.81    $        0.37       $       3.72    $       (1.14)   $        7.76
Adjustments - pretax:
  Net losses (gains) associated w ith non-qualifying hedges                                                              0.18            0.94              1.12
  Change in unrealized losses (gains) on equity securities held in NEER's
  nuclear decommissioning funds and OTTI - net                                                                          (0.51)                            (0.51)
  Impact of income tax rate change on differential membership interests                                                  0.25                              0.25
  NEP investment gains - net                                                                                            (0.26)                            (0.26)
  Operating loss (income) of Spain solar projects                                                                       (0.02)                            (0.02)
  Acquisition-related                                                                                  0.05              0.02             0.04             0.11
  Less related income tax expense (benefit)                                                           (0.01)             0.11            (0.18)           (0.08)
Adjusted Earnings (Loss) Per Share                                          $        4.81    $         0.41      $       3.49    $       (0.34)   $        8.37

      62
Reconciliation of Earnings Per Share Attributable to
                                 NextEra Energy, Inc. to Adjusted Earnings Per Share
                                                             2004     2005      2006      2007      2008      2009      2010      2011      2012      2013      2014      2015      2016(1)   2017(1)    2018       2019

Earnings Per Share Attributable to NextEra Energy, Inc.
  (assuming dilution)                                        $ 2.48   $ 2.34    $ 3.23    $ 3.27    $ 4.07    $ 3.97    $ 4.74    $ 4.59    $ 4.56    $ 4.47    $ 5.60    $ 6.06    $ 6.24    $ 11.39    $ 13.88    $ 7.76
Adjustments:
  Net losses (gains) associated with non-qualifying
  hedges                                                       0.01     0.47     (0.38)     0.36     (0.70)     0.07     (0.69)    (0.75)     0.15      0.27     (0.70)    (0.64)     0.23       0.46       0.50     1.12
  Change in unrealized losses (gains) on equity securities
  held in NEER's nuclear decommissioning funds and
  OTTI - net(2)                                                                   0.01      0.02      0.34      0.05     (0.02)     0.03     (0.13)    (0.01)      -        0.05       -        (0.05)      0.38     (0.51)
  Acquisition-related expenses                                                    0.06                                                                                      0.06      0.29       0.20       0.07     0.11
  Loss on sale of natural gas-fired generating assets                                                                               0.36
  Gain from discontinued operations (Hydro)                                                                                                            (0.87)
  Loss (gain) associated with Maine fossil                                                                                                              0.16     (0.05)
  Impairment charges                                                                                                                                    0.70                                     0.89
  Resolution of contingencies related to a previous asset
  sale                                                                                                                                                                               (0.02)
  Gain on sale of natural gas generation facilities                                                                                                                                  (0.95)
  Gain on disposal of fiber-optic telecommunications                                                                                                                                            (2.32)
  Impact of income tax rate change on differential
  membership interests (3)                                                                                                                                                                      (3.97)     (1.17)     0.25
  NEP investment gains - net                                                                                                                                                                               (7.91)    (0.26)
  Operating loss (income) of Spain solar projects                                                                                                       0.03      0.09     (0.01)     0.03      (0.01)       -       (0.02)
  Less related income tax expense (benefit)                    0.00    (0.18)     0.12     (0.16)     0.13     (0.04)     0.27      0.16     (0.01)     0.22      0.36      0.19      0.36       0.11       1.95     (0.08)
Adjusted Earnings Per Share                                  $ 2.49   $ 2.63    $ 3.04    $ 3.49    $ 3.84    $ 4.05    $ 4.30    $ 4.39    $ 4.57    $ 4.97    $ 5.30    $ 5.71    $ 6.18    $ 6.70     $ 7.70     $ 8.37

                 1) Amounts have been retrospectively adjusted for accounting standard update related to leases
                 2) Beginning in 2018, reflects the implementation of an accounting standards update related to financial instruments
                 3) Net of approximately $40 MM of income tax benefit at FPL in 2017
         63
Definitional information
NextEra Energy, Inc. Adjusted Earnings Expectations
This presentation refers to adjusted earnings per share expectations. Adjusted earnings expectations exclude the cumulative effect
of adopting new accounting standards, the effects of non-qualifying hedges and unrealized gains and losses on equity securities
held in NextEra Energy Resources’ nuclear decommissioning funds and OTTI, none of which can be determined at this time.
Adjusted earnings expectations also exclude the effects of NextEra Energy Partners, LP net investment gains, gains on disposal of
a business, differential membership interest-related, and acquisition-related expenses. In addition, adjusted earnings expectations
assume, among other things: normal weather and operating conditions; continued recovery of the national and the Florida economy;
supportive commodity markets; current forward curves; public policy support for wind and solar development and construction;
market demand and transmission expansion to support wind and solar development; market demand for pipeline capacity; access to
capital at reasonable cost and terms; no divestitures, other than to NextEra Energy Partners, LP, or acquisitions; no adverse
litigation decisions; and no changes to governmental tax policy or incentives. Expected adjusted earnings amounts cannot be
reconciled to expected net income because net income includes the effect of certain items which cannot be determined at this time.

NextEra Energy Resources, LLC. Adjusted EBITDA
Adjusted EBITDA includes NextEra Energy Resources consolidated investments, its share of NEP and forecasted investments, as
well as its share of equity method investments. Adjusted EBITDA represents projected (a) revenue less (b) fuel expense, less (c)
project operating expenses, less (d) corporate G&A, plus (e) other income, less (f) other deductions. Adjusted EBITDA excludes the
impact of non-qualifying hedges, other than temporary impairments, certain differential membership costs, and net gains associated
with NEP’s deconsolidation beginning in 2018. Projected revenue as used in the calculations of Adjusted EBITDA represents the
sum of projected (a) operating revenue plus a pre-tax allocation of (b) production tax credits, plus (c) investment tax credits and plus
(d) earnings impact from convertible investment tax credits.

NextEra Energy Resources, LLC. Adjusted EBITDA by Asset Category
Adjusted EBITDA by Asset Category includes NextEra Energy Resources consolidated investments, its share of NEP and
forecasted investments, as well as its share of equity method investments. Adjusted EBITDA by Asset Category represents
projected (a) revenue less (b) fuel expense, less (c) project operating expenses, less (d) a portion of corporate G&A deemed to be
associated with project operations, plus (e) other income, less (f) other deductions. Adjusted EBITDA by Asset Category excludes
the impact of non-qualifying hedges, other than temporary impairments, corporate G&A not allocated to project operations, and
certain differential membership costs. Projected revenue as used in the calculations of Adjusted EBITDA by Asset Category
represents the sum of projected (a) operating revenue plus a pre-tax allocation of (b) production tax credits, plus (c) investment tax
credits and plus (d) earnings impact from convertible investment tax credits.

64
You can also read