A Painful Pill to Swallow: U.S. vs. International Prescription Drug Prices - Prepared by Ways and Means Committee Staff - Ways and ...
←
→
Page content transcription
If your browser does not render page correctly, please read the page content below

A Painful Pill to Swallow:
U.S. vs. International Prescription
            Drug Prices

   Prepared by Ways and Means Committee Staff
                 September 2019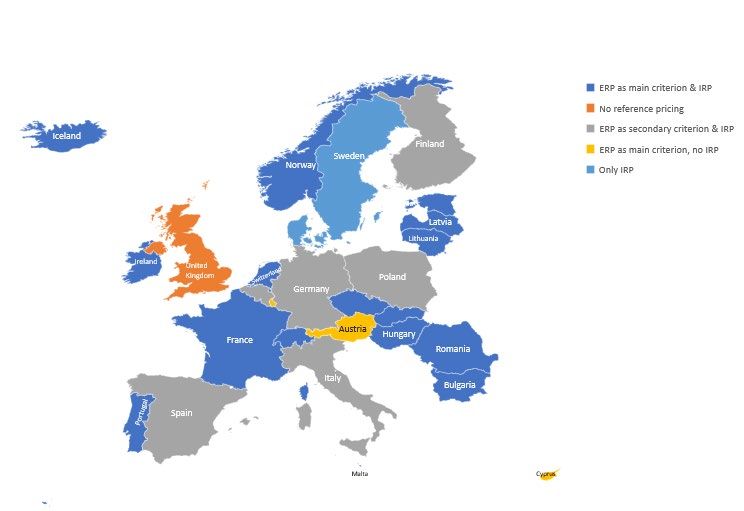
Committee on Ways and Means
                             Table of Contents

Introduction………………………………………………………………………………………..6
Background………………………………………………………………………………………..8
Results……………………………………………………………………………………………14
Discussion………………………………………………………………………………………..29
Conclusion……………………………………………………………………………………….32
Appendix A: Methodology ………………………………………….…………………………..33
Appendix B: US Rebate Rate Required to Match German Net Prices…………………………..38
Appendix C: Country Profiles…………………………………………………………………...40
Appendix D: International List Price Comparison – Overview………………………………….46
Appendix E: International List Price Comparison – Disease Groups..…………………………..49
Appendix F: International List Price Comparison – Manufacturers....…………………………..59

                                       2
Executive Summary
Americans pay on average nearly four times more for drugs than other countries –
in some cases, 67 times more for the same drug.
The United States (U.S.) spent $457 billion in 2016 on combined retail (dispensed at the
pharmacy) and non-retail (dispensed in physician offices) drugs. 1 Medicare alone spent nearly
$130 billion on prescription drugs that year, $99.5 billion of which was for Part D pharmacy
drugs and $29.1 billion of which was for Part B physician-administered drugs. 2 In the five years
between 2011 and 2016, drug spending nationwide grew by 27 percent – more than 2.5 times the
rate of growth in inflation. 3 According to a 2018 Kaiser Family Foundation poll, 79 percent of
Americans believe the costs of prescription drugs are unreasonable – and 26 percent are worried
they cannot afford the prescription drugs they need. 4
Given the rise in prescription drug costs and the associated out-of-pocket burden on
consumers, U.S. policymakers and experts are considering models that successfully lower costs.
This report examines patterns of drug pricing in the U.S. relative to other international
comparator countries through a six-part analysis examining price differentials among 79 drugs
sold in 11 countries and the U.S. in 2017 and 2018. The non-U.S. comparators in our analysis
were: the United Kingdom (UK), Japan, Ontario, Australia, Portugal, France, the Netherlands,
Germany, Denmark, Sweden, and Switzerland. 5
1
Observation on Trends in Prescription Drug Spending (2019). Department of Health and Human Services.
Retrieved from https://aspe.hhs.gov/system/files/pdf/187586/Drugspending.pdf
2
10 Essential Facts About Medicare and Prescription Drug Spending (2019). Henry J. Kaiser Family Foundation.
Retrieved from https://www.kff.org/infographic/10-essential-facts-about-medicare-and-prescription-drug-spending/
3
Analysis of Centers for Medicare & Medicaid Services, Office of the Actuary prescription drug spending data,
Table 11 and BLS data on CPI-U 2011-2016. Retrieved from https://www.cms.gov/Research-Statistics-Data-and-
Systems/Statistics-Trends-and-Reports/NationalHealthExpendData/NationalHealthAccountsHistorical.html
4
Public Opinion on Prescription Drugs and Their Prices (2019). Henry J. Kaiser Family Foundation. Retrieved
from https://www.kff.org/slideshow/public-opinion-on-prescription-drugs-and-their-prices/
5
Although Ontario is a province and not a country, it is included in the analysis because it purchases its own drugs
independently of the rest of Canada. For the purposes of simplicity, we refer to all comparison entities as “countries”
or “nations.” In all instances throughout this report, this reference to “countries” is inclusive of Ontario.
3Key Findings:
U.S. Drug Prices Significantly Higher than All 11 Other Countries
• The U.S. pays the most for drugs, though prices varied widely.
• U.S. drug prices were nearly four times higher than average prices compared to similar
countries.
• U.S. consumers pay significantly more for drugs than other countries, even when accounting
for rebates.
• The U.S. could save $49 billion annually on Medicare Part D alone by using average drug
prices for comparator countries.
The U.S. pays the most for drugs, though prices varied widely. Across the 79 drugs in
our sample, the average list price per dose was $152.92, ranging from $0.08 6 to $16,597. 7
Annual pharmaceutical spending per capita varied from $318 in Denmark to $1,220 in the
United States. Average annual per capita spending on pharmaceuticals was $675.25 across the 12
countries, $625.73 excluding the U.S. U.S. drug prices are on average outliers relative to all
comparator countries. Most countries had average drug prices around 24 to 30 percent of those in
the United States. The greatest disparity was with Japan, where the average drug price was only
15 percent that of the U.S., meaning that the U.S. on average spends seven times what Japan
pays for the same drugs. Denmark represented the closest average price, where average drug
prices were 39.1 percent of the average U.S. drug price.
U.S. drug prices were nearly four times higher than average prices compared to
similar countries. We found that individual drug prices in the U.S. ranged from 70 8 to 4,833
percent 9 higher than the combined mean price in the other 11 countries. On average, U.S. drug
prices were 3.7 times higher than the combined average of the other 11 countries in the study.
U.S. consumers pay significantly more for drugs than in other nations, even when
accounting for rebates. One of the major arguments from the pharmaceutical industry justifying
these international price differentials is that while list prices are much higher in the U.S., the
rebates offered are also significantly higher, so the net price is comparable. To test this claim, we
compared rebate rates in the U.S. to Germany and found German rebate rates are relatively low
compared to U.S. rebates, ranging from 0 to 35 percent and averaging 8.7 percent. U.S. rebates
would need to average 67 percent to match average German net prices, and the average U.S.
rebate rate would need to be about 73.3 percent in order for U.S. net prices to match list prices in
6
Premarin in the UK
7
Stelara in the U.S.
8
Lantus Solostar
9
Dulera
4the other 11 countries in the study. According to the Congressional Budget Office (CBO) the
average rebate rate for band name drugs was 22 percent in 2015. 10
The U.S. could save $49 billion annually on Medicare Part D alone by using average
drug prices for other countries. Using our basket of comparison drugs (i.e., an index of
average drug prices across all 11 non-U.S. countries), we estimated potential Medicare Part D
savings if an average of foreign prices were applied to the U.S. We replicated this comparison
using both German prices and U.K. drug prices as a benchmark. The U.S. spent an estimated $67
billion in 2018 on the 79 drugs in our sample through Medicare Part D plans. Purchasing these
same drugs using the “basket list price” could reduce Part D spending by $48.8 billion annually.
The analysis presented in this report clearly illustrates that, across the board, the U.S.
spends more on drugs than other comparable developed countries. The extent of these pricing
differentials varies by drug, manufacturer, and disease group, but the results we present show the
existence of large differences between the U.S. drug pricing system and other countries – and the
associated negative effect those differences have on out-of-pocket costs borne by the American
consumer and associated costs borne by the taxpayer. The system in place now does not work for
the Americans who depend on it – by all measures, U.S. consumers pay too high a price for
drugs.
10
Prices for and Spending on Specialty Drugs in Medicare Part D and Medicaid (2019). Congressional Budget
Office. Retrieved from https://www.cbo.gov/system/files/2019-03/54964-Specialty_Drugs.pdf
5Introduction
When the Committee on Ways and Means in 1965 marked up proposals to create what
would eventually become Title XVIII of the Social Security Act, it dropped the Medicare Part B
prescription drug benefit from the bill due to its potentially high and unpredictable costs. 11 For
41 years, Medicare beneficiaries received most of their prescription drugs from other sources –
employer retirement programs, private Medigap coverage, and Medicaid. The Medicare
Modernization Act (MMA) of 2003 changed that by creating Medicare Part D, a voluntary
outpatient prescription drug benefit administered through private plans. 12
Since then, Part D has evolved into a plan to protect patients from exorbitant costs, and
yet patient burden continues to grow rapidly. 13 Despite its broad uptake – almost 45 million of
59 million Medicare beneficiaries were enrolled in 2019 – the benefit has struggled to provide
beneficiaries with protections from high out-of-pocket costs in the face of extremely expensive
drugs. 14 Such consumer-facing inadequacies under Part D have resulted in the Medicare
Payment Advisory Commission (MedPAC), presidential budgets (under both Obama and
Trump), and other independent experts to call for changes to the structure of the Part D
program. 15 16 17
Rapid increases in drug prices have over time exacerbated cracks in the Part D program’s
benefit design. 18 Between 2011 and 2016, drug spending nationwide grew by 27 percent – more
than 2.5 times the rate of growth in inflation. 19 In particular, the rise in spending for specialty
drugs has driven the increase in spending in Medicare Part D and Medicaid. 20 A 2019
Congressional Budget Office (CBO) report found that from 2010 to 2015, specialty drugs
11
Oliver, Thomas R. et. al. (2004). A Political History of Medicare and Prescription Drug Coverage. The Milbank
Quarterly. Retrieved from
https://www.ncbi.nlm.nih.gov/pmc/articles/PMC2690175/#targetText=On%20December%208%2C%202003%2C%
20President,other%20changes%20to%20the%20program.
12
Id.
13
Blum, Jonathan (2006). A History of Creating the Medicare Prescription Drug Benefit. Avalere Health LLC.
Retrieved from https://avalere.com/research/docs/Part_D_Commentary.pdf
14
Cubanski, Juliette and Neuman, Tricia (2019). 10 Things to Know About Medicare Part D Coverage and Costs in
2019. Retrieved from https://www.kff.org/medicare/issue-brief/10-things-to-know-about-medicare-part-d-coverage-
and-costs-in-2019/
15
Improving Medicare Part D. Medicare Payment Advisory Commission, June 2016. Retrieved from
http://www.medpac.gov/docs/default-source/reports/chapter-6-improving-medicare-part-d-june-2016-report-.pdf
16
US Department of Health and Human Services. (2017). Budget in Brief: Strengthening Health and Opportunity
for All Americans. Budget in Brief: Strengthening Health and Opportunity for All Americans. Retrieved from
https://www.hhs.gov/sites/default/files/fy2017-budget-in-brief.pdf
17
US Department of Health and Human Services. (2019). Budget in Brief: Putting America's Health First . Budget
in Brief: Putting America's Health First. Retrieved from https://www.hhs.gov/sites/default/files/fy-2019-budget-in-
brief.pdf
18
Id.
19
Analysis of Centers for Medicare & Medicaid Services, Office of the Actuary prescription drug spending data,
Table 11 and BLS data on CPI-U 2011-2016. Retrieved from https://www.cms.gov/Research-Statistics-Data-and-
Systems/Statistics-Trends-and-Reports/NationalHealthExpendData/NationalHealthAccountsHistorical.html
20
Cubanski, Juliette and Neuman, Tricia (2019). How Much Does Medicare Spend on Insulin. Henry J Kaiser
Family Foundation. Retrieved from https://www.kff.org/medicare/issue-brief/how-much-does-medicare-spend-on-
insulin/
6accounted for 13 percent of Part D spending in 2010 and 31 percent by 2015; in Medicaid, those
rates were 25 percent in 2010 and 35 percent by 2015. 21 With six in 10 Americans reporting they
currently take at least one prescription medication (and one in four reporting they take four or
more), drug prices have far-reaching effects. 22
Countervailing trends – skyrocketing drug prices coupled with an increasingly aging
population in need of prescription drugs – have increased urgency among congressional
lawmakers and Trump Administration officials to develop policies aimed at reigning in the cost
of drugs for American consumers. 23 These approaches to protect and preserve Part D include
such payment options as allowing the Secretary of the Department of Health and Human
Services (the Secretary) to negotiate the price of drugs on behalf of the Medicare program. 24
In particular, the huge drug price differentials between the United States (U.S.) and other
developed countries has focused lawmakers’ attention on ensuring U.S. consumers get a better
deal. According to one study, the U.S. spent between three and four times the rate for certain
single-source brand name drugs than the United Kingdom (U.K.), Japan, or Ontario. 25 Despite
the wide acknowledgement of these international disparities in price and spending, researchers
have not explored in great detail the differences in prices for drugs across an array of comparable
developed countries. This report examines patterns of drug pricing in the U.S. relative to other
international comparator countries, using a subset of 79 common drugs and a descriptive
empirical approach to document differences in pricing in the U.S. relative to other countries.
Findings from this report will provide context for policy proposals to bring down drug prices in
the U.S.
21
Prices for and Spending on Specialty Drugs in Medicare Part D and Medicaid (2019). Congressional Budget
Office. Retrieved from https://www.cbo.gov/system/files/2019-03/54964-Specialty_Drugs.pdf
22
Public Opinion on Prescription Drugs and Their Prices (2019). Henry J. Kaiser Family Foundation. Retrieved
from https://www.kff.org/slideshow/public-opinion-on-prescription-drugs-and-their-prices/
23
Sachs, Rachel (2019). Prescription Drug Policy: The Year in Review, and the Year Ahead. Health Affairs Blog.
Retrieved from https://www.healthaffairs.org/do/10.1377/hblog20190103.183538/full/
24
Cubanski, Juliette et. al. (2019). What’s the Latest on Medicare Drug Price Negotiations? Retrieved from
https://www.kff.org/medicare/issue-brief/whats-the-latest-on-medicare-drug-price-negotiations/
25
Kang, So-Yeon et. al. (2019). Using External Reference Pricing in Medicare Part D to Reduce Drug price
Differentials with Other Countries. Health Affairs Blog. Retrieved from
https://www.healthaffairs.org/doi/pdf/10.1377/hlthaff.2018.05207
7Background
The U.S. spent $457 billion in 2016 on combined retail (dispensed at the pharmacy) and
non-retail (dispensed in physician offices) drugs. 26 27 Medicare alone spent nearly $130 billion
on prescription drugs that year, $99.5 billion of which was for Part D pharmacy drugs and $29.1
billion of which was for Part B physician-administered drugs. 28 In total, 30 percent of Medicare
spending went to prescription drug costs in 2016. 29 As Figure 1 shows, U.S. spending on
prescription drugs has been rising precipitously during the time that Medicare has been paying
for drugs under Part D. Projections indicate this spending will only continue to increase.
Figure 1. Historical and Projected Prescription Drug Spending by Payer, 2005-2026 30
SOURCES and NOTES: Figure 1 was reproduced from the Henry J Kaiser Family Foundation article entitled “10
Essential Facts About Medicare and Prescription Drug Spending.” Data were provided by the Henry J. Kaiser
Family Foundation. The figure only includes Medicare Part D data.
There is a direct and positive relationship between the cost of drugs and drug spending.
Between 2012 and 2016, drug spending grew by 27 percent for individuals with employer-
26
Observation on Trends in Prescription Drug Spending (2019). Department of Health and Human Services.
Retrieved from https://aspe.hhs.gov/system/files/pdf/187586/Drugspending.pdf
27
Retail Prescription Drugs Filled at Pharmacies per Capita (2018). Henry J. Kaiser Family Foundation. Retrieved
from https://www.kff.org/health-costs/state-indicator/retail-rx-drugs-per-
capita/?currentTimeframe=0&sortModel=%7B%22colId%22:%22Location%22,%22sort%22:%22asc%22%7D
28
10 Essential Facts About Medicare and Prescription Drug Spending (2019). Henry J. Kaiser Family Foundation.
Retrieved from https://www.kff.org/infographic/10-essential-facts-about-medicare-and-prescription-drug-spending/
29
Id.
30
Id.
8sponsored health insurance; at the same time, drug prices increased by almost 25 percent (and
utilization only increased by about two percent during that time). 31
The introduction of new types of drugs into the market is one driving factor of these
increases in spending. For example, in 2014 and 2015, prescription drug spending increased
rapidly because of the new high-cost hepatitis C drugs that came to market. 32 Drugs are most
expensive when they are first introduced to market, before there is competition of other drugs in
their class, and before the original patent expires and generics become available. 33
America’s Drug Prices are Too High
American consumers are feeling the effects of drug pricing increases directly, with many
facing the life-threatening choice between filling a necessary prescription and putting food on the
table. 34 Six in 10 Americans report they currently take at least one prescription medication, and
one in four report taking four or more medications. 35 According to a 2018 Kaiser Family
Foundation poll, 79 percent of Americans believe the costs of prescription drugs are
unreasonable, and 26 percent are worried they may not be able to afford the prescription drugs
they need. 36
Such concerns are merited: According to one 2015 poll, an estimated one in four
Americans had not filled a prescription in the last year because of the high cost of the drug. 37
Similarly, a 2013 study found that one in four cancer patients had either not filled a prescription
or had reduced their prescribed dosage as a result of the price tag associated with the drugs. 38
As the cost of prescription drugs continues to climb, this reality will only affect more
Americans. In 2015, the average total cost of treating a patient with specialty medications was
more than $52,000, with patients responsible for a bill in excess of $10,000, on average. 39
31
2016 Health Care Cost and Utilization Report (2018). Health Care Cost Institute. Retrieved from
https://www.healthcostinstitute.org/research/annual-reports/entry/2016-health-care-cost-and-utilization-report
32
Henry, B. (2018). Drug Pricing and Challenges to Hepatitis C Treatment Access. Journal of Health & Biomedical
Law, 14, 265-283.
33
Id.
34
The Affordability Conundrum (2017). National Academies of Sciences, Engineering, and Medicine. Retrieved
from: https://www.ncbi.nlm.nih.gov/books/NBK493099/
35
Public Opinion on Prescription Drugs and Their Prices (2019). Henry J. Kaiser Family Foundation. Retrieved
from https://www.kff.org/slideshow/public-opinion-on-prescription-drugs-and-their-prices/
36
Id.
37
Poll: Nearly 1 in 4 Americans Taking Prescription Drugs Say It’s Difficult to Afford Their Medicines (2019).
Henry J. Kaiser Family Foundation. Retrieved from https://www.kff.org/health-costs/press-release/poll-nearly-1-in-
4-americans-taking-prescription-drugs-say-its-difficult-to-afford-medicines-including-larger-shares-with-low-
incomes/
38
Zafar et al. (2013). The financial toxicity of cancer treatment: A pilot study assessing out-of-pocket expenses and
the insured cancer patient’s experience. Oncologist. 2013;18(4):381-90. Retrieved from
https://www.ncbi.nlm.nih.gov/pubmed/23442307
39
Trends in Retail Prices of Specialty Prescription Drugs Widely Used by Older Americans, 2006 to 2015 (2017).
AARP Public Policy Institute. Retrieved from https://www.aarp.org/content/dam/aarp/ppi/2017/11/full-report-trends-
in-retail-prices-of-specialty-prescription-drugs-widely-used-by-older-americans.pdf
9Among Medicare beneficiaries, 21 percent of out-of-pocket spending in 2016 went to
prescription drugs. 40
External Reference Pricing and Pharmaceutical Cost Containment Abroad
Given the rise in prescription drug costs and the associated out-of-pocket spending
burden on consumers, U.S. policymakers and experts have been focusing their attention on ways
to bring down costs for constituents, in part by looking to models abroad. Based on the average
cost of drugs, models in other developed nations are arguably more effective than the U.S. in
protecting consumers from rising drug prices by using an external reference pricing (ERP)
system.
An ERP system refers to the practice of using the price of a pharmaceutical product
(generally an ex-factory price, also referred to as a “list price”) in one or several countries to
create a benchmark or reference price for the purposes of setting or negotiating drug prices in a
given country. 41 42 With the exceptions of Denmark, Sweden, and the U.K., almost every
European country – and most other developed nations – has established some form of an ERP. 43
Most countries with an ERP create a “basket” of rates in comparable countries and use
the average of all prices in the basket as a benchmark, but there is some variation (e.g., Spain
uses the lowest price of comparator systems; Greece uses the average of the three lowest prices).
The number of countries used as references ranges from three in Portugal to 30 in Poland. Most
countries use manufacturer prices (i.e., the price that the manufacturer charges wholesalers or
pharmacies) for their ERP; however, Finland uses wholesale prices (i.e., list prices for a drug to
wholesalers or other direct purchasers, which does not include discounts or rebates) and the
Netherlands uses retail prices (i.e., manufacturers’ sales prices for a drug, net of price
adjustments). 44 Every country with an ERP uses publicly available price information, which does
not incorporate confidential discounts and rebates negotiated between payers and manufacturers.
Many countries also incorporate an internal reference price (IRP), which is typically used
for pricing generics. 45 IRPs are meant to determine pharmaceutical prices based on market
equivalents or similar products within the country. 46 They are also used to set payment rates for
40
10 Essential Facts About Medicare and Prescription Drug Spending (2019). Henry J. Kaiser Family Foundation.
Retrieved from https://www.kff.org/infographic/10-essential-facts-about-medicare-and-prescription-drug-spending/
41
Dimitra Panteli et al. (2016). Pharmaceutical Regulation in 15 European Countries. Health Systems in Transition.
Retrieved from http://www.euro.who.int/__data/assets/pdf_file/0019/322444/HiT-pharmaceutical-regulation-15-
European-countries.pdf?ua=1
42
WHO Guideline on Country Pharmaceutical Pricing Policies (2013). World Health Organization. Retrieved from
https://www.ncbi.nlm.nih.gov/books/NBK258618/
43
Id.
44
Mattingly, Joey (2012). Understanding Drug Pricing. U.S. Pharmacist. Retrieved from
https://www.uspharmacist.com/article/understanding-drug-pricing
45
Dimitra Panteli et al. (2016). Pharmaceutical Regulation in 15 European Countries. Health Systems in Transition.
Retrieved from http://www.euro.who.int/__data/assets/pdf_file/0019/322444/HiT-pharmaceutical-regulation-15-
European-countries.pdf?ua=1
46
Dimitra Panteli et al. (2016). Pharmaceutical Regulation in 15 European Countries. Health Systems in Transition.
Retrieved from http://www.euro.who.int/__data/assets/pdf_file/0019/322444/HiT-pharmaceutical-regulation-15-
European-countries.pdf?ua=1
10product groups, which typically cluster drugs according to active substance or therapeutic
class. 47 Figure 2 provides a summary of the variation in reference pricing approaches across
European countries; only three countries (Sweden, Denmark, and the U.K.) with data depicted on
the map do not use some form of ERP.
Figure 2. Use of Reference Pricing in European Countries, 2016 48
SOURCES and NOTES: Figure 2 was reproduced from the from the Dimitra Panteli et al. (2016) Health Systems
in Transition article entitled, “Pharmaceutical Regulation in 15 European Countries.”
Regardless of the approach, empirical evidence shows ERPs are effective in ensuring
drug prices are more moderately priced in a market, resulting in reductions in prices of about 15
percent over 10 years, according to one study. 49 In the domestic context, a Center for Economic
and Policy Research study suggested Medicare could save $541 billion over 10 years –
approximately $54 billion annually – if Medicare’s system looked more like Denmark’s;
beneficiaries would save $112.4 billion within this same policy framework. 50 The study also
47
Id.
48
Id.
49
Id.
50
Shih, C., Schwartz, J., and Coukell (2016). A. How Would Government Negotiation of Medicare Part D Drug
Prices Work? Health Affairs Blog. Retrieved from
https://www.healthaffairs.org/do/10.1377/hblog20160201.052912/full/
11found that on average, Americans spend nearly twice as much per person per year on
prescription drugs, when compared to countries like Canada, Denmark, Germany and the UK. 51
EFPIA Principles for External Reference Pricing Systems
The European Federation of Pharmaceutical Industries and Associations (EFPIA) is the
advocacy group that represents the pharmaceutical industry operating in Europe. 52 In 2014, the
EFPIA provided recommendations for configuring an ERP system and integrating it into a wider
pricing mechanism. 53 The EFPIA issued such recommendations to address difficulties in cross-
market comparisons, consumer costs, consumer access, and research and development (R&D)
spending. 54
EFPIA-issued recommendations on ERP system standards
• An ERP should be used in the context of a broader pricing and reimbursement methodology
that provides flexibility in price negotiations.
• An ERP should cluster approximately five to seven countries with comparable Gross
Domestic Product (GDP) per capita and similar health care systems.
• Ex-factory prices should be referenced since distribution structures and tax rates vary
widely across countries. Incorporating negotiated prices or discounts could undermine the
flexibility of customers to agree to the terms of the manufacturer.
• The methodology of an ERP should use an average price and not the lowest price of the
basket. Responsible ERP methods should calculate a weighted average of a “basket” of ex-
factory prices.
• ERP is best used for the launch of a product.
• Restricting country baskets to the same currency zone avoids distortions to currency
fluctuations.
• Data sources should be valid, reliable, public, and vetted by stakeholders with direct
interest in the pricing process.
No country has configured its ERP to match all of these guiding principles. Most
countries with an ERP use the average price of a basket and do not weight them by market size
or purchasing power parity. 55 With the exception of the basket size recommendation, Germany’s
ERP configuration strategy comes closest to the EFPIA recommendations. 56
51
Principles for Application of International Reference Pricing Systems (2014). European Federation of
Pharmaceutical Industries and Associations. Retrieved from http://www.pharmalogica.pl/efpia-position-paper-
principles-for-application-of-international-reference-pricing-systems,i2301?download=2362
52
About Us (2019). European Federation of Pharmaceutical Industries and Associations. Retrieved from
https://www.efpia.eu/about-us/
53
Id.
54
Id.
55
Dimitra Panteli et. al. (2016). Pharmaceutical Regulation in 15 European Countries. Health Systems in Transition.
Retrieved from http://www.euro.who.int/__data/assets/pdf_file/0019/322444/HiT-pharmaceutical-regulation-15-
European-countries.pdf?ua=1
56
Id.
12Trump Administration Part B International Price Index (IPI) Proposal 57
In 2018, the Centers for Medicare & Medicaid Services (CMS) released an Advance
Notice of Proposed Rulemaking (ANPRM) that for the first time sought to leverage international
models to reduce drug prices in the U.S. 58 Specifically, the ANPRM sought public input on ways
to change how Medicare pays for Part B prescription drugs that patients receive in doctors’
offices, like chemotherapy or eye injections (the model did not include drugs patients pay for at
the pharmacy under Medicare Part D). 59 While not fully developed, the Trump Administration
took a first step at initiating an ERP system, though its design did not echo most ERP
recommendations. Still, the IPI was an acknowledgement that the U.S. is paying more for drugs
than other countries, a reality that has harmed American consumers.
The model lacked clarity on many structural details; however, it proposed supplying Part
B drugs to providers through a middleman vendor based on an average sales prices (ASP) and
International Price Index (IPI) blended rate. Currently, CMS pays doctors and hospitals the ASP
plus six percent of the drug price for administrative costs. 60 The ASP is a calculation of the
weighted average of manufacturers’ sales prices for a drug for all purchasers, net of price
adjustments. 61 As described, the model changes how Medicare pays hospitals and providers (but
not pharmaceutical companies) for drugs. Since nothing requires drug companies to sell the
prescriptions to the middleman at a lower price than they receive today, there is concern these
proposals could simply shift costs around. 62
The Trump Administration’s initial projections estimate that the plan would save $17.2
billion over five years and reduce out-of-pocket costs for Medicare beneficiaries by $3.4
billion.63 However, key details are missing in this proposal on how it would be operationalized.
Additionally, most drug costs are incurred in Part D and this proposal is limited to Part B – a
small part of the drug market – reducing IPI’s ability to affect the drug pricing system on a larger
scale for Medicare beneficiaries or Americans more broadly. CMS has not released the policy as
a Proposed Rule. 64
57
ANPRM International Pricing Index Model for Medicare Part B Drugs (2018). Centers for Medicare and
Medicaid Services. Retrieved from https://www.cms.gov/newsroom/fact-sheets/anprm-international-pricing-index-
model-medicare-part-b-drugs
58
Id.
59
Id.
60
Mattingly, Joey (2012). Understanding Drug Pricing. U.S. Pharmacist. Retrieved from
https://www.uspharmacist.com/article/understanding-drug-pricing
61
Id.
62
Liberman, Steven and Ginsburg, Paul B. (2019). CMS’s International Pricing Model for Medicare Part B Drugs:
Implementation Issues. Health Affairs Blog. Retrieved from
https://www.healthaffairs.org/do/10.1377/hblog20190708.294165/full/
63
Id.
64
Id.
13Results
Given the focus on international drug pricing models as an example for bringing down costs
in the U.S., we conducted an analysis to understand the extent to which U.S. drug prices exceed
those in other similar countries globally. As policymakers continue to consider ways to drive
down drug prices in the U.S. – particularly through external reference-type models – it is
increasingly important to better understand the relationship between the prices and costs in the
U.S. system and comparable countries abroad. Accordingly, the following section describes the
results from our six-part analysis conducted to examine price differentials among a select subset
of 79 drugs sold in 11 countries and the U.S. in 2017 and 2018; a detailed description of the
methodology employed and limitations of this analysis is included in Appendix A to this
report. 65
1. Descriptive Statistics
Table 1 presents descriptive statistics for average drug prices, by country, for each of the
12 countries in our study cohort. Across the 79 drugs in our sample, the average list price was
$152.92, ranging from $0.08 (Premarin, a medication used to treat symptoms of menopause, in
the U.K.) to $16,597 (Stelara, a medication used to treat moderate to severe plaque psoriasis, in
the U.S.). 66 67 Pharmaceutical spending per capita varied from $318 in Denmark to $1,220 in the
United States. Average per capita spending on pharmaceuticals was $675.25 across the 12
countries. Across the 12 countries sampled, there were an average of 61.4 drug prices listed (out
of a possible 79 drugs). Due to data aberrations, the number of drug prices listed on each
country’s database varied from 37 drugs in Portugal to all 79 drugs in the U.S.
65
Although Ontario is a province and not a country, it is included in the analysis because it purchases its own drugs
independently of the rest of Canada. For the purposes of simplicity, we refer to all comparison entities as “countries”
or “nations.” In all instances throughout this report, this reference to “countries” is inclusive of Ontario.
66
Premarin (2019). Pfizer Inc. Retrieved from https://www.premarin.com/
67
Stelara (2019). Janssen Biotech, Inc. Retrieved from https://www.stelarahcp.com/
14Table 1. Descriptive Statistics on Prescription Drug Prices for Select Countries, 2018
Summary Statistics of Pharmaceutical List Prices, 2018
Pharmaceutical Spending per Drugs
Average Min Max
Capita 68 Listed
U.S. $466.15 $5.36 $16,597.86 $1,220.00 79
UK $105.45 $0.08 $2,921.09 $469.00 78
Japan $69.50 $0.15 $488.66 $838.00 58
Canada
$132.59 $0.27 $3,557.82 $832.00 47
(Ontario)
Australia $113.57 $0.67 $3,043.87 $673.00 62
Portugal $82.97 $0.32 $682.02 $403.00 37
France $104.51 $0.42 $2,455.79 $653.00 54
Netherlands $152.86 $1.42 $3,742.87 $396.00 61
Germany $165.01 $0.46 $4,728.76 $823.00 65
Denmark $182.29 $0.90 $4,719.68 $318.00 65
Sweden $143.91 $0.54 $3,612.73 $515.00 59
Switzerland $116.22 $0.69 $3,475.85 $963.00 72
Average $152.92 $0.08 $16,597.86 $675.25 79
Average
(excluding $124.45 $0.08 $4,728.76 $625.73 59.9
US)
SOURCES and NOTES: Authors’ analysis of price data for 2018, collected from recognized price sources.
Pharmaceutical spending per capita refers to the entire country of Canada and not specifically Ontario, Canada.
As Table 1 shows, U.S. drug prices are, on average, outliers relative to all comparator
countries. When excluding the U.S., the average
Most countries had average drug
drug price of the other 11 countries ($124.45) is
prices around 24 to 30 percent of those
only about 27 percent of the average drug price in
in the United States. The greatest
the US ($466.15). When excluding both the U.S.
disparity was with Japan, where the
and Portugal (the country with the lowest GDP)
average drug price was only 15
from this cohort, the average drug price was
percent that of the U.S., meaning that
$129.56 for the other 10 countries. Most countries
the U.S. on average spends seven times had average drug prices around 24 to 30 percent of
what Japan pays for the same drugs. those in the United States. The greatest disparity
was with Japan, where the average drug price was
only 15 percent that of the U.S., meaning that the U.S. on average spends seven times what Japan
pays for the same drugs. Denmark represented the smallest disparity, where average drug prices
were 40 percent of the average U.S. drug price.
68
Pharmaceutical Spending (2018). Organisation for Economic co-operation and Development. Retrieved from
https://data.oecd.org/healthres/pharmaceutical-spending.htm
15The highest per-dose drug price in the sample was for Stelara, priced at a $16,597.86. 69
Stelara was between 3.5 to 6.75 times more expensive in the U.S. than in other countries in our
dataset. Of the 79 drugs listed, the lowest-priced drug in the U.S. was Premarin. 70 Still, in the
U.S., this drug costs $5.36, which is 20 to 67 times the average price of Premarin in the other 11
countries.
2. Factors Affecting Price Differentials
Figure 3 shows results from our analysis on the extent to which per capita GDP might
drive drug prices in a given country. If per capita GDP is positively associated with drug prices
in a given country, we would expect the 11 non-U.S. countries in our analysis to have drug prices
at about 80 percent of those in the U.S. Figure 3 shows this was not the case: For the drugs
included in this analysis, the combined average drug prices were 26.8 percent (or 34.3 percent
without Portugal) of average U.S. drug prices.
Figure 3. Percent of International GDP per Capita to US GDP per Capita and Average
Prescription Drug Price Compared to U.S. Average Drug Price under Medicare Part D,
2018
140.0% 132.2%
120.0%
96.7%
100.0% 91.5%
84.6% 86.4%
79.6% 76.9%
80.0% 73.6%
67.8% 66.2%
62.7%
60.0%
36.9% 39.1%
40.0% 32.8% 35.0%
28.4% 30.4%
26.8% 23.9% 24.4% 24.9%
22.4%
14.9% 17.8%
20.0%
0.0%
Ratio of GDP per Capita to US Ratio of Average Drug Price to US
SOURCES and NOTES: Authors’ analysis of price data for 2018, collected from recognized price sources.
69
Stelara (2019). Janssen Biotech, Inc. Retrieved from https://www.stelarahcp.com/
70
Premarin (2019). Pfizer Inc. Retrieved from https://www.premarin.com/
16While most countries had a lower GDP per capita than the U.S., Switzerland had a GDP
per capita over 30 percentage points greater than that of the United States. Despite its greater per
capita wealth and, thus, purchasing power,
If per capita GDP is positively Switzerland had average drug prices about 25
associated with drug prices in a given percent of those in the U.S. As shown in Figure 3,
country, we would expect the 11 non- although relative GDP per capita per country ranged
U.S. countries in our analysis to have from 37 percent to 132.2 percent that of the U.S.,
drug prices at about 80 percent of average drug prices were more consistent, at about
those in the U.S. This was not the case: 15 percent to 40 percent of the U.S.’s average drug
For the drugs included in this analysis, price.
the combined average drug prices
were 26.8 percent (or 34.3 percent Notably, Portugal had a lower GDP per
without Portugal) of average U.S. drug capita ($21,136.30) compared to the average GDP
prices. per capita ($50,931.58) across the entire sample of
countries. We included it in our study because
Portugal utilizes a unique ERP model, which bases its ERP calculation on the lowest price of its
three-country basket. 71 Where relevant, we have included calculations that exclude Portugal from
the sample.
3. International Comparison of Average Prescription Drug Prices
One of the primary goals of this study was to
determine the price differential between drug prices With one exception, individual
in the U.S. and other comparable nations. If prices in drug prices in the U.S. ranged
the U.S. are just marginally higher than most from 70 percent to 4833 percent
countries, then these price differentials may be higher than the combined mean
explained by justifiable variations in per capita price in the 11 other countries
income or other manufacturing costs. If the price studied… On average, U.S. drug
differentials between the U.S. and other nations are prices were 3.7 times higher than
large, then factors other than per capita GDP are the combined average of the other
likely driving the higher prices in the U.S. market. 11 countries.
With one exception, we found that individual drug prices in the U.S. ranged from 70
percent (Lantus Solostar – a type of insulin) to 4,833 percent (Dulera – a prescription asthma
medication) higher than the combined mean price in the other 11 countries. 72 73 Compared to
individual countries, drug prices in the U.S. ranged from 0.6 to 67 times the price for the same
drugs. On average, U.S. drug prices were 3.7 times higher than the combined average of the
other 11 countries. There was only one drug, Reyataz, an HIV medication, where the price in the
U.S. ($7.93) was lower than the combined mean price of the other 11 countries ($8.25) – by
about 3.9 percent. 74
71
Dimitra Panteli et. al. (2016). Pharmaceutical Regulation in 15 European Countries. Health Systems in Transition.
Retrieved from http://www.euro.who.int/__data/assets/pdf_file/0019/322444/HiT-pharmaceutical-regulation-15-
European-countries.pdf?ua=1
72
Using Lantus (2019). Sanofi-Aventis US LLC. Retrieved from https://www.lantus.com/using-solostar-insulin-pen
73
Dulera (2018). Merck Sharp & Dohme Corp. Retrieved from https://www.dulera.com/
74
What is Reyataz? (2018). Bristol-Myers Squibb Company. Retrieved from http://www.reyataz.com/what-is-
reyataz
17Lower-priced drugs exhibited larger disparities between the U.S. and its international
comparators. The largest disparity occurred with Dulera, which costs $23.95 per dose in the U.S.
but averages $0.49 in the other countries, making it nearly 5,000 percent more expensive in the
U.S. Similarly, Premarin (3,116 percent higher price in the U.S.), Advair Diskus 75, an asthma
medication (1,296 percent higher price in the U.S.), Januvia 76, a non-insulin Type 2 diabetes
medication (1,019 percent higher price in the U.S.), and Combigan 77, a medication to treat
symptoms of glaucoma (985 percent higher price in the U.S.), were all about 10 times more
expensive in the U.S. compared to the mean price in the other 11 countries.
For high-priced drugs, the relative price differential in the U.S. was lower, but prices
were still higher in the U.S. than in other countries. Humira, an anti-inflammatory drug used to
treat a number of conditions, is the best-selling prescription drug in the world. 78 Since 2012, it
has doubled in price in the U.S. and is currently priced at $2,346.02 per dose (it reputedly costs
an average of $38,000 per patient per year after rebates). 79 Compared to the combined mean
price of the other 11 countries ($450.60), Humira is over 500 percent more expensive in the U.S.
In fact, by country, the next highest price for Humira is in Denmark, where it costs $787.10 per
dose, about a third of the price in the U.S. Figure 3 summarizes these data, showing average drug
prices by country as a percentage of U.S. prices.
Comparative Analysis of Manufacturers
Our analytic file of 79 drugs included 31 manufactures, only 12 of which manufactured a
single drug represented in the database. Of these 12 companies, the ratio of U.S. list prices
compared to average international list prices varied substantially, though prices were consistently
higher in the U.S. For instance, Pharmacyclics priced its cancer medication Imbruvica 88 percent
higher in the U.S. than the average international list price. 80 Glaxosmithkline priced Advair
Diskus, nearly 1,300 percent higher in the U.S. than the average international price.
Of the 19 companies that manufacture multiple drugs in our sample, most manufacturers
priced their drugs in the U.S. at about 200 to 400 percent of the list prices in other countries. This
range was close to the average ratio of U.S. list prices to average international list prices; several
drugs were significantly higher, however. Gilead Sciences priced Sovaldi, Harvoni, Stribild,
Genvoya, and Letairis between 200 percent and 350 percent the average international price, but
they priced Ranexa at almost 650 percent the average international price. 81 A number of
manufacturers had multiple drugs with extremely large disparities between U.S. and international
prices. To illustrate this point, Figure 4 depicts a breakdown of five select manufacturers and the
drugs with the largest discrepancies between U.S. and international prices.
75
Advair Diskus (2018). GSK or licensor. Retrieved from https://www.advair.com/
76
About Januvia (2019). Merck Sharp & Dohme Corp. Retrieved from https://www.januvia.com
77
Combigan (2018). Allergan. Retrieved from https://www.combigan.com/patient/Default.aspx
78
Hakim, Danny (2018). Humira’s Best-Selling Drug Formula: Start at a High Price. The New York Times.
Retrieved from https://www.nytimes.com/2018/01/06/business/humira-drug-prices.html
79
Id.
80
How does Imbruvica work? (2019). Pharmcyclics LLC. Retrieved from https://www.imbruvica.com/cll/how-does-
imbruvica-work
81
Medicines (2019). Gilead Sciences, Inc. Retrieved from https://www.gilead.com/science-and-medicine/medicines
18Figure 4. Prescription Drug Prices for Select Drugs by Manufacturer, 2018
Biogen-Idec Merck
1800 1697.49 1697.49 $30.00
1600 $23.95
$25.00
1400
1200 $20.00
$15.70
1000
$15.00
800
600 $10.00 $7.16
400 270.95 252.74
$5.00
200 $0.49 $1.40 $0.91
0 $0.00
Avonex Pen Avonex Dulera Januvia Janumet
US Average (excluding US) US Average (excluding US)
Boehringer Ingelheim Janssen
$16.00 $20.00
$13.72 $13.26
$14.00 $15.48
$15.00 $13.95
$12.00
$10.00
$8.00 $10.00
$6.00
$4.00 $5.00 $2.59
$1.57 $1.25 $1.83
$2.00
$0.00 $0.00
Tradjenta Spiriva Respimat Invokana Xarelto
US Average (excluding US) US Average (excluding US)
Novartis
600
518.27
500
400
300 261.9
200
81.92 66.28
100
0
Afinitor Gilenya
US Average (excluding US)
SOURCES and NOTES: Authors’ analysis of price data for 2018, collected from recognized price sources.
19In the Merck & Co. example, Dulera was priced at almost 50 times the average
international price ($23.49 compared to $0.49). Januvia 82 and Janumet 83, both used to treat Type
2 diabetes, are priced in the U.S. at 1,120 percent and 790 percent the average international price,
respectively.
Comparative Analysis of Disease Groups and International Drug Prices
When analyzing by disease groups, arthritis medications, multiple sclerosis medications,
and non-insulin diabetes medication exhibited the largest U.S.-international drug price
differentials in our dataset.
Diabetes Medication
The U.S. spends $327 billion annually on costs associated with diabetes. 84 According to
the Centers for Disease Control and Prevention (CDC), 30.3 million Americans suffered from
diabetes in 2015, while the price of insulin increased by 197 percent from 2002 to 2013. 85 86
Total Medicare Part D spending on insulin increased by 840 percent from $1.4 billion to $13.3
billion between 2007 and 2017, far outpacing the growth in number of beneficiaries using
insulin. 87
Based on our analysis, insulin averaged $34.75 Six of the seven non-insulin
per dose in the U.S., which is 247 percent of the $10.58 medications used to treat Type 2
price in other countries. However, we found significant diabetes were priced 600 to 1,100
variation by drug. For example, Lantus SoloStar in the percent higher in the United States
U.S. was 170 percent of the average in other countries, than abroad.
while the HumaLOG Mix 75-25 KwikPen was priced at
620 percent of the non-U.S. price. The Sanofi-Avertis-manufactured Lantus and Lantus SoloStar
account for more than $4 billion of annual Medicare spending. 88 89 Figure 5 shows price
differentials between the U.S. and the average non-U.S. price for a select set of insulin drugs.
82
Januvia (2019). Merck Sharp & Dohme Corp. Retrieved from https://www.januvia.com/
83
What is Janumet (2019). Merck Sharp & Dohme Corp. Retrieved from
https://www.janumetxr.com/sitagliptin_metformin_HCL/janumetxr/consumer/what-is-janumet/index.xhtml
84
Cefalu, WT, Dawes, DE, Gavlak, G, Goldman, D, Herman, WH, Van Nuys, KV, et al. (2018). Insulin Access and
Affordability Working Group: Conclusions and Recommendations. Diabetes Care. Retrieved from
https://doi.org/10.2337/dci18-0019
85
Id.
86
Squires, E, Duber, H, Campbell, M, Cao, J, Chapin, A, Horst, C, et al. (2018). Health Care Spending on Diabetes
in the U.S., 1996-2013. Diabetes Care 41: 1423-1431.
87
Cubanski, Juliette and Neuman, Tricia (2019). How Much Does Medicare Spend on Insulin. Henry J Kaiser
Family Foundation. Retrieved from https://www.kff.org/medicare/issue-brief/how-much-does-medicare-spend-on-
insulin/
88
Using Lantus (2019). Sanofi-Aventis US LLC. Retrieved from https://www.lantus.com/using-solostar-insulin-pen
89
Medicare Part D Drug Spending Dashboard (2019). Centers for Medicare and Medicaid Services. Retrieved from
https://www.cms.gov/Research-Statistics-Data-and-Systems/Statistics-Trends-and-Reports/Information-on-
Prescription-Drugs/MedicarePartD.html
20Figure 5. Select Insulin Drug Prices, 2018 90
$90.00 $82.74
$80.00
$70.00
$60.00
$50.00
$37.26 $36.55 $35.36 $35.36
$40.00
$26.96 $26.95
$30.00
$20.00 $16.37 $15.00 $15.86
$7.26 $8.69 $7.75 $6.75
$10.00
$0.00
Toujeo Solostar NovoLOG Flexpen NovoLOG HumaLOG HumaLOG Mix Lantus Lantus SoloStar
KwikPen U-100 75-25 KwikPen
US Average (excluding US)
SOURCES and NOTES: Authors’ analysis of price data for 2018, collected from recognized price sources.
Information on the types of insulin were retrieved from Cleveland Clinic “Injectable Insulin Medications” article.
Insulin medications tended to have price differentials close to the average U.S.-
international price differential, but non-insulin diabetes medications had much higher prices
compared to the international average. Non-insulin Type 2 diabetes medications averaged $49.28
per dose in the U.S., 526 percent of the non-U.S.
international average of $12.70. The U.S. price for The seven non-insulin medications
Victoza was 278 percent of the non-U.S. international used to treat Type 2 diabetes were
average, while Onglyza and Tradjenta were priced at priced 178 to 1,020 percent higher
about 900 percent of the non-U.S. international average. in the U.S. compared to the
Januvia was priced at $15.70 in the U.S., compared to international average price.
an international average of $1.40 – a price differential
of 1,020 percent. The seven non-insulin medications used to treat Type 2 diabetes were priced
178 to 1,020 percent higher in the U.S. compared to the international average price. Figure 6
shows the differential between the U.S. price and the average among the other 11 countries for
all seven non-insulin Type 2 diabetes drugs in 2018.
90
Injectable Insulin Medications (2019). Cleveland Clinic. Retrieved from
https://my.clevelandclinic.org/health/drugs/13902-injectable-insulin-medications
21Figure 6. Non-Insulin Medication Used to Treat Type 2 Diabetes Drug Prices, 2018 91
$200.00
$182.55
$180.00
$160.00
$140.00
$120.00
$96.71
$100.00
$80.00
$60.00 $47.84
$40.00 $30.23
$15.70 $15.48 $13.72 $13.61
$20.00 $7.16
$1.40 $1.83 $1.57 $1.50 $0.91
$0.00
Januvia Invokana Tradjenta Onglyza Janumet Victoza Trulicity
US Average (excluding US)
SOURCES and NOTES: Authors’ analysis of price data for 2018, collected from recognized price sources.
Information on the types of insulin were retrieved from Cleveland Clinic “Diabetes: Non-Insulin Injectable
Medications” article.
Arthritis Medication
Humira, an anti-inflammatory drug, is the best-selling prescription drug in the world. 92
Since 2012, it has doubled in price in the U.S., and is currently priced at $2,436.02 per dose, or
about 500 percent of the international average. 93 After the U.S., the next highest price for
Humira is in Denmark where it costs $787.10 per dose, less than one-third of the U.S. price.
Xeljanz, another arthritis medication, is priced much lower than Humira, but is still over 300
percent more expensive in the U.S. compared to the international average. Figure 7 depicts
differences in the price of Humira and Xeljanz in the U.S. relative to the other 11 countries in
this analysis.
91
Injectable Insulin Medications (2019). Cleveland Clinic. Retrieved from
https://my.clevelandclinic.org/health/drugs/13902-injectable-insulin-medications
92
Hakim, Danny (2018). Humira’s Best-Selling Drug Formula: Start at a High Price. The New York Times.
Retrieved from https://www.nytimes.com/2018/01/06/business/humira-drug-prices.html
93
Id.
22Figure 7. Humira and Xeljanz Prices, 2018 94
$3,000.00 $80.00
$68.26
$2,436.02 $70.00
$2,500.00
$60.00
$2,000.00
$50.00
$1,500.00 $40.00
$30.00
$1,000.00 $20.71
$493.64 $20.00
$500.00
$10.00
$0.00 $0.00
Humira Xeljanz
US Average (excluding US) US Average (excluding US)
SOURCES and NOTES: Authors’ analysis of price data for 2018, collected from recognized price sources.
Information on brand name arthritis medication retrieved from the Arthritis Foundation “Drug Guide” database.
Multiple Sclerosis Medication
Patients with Multiple Sclerosis (MS) saw their yearly cost-sharing increase more than
sevenfold over the past decade. 95 The MS drugs in our sample were typically priced in the U.S
from 350 percent to 670 percent of the international average. Avonex and Avonex Pen from
Biogen, Inc. have a U.S. list price of $1,697.49 close to 650 percent of the international average
times the average international price (see Figure 8). 96 The average U.S. list price for MS drugs
was $769.92 per dose, compared to only $133.99 per dose internationally, making these drugs
5.75 times more expensive in the U.S. compared to the average international price.
94
Drug Guide (n.d.). Arthritis Foundation. Retrieved from https://www.arthritis.org/living-with-
arthritis/treatments/medication/drug-guide/
95
Norton, Amy (2019). For Medicare Patients, Costs of MS Drugs Rise Sevefold Over 10 Years. US News.
Retrieved from https://www.usnews.com/news/health-news/articles/2019-08-28/for-medicare-patients-costs-of-ms-
drugs-rise-sevenfold-over-10-years
96
Product Portfolio (2019). Biogen. Retrieved from https://www.biogen.com/en_us/product-portfolio.html
23Figure 8. Select Multiple Sclerosis Prescription Drug Prices, 2018 97
$1,800.00 $1,697.49 $1,697.49
$1,600.00
$1,400.00
$1,200.00
$1,000.00
$800.00
$606.67
$600.00
$400.00 $270.95 $252.74 $261.90 $233.18
$177.05
$200.00 $122.77
$22.61 $66.28 $36.94
$0.00
Avonex Pen Avonex Tecfidera Rebif Gilenya Aubagio
US Average (excluding US)
SOURCES and NOTES: Authors’ analysis of price data for 2018, collected from recognized price sources.
Information on types of Multiple Sclerosis medication provided by National Multiple Sclerosis Society.
Cancer Medication
Most new cancer medications were priced at over $100,000 per patient per year in the
U.S. 98 According to the National Cancer Institute, 90 percent of Americans say cancer drugs are
too expensive. 99 The U.S. list price for the nine cancer medications included in this analysis
ranged from $90.88 to $791.66 per dose with a per-dose average of $342.48. The international
average of these same drugs cost $93.29 per dose – 27 percent of the U.S. price.
Figure 9 highlights four of these drugs. Afinitor, manufactured by Novartis, had the
largest U.S.-international price differential of the nine cancer drugs, with the U.S. price set
almost 700 percent higher than the international average. The other oncology drugs were priced
closer to the average U.S.-international price differential ratio, ranging from 158 percent to 420
percent of the average international price.
97
Medication (n.d.) National Multiple Sclreosis Society. Retrieved from
https://www.nationalmssociety.org/Treating-MS/Medications
98
Urging Affordable Access to High-Value Cancer Drugs (2018). National Cancer Institute at the National Institute
of Health. Retrieved from https://www.cancer.gov/news-events/cancer-currents-blog/2018/affordable-access-to-
cancer-drugs-infographic
99
Id.
24You can also read