MONITORING THE IMPACTS OF BIODIVERSITY PROJECTS UNDER THE INTERNATIONAL CLIMATE INITIATIVE (IKI): BFN
←
→
Page content transcription
If your browser does not render page correctly, please read the page content below
Sarah Brooks, Cordula Epple, Robert Munroe,
    Rebecca Mant, Valerie Kapos, Claire Brown and
                   Elina Väänänen

Monitoring the impacts of biodiversity projects
under the International Climate Initiative (IKI):
  Recognizing and communicating IKI’s contribution
   to the Strategic Plan for Biodiversity 2011-2020

                 BfN-Skripten 387
                       2014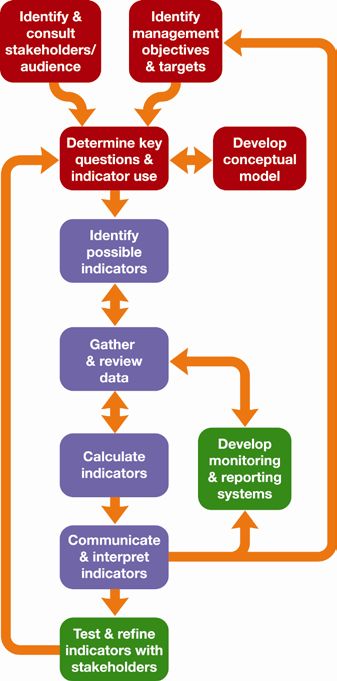
Monitoring the impacts of biodiversity
    projects under the International Climate
                 Initiative (IKI)

    Recognizing and communicating IKI’s contribution
     to the Strategic Plan for Biodiversity 2011-2020

                      Sarah Brooks
                     Cordula Epple
                     Robert Munroe
                      Rebecca Mant
                        Val Kapos
                      Claire Brown
                     Elina Väänänen

2
Cover picture: Surveying mangroves. ©Theodora Panayides.
Authors’ address:
Sarah Brooks UNEP-WCMC
Cordula Epple 219 Huntingdon Road
Robert Munroe Cambridge CB3 0DL
Rebecca Mant Email: Robert.Munroe@unep-wcmc.org
Val Kapos
Claire Brown
Elina Väänänen
Scientific Supervision at BfN:
Gisela Stolpe FG II 5.3, International Academy for Nature Conservation, Isle of Vilm
Dr. Ralf Grunewald FG II 5.3, International Academy for Nature Conservation, Isle of Vilm
This publication is included in the literature database “DNL-online” (www.dnl-online.de).
The BfN-Skripten are not available in book trade but can be downloaded in a pdf version from the internet at:
http://www.bfn.de/0502_skripten.html
Publisher: Bundesamt für Naturschutz (BfN)
Federal Agency for Nature Conservation
Konstantinstrasse 110
53179 Bonn, Germany
URL: http://www.bfn.de
All rights reserved by BfN.
The publisher takes no guarantee for correctness, details and completeness of statements and views in this report as well as
no guarantee for respecting private rights of third parties. Views expressed in this publication are those of the authors and do
not necessarily represent those of the publisher.
This work with all its parts is protected by copyright. Any use beyond the strict limits of the copyright law without the con-sent
of the publisher is inadmissible and punishable.
Reprint, as well as in extracts, only with permission of Federal Agency for Nature Conservation.
ISBN 978-3-89624-122-1
Bonn-Bad Godesberg 2014
3Acknowledgements Special thanks to Gisela Stolpe, Ralf Grunewald (both The German Federal Agency for Nature Conservation – Bundesamt für Naturschutz – BfN) and Rudolf Specht (The German Federal Ministry for the Environment, Nature Conservation, Building and Nuclear Safety (Bundesministerium für Umwelt, Naturschutz, Bau and Reaktorsicherheit – BMUB) for their helpful comments on this study. Thanks also to Nicolas Boenisch (WWF Germany) for his useful comments on the draft study and to the participants of the workshop associated with this study. Citation Brooks, S., Epple, C., Munroe, R., Mant, R., Kapos, V., Brown, C., Väänänen, E. (2014). Monitoring the impacts of biodiversity projects under the International Climate Initiative (IKI): recognising and communicating IKI’s contribution to the Strategic Plan for Biodiversity 2011-2020, UNEP World Conservation Monitoring Centre, Cambridge, UK. The United Nations Environment Programme World Conservation Monitoring Centre (UNEP-WCMC) is the specialist biodiversity assessment centre of the United Nations Environment Programme (UNEP), the world’s foremost intergovernmental environmental organisation. The Centre has been in operation for over 30 years, combining scientific research with practical policy advice. The contents of this report do not necessarily reflect the views or policies of UNEP, contributory organisations or editors. The designations employed and the presentations of material in this report do not imply the expression of any opinion whatsoever on the part of UNEP or contributory organisations, editors or publishers concerning the legal status of any country, territory, city area or its authorities, or concerning the delimitation of its frontiers or boundaries or the designation of its name, frontiers or boundaries. The mention of a commercial entity or product in this publication does not imply endorsement by UNEP. 4
5
Contents

1         Introduction ................................................................................................................................... 8
    1.1       The International Climate Initiative and study aims................................................................... 8
    1.2       The Convention on Biological Diversity and the Strategic Plan for Biodiversity 2011-2020....... 9
    1.3       Monitoring project impact ......................................................................................................... 9
    1.4       Biodiversity indicators ............................................................................................................ 10
2         Methodology for developing impact monitoring options ............................................................... 12
    2.1       Biodiversity Indicator Development Framework ...................................................................... 12
    2.2       Understanding the purpose of indicators – reviewing IKI projects and identifying
              the components of the Aichi Biodiversity Targets ................................................................... 13
    2.3       Defining key questions ........................................................................................................... 15
    2.4       Identifying potential indicators ................................................................................................ 16
    2.5       Contribution to the Strategic Plan for Biodiversity 2011-2020 ................................................. 17
    2.6       Workshop ............................................................................................................................... 17
3         Challenges in developing impact monitoring options ................................................................... 19
    3.1       Scope of projects ................................................................................................................... 19
    3.2       Scope of Aichi Biodiversity Targets ........................................................................................ 20
    3.3       Variation between countries in national monitoring, reporting and indicators .......................... 20
    3.4       Attribution of impacts .............................................................................................................. 20
    3.5       Assessing change in terms of quality as well as quantity........................................................ 21
4         Proposed biodiversity indicators for projects ............................................................................... 22
5         Recommendations for impact monitoring in IKI biodiversity projects ........................................... 74
6         References ................................................................................................................................. 80
7         Annexes ..................................................................................................................................... 82
    7.1       Annex A: List of projects having a primary biodiversity focus and reason to address the
              Strategic Plan for Biodiversity 2011-2020 ............................................................................... 82
    7.2       Annex B: Spreadsheet of potential indicators for each Aichi Biodiversity Target,
              including those currently not considered IKI priorities (see attached file) ................................ 86
    7.3       Annex C: Workshop report (see attached file) ........................................................................ 86

6
Figures Figure 1: The Biodiversity Indicator Development Framework............................................................... 11 Tables Table 1: Projects for which information was available .......................................................................... 13 Table 2: Summary of suggested indicators and data sources .............................................................. 22 Table 3: Suggested Project Indicators for Aichi Biodiversity Target 1................................................... 27 Table 4: Suggested Project Indicators for Aichi Biodiversity Target 2................................................... 32 Table 5: Suggested Project Indicators for Aichi Biodiversity Target 3................................................... 38 Table 6: Suggested Project Indicators for Aichi Biodiversity Target 6................................................... 43 Table 7: Suggested Project Indicators for Aichi Biodiversity Target 11................................................. 49 Table 8: Suggested Project Indicators for Aichi Biodiversity Target 14................................................. 55 Table 9: Suggested Project Indicators for Aichi Biodiversity Target 15................................................. 60 Table 10: Suggested Project Indicators for Aichi Biodiversity Target 17 ............................................... 65 Table 11: Suggested Project Indicators for Aichi Biodiversity Target 20 ............................................... 71 7
1 Introduction

    1.1 The International Climate Initiative and study aims
The International Climate Initiative (IKI) was established in 2008 by the German Federal Ministry for the
Environment, Nature Conservation, Building and Nuclear Safety (BMUB). The initiative finances
projects in developing and transition countries, and emerging economies within four Focal Areas: (I)
mitigating greenhouse gas emissions; (II) adapting to the impacts of climate change; (III) conserving
natural carbon sinks with a focus on Reducing Emissions from Deforestation and Forest Degradation
(REDD+); and (IV) conserving biological diversity (IKI, 2014). The conserving biological diversity
(biodiversity) Focal Area was established after the other areas, in 2011. Whereas Focal Areas I-III have
a primary climate focus, Focal Area IV has a primary biodiversity focus, namely to work towards
implementation of the Convention on Biological Diversity (CBD) Strategic Plan for Biodiversity 2011-
2020 and its Aichi Biodiversity Targets (see section 1.2).

From its launch in 2008 until 2014, BMUB had commissioned more than 411 projects with funding
amounting to approximately 1.45 billion Euros (IKI, 2013b). Additional capital contributions by
implementing agencies, and co-funding from public sources such as the European Union and the
private sector, increases the total financing allocated to IKI projects to 3.45 billion Euros. IKI projects
have been implemented in 97 partner countries across the world. The projects are implemented by a
range of organisations, including state agencies, non-governmental organizations (NGOs), multilateral
organisations, research institutes, foundations and private companies.

There have been several recent and ongoing projects to develop methods for monitoring the impact of
IKI on behalf of BMUB. This work has led to the development of a comprehensive proposal for
monitoring IKI projects from Focal Areas I, II and III 1, as well as a proposed set of biodiversity criteria
and related recommendations for compliance monitoring for IKI projects in Focal Areas II and III that
involve wetlands and forests (MANT et al., 2014). Nevertheless, IKI has yet to develop a concept for
how to monitor and analyse the impacts of projects from Focal Area IV, especially with regard to their
contribution to the goals and objectives of the Convention on Biological Diversity (CBD) Strategic Plan
for Biodiversity 2011-2020 as agreed in 2010.

Therefore, this study aims to support the development of options for monitoring and communicating the
impacts of IKI Focal Area IV projects with relevance to the Strategic Plan for Biodiversity 2011-2020,
drawing on the recent and ongoing work on impact monitoring for IKI projects under Focal Areas I-III.
Additionally, the study aims to provide an overview of the feasibility of using project impact monitoring
to analyse the total impact of the IKI projects on the Strategic Plan for Biodiversity 2011-2020 and for
incorporating this into national reporting.

1
 ‘Further development of a concept for monitoring and reporting of the International Climate Initiative’
commissioned by the Umweltbundesamt (UBA, German Federal Environment Agency) and conducted by
Germanwatch, Wuppertal Institute and Ecofys.

8
1.2 The Convention on Biological Diversity and the Strategic Plan for Biodiversity
2011-2020
The CBD 2 entered into force on 29 December 1993, following growing recognition of the value of
biodiversity to present and future generations and the ever-increasing threats to species and
ecosystems. The Convention has 3 main objectives:
1. The conservation of biological diversity;
2. The sustainable use of the components of biological diversity;
3. The fair and equitable sharing of the benefits arising out of the utilization of genetic resources.
Following the recognised failure to achieve the global 2010 Biodiversity Target, the Strategic Plan for
Biodiversity 2011-2020 3 was adopted at the tenth Conference of the Parties to the CBD, held in Nagoya
in 2010. This plan consists of a shared vision, a mission, and 20 Aichi Biodiversity Targets, organised
under 5 Strategic Goals. Importantly, this plan provides a framework not only for the biodiversity-related
conventions, but for the whole United Nations system.
The main objective for IKI Focal Area IV is to support the implementation of the CBD and, in particular,
the Aichi Biodiversity Targets.
1.3 Monitoring project impact
Monitoring the impact of projects has two important elements: firstly, monitoring whether a project has
the intended impact and meets its primary objectives, and secondly, monitoring whether the project has
additional benefits or negative impacts (often referred to as co-benefits and co-costs). Monitoring a
project in relation to the primary objective is critical in order to assess progress towards the objectives
or goals, for adaptive project management, and to understand the project’s final impact.
For the purposes of this report, impact refers to the project’s impacts related to the Aichi Biodiversity
Targets. It is important to note in this context that several of the Aichi Biodiversity Targets are focussed
on intermediate outcomes (such as raised awareness of biodiversity values or increased availability of
resources for implementing the Strategic Plan), rather than direct impacts of efforts to implement the
CBD on biodiversity conservation.
Monitoring is an important component of adaptive management, as it can help project managers ensure
their interventions do have the intended impact and do not have negative impacts. Monitoring can
support adaptive management by showing if the project is on course to accomplish its intended change,
and whether the assumptions made while developing the theory for how the project will have its
intended consequence (often referred to as the project ‘Theory of Change’ 4) are valid. Being able to
demonstrate a project’s impact to local communities and other stakeholders can also be important for
project engagement.
2
www.cbd.int
3
www.cbd.int/sp/
4
‘A Theory of Change defines all building blocks required to bring about a given long-term goal…[and] describes
the types of interventions that bring about the outcomes depicted in the pathway of a change map’ (CENTRE FOR
THEORY OF CHANGE, 2014).
9The ability to demonstrate and understand project impacts can also be important for donors, such as
BMUB via IKI, to help them ensure that projects are achieving their objectives and using the allocated
funding appropriately. Donors can further use this information in order to monitor and account for fund
expenditure (and in the case of IKI, the expenditure of public finance). Last but not least, collating the
information on whether different projects have their intended impacts can help improve the wider
evidence-base regarding whether various types of interventions are effective or not, which can in turn
support future project development and the effective allocation of funds.
It is important that projects monitor not just whether their primary objectives have been achieved, but
also potential unintended and indirect, positive and negative impacts. Within Focal Area IV, as with
other Focal Areas, there is the potential for achieving additional benefits beyond the primary goal of the
project. It is also possible for projects, including Focal Area IV projects, to have negative impacts,
including on biodiversity. If potential negative impacts have been identified from the outset, efforts
should be made to mitigate these impacts, and the effectiveness of these mitigation efforts should be
monitored. Ideally, monitoring systems should also be able to identify unanticipated impacts that were
not identified during the project development phase (MANT et al., 2014). This study focuses on
monitoring the impacts related to the primary objective of IKI projects in Focal Area IV, conserving
biodiversity and contributing to the Strategic Plan for Biodiversity 2011-2020. For further information on
the issues associated with monitoring for compliance with biodiversity safeguards, and the biodiversity
co-costs and co-benefits of IKI projects, please refer to Mant et al. (2014).
1.4 Biodiversity indicators
A key component of developing impact monitoring is deciding what to monitor and which factors
provide a good indication of the biodiversity impacts that have occurred. These factors should be
identified during project planning and the development of a project Theory of Change, in order to select
appropriate indicators for monitoring the project’s success. Developing indicators as part of the
monitoring process may also advance the understanding of biodiversity issues amongst project
developers by stimulating thinking about cause-and-effect relationships and assessment of the likely
responsiveness of the indicator to change.
As outlined above, the primary objective of IKI Focal Area IV projects is supporting the Strategic Plan
for Biodiversity 2011-2020 and the achievement of the Aichi Biodiversity Targets. A number of potential
indicators for monitoring the achievement of Aichi Biodiversity Targets have already been developed
and this study draws on such work.
The Biodiversity Indicators Partnership (BIP) 5, have identified a number of global biodiversity indicators
which track progress towards the global Aichi Biodiversity Targets. The BIP is a global initiative,
established in 2007 and currently consisting of over 40 Partners working to promote the development
and use of biodiversity indicators. The BIP define an indicator as a measure, based on verifiable data,
which conveys information about more than just itself (BIP, 2011). Currently, there are just three Aichi
Biodiversity Targets for which no global indicator has been identified, while all the remaining Targets
have one or more indicator(s) which help evaluate progress towards their achievement.
5
www.bipindicators.net
10Indicators for the Aichi Biodiversity Targets have also been proposed by the Secretariat of the CBD. In CBD decision X/2, taken at the tenth Conference of the Parties to the CBD, Parties were urged to revise their National Biodiversity Strategies and Action Plans (NBSAPs) in order to bring them into line with the Strategic Plan for Biodiversity 2011-2020 and to develop national targets and indicators to track their progress. An indicative list of indicators was provided for use as a flexible framework. Parties must report on progress in implementing their NBSAPs, and in achieving their national targets, in their National Reports to the CBD which are due every 4 years. Finally, there are additional studies, for example, STEPHENSON AND O’CONNOR (2014) which have produced useful indicators for consideration for conservation monitoring related to the Aichi Biodiversity Targets. 11
2 Methodology for developing impact monitoring options
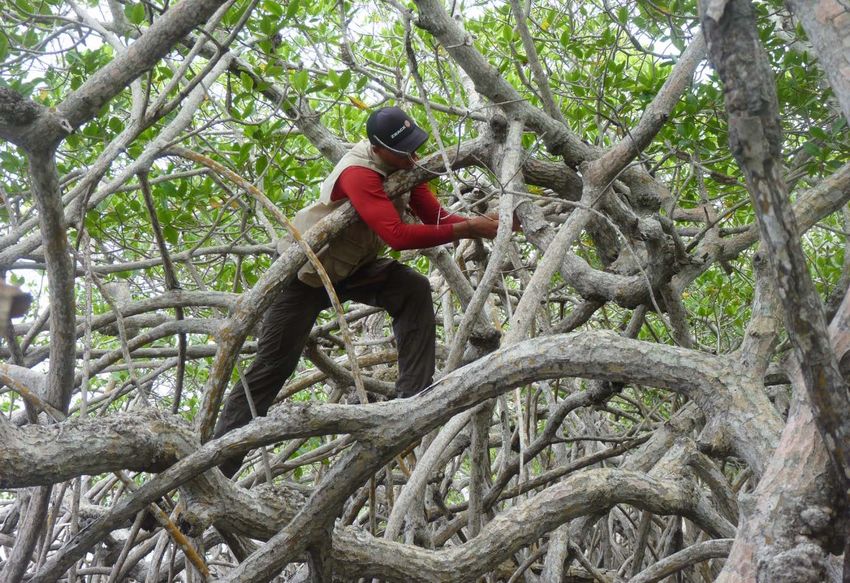
2.1 Biodiversity Indicator Development Framework
The methodology of this study has been informed by the framework developed by the Biodiversity
Indicators Partnership (BIP) to guide the development of successful biodiversity indicators. The
‘Biodiversity Indicator Development Framework’ (see Figure 1) draws on the Partners’ and others’
experience over a number of years and consists of ten steps, separated into three sections. The first
section involves determining the purpose of the indicator(s) (red boxes, Figure 1). The second section
considers the production of the indicator – its selection, calculation and presentation (purple boxes).
The final section relates to refining the indicators and developing the necessary monitoring systems to
ensure their continued use (green boxes). While this framework was primarily developed to help identify
and produce broad-scale indicators of policy and management, the steps are also highly relevant to
developing indicators for other purposes. The framework is intended as a guide and does not
necessarily need to be followed step-by-step or in the order shown; this will depend on the purpose for
which indicators are required and the specific context.
Figure 1: The Biodiversity Indicator Development Framework (BIP, 2011:2)
122.2 Understanding the purpose of indicators – reviewing IKI projects and
identifying the components of the Aichi Biodiversity Targets
Understanding the purpose of indicators is essential so that the indicator fulfils the required use. The
primary purpose of impact monitoring for biodiversity projects of the IKI, is to assess progress towards,
and achievement of, the projects’ objectives. The main focus of IKI Focal Area IV is the achievement of
the Aichi Biodiversity Targets and so there is also an objective of being able to recognize and
communicate its contribution to the Strategic Plan for Biodiversity 2011-2020.
In order to identify the main objectives of IKI Focal Area IV projects, a short review of the projects was
conducted. The list of projects to consider was provided by BMUB on the basis of the projects having a
primary biodiversity focus and reason to address the Strategic Plan for Biodiversity 2011-2020 (see
Annex A). This review was mainly based on those projects for which websites and other online
information was directly available. Project documents (for example, proposal forms and mid-term
reports where applicable) were also available from a number of projects and were reviewed to note
existing efforts to monitor biodiversity impact (see Table 1 for a list of projects for which information was
available).
6
Table 1: Projects for which information was available
Country of Project title
implementation
Indonesia Biodiversity and climate change
Indonesia Developing a resilient and effectively managed network of Marine Protected Areas in the Lesser
Sunda Ecoregion.
Malaysia, Implementation of a trilateral action plan for the Sulu-Sulawesi Marine Ecoregion
Philippines,
Indonesia
Brazil Consolidating the Brazilian National System of Conservation Units – SNUC
Brazil Integration of climate and biodiversity protection in business
India Participatory Management for Sustainable Use and Conservation of Wetland, Coastal and
Marine of Protected Areas
Mexico Protection and sustainable use of coastal and marine biodiversity in the Gulf of California
Philippines Protected Area Management Enhancement in the Philippines
Peru Forest protection and restoration in the Manu Biosphere Reserve
Global Lifeweb – Partnerships for financing biodiversity
Antigua, Barbuda, Climate-Resilient Eastern Caribbean Marine Conservation Corridor (ECMCC)
Dominica,
Grenada,
St. Lucia,
St. Vincent,
The Grenadines
6
For more information on each project, see Annex A.
13Country of Project title
implementation
Brazil Protection of climate and biodiversity in the Mata Atlantica
Brazil Monitoring climate-relevant biodiversity in protected areas
Brazil, ValuES: Methods for mainstreaming of biodiversity in international cooperation
India,
Mexico,
Vietnam
Fiji, Marine and coastal biodiversity management in Pacific island states and atolls
Kiribati,
Solomon, Islands,
Tonga,
Tuvalu,
Vanuatu
Mexico Valuation of Mexico's Protected Areas Climate and Ecosystem Services: a Tool for Innovative
Climate Change and Biodiversity Financing
Peru Conservation and sustainable use of biodiversity through Co-Management in the Amazon region
Global Blue Solutions - Implementation of the Strategic Plan of the CBD in marine and coastal
conservation
Colombia Strengthening the system of protect areas for the protection of climate and biodiversity
Global Biofin – Building Transformative Policy and Financing Frameworks to Increase Investment in
Biodiversity Management
Brazil, Building resilience of the Amazon Biome: Protected Areas as an integrated part of climate
Ecuador, change adaptation
Colombia,
Peru
Ethiopia Biodiversity and climate change: Community-based concepts for the conservation, management
and development of areas of origin of wild coffee
Indonesia, Scaling up innovative, community-based protection of coastal biodiversity in Indonesia,
Federated, States of Philippines, and Pacific
Micronesia,
Philippines
Global Support to indigenous peoples’ and community conserved areas and territories (ICCAs) through
the GEF Small Grants Programme (SGP) as a contribution to the achievement of Targets 11, 14
and 18 of the CBD Aichi 2020 framework
Global Global Nature
Benin Transboundary biosphere reserve Adjame-Mono
Togo
Namibia Resource mobilization for the implementation of the updated biodiversity strategy in Namibia
Philippines Forest and climate protection in Panay
There are 20 Aichi Biodiversity Targets and many of these Targets have multiple components.
Therefore, in developing indicators for monitoring project contribution to the Aichi Biodiversity Targets it
can be useful to look at these different components in more detail. The review mapped each project to
14the ‘components’ of each of the 20 Aichi Biodiversity Targets. These components were identified using
the ‘Aichi Biodiversity Target Quick Guides’ 7, which were prepared by the Secretariat of the CBD and
explain key terms, highlight implications for national target setting, and identify possible indicators to
monitor progress.
For example, Aichi Biodiversity Target 11 states that:
By 2020, at least 17 per cent of terrestrial and inland water, and 10 per cent of coastal and marine
areas, especially areas of particular importance for biodiversity and ecosystem services, are conserved
through effectively and equitably managed, ecologically representative and well connected systems of
protected areas and other effective area-based conservation measures, and integrated into the wider
landscapes and seascapes.
This Target can be broken down into five components, namely that protected areas should:
1. Increase in extent;
2. Include areas of particular importance for biodiversity and ecosystem services;
3. Be ecologically representative;
4. Be effectively and equitably managed;
5. Be well-connected.
A project addressing component 1 would require a different indicator to a project addressing
component 2, 3, 4 or 5.
For a small number of Aichi Biodiversity Targets, the components of the Target identified by the CBD
were found to be very hard to distinguish between at the project level (for example, respecting
traditional knowledge and integrating and reflecting traditional knowledge in the implementation of the
CBD). In these cases, the similar components were considered together for indicator development. For
some Targets, the individual components identified still contained a number of very different elements
and were therefore split into simpler components addressing just one main subject.
The review also identified the primary ecosystem type(s) where relevant and classified the project type
as policy development, programme design, or site-based implementation, in anticipation that this may
affect suitable indicators for different projects.
2.3 Defining key questions
Identifying the key questions in relation to what we want to know about each of the Targets can also
help develop clear and simple indicators which respond to the user’s needs (BIP, 2011). Therefore, key
questions were identified for each of the components of the Aichi Biodiversity Targets. These key
questions fell into two categories – firstly, the key questions that the indicators would actually respond
to, for example, for Aichi Biodiversity Target 14: ‘are ecosystems providing essential services restored
or undergoing restoration?’, secondly, the questions that would be important to answer for each project
(and therefore link to project objective identification) in order to specify what the generic proposed
7
https://www.cbd.int/nbsap/training/quick-guides/
15indicators mean at the project level (henceforth ‘project specific questions’), for example, again for
Target 14, ‘which ecosystem services will be assessed?’. In some cases, it may only be possible to
answer project specific questions as part of the project, in which case questions should be defined, and
a clear commitment should be made to identify the answers as a first step in project implementation.
For example, Aichi Biodiversity Target 15 states that: By 2020, ecosystem resilience and the
contribution of biodiversity to carbon stocks has been enhanced, through conservation and restoration,
including restoration of at least 15 per cent of degraded ecosystems, thereby contributing to climate
change mitigation and adaptation and to combating desertification.
The first component of this Target is the restoration of at least 15 per cent of degraded ecosystems. It is
necessary to identify the key question that the indicators would actually respond to: ‘What extent of the
identified degraded ecosystem(s) has been restored?’. To refine the indicator, addressing the other
category of key question (project-specific question) is necessary as, for example, which ecosystems
are degraded as this will be specific to the project area. Therefore the project-specific question would
be: ‘Which ecosystems are degraded?’.
Although these key questions have been used to identify indicators in this instance, they could be used
to support the development of a project’s Theory of Change and therefore the development of project
objectives (for example, restoring a certain amount of a certain degraded ecosystem).
2.4 Identifying potential indicators
The IKI biodiversity criteria project (MANT et al., 2014) identified a number of core principles of
successful indicators, and these were considered when developing the list of indicators:
Strong relationship between the indicator and the impact on biodiversity. Use of the indicator is
supported by the scientific understanding of the impact of planned activities on biodiversity and
knowledge of the local context, the data to be used is reliable and verifiable (i.e. it has strong scientific
validity). The indicator will respond to a change in the impact on biodiversity of the project within the
timeframe required, for example, within the duration of project evaluation (i.e. it has high
responsiveness). There are no other factors related to the impact on biodiversity that could be causing
the indicator to change (i.e. it has few confounding factors), or changes due to other factors can be
isolated. The indicator is indicative of wider changes in biodiversity not just a small aspect (i.e. it
provides information on the whole or a large part of the impact).
Data is available: Data can be collected which is reliable and not too expensive or time-consuming to
collect or process. The data can be collected at the relevant stages in the project cycle. It can be
beneficial if data can continue to be collected after a project has finished.
Indicator is relevant to users’ needs: The indicator is conceptually understandable and can be used for
the required needs.
Potential indicators for monitoring IKI project success have been identified for each component of each
Aichi Biodiversity Target. The identification of indicators was based on the key questions identified for
each Target (see section 2.3), the characteristics of good indicators (above), and by taking into
consideration any relevant global indicators brought together by the BIP and relevant national indicators
16suggested by the CBD. The potential indicators were then reviewed against current projects identified
as contributing. The available information for the project was consulted in order to determine whether
the suggested indicators related directly to, and were appropriate for, the project activities or objectives
associated with the Aichi Biodiversity Target component. For those projects for which monitoring
information was available, the indicators used for these projects were also compared with the
suggested indicators and, where appropriate, used to refine the suggested indicators.
If for a given component no relevant global indicators had been developed by the BIP, and no relevant
or appropriate national indicators were suggested in the Aichi Biodiversity Target Quick Guides, then a
rapid internet search was conducted for monitoring methods and indicators that are commonly used for
assessing the subject addressed in the component.
Where multiple indicators were identified for one component, feedback from the consultation workshop
on this work (see section 2.6), as well as further consideration of the feasibility of monitoring and the
applicability to aggregation of standard indicators for each Aichi Biodiversity Target, was used to
identify indicators that could be part of a standard set. These are shown in bold in Table 2, as well as in
the tables (Tables 3-11) of suggested project indicators under each Target, with further information
provided under the headings ‘Feasibility of having standard indicators across IKI projects’ and ‘Potential
for aggregating the contribution of all IKI Focal Area IV projects to the Strategic Plan for Biodiversity
2011-2020’ for each Target.
Only Aichi Biodiversity Targets identified as priorities for IKI by BMUB have been included in detail in
this document. However, indicators have been identified where feasible and appropriate for all
components of all twenty Targets in Annex B.
2.5 Contribution to the Strategic Plan for Biodiversity 2011-2020
For each of the indicators identified above, and taking into account the range of projects for which
details were available, the potential for assessing overall cumulative contribution to the Strategic Plan
for Biodiversity 2011-2020 was evaluated and recommendations made where feasible. The different
indicators for individual components were assessed and any commonalities were identified (for
example, two indicators in which impact would be measured as a measure of area). Suggestions were
made as to whether aggregating these figures would result in a useful and meaningful figure.
2.6 Workshop
In order to refine the list of proposed indicators and the assessment of the feasibility of using project
monitoring to recognize and communicate IKI’s contribution to the Strategic Plan for Biodiversity 2011-
2020, a workshop was held on Vilm from 19th-22nd June 2014. The workshop solicited the opinions of
experts and project managers on a draft of the present study through discussions on the following
questions:
(i) is the methodology for developing the suggested indicators sound?
(ii) do the suggested indicators meet the principles of effective indicators?
(iii) are the suggested indicators practical for IKI projects?
(iv) can the information gathered for the suggested indicators be used to analyse the total impact of
the IKI projects on the Strategic Plan for Biodiversity 2011-2020?
17(v) can the information gathered for the suggested indicators contribute to national reporting? Recommendations on the options for impact monitoring within IKI Focal Area IV projects were also made with regard to procedural issues, i.e., whether projects should be requested to use a certain set of standard indicators, or whether they should be given more flexibility. The results of the workshop (the comments and observations made by participants) fed into the analysis of challenges in developing a system of impact monitoring, the list of suggested indicators, and the final recommendations presented in the following sections of this study. The full workshop report is included in Annex C. 18
3 Challenges in developing impact monitoring options

A number of challenges arose in the process of developing options for measuring the cumulative
impact of IKI’s contribution to the achievement of the Strategic Plan for Biodiversity 2011-2020.
Through reviewing IKI projects (see section 2.2), identifying components of the Aichi Biodiversity
Targets (see section 2.2), developing potential standard indicators (see section 2.3 and 2.4), and
workshop discussions (see section 2.6), the following challenges were identified: the way in which
projects contribute to the Target(s) will vary (section 3.1 below); the breadth of scope of individual
Targets is large (section 3.2); assessing the potential for project indicators, or the data underpinning
them, to feed into national-level indicators, is very much dependent on national context (section 3.3);
attribution of impacts is difficult when IKI projects are likely to contribute to the achievement of
biodiversity-related goals together with a wide range of other relevant actors (section 3.4); and progress
towards biodiversity-related goals is often difficult to capture quantitatively (section 3.5).

     3.1 Scope of projects
The breadth of project scopes under IKI Focal Area IV is a primary challenge to the development of
standard indicators for measuring the cumulative impact of IKI’s contribution to the achievement of the
Strategic Plan for Biodiversity 2011-2020. In addition to the range of Aichi Biodiversity Targets that
projects can contribute to (as considered below, see section 3.1), the way in which projects contribute
to the Target(s) will vary. For example, for projects contributing to Aichi Biodiversity Target 11
(increasing the area conserved through effective and equitably managed, ecologically representative
and well-connected systems of protected areas) the means of measuring this contribution will depend
on whether the project is focusing on expanding the protected area network, or whether it aims to
increase the effective management of the protected area network.

In addition, the breadth of project scopes means that projects work at a variety of levels. While some
projects pertain to ‘on the ground’ project implementation, for example using the same Target as above,
improving the management of a specific protected area, others aim to improve protected area
effectiveness by working at the policy level. Other projects also aim to implement a funding mechanism.
These different levels of projects present a challenge to monitoring impact in a consistent and coherent
way, as well as to aggregating monitoring results in a meaningful way across projects.

Moreover, the scale of the projects in terms of funding varies, meaning more or less resources can be
dedicated to monitoring (assuming that a certain percentage of project resources will be used for
monitoring).

Finally, the different timeframes of projects (for example, typically 3-5 years), and the varying
timescales of the intended impact, pose a challenge to determining monitoring requirements. For
example, a habitat restoration project could take decades to achieve its intended results, while a project
aiming to raise awareness of biodiversity could be able to identify impact immediately after a
communication and outreach event or process.

19
3.2 Scope of Aichi Biodiversity Targets
The Aichi Biodiversity Targets themselves are also extremely broad in scope. For example, Target 5
aims to reduce the loss of natural habitats, including forest, and also reduce degradation and
fragmentation. Firstly, this Target addresses three separate concepts – habitat loss, degradation and
fragmentation, all of which can require a different metric. This breadth of scope is not an issue in itself,
but poses a potential problem for finding a single indicator that assesses progress towards each Aichi
Biodiversity Target. For this reason, in this study, each Target was broken down into its constituent
components (see section 2.2).
The scope of the Aichi Biodiversity Targets also affects the feasibility of assessing the contribution to
the Strategic Plan for Biodiversity 2011-2020. Aggregating projects’ contribution to two different
components of the same Target may not be straightforward – each could require a very different metric
to measure impact.
The different subjects addressed by the Aichi Biodiversity Targets also have very different relevant
timescales, and in a manner similar to that mentioned in section 3.1 this poses a challenge for
determining monitoring requirements. For example, activities contributing to Target 1 (relating to public
awareness of biodiversity) may have immediate impact among local populations. However, projects
contributing to Target 15 by aiming to restore ecosystems, may take decades to achieve their full
objectives and impact. Another issue posed by the subjects tackled by the different Aichi Biodiversity
Targets is that certain subjects are more conducive to process indicators rather than impact indicators.
This is particularly true of the Targets under Strategic Goal A, dealing with addressing the underlying
causes of biodiversity loss, and those under Strategic Goal E, aiming to enhance implementation.
3.3 Variation between countries in national monitoring, reporting and indicators
With regards to assessing the potential for project indicators, or the data underpinning them, to feed
into national-level indicators, this is very much dependent on national context and will vary between
projects. While Parties to the CBD are encouraged to make use of the Indicative List of Indicators
adopted at the eleventh Conference of the Parties to the CBD, this is merely a flexible framework and is
not prescriptive as to the indicators that each Party should use. Moreover, national targets are set
primarily in accordance with national context and priorities, which will vary greatly from one country to
another.
3.4 Attribution of impacts
Under most circumstances, IKI projects will contribute to the achievement of biodiversity-related goals
together with a wide range of other relevant actors such as government institutions, civil society
organizations, private stakeholders and/or the implementers of projects funded by other donors.
Generally, it becomes harder to ascribe observed change to the activities of a specific project or donor
when considering large areas of interest and change, and the further along one moves on the impact
chain towards actual changes in land management and the status of biodiversity. As with all impact
monitoring, there may also be external confounding factors (such as general economic trends or
extreme climate events) that affect the indicator values. If all changes in indicator values are interpreted
as showing a project impact, this might lead to wrong assumptions. There is also a risk of double
counting if several actors report on the same figures (for example, in communications to the CBD
20Secretariat). Finding a way to address and communicate on the attribution of impacts is therefore very
important to the development of a sound monitoring system with the aim of helping donors ensure that
projects are achieving their objectives and using the allocated funding appropriately.
3.5 Assessing change in terms of quality as well as quantity
Quantitative indicators often have the advantage of being easy to standardize, present and
communicate. Using some kind of quantitative measures is also a condition for aggregating monitoring
results across different projects. However, it is often difficult to capture the amount of progress towards
biodiversity-related goals that an intervention has achieved merely by presenting quantitative figures.
For example, a small but well-planned and strategically located expansion of a protected area may
provide higher biodiversity benefits than a larger expansion in a less suitable location. There may thus
be a risk of misinterpretation if quantitative indicator values are not appropriately analysed, put into
context and communicated.
214 Proposed biodiversity indicators for projects
This section draws on the information given in the Aichi Biodiversity Target Quick Guides and the BIP global indicators in order to
identify potential project-level indicators for each of the IKI priority Aichi Biodiversity Targets. It also assesses the feasibility of having
standard indicators across projects. Finally, it assesses the potential for using project-level indicators and data to assess the overall
contribution of IKI Focal Area IV projects to the Strategic Plan for Biodiversity 2011-2020, and within project country national
reporting to the CBD.
Table 2 is a summary table of suggested indicators and data sources (suggested standard indicators for each Target in bold).
Table 2: Summary of suggested indicators and data sources
Aichi Biodiversity Target: Indicators:
Target 1: By 2020, at the latest, people are aware of the values of Number/Percentage of people in project area/directly impacted by the project
biodiversity and the steps they can take to conserve and use it sustainably. aware of the values of biodiversity
Number/Percentage of people in project area/directly impacted by the
project aware of steps they can take to conserve biodiversity and use it
sustainably
Number/Percentage of people in project area/directly impacted by the
project changing behaviour (subcategories for degree of change, e.g.
major shift in land-use/ecosystem management and/or livelihood
strategies, changes in consumption patterns) to conserve biodiversity and
use it sustainably
Target 2: By 2020, at the latest, biodiversity values have been integrated into Trends in number of national development strategies incorporating
national and local development and poverty reduction strategies and (subcategories for incorporating , e.g. support provided, integration into
planning processes and are being incorporated into national accounting, as sectoral policies/budgets) biodiversity and ecosystem service values that
appropriate, and reporting systems. have been supported by the project *
Trends in number of local development strategies incorporating
biodiversity and ecosystem service values that have been supported by
the project
Trends in number of national poverty reduction strategies incorporating
biodiversity and ecosystem service values that have been supported by
the project *
Trends in number of local poverty reduction strategies incorporating
biodiversity and ecosystem service values that have been supported by
the project
Trends in number of national planning processes (e.g. sectoral strategies
and/or spatial planning processes) incorporating biodiversity and
ecosystem service values that have been supported by the project *
Target 2: By 2020 at the latest biodiversity values have been integrated into Trends in number of local planning processes (e.g. sectoral strategies
22national and local development and poverty reduction strategies and and/or spatial planning processes) incorporating biodiversity and
planning processes and are being incorporated into national accounting, as ecosystem service values that have been supported by the project
appropriate, and reporting systems. Trends in number of national accounting systems incorporating
biodiversity and ecosystem service values and using project information *
Trends in number of national reporting systems incorporating biodiversity
and ecosystem service values that have been supported by the project *
Trends in number of assessments of biodiversity values in the project area as a
consequence of project activities
Target 3: By 2020, at the latest, incentives, including subsidies, harmful to Number/Percentage of identified incentives harmful to biodiversity
biodiversity are eliminated, phased out or reformed in order to minimize or eliminated/in the process of being eliminated/reformed in the project area
avoid negative impacts, and positive incentives for the conservation and as a consequence of project activities
sustainable use of biodiversity are developed and applied, consistent and in Monetary total of harmful incentives to biodiversity eliminated/in the process of
harmony with the Convention and other relevant international obligations, being eliminated/reformed in the project area as a consequence of project
taking into account national socio economic conditions. activities
Number of people whose well-being benefits from positive incentives
(disaggregated by scheme) for the conservation and sustainable use of
biodiversity in the project area as a consequence of project activities
Area covered by PES schemes and other area-based incentive schemes
(disaggregated by scheme) supported by the project in the project area
Number of people enrolled in stewardship schemes
Target 6: By 2020 all fish and invertebrate stocks and aquatic plants are Percentage of fisheries in project area certified by MSC as a consequence of
managed and harvested sustainably, legally and applying ecosystem based project activities
approaches, so that overfishing is avoided, recovery plans and measures Annual production of MSC certified fisheries (certified as a consequence of
are in place for all depleted species, fisheries have no significant adverse project activities) in tonnes in the project area
impacts on threatened species and vulnerable ecosystems and the impacts Proportion of fish stocks within safe biological/ecological limits in the project area
of fisheries on stocks, species and ecosystems are within safe ecological Proportion and number of depleted target and bycatch species with
limits. recovery plans and measures in place in the project area as a
consequence of project activities
Trends in area, frequency, and/or intensity of destructive fishing practices
in the project area as a consequence of project activities
Population trends in target and bycatch aquatic species in the project area
Trends in catch per unit effort in the project area for given fishing
techniques
Marine Trophic Index in the project area
Target 11: By 2020, at least 17 per cent of terrestrial and inland water areas Extent of terrestrial/marine protected area coverage achieved with support
and 10 per cent of coastal and marine areas, especially areas of particular from the project
importance for biodiversity and ecosystem services, are conserved through Percentage of areas identified as important for biodiversity/ecosystem services
effectively and equitably managed, ecologically representative and well- under protection as a consequence of the project
connected systems of protected areas and other effective area-based Improvements in ecological representativeness of protected areas
conservation measures, and integrated into the wider landscape and achieved with support from the project as assessed by hectares of
seascape. nationally underrepresented ecosystems newly protected
Changes in protected areas management effectiveness achieved with
support from the project
Target 11: By 2020, at least 17 per cent of terrestrial and inland water areas Trends in the connectivity of protected areas (as measured by degree of
and 10 per cent of coastal and marine areas, especially areas of particular habitat fragmentation in surrounding area, e.g. hectares of habitat in areas
23importance for biodiversity and ecosystem services, are conserved through of important for connectivity in improved condition due to project
effectively and equitably managed, ecologically representative and well- activities; possibility of movement between protected areas and habitat
connected systems of protected areas and other effective area-based fragments outside of species; isolation of protected areas from areas of
conservation measures, and integrated into the wider landscape and similar habitat) as a consequence of project activities
seascape.
Target 14: By 2020, ecosystems that provide essential services, including Area of different ecosystem types undergoing restoration/having been
services related to water, and contribute to health, livelihoods and well- restored and/or safeguarded as a consequence of project activities
being, are restored and safeguarded, taking into account the needs of Number of people benefiting from services (subcategorised by type, e.g.
women, indigenous and local communities, and the poor and vulnerable. provisioning, regulatory, cultural) provided by safeguarded/restored
(subcategories for degree of restoration: e.g. partial, full restoration)
ecosystems as a consequence of project activities
Trends in income/well-being of people whose livelihoods depend directly on
ecosystems within project area as a consequence of project activities
Trends in stock of identified ecosystem services within and outside project area
(e.g. products that can be harvested at sustainable levels, levels of carbon
storage and sequestration) as a consequence of project activities
Value of services provided by safeguarded/restored ecosystems supported by
project (disaggregated by beneficiaries, subcategories would be required for
beneficiaries: e.g. local farmers, or agricultural sector)
Target 15: By 2020, ecosystem resilience and the contribution of biodiversity Status and trends in extent and condition of ecosystems that provide high
to carbon stocks have been enhanced, through conservation and restoration, carbon storage as a consequence of project activities
including restoration of at least 15 per cent of degraded ecosystems, thereby Trends in carbon stored as a consequence of project activities
contributing to climate change mitigation and adaptation and to combating Trends in proportion and area of degraded habitats as a consequence of
desertification. project activities
Trends in proportion and area of degraded ecosystems (that provide
services important for climate change adaptation e.g. hydrological
regulation) restored or under restoration as a consequence of project
activities
Trends in proportion of land affected by desertification as a consequence of
project activities
Trends in adaptive capacity to climate change impacts (subcategories of
adaptive capacity include: area of ecosystem providing essential services
for adaptation made more resilient to degradation; area covered by
improved governance system that allows adaptive management of natural
resources)
Target 17: By 2015 each Party has developed, adopted as a policy Status of NBSAPs (in project countries) that have been supported by the
instrument, and has commenced implementing an effective, participatory project
and updated national biodiversity strategy and action plan. Quality of NBSAPs as confirmed by peer-review (when available)
Participation in NBSAP revision as a consequence of project activities
Alignment of NBSAP with Strategic Plan for Biodiversity 2011-2020
(including national targets and indicators) as a consequence of project
activities
Target 17: By 2015 each Party has developed, adopted as a policy Progress in implementation of NBSAP as a consequence of project activities
instrument, and has commenced implementing an effective, participatory Budget allocation for NBSAP implementation
24and updated national biodiversity strategy and action plan. Target 20: By 2020, at the latest, the mobilization of financial resources for Number of resource mobilization strategies developed as a consequence of effectively implementing the Strategic Plan for Biodiversity 2011-2020 from project activities all sources and in accordance with the consolidated and agreed process in Amount of sustainable financing secured at the national and/or local level the Strategy for Resource Mobilization should increase substantially from the current levels. This target will be subject to changes contingent to resources needs assessments to be developed and reported by Parties. 25
Aichi Biodiversity Target 1: By 2020, at the latest, people are aware of the values of biodiversity and the steps
               they can take to conserve and use it sustainably.

Components:
     •   People are aware of the values of biodiversity
     •   People are aware of the actions they can take to conserve and sustainably use biodiversity

Project-specific questions:
     •   What are the values of biodiversity to the project stakeholders?
     •   What are the steps people can take to conserve biodiversity and use it sustainably?
     •   How has the project defined awareness?
     •   Who is impacted by the project?

Key questions:
     •   How many people are aware of the values of biodiversity?
     •   How many people are aware of the steps that they can take to conserve biodiversity and use it sustainably?

Global Indicators:
     •   Biodiversity Barometer.

This is a survey carried out in 11 countries asking questions around respondents’ awareness and understanding of the term
biodiversity among other subjects. National-level projects may be able to contribute to this indicator by using the same sampling
methodology and asking the same short set of biodiversity-related questions. However, for projects at the sub-national scale, this
would not be possible. Therefore, while the global indicator is useful as a guide, it is not necessary to fully emulate this for project
level surveys, which can be better designed to respond specifically to the two components of Aichi Biodiversity Target 1.

Possible National Indicators suggested by CBD (in the Aichi Biodiversity Target Quick Guides):
     •   Trends in awareness and attitudes to biodiversity
     •   Trends in public engagement with biodiversity
     •   Trends in communication programmes and actions promoting social corporate responsibility

26
You can also read