Playing with Fire
How Climate Change and Development Patterns Are
Contributing to the Soaring Costs of Western Wildfires
←
→
Page content transcription
If your browser does not render page correctly, please read the page content below
Playing with Fire How Climate Change and Development Patterns Are Contributing to the Soaring Costs of Western Wildfires
Playing with Fire
How Climate Change and Development Patterns Are
Contributing to the Soaring Costs of Western Wildfires

Rachel Cleetus
Kranti Mulik

July 2014
© 2014 Union of Concerned Scientists
     All rights reserved

     Rachel Cleetus is a senior climate
     economist with the UCS Climate and
     Energy Program. She works on global
     warming and clean energy policies, as well
     as analyzing the costs of climate impacts.

     Kranti Mulik is a senior economist in
     the Food and Environment Program
     specializing in land use and climate change
     as well as global agricultural markets.

     The Union of Concerned Scientists puts
     rigorous, independent science to work to
     solve our planet’s most pressing problems.
     Joining with citizens across the country,
     we combine technical analysis and
     effective advocacy to create innovative,
     practical solutions for a healthy, safe, and
     sustainable future.

     More information about UCS is available
     on the UCS website (www.ucsusa.org).

     A fully cited version of this report is
     available online (in PDF format) at
     www.ucsusa.org/playingwithfire.

     Cover photo: © U.S. Air Force/Master Sgt.
     Jeremy Lock
     Waldo Canyon fire, June 2012, Colorado Springs, CO.

     Printed on recycled paper

ii      union of concerned scientists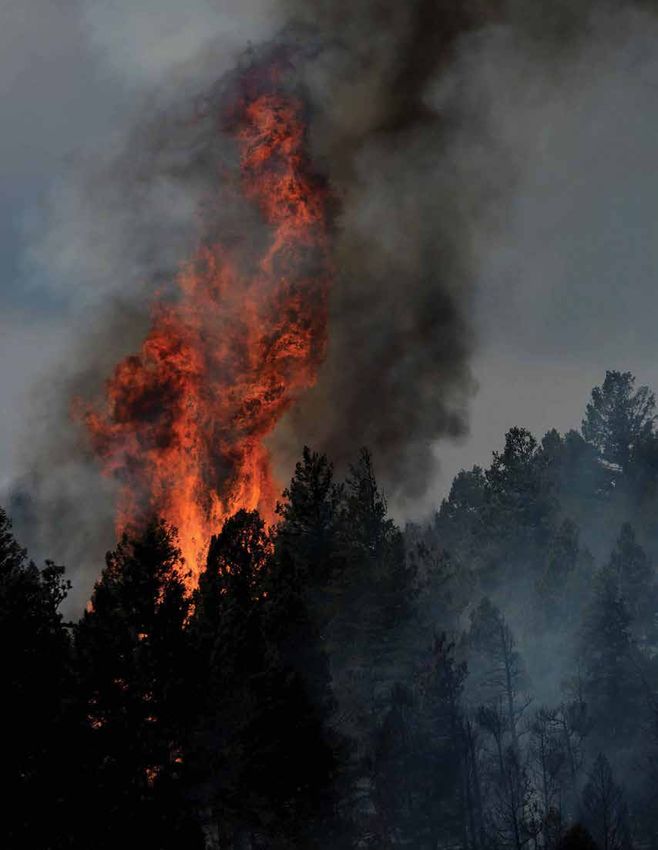
[ contents ]

 v    Figures, Tables, Boxes, and Case Studies
vi    About the Project Team
vii   Acknowledgments

 1    Executive Summary

 3    Introduction

      Section 1
 4    Climate Change and Growing Wildfire Risks
 4    1.1 Drier, Hotter Conditions Contribute to More Severe Wildfires
 6    1.2 Warmer Temperatures Contribute to Beetle Infestations
 6    1.3 Future Trends: Hotter and Drier Yet
 7    1.4 Carbon Emissions from Forest Fires Increase

      Section 2
11    A Combustible Mix: Homes near Wildfire-Prone Forests Raise Risks
11    2.1 Development Is Growing in Wildfire-Prone Forested Areas
14    2.2 Mapping Wildfire Risks to People and Homes

      Section 3
18    Managing and Mismanaging Wildfire Risks
19    3.1 Federal and State Responsibility for Fire Management
20    3.2 Homeowners’ Responsibility for Fire Management
22    3.3 The Role of Private Insurers
24    3.4 Drawbacks in Current Fire Management Practices

      Section 4
27    Growing Costs of Wildfires: How Much and Who Pays?
27    4.1 Who Bears the Risks and Costs?
27    4.2 Federal Fire Management Costs

                                                                         Playing with Fire   iii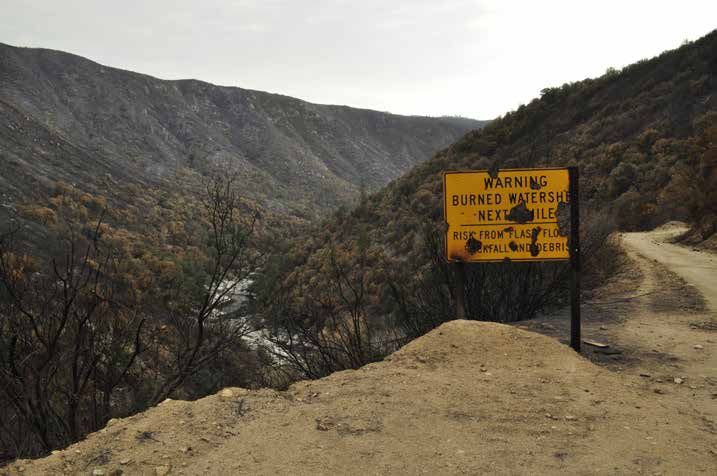
29    4.3 Insured Losses
                30    4.4 The Significant Hidden Costs of Wildfires

                      Section 5
                37    What We Can Do: Policies and Practices to Help Reduce Wildfire Risks
                      and Costs
                37    5.1 Building Resilience to Wildfire Risks
                37    5.2 Reducing Exposure to Wildfire Risks
                39    5.3 Limiting Future Wildfire Risks

                41    Endnotes
                45    References

iv   union of concerned scientists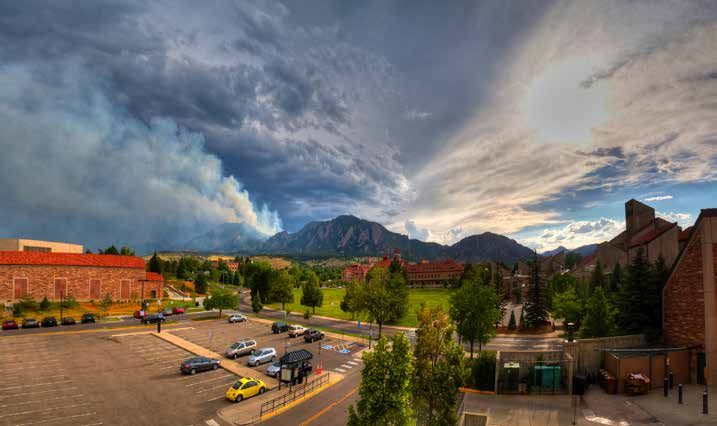
[ figures, Tables, Boxes, and Case Studies ]

     Figures
 6   Figure 1. Midcentury Increase in Area Burned by Wildfires in the Western United States
 9   Figure 2. Recent Large Wildfires in California, 1999–2013
13   Figure 3. Homes at Risk from Wildfires in the Western United States
14   Figure 4. Southern California’s High Wildfire Risk
17   Figure 5. Recent Large Wildfires in Colorado, 2000–2013
18   Figure 6. Factors That Influence Disaster Risk
19   Figure 7. Federal Fire Suppression Costs and State Fire Management Costs
22   Figure 8. Denver/Central Colorado Wildland-Urban Interface
26   Figure 9. Recent Large Wildfires in Montana, 1999–2013
28   Figure 10. Funding for Wildfire Protection on Federal Lands, 1999–2011
31   Figure 11. Fire Suppression Costs as Percent of Total Cost for Select Wildfires
35   Figure 12. Recent Large Wildfires in New Mexico, 2009–2012
36   Figure 13. New Mexico’s Wildland-Urban Interface

     Tables
11   Table 1. Development in the Wildland-Urban Interface
16   Table 2. Insured Losses from Recent Colorado Wildfires
29   Table 3. The Ten Costliest Wildfires in the United States

     Boxes
13   Box 1. Managing Wildfire Risks in the Wildland-Urban Interface
23   Box 2. Firefighters on the Front Lines
39   Box 3. The Policy Landscape

     Case Studies
 8   California: Extended Drought Elevates Wildfire Risks in Densely Populated Areas
15   Colorado: Homes and People at Risk in the Front Range
25   Montana: The Big Sky State Faces Growing Wildfire Risks
34   New Mexico: Cultural Assets and Watersheds at Risk from Wildfires

                                                                                        Playing with Fire   v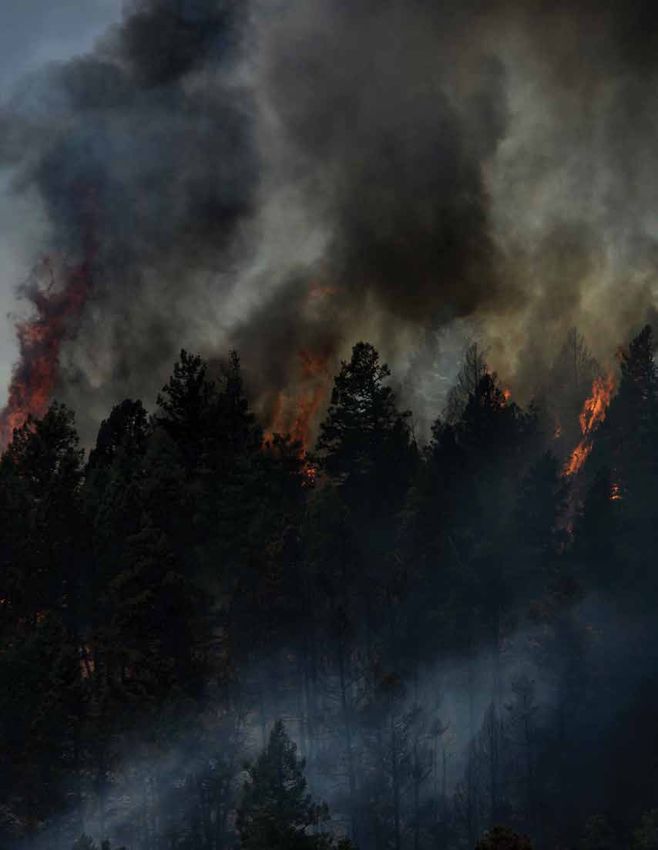
[ about the project team ]

                      authors
                      Rachel Cleetus
                      Kranti Mulik

                      ucs team
                      Project Manager: Rachel Cleetus
                      Leadership: Angela Anderson, Nancy Cole, Adam Markham
                      Climate Science: Jason Funk, Brenda Ekwurzel
                      Review: Adrienne Alvord, Angela Anderson, Carina Barnett-Loro, Nancy Cole,
                         Rob Cowin, Brenda Ekwurzel, Jason Funk, Adam Markham, Lisa Nurnberger,
                         Todd Sanford, Erika Spanger-Siegfried, David Wright
                      Editing: Trudy E. Bell
                      Production: Heather Tuttle, Bryan Wadsworth
                      GIS Map Generation: Chris Watson
                      Design: Tyler Kemp-Benedict
                      Graphics and Data Support: Rachel Kriegsman

                      external reviewers
                      (All affiliations are for informational purposes only)

                      Michael Brauer, School of Population and Public Health, Faculty of Medicine;
                         Department of Medicine & Atmospheric Science Programme, The University
                         of British Columbia
                      David E. Calkin, U.S. Forest Service, Rocky Mountain Research Station
                      William Craven, Chief consultant to the California Senate Committee on Natural
                         Resources and Water
                      Lisa Dale, Colorado Department of Natural Resources
                      Ray Rasker, Headwaters Economics
                      Thomas W. Swetnam, Laboratory of Tree-Ring Research, University of Arizona

vi   union of concerned scientists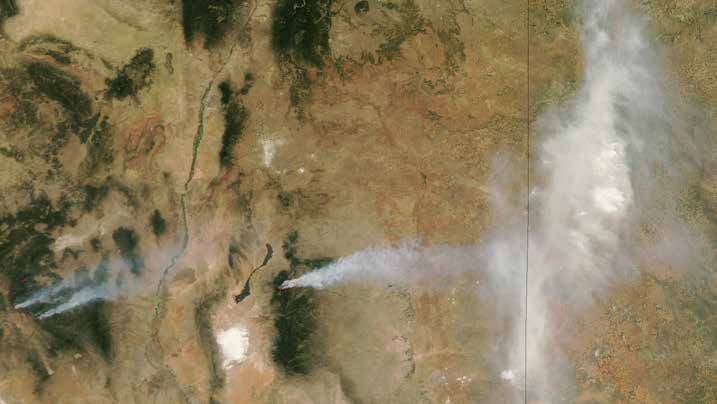
[ acknowledgments ]

This report was made possible by support from The Grantham Foundation for the
Protection of the Environment, The Barr Foundation, The Energy Foundation, The
Wallace Genetic Foundation, the Skoll Global Threats Fund, and UCS members.
     The authors also thank Rocco Snart, Colorado Department of Public Safety–
Division of Fire Prevention and Control, for providing the Colorado case study data
on wildfires.
    The opinions expressed herein do not necessarily reflect those of the organiza-
tions that funded the work or the individuals who reviewed it. The Union of Con-
cerned Scientists bears sole responsibility for the report’s content.

                                                                                      Playing with Fire   vii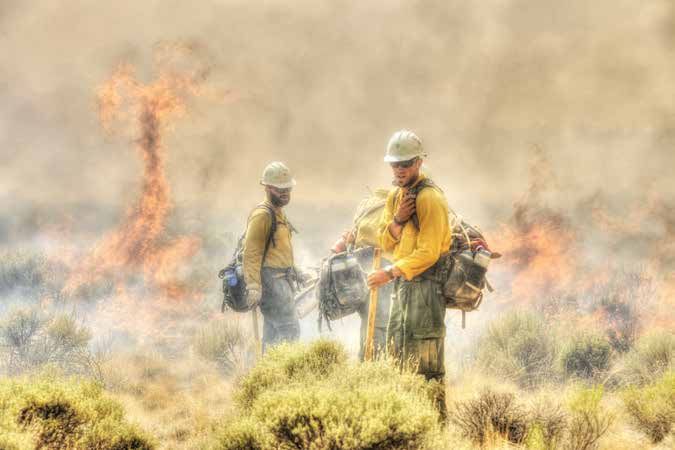
viii union of concerned scientists
[ Executive Summary ]

Wildfires have always been a natural and necessary
part of the forest landscape in the American West.
But recent human-induced changes are dangerously
altering wildfire regimes and increasing costs to
federal and state budgets and local communities.

Climate Change and Growing Wildfire Risks                           increasing geographic range of diseases and pests have
                                                                    altered vegetation and led to an overaccumulation of
Strong scientific evidence shows that climate change is produc-
                                                                    flammable biomass.
ing hotter, drier conditions that contribute to more larger fires
                                                                         All these factors are converging to create greater wildfire
and longer fire seasons in the American West today. The annual
                                                                    risks and costs. The costs associated with putting out wildfires
number of large wildfires on federally managed lands in the
                                                                    have soared, surpassing $1 billion (in 2012 dollars) every year
11 western states has increased by more than 75 percent: from
                                                                    since 2000. Since 1985 suppression costs have increased nearly
approximately 140 during the period 1980–1989 to 250 in the
2000–2009 period. The western wildfire season has grown             fourfold from $440 million to more than $1.7 billion in 2013
from five months on average in the 1970s to seven months today.     (in 2012 dollars). Firefighting costs are only a minor fraction
Moreover, the threat of wildfires is projected to worsen over       of the total costs of wildfires. A synthesis of six case studies
time as rising temperatures—rising more rapidly in the Amer-        of major recent wildfires in the western United States esti-
ican West than the global average—continue to lead to more          mated that total wildfire costs can range anywhere from 2 to
frequent, large, and severe wildfires and longer fire seasons.      30 times the direct suppression costs. Wildfires also have pro-
                                                                    found effects, both good and bad, on natural ecosystems.1

Communities on the Frontlines of Risk
Simultaneously, with more homes and businesses being built
                                                                    Managing and Mismanaging Risk
in and near wildfire-prone forested areas, the danger to people     Some current federal, state, and local policies and commercial
plus the costs associated with fighting, enduring, and recov-       practices are worsening the impacts and costs of wildfires.
ering from wildfires are also mounting. More than 1.2 million       Federal fire management is disproportionately skewed
homes—with a combined estimated value of more than                  toward suppressing wildfire at the expense of efforts to pro-
$189 billion—across 13 western states are at high or very high      actively reduce wildfire risks and maintain healthy forests.
risk of wildfires. The majority of the highest-risk properties      The share of the Forest Service (FS) budget devoted to fire
are in California, Colorado, and Texas, which together have         management rose from 13 percent in 1991 to more than
nearly 80 percent of such properties in the western states.         40 percent in 2012. From 2004 to 2008, 346 wildfires that
     In some areas, past fire suppression, timber harvesting,       each cost more than $1 million in suppression costs resulted
grazing practices, newly introduced plant species, and              in $2.25 billion in spending by the FS.

(Left:) Waldo Canyon fire, June 2012, Colorado Springs, CO.
© U.S. Air Force/Master Sgt. Jeremy Lock                                                                          Playing with Fire    1
State and local zoning policies continue to allow develop- significant health costs from smoke pollution, and devastating
ment near forests, creating a misalignment with actions that impacts on the Santa Clara Pueblo in New Mexico and the
can help reduce risks from wildfires and keep costs down. Northern Cheyenne Indian Reservation in Montana are some
Taxpayer funds, mostly directed at suppression, are not being of the other major costs of recent wildfires.
used effectively to manage and prepare for the full range
of wildfire risks and build resilience. And the full actual risks
to homeowners living in fire-prone areas are not reflected in Policies and Practices to Help Reduce
premiums for fire insurance. Wildfire Risks and Costs
In light of these costly trends, we need to use our resources
The Costly Impacts of Wildfires better to manage wildfires and help protect people. Incorpo-
rating the latest science to improve wildfire mapping and pre-
Damage to property, infrastructure, and local economies are diction, investing in fireproofing and fire safety measures, and
often an expensive legacy of fires. For example, the 2003 San ensuring that forest management practices reflect changes in
Diego wildfires caused more than $86 million in damages to climate are necessary starts for human safety and long-term
roads, bridges, and electricity and gas infrastructure. Smoke forest health.
from wildfires causes significant health problems, both when Coordinated action is needed among state and federal
wildfires occur near major population centers and when agencies and policy makers tasked with forest management
smoke is carried long distances to populated areas. Aggrava- and fire management, local agencies tasked with zoning regu-
tion of asthma and heart and lung diseases, breathing difficul- lations, communities located in high fire-risk areas, and
ties, and even death can result. The 2008 fire season led to insurance companies who insure homes in fire-prone areas.
almost $2.2 million in hospital costs in the Reno/Sparks area Mandatory building codes and zoning laws at the state and
of Nevada caused by wildfires within a 350-mile radius. local level can help reduce future wildfire risks and costs.
Intense wildfires can leave burned areas and areas Moving more responsibility for mitigating wildfire risks and
downstream at risk of soil erosion and serious flooding for costs to homeowners and local communities to incentivize
years afterward. Burned landscapes and soil erosion can also fireproofing measures—and charging insurance premiums
harm water supplies. The 1997 Buffalo Creek fire and the that reflect the true danger to properties—can lead to less
2002 Hayman fire in Colorado together cost Denver Water risky outcomes and decisions that help build local resilience.
$26 million in watershed rehabilitation costs. The 2000 Cerro Worsening wildfire seasons are forcing federal agencies
Grande fire in New Mexico forced direct expenditures of to shift budgets from investments in long-term fire manage-
more than $9 million by the Los Alamos Water Utility and ment and forest health to fire suppression. Funding fire sup-
an additional $72.4 million in rehabilitation, restoration, and pression through separate emergency funds, as has been
flood mitigation. proposed in recent legislation, is an important step toward
Wildfires can also have a significant impact on tourism halting this harmful dynamic.
revenue. The 1988 fires in Yellowstone National Park, the Public awareness campaigns and fire codes are also
largest wildfires ever experienced in the national park, led to important for individual homeowners to understand the risks
hotels and other accommodations closing four weeks ahead and the steps they can take to limit them. Homes are often
of the normal tourist season, a reduction in annual visits by much more flammable than forests. Investments in fireproof-
15 percent in 1988, and a $60 million loss in tourism benefits ing homes and establishing vegetation-free defensible buffer
between 1988 and 1990. zones around homes can slow or even stop fire from spreading
Many western states have experienced some of their and help keep firefighters safe. There is also a broader need
largest wildfires in recorded history in the last decade and a for a national climate resilience fund to help communities
half. The 2002 Hayman fire in Colorado, the 2003 Cedar fire cope with the impacts of climate change, including wildfires.
in California, the 2012 Ash Creek fire in Montana, and the Adaptation measures, however, have their limits. Reduc-
2012 Whitewater-Baldy Complex fire in New Mexico were all ing the expansion of development in risky zones near fire-
the largest recorded to date in those states. Billions of dollars prone forested areas is the single best way to limit human
have been spent on putting out fires in these states in the last exposure to wildfire risks (or human causes of wildfires) in
decade and a half. Damage to the Cheeseman Reservoir in the short term. Ultimately, cutting carbon emissions to slow
Colorado and the Rio Grande watershed in New Mexico, bil- climate change and temperature increases will be crucial to
lions of dollars in insured losses in Colorado and California, help curtail the impacts of wildfires on people and forests.
2 union of concerned scientists[ Introduction ]
The western United States has experienced record-breaking
wildfire seasons in recent years. Since 2000, the average
annual area burned in wildfires has more than doubled from
the 1985 to 1999 annual average (NIFC n.d. a).2 The costs
associated with putting out wildfires have similarly soared,
surpassing $1 billion every year since 2000 (in 2012 dollars).3
The 2006, 2007, and 2012 fire seasons were, respectively, the
first, second, and third worst since 1960 in terms of area
burned, with 9.3 million to 9.8 million acres burned each
year—an annual area twice the size of New Jersey (NIFC
n.d. b). Many states have experienced some of their largest
wildfires in recorded history in the last decade and a half. The
© U.S. Forest Service
2002 Hayman fire in Colorado, the 2003 Cedar fire in Califor-
nia, the 2012 Ash Creek fire in Montana, and the 2012
Whitewater-Baldy Complex fire in New Mexico were all the
largest recorded to date in those states.
Although wildfires have always been a natural and essen- Fighting wildfires can be expensive and dangerous, especially when fires break
out near residential areas. In this picture, fire crews are attempting to contain
tial part of the forest ecosystems of the American West, new the High Park fire in Cache La Poudre Canyon on June 27, 2012. The wildfire was
climatic conditions and increasing human development are located approximately 15 miles west of Fort Collins, CO, near several residential
areas that had to be evacuated.
fundamentally changing the nature of wildfires, the length of
wildfire seasons, and the associated dangers. First, climate
change, caused by our carbon emissions, is contributing to We have an opportunity to use our resources better to
growing risks of wildfires in the western United States (Denni- manage wildfires and help protect people. Coordinated
son et al. 2014; Climate Central 2012a; Westerling et al. 2006). action, with a fresh focus on resilient choices, is needed from
Simultaneously, more people have built or are building homes federal and state agencies and policy makers tasked with
in and near wildfire-prone areas, creating both a greater forest management and fire management, local agencies
human exposure to wildfire risks as well as a greater chance of tasked with zoning regulations, communities located in high
wildfires being ignited. Moreover, as a result of aggressive fire-risk areas, and insurance companies. Incorporating the
wildfire-suppression practices in the past, high fuel loads of latest science to improve wildfire mapping and prediction,
underbrush have built up over years in some forests, creating making investments in fire-safety measures, and better forest
the potential for larger, hotter fires when they happen. management practices can help address the need for human
This report explains why western wildfires are worsen- safety and long-term forest health.
ing; points out why some current policies and practices may Steps we take now—to build resilience to wildfires in
be worsening wildfire risks and costs; highlights the many dif- communities that are on the frontlines of risk, reduce the
ferent impacts and costs of wildfires; and provides recommen- expansion of development near fire-prone forested areas, and
dations for what we can do to limit these costs. Case studies cut the emissions that are fueling climate change—will be
on California, Colorado, Montana, and New Mexico provide a crucial to help limit the impacts of wildfires on people
more in-depth look at relevant issues in these states. and forests.
Playing with Fire 3[ Section 1 ]
Climate Change and Growing
Wildfire Risks
Drier, hotter conditions in the American West are signifi- wildfire risks in the region (Kitzberger et al. 2007; Brown
cantly increasing the risk of wildfires today (Dennison et al. and Wu 2005; Westerling and Swetnam 2003; Swetnam and
2014; Climate Central 2012a; Westerling et al. 2006). Such Betancourt 1990).8,9
conditions dry out forests, underbrush, and tinder, increasing Evidence abounds for a strong positive correlation
their flammability. As global temperatures rise, such condi- between climate change and the number and severity of wild-
tions will likely worsen, contributing to more frequent, large, fires. A recent (2014) study of large wildfire trends on both
and severe wildfires (Joyce et al. 2014; Ryan and Vose 2012).4 public and private land in the western United States found
that from 1984 through 2011, the number of large wildfires—
ones greater than 1,000 acres—increased at a rate of nearly
1.1 Drier, Hotter Conditions Contribute seven fires per year.10 Over that same period, the total area
to More Severe Wildfires burned by wildfires increased by more than 87,000 acres per
year. Some ecoregions, including the Arizona–New Mexico
Since 1970, average annual temperatures in the western Mountains, the Rocky Mountains, and the Sierra Mountains,
United States have increased by 1.9°F, about twice the pace saw an increase in both the number of fires and the size of
of the global average warming (Climate Central 2012b). In area burned; these regions also showed a trend of rising
the Southwest, the multiyear cycle of El Niño (which brings drought severity.11 Overall, the study points to climate change
wetter conditions to the region) and La Niña (which brings as “a dominant driver of changing fire activity in the western
drier conditions) alternately dampen or amplify the risks, United States” (Dennison et al. 2014). Five years earlier,
respectively. For example, La Niña years set in motion the another study found that from 1977 through 2003, roughly
severe 2011 fire season when most of the southern United 64 percent of the fire area burned by wildfires on public lands
States experienced elevated fire risk, and New Mexico, in the western United States can be related directly to such
Texas, and Arizona all had record-breaking wildfires (NOAA climate variables as temperature, precipitation, and drought
2012).5,6,7 Overall, the warming and drying trend increases (Littell et al. 2009).12 The exact relationships varied by
Climate change is significantly worsening the risk of
large wildfires in the western United States today. The
western wildfire season has also lengthened from five
months on average in the 1970s to seven months today.
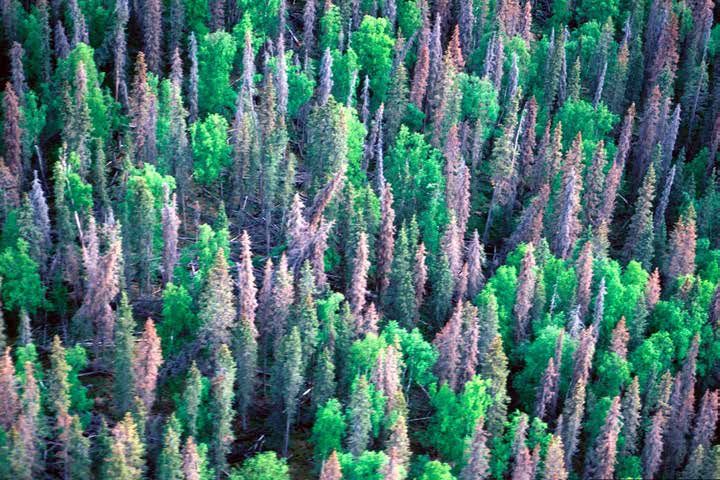
4 union of concerned scientists© William M. Ciesla, Forest Health Management International
From 2000 to 2013, bark beetles killed 47.6 million acres of forests in the western United States. Warmer winters have allowed the beetles to survive longer and
reproduce more, resulting in record epidemics. They are also now able to infect higher-elevation species, such as whitebark pine.
ecoregion, with each ecoregion characterized by similar types northern Rocky Mountain forests at mid-elevation—that is, at
of climate and vegetation.13 A third study examined 40 years altitudes between 6,500 and 8,000 feet—where spring and
of FS data and showed that, on average, the annual number of summer temperatures are documented to be increasing and
large wildfires nearly quadrupled in Arizona and Idaho and snow is melting earlier17 (Westerling et al. 2006).
doubled in California, Colorado, Montana, Nevada, New Mexico, To be sure, the data on wildfire occurrence present signif-
Oregon, Utah, and Wyoming (Climate Central 2012a). Overall, icant challenges, including a lack of a geographically complete,
Arizona, California, Colorado, Idaho, and Montana have seen consistent dataset across all land ownership categories and
the most dramatic increases in wildfires since 1970.14 over long periods of time (Dennison et al 2014; Short 2014).
Moreover, evidence strongly indicates that the western Multiple agencies and jurisdictions play roles in forest and
wildfire season is lengthening, and has grown from five months wildfire management and there is no centralized and stan-
on average in the 1970s to seven months today (Climate Central dardized system of record keeping (Short 2014). U.S. policies
2012a; Westerling et al. 2006; Brown, Hall, and Westerling on firefighting and land management, as well as patterns of
2004). The lengthening wildfire season has been accompanied land development, have also undergone major changes over
by a trend toward a growing number of large wildfires greater the last 50 years—which, in turn, affect wildfire risks (John-
than 1,000 acres. The annual number of large wildfires on fed- ston and Klick 2012). Nevertheless, robust scientific evidence
erally managed lands in the 11 western states has increased by points to the specific role of climate change in elevating wild-
more than 75 percent: from approximately 140 during the fire risks in the western United States, together with other
period 1980–1989 to 250 in the 2000–2009 period (UCS 2013; important drivers of risk (Dennison et al. 2014; Climate Cen-
USGS 2013).15,16 The greatest increases have occurred in tral 2012a; Littell et al. 2009; Westerling et al. 2006).
Playing with Fire 51.2 Warmer Temperatures Contribute to Even more severe, from 2000 to 2013, bark beetles killed
Beetle Infestations 47.6 million acres of forests in the western United States—an
area roughly the size of Nebraska (U.S. Forest Service 2014a).
Warmer temperatures contribute to diseases and to infesta- Warmer winter temperatures have allowed beetles to survive
tions by beetles and other pests that can cause trees to die and longer and reproduce more, resulting in record mountain
potentially make more fuel wood available for wildfires (Wil- pine beetle epidemics (U.S. Fish and Wildlife Service 2011).
liams et al. 2013; NRC 2011; van Mantgem et al. 2009; van Because of warmer temperatures at higher altitudes, the bee-
Mantgem and Stephenson 2007). For example, pathogens such tles are also now able to infect higher-elevation tree species,
as white pine blister rust have had a significant effect on tree such as whitebark pine, which have fewer defenses because
mortality in the western United States, in conjunction with of lack of prior exposure to the pests (Raffa, Powell, and
drought, increasing temperatures, and mountain pine beetle Townsend 2013).
(a species of bark beetle) infestations (Sturrock et al. 2011). Impacts of pathogens and pests whose ranges have
increased due to warmer temperatures have not yet been fully
captured in model projections for future wildfire risks. The
FIGURE 1. Midcentury Increase in Area Burned evidence on whether this widespread tree death makes for-
by Wildfires in the Western United States ests more prone to wildfires is thus far inconclusive.
1.3 Future Trends: Hotter and Drier Yet
WA
MT How climate change will affect future wildfire risks in a par-
ticular region will depend in part on changes to such local
OR conditions as temperature, precipitation, humidity, and resul-
ID tant changes in the forest ecosystem itself—that is, the types
WY of vegetation present and their density.
By mid-century, temperatures in the western United
States are expected to increase between 2.5°F and 6.5°F (1.4°C
NV to 3.6°C) above current levels (NOAA 2013).18 It is worth
UT CO emphasizing that this predicted temperature rise is in addi-
CA tion to the 1.9°F increase since 1970 that the region has
already experienced.
According to a 2011 study by the National Academies, the
AZ average area burned every year in the western United States
NM
will rise dramatically with even 1.8°F (1ºC) of warming. Among
the states, Colorado is projected to have the most area with the
largest percentage increase compared with other states, with a
potential increase of the annual burned area of 400 to 650 per-
Projected increase in annual burn area
with an additional 1.8°F rise in temperature cent for much of the state (NRC 2011).19
A 2013 study using an ensemble of 15 climate models
0% 200% 400% 650%
shows that, as a result of warmer, drier conditions, the western
United States is likely to see an increase in area burned of
One study shows that for every additional 1.8°F (1°C) increase in 60 percent and a further lengthening of the fire season by more
temperature, much of the western United States will experience a than three weeks (23 days) by midcentury (Yue et al. 2013).20
significant increase in the area burned by wildfires. Colorado faces Precipitation changes are more variable both in intensity
the highest overall increase in risk, with a potential increase in
and geographically, so their impact is more uncertain (Kunkel et
annual burned area of 400 to 650 percent. By mid-century, however,
temperatures in the western United States are projected to far exceed al. 2013; Peterson et al. 2013). Seasonal or multi-decadal factors
this estimate, increasing another 2.5°F to 6.5°F over today’s tem- such as the El Niño-Southern Oscillation (ENSO, which
peratures due to heat-trapping emissions from human activities. This includes a cool phase of sea-surface temperatures in the equato-
would make the area even more vulnerable to wildfire damage.
rial Pacific called La Niña and a warm phase called El Niño) and
SOURCE: UCS 2013; NRC 2011.
the Pacific Decadal Oscillation (PDO) can significantly worsen
6 union of concerned scientistshot and dry conditions associated with climate change, creating increase by 20 to 27 percent (Yue et al. 2013).22 Soot pollution
years with outsized fire risks (Brown and Wu 2005; Veblen, not only exacerbates climate change, as black carbon is potent
Kitzberger, and Donnegan 2000; Swetnam and Betancourt at trapping heat, but also can cause respiratory and cardiovas-
1998; Swetnam and Betancourt 1990). Forecasts of such sea- cular problems (see Section 4.4).
sonal extremes can provide lead time in preparing for years Moreover, the carbon dioxide (CO2) gas released from
with high wildfire risks (Williams et al. 2013; Hessl, McKenzie, forest fires—which can be especially pronounced for large wild-
and Schellhaas 2004).21 For example, in the dry shrub and fires—contributes to the rise in heat-trapping emissions. A 2010
grassland areas of southern Arizona and New Mexico, the risk study estimates that wildfires in the contiguous United States
of a severe wildfire season is strongly related to the amount of and Alaska release about 290 million metric tons of CO2 a year,
fuel that accumulates due to climatic conditions in the 10- to which is the equivalent of fully 4 to 6 percent of the nation’s CO2
18-month period before the fire season (Westerling et al. 2003). emissions from burning fossil fuels (Wiedinmyer and Neff
Indeed, in arid areas, increased precipitation in prior seasons 2007).23 The study also shows that the CO2 emissions in several
leads to a greater availability of flammable vegetation for fire western and southeastern states24 can be equivalent to 10 per-
seasons that follow (Littell et al. 2009). cent or more of the annual emissions from the state’s entire
transportation or power sector (Wiedinmyer and Neff 2007).
Annually, healthy vegetation and soil in forests and wild-
1.4 Carbon Emissions from Forest Fires lands currently absorb more carbon from the atmosphere than
Increase they release. But as the climate warms and droughts and wild-
fires worsen over time, vegetation and soil become stressed and
More and bigger wildfires will increase air pollution. Over the their storage capacity could diminish. Under some scenarios,
western United States, summertime surface organic carbon Rocky Mountain forests could even turn into net sources of
aerosol—fine particulate matter commonly referred to as emissions by the end of this century, feeding the very CO2 emis-
soot—will increase by 46 to 70 percent; black carbon, the sions buildup that is causing climate change (Boisvenue and
most strongly light-absorbing component of soot, will Running 2010).
© NASA, Moderate Resolution Imaging Spectroradiometer (MODIS) on NASA’s Aqua satellite
Smoke from wildfires can be carried many miles away from the original site of the wildfire. Here, a NASA satellite photo shows the smoke from the 2012 Little Bear
fire in the Lincoln National Forest in New Mexico being carried across the border to Texas, shown by the vertical black line.
Playing with Fire 7[ State Case Study 1 ]
California Extended Drought Elevates Wildfire Risks
in Densely Populated Areas
California ranks first among western states conditions, declaring that “the risk of wildfires across the
in terms of average annual costs for fighting state is greatly increased.” He directed CAL FIRE to hire
large wildfires on federal lands (Kenward additional firefighters and take other actions to protect the
and Raja 2013). Those costs, on average, exceed that of 10 public (Office of Governor Edmund G. Brown Jr. 2014).
other western states combined (Arizona, Colorado, Idaho, Wildfire risks in southern California differ from those
Montana, Nevada, New Mexico, Oregon, Utah, Washington, in the northern part of the state primarily because of their
and Wyoming). On average, almost half of all annual firefight- different vegetation types. Southern California’s wildfire risks
ing expenditures for western wildfires go toward fighting Cal- occur from a confluence of factors, including fuel buildup due
ifornia fires even though the state’s wildfires typically make to past watershed management and fire suppression, the local
up less than a quarter of all the acres burned in the western ecology and climate, and the Santa Ana weather events,
states (Kenward and Raja 2013). The overall budget of the which combine high and hot winds and low humidity (Keeley
California Department of Forestry and Fire Protection (CAL
FIRE) for fire protection alone is currently more than $1 bil-
lion annually (State of California 2014).
California’s wildfire risks in 2014 are particularly high
because of the extended drought and record low rainfall the
state has been experiencing. From 2013 to 2014, southern Cal-
ifornia experienced an almost year-round fire season, with
elevated wildfire risk even during the winter months (CAL
FIRE 2014a), which may be a harbinger of a drought-prone
future.25 As of February 2014, snowpack in the Sierra Nevada
Mountains reached a record low of 24 percent of normal
levels (California Department of Water Resources 2014).26
The 2013 fire season saw the third-largest fire the state
has seen to date, the Rim fire, which raged for more than two
months (August 17 to October 24). The fire burned more than
257,000 acres in and around Yosemite National Park in Mar-
iposa and Tuolumne counties in the Sierra Nevada region.27
Suppression costs alone amounted to nearly $126 million
(InciWeb 2013). A recent study estimated additional losses
from the fire of $100 million to $736 million in lost environ-
mental benefits (including food provisioning, raw materials,
air quality, soil retention, water regulation, and recreation
and tourism),28 and an estimated $50 million to $265 million in
the value of private property destroyed (Batker et al. 2013).29
Salvage logging, the logging of trees for timber in a forest that
is unhealthy or has been damaged in some way, has been
© Flickr/U.S. Forest Service
proposed in the wake of the wildfire to recoup some of the
suppression costs. The idea has proven to be controversial
because of the potential for adverse ecosystem effects (Boxall
2014; Center for Biological Diversity and the John Muir Proj-
ect 2014; Rott 2014).
Crews work hard to fight the Rim fire in Stanislaus National Forest that began in
In January 2014, Governor Edmund G. Brown declared August 2013. The fire consumed 260,000 acres—a devastating loss to the natural
a state of emergency for California because of the record dry landscape and neighboring communities.
8 union of concerned scientistsFIGURE 2. Recent Large Wildfires in California, 1999–2013
900 600
800
Acres burned 500
Thousands of acres
700 in large fires
Millions of 2012 $
(>100 acres)
600 400
Suppression costs
500
300
400
300 200
200
100
100
0 0
1999 2000 2001 2002 2003 2004 2005 2006 2007 2008 2009 2010 2011 2012 2013
20 Largest Fires in California
(Bold: More than 200,000 acres)
2013 Rim 2008 Klamath Theater Complex 2003 Simi 1987 Stanislaus Complex
2012 Rush 2007 Witch 2002 McNally 1985 Wheeler
2009 Station 2007 Zaca 1999 Big Bar Complex 1977 Marble Cone
2008 Basin Complex 2006 Day 1996 Highway 58 1970 Laguna
2008 Iron Alps Complex 2003 Cedar 1990 Campbell Complex 1932 Matilija
Between 1999 and 2013, there were more than 78,000 wildfires in California, which burned approximately 3.8 million acres and incurred
more than $4 billion in suppression costs (in 2012 dollars). Of these, the Cedar, Rush, Rim, Zaca, and Matilija fires burned more than
200,000 acres apiece. The suppression costs of wildfires do not necessarily correlate with acres burned. Another major determinant of
costs is where a fire occurs—costs tend to be higher if fires occur near developed areas.
DATA SOURCE: CAL FIRE 2014B; NFAM N.D.
et al. 2007; Westerling et al. 2004; Pyne 1997). The northern the Northern California counties of Alpine, Mariposa,
part of the state has risks similar to the high-elevation Rocky Nevada, and Tuolumne are already considered high risk even
Mountain forested areas, which are experiencing a clear before taking climate change into consideration (IINC and
increase in the severity and length of the fire season due to Verisk Insurance Solutions 2012).33,34,35 CAL FIRE also main-
climate change. It is possible that, with climate change, tains a list of communities at high risk of wildfire to help
wildfires will increase in the northern part—especially the determine where and how to direct its resources; currently,
Sierras—but may decrease in the south, which is dominated by 874 communities are on the list (CAL FIRE 2014c).36 Some of
dry grass and shrublands (Westerling and Bryant 2008).30,31 the cities on the list of “very high fire severity zones” include
Throughout the state, but especially in the densely populated Berkeley, Oakland, and several cities in Los Angeles, Orange,
southern part, many people live near wildfire-prone areas, or Riverside, San Bernardino, and Ventura counties.
downwind from them. This means that even small changes in The human health effects of smoke from wildfires have
wildfire risks due to climate change can have dangerous and been studied more in California than any other part of the
costly consequences for millions of people. country because wildfire smoke often affects large population
California has suffered seven of the 10 most costly wild- centers. The 2003 wildfire season in particular produced
fires in the nation, including three that cost between $1.6 bil- heavy smoke that affected the Los Angeles metro area. A
lion and $2 billion in insured losses.32 A recent insurance study of the impact on children’s health showed that, with
industry estimate found more than 2 million California soot particles produced from the fire 10 to 20 times higher
homes—nearly 15 percent of all California homes—at risk of than usual levels, many children experienced acute eye and
extreme wildfire hazards. More than 77 percent of homes in respiratory symptoms and the effects on those with asthma
Playing with Fire 9were particularly pronounced (Künzli et al. 2006). Another
study focused on cardiorespiratory hospital admissions in
California’s extended
the wake of the fires and found that elevated levels of PM2.5 drought and record low
(particulate matter less than 2.5 microns in diameter) had
the strongest negative effects on older people (65 to 99 years, rainfall are greatly
10.1 percent increase in hospital admissions) and younger
people (0 to 4 years, 8.3 percent increase in hospital admis-
increasing the risk of
sions) (Delfino et al. 2009).37 The 2008 wildfires led to some wildfires across the state.
of the highest levels of PM concentrations in the Central
Valley ever recorded at those air quality monitoring stations,
and a study showed that this type of PM from wildfires is
much more toxic to the lungs than PM that is usually found
in the region’s air (Wegesser, Pinkerton, and Last 2009). and for not being significant enough to be a deterrent to living
California has taken key steps to prepare its residents for in wildfire-prone areas.
wildfire risks. It has developed a strategic fire plan for reduc- California is one of five states that require insurers to fill
ing risks before, during, and after fires (State Board of For- out a survey asking if they consider climate change risks in
estry and CAL FIRE 2010). It has launched an active public their business model. The 2013 survey showed that close to
awareness campaign to warn people of wildfire risks and how 75 percent of them do, an encouraging sign that there is an
to protect themselves (CAL FIRE 2014d).38 The state also awareness that the market must respond to changing condi-
uses its building code and other laws to require more fire-safe tions (California Department of Insurance 2013).
housing in the wildland-urban interface (WUI), where homes The state has been at the vanguard of overall climate mit-
are located in or near vegetated areas prone to wildfires, and igation and preparedness actions, enacting the Global Warm-
buffer zones free of flammable shrubs or debris (Burton ing Solutions Act (commonly referred to as AB32 for
2013). In 2011, the state began charging rural dwellers an Assembly Bill No. 32) and adopting a statewide climate adap-
annual protection fee of $150 that has netted some $84 mil- tation strategy in 2009 that is being updated (California Natu-
lion for its strained firefighting budget, although it has also ral Resources Agency 2013; California Natural Resources
been criticized for being administratively expensive to collect Agency 2009; Assembly Bill No. 32 2006).39
10 union of concerned scientists[ Section 2 ]
A Combustible Mix: Homes near Wildfire-Prone
Forests Raise Risks
Forests are beautiful natural areas with many opportunities for
outdoor recreation. People want to live near them or even TABLE 1. Development in the Wildland-Urban Interface
within them. Growing housing development in and near wild-
Total Percent
fire-prone forested areas is a primary factor in raising exposure Percent
State Homes Second
to the risks and costs of wildfires, and forcing more resources Developed
in WUI Homes
to be spent on fire suppression to defend these areas in the
event of a fire. In some areas, past fire suppression, timber har- All Western States 16% 1,947,927 15%
vesting, grazing practices, newly introduced plant species,40 Washington 29% 951,468 6%
and increasing range of diseases and pests have altered vegeta-
California 17% 490,255 18%
tion and led to an overaccumulation of flammable biomass—
which, in turn, raises the risks of wildfires. Oregon 11% 179,451 15%
Colorado 20% 117,472 40%
Montana 9% 43,136 31%
2.1 Development Is Growing in Wildfire-
Prone Forested Areas Idaho 13% 43,454 34%
New Mexico 16% 27,387 40%
In the last 50 years there has been significant expansion of
development near wildland areas in the United States, much of Arizona 16% 52,701 41%
which comes from new homes (Theobald and Romme 2007; Utah 7% 15,733 35%
Radeloff et al. 2005). The junction of developed areas and wild-
Nevada 9% 20,970 23%
lands is commonly referred to as the WUI. 41 Wildlands can
include forests, shrublands, grasslands, and other types of nat- Wyoming 5% 5,900 43%
ural ecosystems that can have elevated wildfire risks. For the
The proportion of the wildland-urban interface (WUI) that is devel-
purposes of this report we are primarily focused on forested
oped is still relatively small in most western states, averaging 16 per-
areas in the western United States. cent for all western states. Keeping the WUI contained provides a
In 2000, the WUI in the United States occupied nearly significant opportunity to help limit wildfire risks to people and their
180,000 square miles (465,614 square kilometers) and con- homes. The percent of second homes in the WUI is striking: In Ari-
zona, Colorado, New Mexico, and Wyoming, more than 40 percent of
tained more than 12.5 million housing units, a 52 percent
the homes in the WUI are second homes. Although these homes may
expansion from 1970 (Theobald and Romme 2007). In 2008, be occupied only seasonally, firefighters are compelled to defend them
approximately 40 percent of the 115 million single-family year-round from wildfires. Moreover, absentee homeowners may also
homes in the United States were located in such areas (Botts be less likely to contribute to long-term management of fire risks.
et al. 2013). If this trend continues, by 2030 the WUI is likely SOURCE: HEADWATERS ECONOMICS 2014.
Playing with Fire 11HOMES AND COMMUNITIES IN WILDFIRE-PRONE FORESTS FACE HIGH RISKS
Homes built in or near areas with forests face elevated risks of wildfires. These areas—often called the wildland-urban interface (WUI)—are also very challenging
environments in which to fight fires. Colorado and California stand out as having the most homes in the high-risk WUI.
to expand to at least 200,000 square miles, with the greatest and Texas have the largest number of properties exposed to
expansion occurring in the intermountain western states of the highest risk, together having nearly 80 percent of such
Arizona, Colorado, Idaho, Montana, Nevada, and Utah (Theo- properties in the western states. Population growth, housing
bald and Romme 2007).42 More than 1.2 million homes across preferences, and growing numbers of vacation homes are
13 western states are at high or very high risk of wildfires among the main factors contributing to these development
(Botts et al. 2013). These properties have a combined esti- trends (Hammer, Stewart, and Radeloff 2009).44
mated value of more than $189 billion.43 California, Colorado,
© Zach Dischner Photography
Homes and developed areas near wildfire-prone forests in the western United States are particularly exposed to the threat of wildfires. This picture shows the 2012
Flagstaff fire near the University of Colorado–Boulder campus.
12 union of concerned scientistsFIGURE 3. Homes at Risk from Wildfires in the Western United States
WA
3,323
MT
26,468
OR
107,388 ID
22,503 WY
26,936
NV
11,698
UT CO
CA 22,859 200,443
375,500
AZ NM
48,823 35,024
Residential TX
properties at high or 678,544
very high risk of wildfire damage
Percentage
>7% 2–7% 1–2% 0.5–1%
Development in or near wildfire-prone areas in the western United States is significantly raising the risks and costs of wildfires. The colors
on the map show the percentage of homes in each state that are either in the very high or high wildfire risk categories. Colorado, Montana,
New Mexico, and Oregon are the states with the highest percentages of homes in very high and high risk categories, based on terrain, fuel, and
vegetation characteristics of the property itself. The figures in each state show the number of properties that have the highest numeric risk
score, factoring in a property’s proximity to very high or high wildfire-risk areas. Texas, California, and Colorado have the greatest number
of homes with the highest risk score.
SOURCE: BASED ON DATA BY CORELOGIC (BOTTS ET AL. 2013).
BOX 1.
Managing Wildfire Risks in the Wildland-Urban Interface
While wildfire risks present significant challenges where of housing can have a big effect on how much a fire spreads
homes meet forests in the WUI, there are clear steps that can and how much damage it causes (Spyratos, Bourgeron, and
be taken to help address them (Calkin et al. 2014). Mapping the Ghil 2007).
WUI and identifying high-risk communities is a critical first For high-risk communities, establishing clear evacuation
step to managing those risks and costs (Wildfire Insurance and routes, creating warning mechanisms to inform residents of
Forest Health Task Force 2013). Public awareness campaigns fires, making data on location and availability of firefighting
are important for homeowners to understand the risks and the resources easily accessible, and undertaking proactive fuels
steps they can take to limit them. For example, investments management are all helpful. Mandatory building codes and
in fireproofing homes and establishing vegetation-free buffer zoning laws at the state and local levels can help reduce future
zones around homes have been shown to be very effective in wildfire costs.46 Finally, national policies to align firefighting
protecting homes (CAL FIRE 2014d; Colorado State Forest budgets and disaster aid with more resilient development
Service 2012).45 A cleared defensible-space zone around a choices at the state and local levels will send an important
home can slow or even stop fire from spreading and helps keep signal to help protect homeowners in wildfire-prone areas and
firefighters safe. The type of building material and the density will benefit all taxpayers.
Playing with Fire 132.2 Mapping Wildfire Risks to People and
Homes
To understand the risk of wildfire to homes, it is important to
identify the WUI where fire-prone forested areas and devel-
oped areas intersect, allowing fires to jump from natural envi-
ronments to human ones. One useful proxy is combining
vegetation maps with U.S. Census data on housing or popula-
tion (see Figure 4). More sophisticated methods are being
developed that use more granular population data and also
take into account fire characteristics and the probability
of a fire spreading based on such factors as topography and
© KGTV
historical behavior (Haas, Calkin, and Thompson 2013).
Using such maps, southern California clearly stands out as
Wildfires can have devastating impacts on personal property and lives. A San Diego
having some of the largest, most densely populated areas couple watches as firefighters try to save their home.
exposed to wildfire risks (Haas, Calkin, and Thompson 2013).
FIGURE 4. Southern California’s High Wildfire Risk
Santa Kern
Barbara
Ventura
San Bernardino
WUI, high density
WUI, medium density Los Angeles
WUI, low density
vegetated, non-WUI, very low density
Orange
vegetated, non-WUI, uninhabited
Riverside
no vegetation, high density
no vegetation, medium density
no vegetation, low and very low
density or uninhabited
water
San
Diego
Southern California has some of the most densely populated areas in the United States exposed to high risks of wildfires at the wildland-urban
interface (shown in yellow and orange colors on this map with 2010 data), where homes meet forested, grassland, or shrubland areas.
DATA SOURCE: SILVIS LAB 2012.
14 union of concerned scientists[ State Case Study 2 ]
Colorado Homes and People at Risk in the Front Range
Colorado’s 2012 Waldo Canyon fire was and growing development in wildfire-prone areas combine
one of the most destructive fires in the to elevate risks.
state’s history. The fire burned more than Colorado’s spectacular scenery and popularity with
18,000 acres, destroyed 247 homes, took two lives, and forced outdoor enthusiasts owes much to its location in the southern
the evacuation of nearly 30,000 residents (City of Colorado Rocky Mountains—right where hotter, drier conditions in this
Springs 2013). Post-fire flooding and mudslides will remain region are contributing to growing wildfire risks. Since the
a risk for the burned area for a number of years (Quarles 1970s the average annual number of large wildfires (greater
et al. 2012). That single fire resulted in suppression costs than 1,000 acres) on FS lands in Colorado have doubled
amounting to $15.7 million and insured losses of $454 million (Climate Central 2012b).
(CDPS 2014; RMIIA n.d.). Following closely in 2013 was the Twenty percent of Colorado’s population and a quarter
catastrophic Black Forest fire with estimated insured losses of all homes are located in so-called red zones: areas at high risk
of $288 million and suppression costs of $14.8 million (in 2012 of wildfires (9News.com 2012).47 More than 117,000 homes—
dollars). Unfortunately, such costly “megafires” are likely to 40 percent of them second homes—are in wildfire-prone areas
be a continuing part of Colorado’s future as climate change near forests (Headwaters Economics 2014). Among the western
© James Cooley
A Wyoming National Guard plane drops fire retardant to try to slow the spread of the 2012 Waldo Canyon fire near Colorado Springs, CO. The plane belongs to a unit
that is part of the nation’s Modular Airborne Fire Fighting System, a joint effort between the U.S. Forest Service and the Department of Defense.
Playing with Fire 15Twenty percent of Colorado’s population
and a quarter of all homes are located
in areas at high risk of wildfires.
states, Colorado ranks second, behind Washington, in the per- Colorado’s recent series of destructive wildfire seasons,
centage (20 percent) of the state’s WUI that is developed and in particular the Waldo Canyon fire, led Governor John
(Headwaters Economics 2014). Projections show that by 2030 Hickenlooper to commission a wildfire taskforce49 to study
developed wildfire-prone areas could be triple the area in 2000 how better to manage risks in wildfire-prone developed areas.
(Theobald and Romme 2007).48 In its 2013 report, the taskforce recommended a number of
Along Colorado’s Front Range—which encompasses steps including charging homeowners an annual fee to live
such major population centers as Boulder, Colorado Springs, in the WUI, undertaking wildfire mitigation audits for high-
Denver, and Fort Collins—rapid development in high risk properties, and providing tax incentives or state funding
wildfire-risk areas has serious implications for people and for mitigation efforts (Wildfire Insurance and Forest Health
their homes. Insured property losses related to wildfires are Task Force 2013). Thus far, there has been opposition to
significant (see Table 2). specific legislation in response to the taskforce’s recommen-
Colorado’s water supplies, especially for the densely dations; it is unclear whether legislation may be introduced
populated Front Range communities, have come under in the future.
threat from past wildfires followed by flash floods, which Currently, Colorado does not have any state laws requir-
have led to contamination from debris, ash, and sediment. ing property owners in wildfire-prone areas to actively par-
For example, the 2002 Hayman fire affected the Cheeseman ticipate in risk-mitigation efforts, leaving such requirements
Reservoir, which stores 15 percent of the Denver metro area’s to the discretion of local authorities. As a result, in some areas
water supply (Le Master, Shao, and Donnay n.d.). The fire severely affected by wildfires, local and county governments
also forced Denver Water, the local public utility company, have imposed stringent wildfire regulations, while other areas
to spend more than $26 million on dredging Strontia Springs have few or no regulations. Colorado communities, as many
Reservoir, treating water, and reseeding the forests in the others nationwide, do participate in adopting voluntary Com-
watershed (DOI 2013). Those consequences have lasted for munity Wildfire Protection Plans.50
years, requiring costly ongoing maintenance and rehabilita- The Colorado State Forest Service has created an online
tion (Le Master, Shao, and Donnay n.d.). tool to help individuals assess their risk from wildfires
TABLE 2. Insured Losses from Recent Colorado Wildfires
Insured Loss
Year Fire Insured Loss ($ Millions)
(Millions 2012 $)*
2012 Waldo Canyon, Colorado Springs 453.7 453.7
2013 Black Forest, near Colorado Springs 292.8 288.4
2012 High Park, near Fort Collins 113.7 113.7
2010 Fourmile Canyon, northwest of Boulder 217.0 225.1
2002 Hayman, southwest of Denver 38.7 47.8
2002 Missionary Ridge, near Durango 17.7 21.9
2002 Coal Seam, Glenwood Springs 6.4 7.9
2002 Iron Mountain, near Cañon City 7.5 9.3
*2012 estimated cost calculations based on the Consumer Price Index.
SOURCE: RMIIA N.D.
16 union of concerned scientistsFIGURE 5. Recent Large Wildfires in Colorado, 2000–2013
600 250
500 Acres burned in large fires
Thousands of acres
200
Millions of 2012 $
(>100 acres)
400 Suppression costs
150
300
100
200
50
100
0 0
2000 2001 2002 2003 2004 2005 2006 2007 2008 2009 2010 2011 2012 2013
Selected Large Fires
(Bold: More than 10,000 acres; Italic: More than $5 million; Bold Italic: Both)
2000 2002 2005 2011 2012 2013
Bircher Big Fish Mason Bear Springs Callie Marie Fern Lake Black Forest
Bobcat Burn Canyon Duckett Heartstrong East Peak
Buster Flats Cheyenne County Ft. Lyons High Park Fern Lake
High Meadow Coal Seam 2006 Karval Last Chance West Fork Complex
Green Creek Mato Vega Shell Complex Little Sand
Hayman Track Lower North Fork
Lincoln County Complex Pine Ridge
Million 2008 Waldo Canyon
Missionary Ridge Bridger Fire Weber
Mt. Zirkel Complex Mayberry
Spring Creek Complex
Trinidad Complex
From 2000 to 2013, there were 329 large wildfires in Colorado that were greater than 100 acres. Together, they burned approximately
1.5 million acres and incurred more than $557 million in suppression costs (in 2012 dollars).
SOURCE: CDPS 2014; NFAM N.D.
and provide information for local planners and emergency to maintain affordable insurance rates.52 The Watershed
responders.51 The state has also joined Colorado State Wildfire Protection Group, a partnership of state and federal
University, local media, insurance companies, and wildfire agencies, research institutions, and water utilities, has been
agencies to launch a “Wildfire Ready” public awareness formed to help assess risks to water supplies and to take
campaign ahead of wildfire season (CBS Denver 2014). steps to help reduce them. The Upper Colorado headwaters
Insurance companies in Colorado are increasingly asking and Big Thompson watershed are also the first pilot site for
homeowners to be more aware of their risk of wildfires and a new initiative on watershed protection from wildfire risks
to take appropriate measures, such as fireproofing homes and launched by the FS and the Department of the Interior (DOI)
creating vegetation-free buffer zones around homes, in order as part of President Obama’s Climate Action Plan (DOI 2013).
Playing with Fire 17You can also read