Quaternary Science Reviews
←
→
Page content transcription
If your browser does not render page correctly, please read the page content below
Quaternary Science Reviews 125 (2015) 15e49

                                                               Contents lists available at ScienceDirect

                                                         Quaternary Science Reviews
                                             journal homepage: www.elsevier.com/locate/quascirev

Invited review

On the reconstruction of palaeo-ice sheets: Recent advances and
future challenges
Chris R. Stokes a, *, Lev Tarasov b, Robin Blomdin c, d, Thomas M. Cronin e,
Timothy G. Fisher f, Richard Gyllencreutz g, Clas Ha €ttestrand d, Jakob Heyman d,
Richard C.A. Hindmarsh , Anna L.C. Hughes , Martin Jakobsson g, Nina Kirchner d,
                           h                   i

Stephen J. Livingstone j, Martin Margold a, d, Julian B. Murton k, Riko Noormets l,
W. Richard Peltier m, Dorothy M. Peteet n, o, David J.W. Piper p, Frank Preusser q,
Hans Renssen r, David H. Roberts a, Didier M. Roche r, s, Francky Saint-Ange p,
Arjen P. Stroeven d, James T. Teller t
a
  Department of Geography, Durham University, Durham, DH1 3LE, UK
b
  Department of Physics and Physical Oceanography, Memorial University of Newfoundland, St. John's, Newfoundland, A1B 3X7, Canada
c
  Department of Earth, Atmospheric and Planetary Sciences, Purdue University, West Lafayette, 47907-2051, IN, USA
d
  Department of Physical Geography, and Bolin Centre for Climate Research, Stockholm University, 106 91 Stockholm, Sweden
e
  United States Geological Survey, 12201 Sunrise Valley Drive, VA 20192, USA
f
  Department of Environmental Sciences, MS 604, University of Toledo, Toledo, OH 43606-3390, USA
g
  Department of Geological Sciences, Stockholm University, 106 91 Stockholm, Sweden
h
  British Antarctic Survey, Madingley Road, Cambridge, CB3 0ET, UK
i
  Department of Earth Science, University of Bergen, and Bjerknes Centre for Climate Research, 5007 Bergen, Norway
j
  Department of Geography, University of Sheffield, Sheffield, S10 2TN, UK
k
  Department of Geography, University of Sussex, Brighton, BN1 9QJ, UK
l
  The University Centre in Svalbard (UNIS), 9171 Longyearbyen, Norway
m
   Department of Physics, University of Toronto, 60 St. George Street, Toronto, Ontario, M5S 1A7, Canada
n
  Lamont Doherty Earth Observatory, Palisades, NY 10964, USA
o
  NASA/Goddard Institute for Space Studies, 2880 Broadway, New York, NY 10025, USA
p
  Geological Survey of Canada Atlantic, Bedford Institute of Oceanography, Dartmouth (Nova Scotia), B2Y 4A2, Canada
q
  Institute of Earth and Environmental Sciences e Geology, University of Freiburg, Albertstr. 23b, 79104 Freiburg, Germany
r
  Faculty of Earth and Life Sciences, Vrije University Amsterdam, Amsterdam, Netherlands
s
  Laboratoire des Sciences du Climat et de l'Environnement (LSCE), CEA/CNRS-INSU/UVSQ, Gif-sur-Yvette Cedex, France
t
  Department of Geological Sciences, University of Manitoba, Winnipeg, R3T 2N2, Canada

a r t i c l e i n f o                                   a b s t r a c t

Article history:                                        Reconstructing the growth and decay of palaeo-ice sheets is critical to understanding mechanisms of
Received 26 March 2015                                  global climate change and associated sea-level fluctuations in the past, present and future. The signifi-
Received in revised form                                cance of palaeo-ice sheets is further underlined by the broad range of disciplines concerned with
9 July 2015
                                                        reconstructing their behaviour, many of which have undergone a rapid expansion since the 1980s. In
Accepted 14 July 2015
Available online xxx
                                                        particular, there has been a major increase in the size and qualitative diversity of empirical data used to
                                                        reconstruct and date ice sheets, and major improvements in our ability to simulate their dynamics in
                                                        numerical ice sheet models. These developments have made it increasingly necessary to forge inter-
Keywords:
Ice sheet reconstruction
                                                        disciplinary links between sub-disciplines and to link numerical modelling with observations and dating
Numerical modelling                                     of proxy records. The aim of this paper is to evaluate recent developments in the methods used to
Palaeoglaciology                                        reconstruct ice sheets and outline some key challenges that remain, with an emphasis on how future
Glaciology                                              work might integrate terrestrial and marine evidence together with numerical modelling. Our focus is on
                                                        pan-ice sheet reconstructions of the last deglaciation, but regional case studies are used to illustrate
                                                        methodological achievements, challenges and opportunities. Whilst various disciplines have made
                                                        important progress in our understanding of ice-sheet dynamics, it is clear that data-model integration
                                                        remains under-used, and that uncertainties remain poorly quantified in both empirically-based and

    * Corresponding author.
      E-mail address: c.r.stokes@durham.ac.uk (C.R. Stokes).

http://dx.doi.org/10.1016/j.quascirev.2015.07.016
0277-3791/© 2015 Elsevier Ltd. All rights reserved.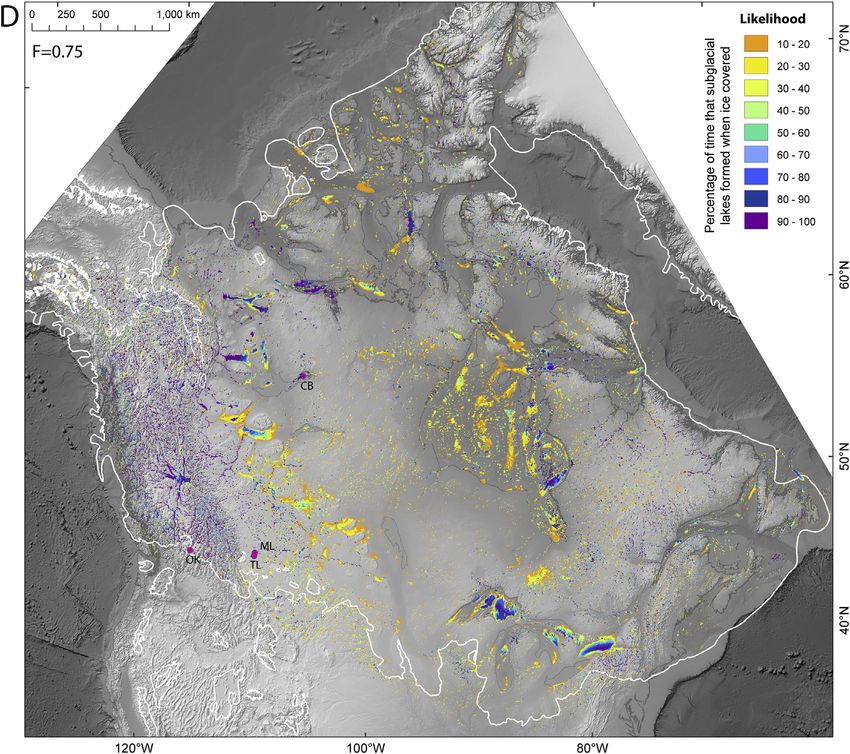
16                                            C.R. Stokes et al. / Quaternary Science Reviews 125 (2015) 15e49

                                             numerical ice-sheet reconstructions. The representation of past climate will continue to be the largest
                                             source of uncertainty for numerical modelling. As such, palaeo-observations are critical to constrain and
                                             validate modelling. State-of-the-art numerical models will continue to improve both in model resolution
                                             and in the breadth of inclusion of relevant processes, thereby enabling more accurate and more direct
                                             comparison with the increasing range of palaeo-observations. Thus, the capability is developing to use all
                                             relevant palaeo-records to more strongly constrain deglacial (and to a lesser extent pre-LGM) ice sheet
                                             evolution. In working towards that goal, the accurate representation of uncertainties is required for both
                                             constraint data and model outputs. Close cooperation between modelling and data-gathering commu-
                                             nities is essential to ensure this capability is realised and continues to progress.
                                                                                                                 © 2015 Elsevier Ltd. All rights reserved.

1. Introduction                                                                  concerned with ice sheet reconstructions and, in particular, to
                                                                                 link numerical modelling with observations from both terrestrial
    The first paper published in the newly-launched Quaternary                    and marine records. This has been one of the goals of the interna-
Science Reviews in 1982 was ‘On the Reconstruction of Pleistocene                tional MOCA project (Meltwater routing and Ocean-
Ice Sheets: A Review’ by John T. Andrews. His paper highlighted a                eCryosphereeAtmosphere response: www.physics.mun.ca/~lev/
range of topics in Quaternary science that require accurate re-                  MOCA), previously funded as a joint network of INQUA PALCOM
constructions of the area, volume and chronology of palaeo-ice                   (Paleoclimate) and TERPRO (Terrestrial processes) commissions.
sheets (e.g. global sea level, marine oxygen isotopes, plant and                 MOCA workshops have enabled modellers and empiricists to
animal migrations, glacial stratigraphy and chronology), but noted               collaborate and elucidate what goes into their reconstructions and
that such reconstructions were difficult to produce, and often                    the associated uncertainties. This synthesis has helped to identify
tackled separately by sub-disciplines. The evidence used to recon-               new constraints and scrutinize hidden assumptions, with the aim
struct palaeo-ice sheets was reviewed, and he emphasised the need                of providing more robust ice sheet reconstructions. Workshops
to reconcile empirical evidence with results from numerical ice                  have also highlighted recent advances in the techniques and
sheet models, which were pioneering at the time (e.g. Mahaffy,                   methods to reconstruct ice sheets, identified the remaining chal-
1976; Budd and Smith, 1981; Denton and Hughes, 1981), but still                  lenges, and also illuminated directions for future research. These
very much in their infancy. An important discussion focussed on                  methodological insights motivate this paper. Our aims are to
the mismatch between the over-simplified single-domed ice sheets                  highlight some important advances in reconstructing palaeo-ice
generated by modelling and the more dynamic and multi-domed                      sheets from: (i) glacial geological evidence in terrestrial and ma-
configurations inferred from glacial geological evidence (e.g.                    rine settings (Section 2); (ii) improvements in dating methods and
Shilts, 1980). Andrews (1982: p. 26) concluded that the future of ice            approaches (Section 3); and (iii), numerical modelling (Section 4).
sheet reconstructions “does not rest with a single approach, but                 Note that we do not cover every aspect of reconstructing palaeo-ice
with a multiple approach of reconstructions based on all available               sheets, but focus on methods that are primarily targeted at con-
field and theoretical data”.                                                      straining the extent, thickness and dynamics of ice sheets at the
    Over the last few decades, palaeo-ice sheets have also assumed               regional to continental scale (Fig. 1). We then discuss some key
increasing importance as analogues for assessing recent changes                  challenges for future work (Section 5), emphasizing the need to link
observed in modern ice sheets. The Antarctic and Greenland Ice                   terrestrial and marine records with numerical modelling. In doing
Sheets have, overall, continued to retreat since the early Holocene              so, we evaluate the extent to which Andrews' (1982) invocation for
(Anderson et al., 2002; Alley et al., 2010), and the rate of mass loss           interdisciplinary ice sheet reconstructions has been met.
has increased in recent decades in response to both oceanic and
climatic warming (Shepherd et al., 2012). However, observations of
                                                                                 2. Advances based on glacial geological observations in
present-day ice sheets are often restricted to a few decades and
                                                                                 terrestrial and marine settings
there is a need to understand the longer-term significance of their
recent changes. Numerous workers have, therefore, recognised the
                                                                                 2.1. Formalising glacial inversion techniques using ice sheet flow-
potential that palaeo-ice sheets offer in terms of assessing the
                                                                                 sets
duration and magnitude of ice sheet instabilities that could occur
(e.g. Kleman and Applegate, 2014) and their contributions to sea-
                                                                                    Subglacial processes beneath palaeo-ice sheets created and
level rise (Carlson and Clark, 2012). Moreover, our confidence in
                                                                                 preserved landforms that are the basic ingredients for recon-
future predictions of ice sheet mass balance and sea level rise will
                                                                                 structing their flow patterns and extent. The technique of inverting
benefit from numerical ice sheet models that have been rigorously
                                                                                 the bed imprint to extract ice sheet properties is known as ‘glacial
tested against palaeo-data.                                                                                      € m, 1996; Kleman et al., 2006). The
                                                                                 inversion’ (Kleman and Borgstro
    Since Andrews' pioneering (1982) review, glaciological numer-
                                                                                 burgeoning availability of aerial photography, remote sensing and
ical modelling of palaeo-ice sheets has evolved from hand-tuning
                                                                                 Geographical Information Systems (GIS) in the latter half of the
models against a few constraints to Bayesian methodologies
                                                                                 20th century permitted the systematic mapping of ice sheet beds
involving thousands of observational constraints and dozens of
                                                                                 that yielded benchmark reconstructions of the last mid-latitude ice
calibrated model parameters (Tarasov et al., 2012). In parallel with
                                                                                 sheets (e.g. Boulton et al., 1985; Dyke and Prest, 1987). The pre-
numerical model development, there has been a rapid expansion in
                                                                                 vailing paradigm was that the mapped ice flow indicators (e.g.
the size and qualitative diversity of datasets for constraining ice
                                                                                 drumlins) formed in a radial pattern close to the ice margin and
sheet models (e.g. glacial geological records from both onshore and
                                                                                 mostly during deglaciation (e.g. Boulton et al., 1985). As such, these
offshore, relative sea-level records, glacio-isostatic data, ocean
                                                                                 reconstructions often depicted a radial pattern of flow from one or
sediment records, etc.). Thus, it has become increasingly necessary
                                                                                 more relatively stationary ice domes (Fig. 2a, b). This paradigm was
to forge interdisciplinary collaboration between sub-disciplines
                                                                                 challenged when Boulton and Clark (1990a,b) recognised that the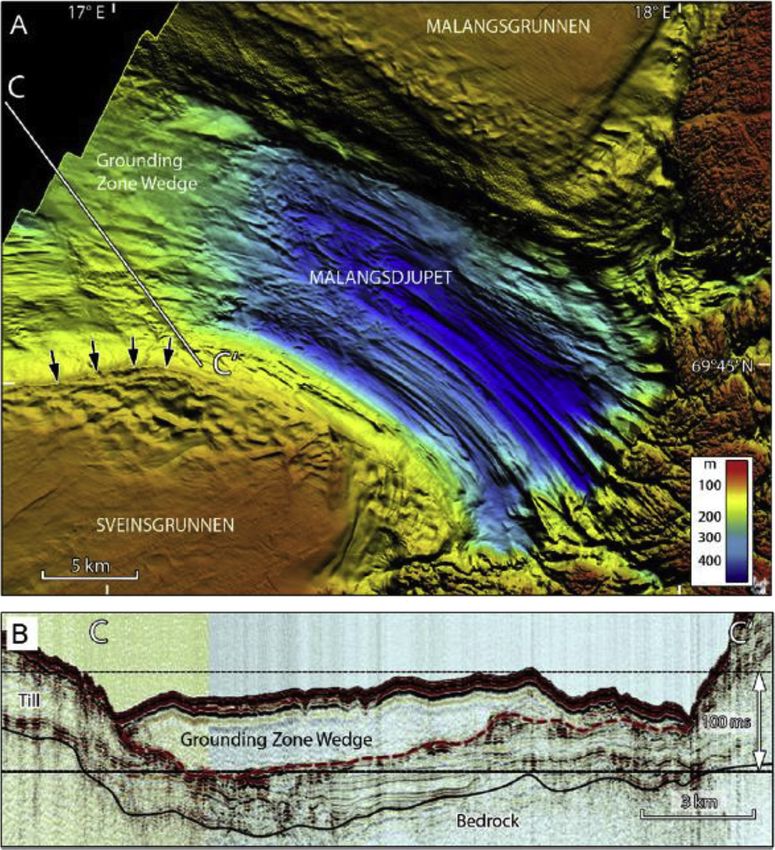
C.R. Stokes et al. / Quaternary Science Reviews 125 (2015) 15e49                                                      17

Fig. 1. Simple schematic of an ice sheet (not to scale) showing some of the key domains and approaches that are used to constrain the extent, thickness and dynamics of ice sheets
at the regional to continental scale. Numbers in brackets refer to sub-sections in the manuscript where recent developments in each of these areas are discussed.

Laurentide Ice Sheet (LIS) bed was a ‘palimpsest’ (relict) landscape                        minimal ice sheet outlines and dispersal centres that provide
of flow patterns of different ages that were not all formed in an ice                        potentially powerful constraints for numerical modelling of ice
marginal environment (Fig. 3). They grouped coherent patterns of                            sheet build-up (Kleman et al., 2010; Stokes et al., 2012).
glacial lineations into discrete mapped units, termed ‘flow-sets’                                Similar inversion methods have been used to reconstruct the
(Fig. 3), and noted how they typically cut across each other,                               pattern and timing of the British-Irish Ice Sheet (BIIS) from ~30 to
allowing them to assign their relative age based on principles of                           15 ka (Clark et al., 2012). A key conclusion was that different sectors
superimposition. In contrast to previous reconstructions (Fig. 2a),                         of the BIIS reached their maximum positions at different times, and
they revealed a highly mobile ice sheet with ice divides and                                that the initiation of ice streaming and calving may have been an
dispersal centres shifting by 1000e2000 km during the last glacial                          important factor in explaining the retreat of marine-based sectors.
cycle, as hinted at in previous records of erratic dispersal trains                         Clark et al. (2012) compared their reconstruction with numerical
(Shilts, 1980).                                                                             modelling of the ice sheet (Boulton and Hagdorn, 2006; Hubbard
    The identification of cross-cutting flow-sets permits detailed                            et al., 2009) and found that, whilst there were broad similarities
reconstructions of changes in ice sheet flow patterns, but flow-sets                          in terms of the extent and the position of ice divides, there were
can also preserve important information with regard to the glaci-                           marked discrepancies in the timing of maximum extent and retreat
ological conditions that formed and preserved them. Kleman and                              phases, which they suggested may be due to the palaeo-climate
Borgstro € m (1996) highlighted the importance of the basal ther-                           forcing, interpreted from the Greenland ice core record. They
mal regime and subglacial hydrology when deciphering the glacio-                            highlighted the need for further data-model integration, and an
dynamic context of flow-set formation, and identified several                                 improved understanding of both calving dynamics and the links
different fan (flow-set) types that could be used to create a time-                          between interior thinning and marginal retreat.
slice sequence of ice sheet evolution (e.g., those formed during a                              One deficiency in the glacial inversion method (Section 2.1) is
surge, or those formed during warm-based deglaciation). An                                  that our process understanding of how various landforms are
exemplar of this inversion methodology is provided in a recon-                              produced remains somewhat limited. However, recent advances in
struction of the Fennoscandian Ice Sheet (FIS) from 115 to 9 ka                             geophysical observations have allowed bedforms to be imaged
(Kleman et al., 1997). Similar to the LIS, their reconstruction                             beneath existing ice sheets at depths of up to 2 km below the ice
depicted ice sheet configurations with shifting ice divides during                           surface (King et al., 2007, 2009; Smith et al., 2007). Specifically,
build-up and decay (Fig. 4).                                                                drumlins appear to be recorded in the onset zone of Rutford Ice
    Implicit in these reconstructions of the LIS (Boulton and Clark,                        Stream, West Antarctica, where ice velocities accelerate from 72 to
1990a,b) and FIS (Kleman et al., 1997) is that some flow-sets re-                            >200 m a1 in the transition from slower ice sheet flow to more
cord ice flow patterns and properties that date to the last glacial                          rapid stream flow (King et al., 2007). Further down the ice stream,
cycle, but predate the Last Glacial Maximum (LGM) and were                                  where velocities increase to around 375 m a1, King et al. (2009)
protected by subsequent cold-based ice. These frozen-bed patches                            reported the presence of mega-scale glacial lineations, which are
span a wide range of spatial scales that can be used to glean in-                           indistinguishable from those reported on palaeo-ice stream beds.
formation about ice sheet dynamics and configuration (Kleman and                             These observations confirm the inference from palaeo-glaciology
Glasser, 2007). In places, they occur as a mosaic of isolated patches                       that bedform elongation is related to ice velocity (Clark, 1993).
or ‘islands’ in upland landscapes, but it is also clear that large                              In summary, new remote sensing and GIS products have led to
frozen-bed areas are prevalent at the ice sheet scale (Kleman and                           major advances in our ability to map changing flow patterns on
Glasser, 2007). Thus, ice directional indicators from earlier stages                        palaeo-ice sheet beds. Glacial inversion methods have allowed
in the last glacial cycle can be pieced together to reconstruct the                         workers to develop a more formal and explicit methodology to
inception and build-up of ice sheets prior to the LGM (Kleman et al.,                       invert the bed record. The resultant reconstructions have allowed
1997). Compared to the record of deglaciation, pre-LGM ice flow                              us to decipher major changes in ice sheet basal thermal regime and
indicators and associated flow-sets are obviously more fragmen-                              ice divide location and migration, both during build-up and decay
tary, but they can be integrated with other evidence (e.g. till stra-                       phases. These empirically-derived reconstructions are an
tigraphy, chronological data) to provide tentative reconstructions of                       improvement on their predecessors, but there remain some
18                                                     C.R. Stokes et al. / Quaternary Science Reviews 125 (2015) 15e49

Fig. 2. Map of modelled ice thickness (metres) and flow-lines of the North American (a) and Eurasian Ice Sheets (b) after Denton and Hughes (1981). Andrews (1982) noted the
mismatch between the single-domed ice sheet configurations and flow patterns inferred from till stratigraphy and erratic dispersal data (e.g. Shilts, 1980), shown in (c).
Figures redrawn from Andrews (1982).

important discrepancies when compared to numerical modelling                              sheet reconstructions were largely based on topographic inference
and secure links between landforms and palaeo-ice dynamics                                (Denton and Hughes, 1981; Dyke and Prest, 1987). Indeed, in rela-
(velocity, thickness, basal shear stress) are difficult.                                   tion to Denton and Hughes’ (1981) hypothesised ice streams,
                                                                                          Andrews (1982: p. 25) noted that “it is not known whether or where
2.2. Identification of palaeo-ice streams                                                  ice streams existed within the Laurentide Ice Sheet”. However, many
                                                                                          of these early inferences were later supported by studies that
    Given the importance of rapidly-flowing ice streams to ice sheet                       identified geological evidence of ice stream activity, such as
mass balance and stability, ice sheet reconstructions that omit their                     distinctive erratic dispersal trains with abrupt lateral margins (e.g.
activity are likely to be deficient (Stokes and Clark, 2001). The dy-                      Dyke and Morris, 1988), convergent flow-set patterns (Punkari,
namic behaviour of palaeo-ice sheets has often been linked to the                         1995), and highly elongate subglacial bedforms termed mega-
activity of ice streams (Denton and Hughes, 1981; Kleman et al.,                          scale glacial lineations (Clark, 1993). Based on the evidence of
1997; Hemming, 2004; Clark et al., 2012), and it has been known                           hypothesised ice streams, and an understanding of their activity in
for some time that ice streaming is the most likely explanation for                       present-day ice sheets, several diagnostic geomorphological
the low ice surface slopes in the marginal areas of some ice sheets                       criteria were proposed to aid their identification (Stokes and Clark,
(Fisher et al., 1985). Therefore, it is perhaps surprising that explicit                  1999).
recognition of ice streaming in glacial inversion techniques is a                             These criteria provide an observational template for identifying
relatively recent development (Kleman and Borgstro          € m, 1996;                    palaeo-ice streams based on their landform record, but other evi-
Stokes and Clark, 1999).                                                                  dence includes large-scale topographic features (such as cross-shelf
    Early attempts at incorporating ice streams in large-scale ice                        troughs and trough mouth fans: Section 2.3). As a result of new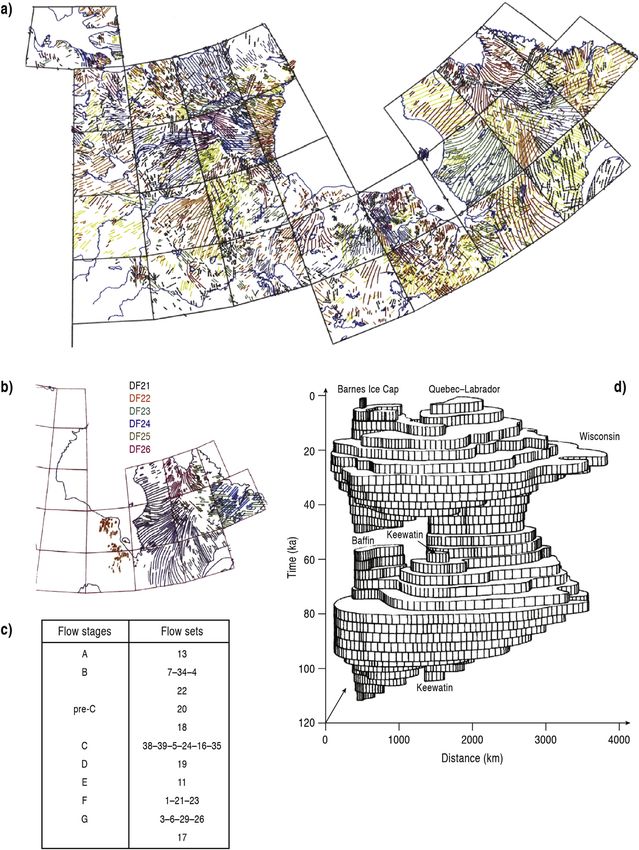
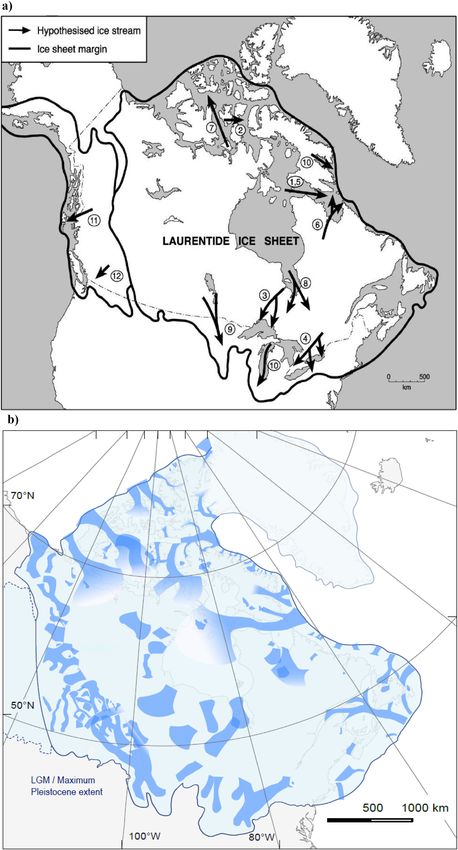
C.R. Stokes et al. / Quaternary Science Reviews 125 (2015) 15e49                                                    19

Fig. 3. (a) Multiple cross-cutting flow-sets (colours used arbitrarily to show different flow-sets) from the central part of the Laurentide Ice Sheet mapped by Boulton and Clark
(1990b), including close-up in (b). These flow-sets are numbered (e.g. DF21, DF22 in (b)) and stacked into relative age sequence (flow-stages) (c) using cross-cutting relation-
ships, and reveal a highly mobile ice sheet reconstruction, which shows the areal extent of the ice sheet through time in (d). Figures redrawn from Boulton and Clark (1990b).

satellite and digital elevation products, there has been a huge in-                        1988; Stokes et al., 2009).
crease in the number of inferred ice streams (Fig. 5), such that we                           Despite much progress identifying soft-bedded ice streams,
now have a good knowledge of their location in most palaeo-ice                             understanding the evolution of bedrock landforms in both inter-
sheets (Clark et al., 2012; Livingstone et al., 2012a; Margold et al.,                     stream and ice stream areas is more challenging, with features
2015). Moreover, recent work has revealed abrupt changes in the                            probably developing over multiple glacial cycles (Roberts and Long,
trajectory of palaeo-ice streams, known as ‘flow switching’                                 2005). Nonetheless, recent progress has been made in identifying
(Dowdeswell et al., 2006; Winsborrow et al., 2012), which has also                         the landform assemblage of ‘hard-bedded’ ice streams, with rock
been reported from observations of present-day ice sheets (Conway                          drumlins, mega-flutes and mega-lineated terrain interpreted to
et al., 2002) and numerical modelling (Payne and Dongelmans,                               reflect accelerated abrasion and quarrying of bedrock under
1997). Thus, reconstructions of palaeo-ice stream activity provide                         rapidly-flowing ice (Eyles, 2012).
new insights into the long-term behaviour of ice streams (and their                           The marine geological record also preserves evidence of palaeo-
potential forcing) and often help reconcile complex cross-cutting                          ice streaming in the form of episodic layers of ice-rafted detritus
flow-set patterns (discussed in Section 2.1) (Dyke and Morris,                              (IRD), the most conspicuous of which were deposited during
20                                                      C.R. Stokes et al. / Quaternary Science Reviews 125 (2015) 15e49

Fig. 4. Application of Kleman and Borgstro€ m's (1996) glacial inversion of flow-sets (fans) to the Fennoscandian Ice Sheet, from Kleman et al. (2006). Different fan types are
‘unfolded’ to produce a time-slice sequence of ice sheet evolution that spans from 115 to 9 ka.

Heinrich events (Heinrich, 1988; Hemming, 2004; Section 2.7).                              generally low sedimentation rates, it has been suggested that some
Andrews and Tedesco (1992) attributed the carbonate-rich IRD                               events sourced from the Canadian Arctic Archipelago are broadly
layers associated with the two most recent Heinrich events (H1 and                         correlative with the North Atlantic's Heinrich events (Darby et al.,
H2) to a source area eroded by an ice stream in Hudson Strait                              2002). The possibility of large-scale ice sheet reorganisations dur-
(Andrews and MacLean, 2003). Ironically, terrestrial glacial geologic                      ing Heinrich events has also been hinted at from records of
evidence for the existence of this ice stream is relatively scarce                         terrestrial ice streams at the southern margin of the LIS (Mooers
compared to other ice streams (Margold et al., 2015), but it is often                      and Lehr, 1997), but this concept has received little attention.
implicated in Heinrich events, despite uncertainty over the precise                        Numerous studies have also examined potential correlations be-
mechanisms through which debris becomes entrained within ice-                              tween LIS IRD events and meltwater and IRD events from other
bergs and subsequently released (Hemming, 2004). That said, nu-                            mid-latitude ice streams bordering the North Atlantic (Lekens et al.,
merical modelling has been able to reproduce the episodic activity                         2006, 2009), although there is much uncertainty about whether
of this ice stream at the appropriate time-scales (MacAyeal, 1993;                         IRD events from the eastern LIS have correlatives from other ice
Marshall and Clarke, 1997; Calov et al., 2010), and coupled                                sheets (e.g. Fronval et al., 1995; Dowdeswell et al., 1999; Hemming,
iceberg transport/melt and climate modelling can generate IRD                              2004; Rashid et al., 2012; see also Section 2.7).
layers of sufficient thickness (Roberts et al., 2014), assuming rela-                          To summarise, recent advances have permitted the identifica-
tively small (0.04 Sv over 500 years) iceberg discharge from Hudson                        tion of numerous palaeo-ice stream tracks, and inventories of their
Strait. The cause of Heinrich events, however, remains open to                             location during deglaciation are probably close to complete for
debate (see Section 2.7).                                                                  some ice sheets (e.g., for the Laurentide Ice Sheet, where >100 ice
    Recent advances in sediment provenance techniques highlight                            streams have been identified: Margold et al., 2015). These records
the potential to further constrain episodes of ice stream activity                         attest to major changes in their spatial extent during deglaciation,
using ocean sediment records (Darby and Bischof, 1996; Andrews                             but there have been few attempts to compare reconstructions of
and Eberl, 2012). Some studies have focussed on potential correl-                          palaeo-ice stream activity with output from numerical ice sheet
ative events from smaller ice streams at the eastern margin of the                         models. In contrast, modelling has been used to simulate the
LIS, such as those draining into Baffin Bay (Andrews et al., 1998,                          behaviour of individual ice streams, especially in relation to the IRD
2012) or the continental shelf off Nova Scotia (Piper and Skene,                           record, which provides a valuable tool to explore the history of ice
1998). Further afield, IRD events have also been detected in the                            streams prior to the LGM.
Arctic Ocean (Darby et al., 2002; Darby, 2003) and attributed to
source areas in the Canadian Arctic Archipelago (Stokes et al., 2005)                      2.3. Offshore geophysical evidence of ice sheet extent and dynamics
and Eurasia (Spielhagen et al., 2004). Although obtaining precise
ages for Arctic Ocean IRD events remains difficult because of                                   A major development in ice sheet reconstructions has been the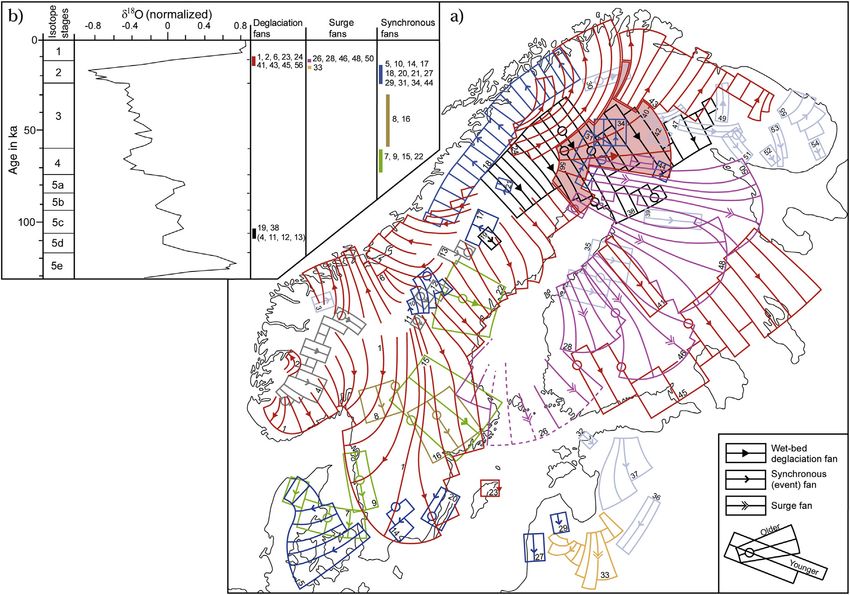
C.R. Stokes et al. / Quaternary Science Reviews 125 (2015) 15e49                                                      21

Fig. 5. The number of hypothesised ice streams has grown rapidly over recent years, with those in the Laurentide Ice Sheet increasing from 10 (black arrows) that were reviewed by
Stokes and Clark (2001) in (a), to over 100 (blue shading) in the latest inventory compiled by Margold et al. (2015) in (b).
22                                             C.R. Stokes et al. / Quaternary Science Reviews 125 (2015) 15e49

increased use of geophysical techniques (seismic, sidescan sonar,                 extent across continental shelves and submarine ridges has led to
swath bathymetry) to investigate the marginal areas of palaeo-ice                 major advances in our understanding of the dynamics of palaeo-ice
sheet beds that are now submerged beneath sea level (O       Cofaigh,            sheet margins, which numerical modelling can now target. Re-
2012). Imagery from continental slopes has revealed sedimentary                   constructions of palaeo-ice shelves have seen some major ad-
depocentres (trough mouth fans: Vorren and Laberg, 1997;                          vances, but they are more difficult to constrain, especially in terms
Batchelor and Dowdeswell, 2014), the architecture of which often                  of their timing and spatial extent (see also Section 4.3).
indicates rapid, episodic sedimentation by ice streams
(Dowdeswell et al., 1996; Dowdeswell and Elverhoi, 2002; Nygård                   2.4. Subglacial hydrology of ice sheets and subglacial lakes
et al., 2007). Indeed, dating of sediment packages is an important
constraint on ice stream activity that is not easily available from                   Glacial geological features relating to subglacial hydrology can
terrestrial records, and some marine records extend back through                  provide useful information relating to, for example, ice sheet basal
several glacial cycles (Nygard et al., 2007).                                     thermal regime and the distribution and drainage of water at the
    Sediment depocentres are often associated with major troughs                  bed. Eskers are particularly useful in glacial inversion techniques
carved across the continental shelf (e.g. Batchelor and Dowdeswell,               (Section 2.1) and are generally thought to form time-
2014). Swath bathymetry data from within these troughs (Fig. 6)                   transgressively within a few tens of kilometres of the retreating
commonly reveals geomorphology which fulfils the criteria for                      ice margin (Kleman et al., 1997, 2006, 2010; M€        akinen, 2003;
palaeo-ice streams, similar to those described in terrestrial settings            Storrar et al., 2014a). Clark and Walder (1994) showed that es-
(Anderson et al., 2002; Ottesen et al., 2005, 2008; Livingstone et al.,           kers from the LIS were concentrated over the impermeable crys-
2012a). Together with sub-bottom profiling and seismic in-                         talline bedrock of the Canadian Shield, where subglacial
vestigations, geophysical techniques have the added advantage of                  meltwater was more likely to carve R-channels into the base of the
being able to map seafloor morphology and changes in sediment                      ice. In contrast, over softer permeable sediments, meltwater was
thickness across large areas (Dowdeswell et al., 2004). The seaward               more likely to drain into and across the till, carving much shal-
extent of glacial till and sub-ice morphology has also been used to               lower channels or ‘canals’ in a more distributed system (Sjogren
constrain the thickness of ice sheets at their marine margins                     et al., 2002). This broad pattern is also seen in the FIS (Boulton
(Polyak et al., 2001; Jakobsson et al., 2010; Dowdeswell et al., 2010;            et al., 2009) and, while eskers can clearly form over softer sedi-
Niessen et al., 2013).                                                            mentary beds, they are typically less common and depict a more
    A major contribution of submarine geophysical evidence has                    chaotic and fragmentary pattern (Shilts et al., 1987; Storrar et al.,
been the recognition that palaeo-ice sheets were more extensive                   2014a). More recently, Storrar et al. (2014b) showed that the
than previously thought, with almost all of the mid-latitude                      number of eskers increased during deglaciation of the LIS across
Northern Hemisphere ice sheet maximal margins now known to                        the Canadian Shield, coinciding with increased rates of ice margin
have reached the continental shelf edge, with particular attention                retreat during climatic warming. This is reminiscent of the sea-
focussed on the Arctic Ocean (Fig. 7). In the last decade alone, there            sonal evolution of drainage systems in much smaller valley gla-
are cases where margins have been revised and extended to the                     ciers (Hubbard and Nienow, 1997) and implies that drainage
edge of the continental shelf for the Laurentide and Innuitian Ice                systems (and therefore subglacial lubrication) evolve over
Sheets, the Eurasian Ice Sheet (including the Fennoscandian,                      millennial time-scales.
Barents Sea and British-Irish Ice Sheets), and the Greenland Ice                      An important advance in our understanding of the subglacial
Sheet (e.g. Ottesen et al., 2005; Shaw et al., 2006; Bradwell et al.,             hydrological system beneath ice sheets has been the discovery of
2008; England et al., 2009; O    Cofaigh et al., 2013). In particular,           numerous subglacial lakes. They were first identified beneath the
advances in high-latitude seafloor mapping in the 1990s, espe-                     Antarctic Ice Sheets in the 1960s (Robin et al., 1970), but several
cially high resolution multibeam mapping, have helped elucidate                   hundred have now been detected (see Wright and Siegert, 2011).
the glacial history of the Arctic Ocean (reviewed in Jakobsson et al.,            They are thought to be an active component of the subglacial hy-
2014). A series of investigations have documented evidence for                    drological system, with the potential to fill and drain, and exert an
extensive erosion of the Arctic Ocean seafloor caused by ice at                    important influence on ice dynamics (Fricker et al., 2007; Smith B.E.
modern water depths of up to 1000 m, as well as glacial landforms                 et al., 2009; Wright and Siegert, 2011).
on individual ridge crests and plateaus where water depths are                        Until recently, subglacial lakes had mainly been investigated
shallower (Vogt et al., 1994; Jakobsson, 1999; Polyak et al., 2001).              under present-day ice sheets and examples of putative palaeo-
These data, together with chronological information retrieved                     subglacial lakes were rare (e.g. McCabe and O       Cofaigh, 1994;
from sediment cores, have been taken to imply that the most                       Munro-Stasiuk, 2003; Christoffersen et al., 2008). This is,
extensive ice shelf complex existed in the Amerasian basin of the                 perhaps, surprising because access to the sediments and land-
Arctic Ocean during Marine Isotope Stage (MIS) 6 (Jakobsson et al.,               forms associated with palaeo-subglacial lakes is relatively easy
2010, 2014).                                                                      compared to extant ice sheets. However, despite recent attempts
    Large seabed scour marks have also been reported at modern                    to formulate diagnostic criteria to identify their presence (e.g.
water depths of ~600 m along the northern Svalbard margin and                     Bentley et al., 2011; Livingstone et al., 2012b) it is difficult it to
across the Yermak Plateau (Vogt et al., 1994; Dowdeswell et al.,                  distinguish their geological signature from former proglacial (ice-
2010) as well as at depths of ~1000 m on Morris Jesup Rise                        marginal or ice-fed) lakes. Nonetheless, there is strong theoretical
(Jakobsson et al., 2010) (Fig. 7). Similar scour marks and, in places,            support for their existence (e.g. Shoemaker, 1991; Livingstone
glacial bedforms such as flutings and mega-scale glacial lineations                et al., 2012b, 2013) and palaeo-ice surface and bed topographies
have also been used to invoke the presence of extensive and thick                 can be used to calculate 3-D hydraulic potential surface (Shreve,
ice sheets and ice shelves along the Chukchi Borderland (Jakobsson                1972). Evatt et al. (2006) were the first to consider this method
et al., 2005; Dove et al., 2014) and southern Mendeleev Ridge                     at the ice-sheet scale and predicted where subglacial lakes might
(Niessen et al., 2013), which require revisions of glacial Arctic ice             have formed under the LIS at the LGM. A similar approach was
cover (Jakobsson et al., 2014). More localised ice shelves have also              adopted by Livingstone et al. (2013), who used an ensemble of ice-
been hypothesised, often in association with ice streams (e.g.                    sheet model outputs to explore the likelihood of subglacial lake
Hodgson, 1994).                                                                   formation under the Cordilleran, Laurentide and Innuitian ice
    Taken together, geophysical evidence of ice sheet and ice shelf               sheets (Fig. 8).
C.R. Stokes et al. / Quaternary Science Reviews 125 (2015) 15e49                                                     23

Fig. 6. (a) Multi-beam bathymetric data showing a submarine palaeo-ice stream bed (ice flow bottom right to top left) in Malangsdjupet, northern Norway (from Ottesen et al.,
2008). This cross-shelf trough exhibits many of the geomorphological criteria for identifying palaeo-ice streams (Stokes and Clark, 1999), including a convergent onset zone
feeding into a main trunk characterised by mega-scale glacial lineations with abrupt lateral margins and ice stream shear margin moraines (black arrows); (b) Seismic data across
the grounding zone wedge (100 m s ¼ ~90 m on the vertical axis).

    Subglacial lakes can drain rapidly towards the ice margin (as                           Hewitt, 2011; Werder et al., 2013), but which has generally been
 €kulhlaups), sometimes on sub-annual timescales (Smith et al.,
jo                                                                                          under-used.
2009). Knowledge of the geomorphological and sedimentological                                  In summary, meltwater landforms are, perhaps, under-used in
impact of such drainage events is still in its infancy but, for                             terms of understanding the source, routing, and storage of melt-
example, the ‘Labyrinth’, an anastomosing network of channels in                            water associated with palaeo-ice sheets. Eskers provide important
the Dry Valleys (Antarctica), is thought to have formed by periodic                         information about subglacial drainage patterns at the ice sheet
subglacial lake drainage events (Denton and Sugden, 2005). Gravel-                          scale and how it evolves through time, but meltwater channels
boulder outwash fans at the mouth of tunnel valleys in North                                carved into bedrock are more enigmatic. Numerical ice sheet
America have also been related to large magnitude subglacial                                models have proved an important tool for identifying the potential
meltwater outbursts (Cutler et al., 2002). There is also an extensive                       location of subglacial lakes, but there have been few attempts to
literature and long history on proposed subglacial (mega-) flood                             integrate a palaeo-glaciological understanding of subglacial hy-
tracts (e.g. Shaw, 2002), which have been linked to large palaeo-                           drology into numerical modelling of ice sheets.
subglacial lake outburst events (Shoemaker, 1991, 1999). However,
in some cases, the use of subglacial bedforms (e.g. drumlins, ribbed                        2.5. Proglacial hydrology of ice sheets and proglacial lakes
moraine) to delineate flood pathways is more controversial (e.g.
Clarke et al., 2005). The pattern of tunnel valleys, subglacial melt-                          Ice sheet reconstructions have used ice-marginal meltwater
water channels, and other meltwater-related features, are useful for                        channels, spillways, glacial lake shorelines and deltas, to trace
constraining palaeo-subglacial lakes and elucidating how they                               former ice margins and reconstruct ice retreat patterns (Kleman,
interact with the subglacial hydrological system. More generally,                           1992; Jansson, 2003; Kleman et al., 2006; Greenwood et al., 2007;
the imprint of meltwater drainage recorded on the bed of former                             Margold et al., 2013a, b). These landforms are particularly impor-
ice sheets is a potentially useful test of numerical models that                            tant in areas of formerly cold-based ice that prevented the forma-
predict the configuration of the subglacial hydrological system (e.g.                        tion of glacial lineations or eskers (Kleman, 1992). Improved spatial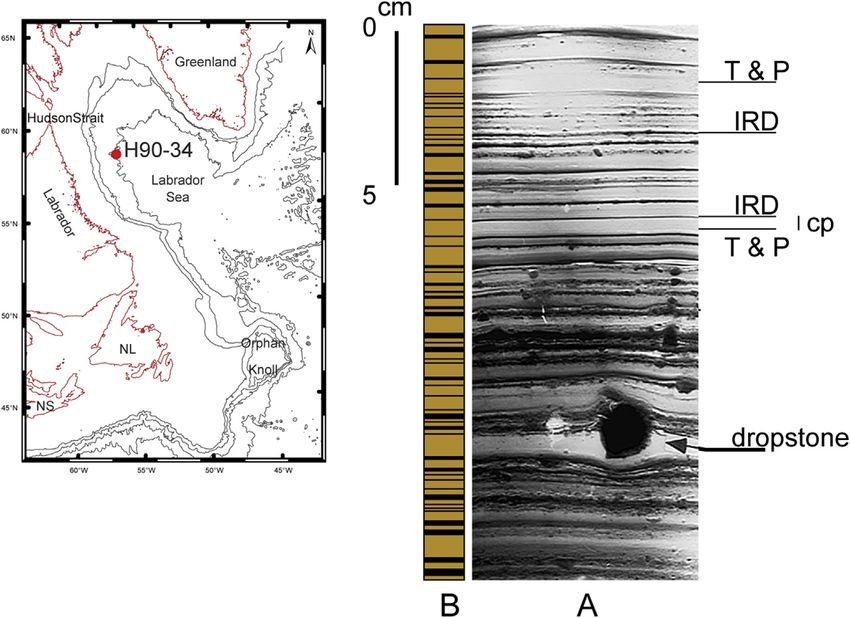
24                                                       C.R. Stokes et al. / Quaternary Science Reviews 125 (2015) 15e49

Fig. 7. Maximum Quaternary extent (white line; dashed in areas of uncertainty) of the Eurasian (MIS 6: Svendsen et al., 2004), Greenland (MIS 2: Ehlers and Gibbard, 2004),
Innuitian and Laurentide (MIS 2: Dyke et al., 2002), and Cordilleran ice sheets (Pleistocene maximum from Manley and Kaufman, 2002) in the high Arctic from Batchelor and
Dowdeswell (2014) displayed on IBCAO bathymetric data (Jakobsson et al., 2012), with place names (WI ¼ Wrangel Island; MR ¼ Mendeleev Ridge; SZ ¼ Severnaya Zemlya;
FJL ¼ Franz Josef Land; YP ¼ Yermak Plateau; FS ¼ Fram Strait; MJR ¼ Morris Jesup Rise; NS ¼ Nares Strait; QEI ¼ Queen Elizabeth Islands; BB ¼ Baffin Bay; CB ¼ Chukchi Borderland;
LR ¼ Lomonosov Ridge). Figure modified from Batchelor and Dowdeswell (2014).

resolution of satellite imagery and Digital Elevation Models, and                           (Rooth, 1982; Teller et al., 2002; Barber et al., 1999; Spielhagen et al.,
better access to high-resolution data in readily available platforms                        2004; Mangerud et al., 2004; Peltier et al., 2006; Carlson and Clark,
such as Google Earth, have facilitated investigation of proglacial                          2012). However, the discharge and location of water overflowing
meltwater landforms over large areas (Margold and Jansson, 2012)                            from these lakes varied as ice retreated from various basins, thereby
and the incorporation of glacial lake shorelines and deltas into ice                        opening new outlets (Teller and Thorleifson, 1983; Teller, 1987;
sheet reconstructions (Jansson, 2003; Clark et al., 2012).                                  Smith and Fisher, 1993; Smith, 1994; Mangerud et al., 2001,
   In relation to ice marginal meltwater features, it has long been                         2004). Records of pre-LGM proglacial lakes (and drainage) must
known that large proglacial lakes formed around some margins of                             have been equally complex, but most of that record has been
palaeo-ice sheets as they retreated (e.g. Upham, 1895; Leverett,                            eroded or is fragmentary and buried, and is likely to only be
1902). The routing of lake overflows and meltwater is important                              discernible in ocean sediment records (Nicholl et al., 2012).
because of the potential impact on ocean circulation and climate                               Despite recent progress in reconstructing the history of
C.R. Stokes et al. / Quaternary Science Reviews 125 (2015) 15e49                                                         25

Fig. 8. Modelled subglacial lake likelihood map for the North American Ice Sheet Complex from 32 to 6 ka from Livingstone et al. (2013). F is the flotation criteria which is the ratio
of non-local, subglacial water pressure to ice overburden pressure (i.e., if F ¼ 1, the water pressure is at the ice-overburden pressure). White line shows ice extent from Dyke et al.
(2002). Pink circles refer to published palaeo-subglacial lake records: CB ¼ Christie Bay, Great Slave Lake; ML: McGregor Lake; TL: Travers Lake; OK: Okanagon.

proglacial lakes, many challenges remain, especially concerning                               its drainage history between these two end-points has been the
one of the world's largest ice-marginal lakes fringing the decaying                           subject of much debate, particularly in association with the abrupt
LIS: glacial Lake Agassiz (GLA). The extent of the lake varied                                cold reversal of the Younger Dryas (YD). It has been argued that
through time, covering a total area >1 million km2 during its ~6000                           overflow from GLA may have triggered the YD stadial, but there is
year history, and overflowing at various times to the Gulf of Mexico,                          uncertainty as to whether it overflowed to the east, to the north-
the North Atlantic, the Labrador Sea (including its final drainage via                         west, or did not overflow at all (Lowell et al., 2009; Fisher and
Hudson Bay), and the Arctic Ocean (Teller, 1987; Teller and                                   Lowell, 2012; Lowell et al., 2013; Teller, 2013). Opinions differ
Leverington, 2004) (Fig. 9). GLA serves as a useful case study                                about precise timing and routing of GLA overflow during the YD,
because it highlights the potential difficulty of constraining the                             because different approaches often yield different interpretations
continental scale drainage re-routings of proglacial lakes.                                   (e.g. de Vernal et al., 1996; Tarasov and Peltier, 2005; Carlson et al.,
    Its outlet chronology has been reconstructed using: (1) the                               2007; Murton et al., 2010; Not and Hillaire-Marcel, 2012; Cronin
location of the changing LIS margin (Dyke, 2004; Lowell et al.,                               et al., 2012; Carlson and Clark, 2012). In a recent review, Carlson and
2009); (2) the dating of beaches that define the lake's outline                                Clark (2012) favoured an easterly route, but numerical modelling
(e.g. Teller et al., 2000; Lepper et al., 2013); (3) data-calibrated                          suggests a large influx of freshwater into the Arctic Ocean was more
numerical ice sheet modelling (Tarasov and Peltier, 2006); (4) the                            likely (although not necessarily from GLA: Tarasov and Peltier,
palaeo-topography of the basin inferred from isostatic rebound                                2005), and would have had a more significant impact on ocean
(e.g. Leverington et al., 2000, 2002; Rayburn and Teller, 2007); and                          circulation (Condron and Winsor, 2012). Several studies of deep-sea
(5) the dating of meltwater events in the different outlet channels,                          Arctic oxygen isotopes (Spielhagen et al., 2004), faunal assemblages
and in lakes and oceans beyond the channel mouths (Section 2.6),                              (Hanslik et al., 2010; Taldenkova et al., 2013), and other proxies
including the use of deep sea oxygen isotope records and distinctive                          (reviewed in Carlson and Clark, 2012) provide evidence for signif-
sediment discharge to identify meltwater pulses (Fisher, 2007;                                icant meltwater discharge through the Mackenzie River at the
Hillaire-Marcel et al., 2008; Lowell et al., 2009; Lewis et al., 2012;                        onset of the YD (see also Section 2.6), as does an OSL-dated
Fisher and Lowell, 2012; Teller, 2013).                                                       sequence at the mouth of the Mackenzie River (Murton et al.,
    Whilst it is generally agreed that GLA initially drained south into                       2010). However, Fisher and Lowell (2012) argued that, in the
the Gulf of Mexico (along the Mississippi River), and finally drained                          Agassiz basin and headwaters of the Mackenzie River (e.g. near Fort
north-east into Hudson Bay (Barber et al., 1999; Clarke et al., 2004),                        McMurray, Alberta), field data are lacking to support Agassiz water
26 C.R. Stokes et al. / Quaternary Science Reviews 125 (2015) 15e49
Fig. 9. Total area covered by large proglacial lakes in North America (grey) during the last retreat of the LIS (from Teller, 2004, Fig. 1, after Teller, 1987). Major continental divides
shown by dash-dot lines. Names of the major lakes are shown in the region where they formed. Major overflow routes from lakes are shown by arrows; letters identify their names
as follows: A ¼ Chicago outlet, B ¼ Wabash River Valley, C ¼ Mohawk Valley, D ¼ Hudson Valley, E ¼ Grand River Valley, F ¼ Port Huron outlet, G ¼ Fenelon Falls outlet, H ¼ North
Bay outlet, I ¼ Temiskaming outlet, J ¼ Duluth outlet, K ¼ Minnesota River Valley, L ¼ Kaminiskwia outlet, M ¼ eastern Agassiz outlets, N ¼ Clearwater outlet. Extent of proglacial
lakes in Hudson Bay Lowland and St. Lawrence Lowland are not shown where lacustrine sediments are now buried by marine sediment.
being routed to the northwest at this time. Murton et al., 2010). In places, these surfaces and associated geo-
A major impediment to understanding the history of proglacial morphology may also extend offshore (Blasco et al., 1990).
lakes (including GLA) has been the lack of dating control on In summary, ice marginal meltwater landforms (meltwater
shorelines, although optically stimulated luminescence dating channels, spillways, shorelines) are an important ingredient for
(Section 3.2) has seen success (e.g., Lepper et al., 2013). The dating glacial inversion techniques, especially where other evidence is
of lake spillway channels can also help to constrain the timing of scarce. In recent years they have taken on added importance for
lake overflow (e.g. Fisher, 2003, 2007; Fisher et al., 2008). Difficulty identifying the extent of large proglacial lakes and meltwater
remains in obtaining maximum ages for spillways in recently routing, and their associated impacts on the ocean-climate system.
deglaciated areas, and in situations where floods may occur sub- Despite much progress, however, it remains difficult to precisely
glacially or cut through stagnant ice (Clarke et al., 2004). None- date marginal drainage or outburst floods or even continental scale
theless, shore-line records can be a powerful constraint for drainage re-routings; and so it has often proved difficult to recon-
numerical modelling of meltwater runoff from ice sheets (as well as cile the terrestrial and marine records of meltwater routing. Nu-
providing further constraint on deglacial ice sheet evolution) in merical modelling offers an important constraint on the likely
models that explicitly resolve proglacial lakes (see Fig. 9 in Tarasov volumes of water delivered by ice sheets, but the resolution of ice
et al., 2012). margin chronologies is not yet capable of resolving the precise
Over and above changes in baseline runoff related to changes in routing through various spillways and there remains a challenge in
melting of the LIS and precipitation, there were occasional short- deciphering what fraction of a given lake is released via baseline
term hydrological spikes that may have also impacted on ocean drainage or through major outburst floods.
circulation (Rooth, 1982; Barber et al., 1999; Condron and Winsor,
2012). Any catastrophic lake outbursts should also leave a 2.6. Detection of glacial lake outburst events in near-shore marine
geomorphological imprint, and there are well-documented exam- records
ples from North America, Fennoscandia and Russia (Bretz, 1923;
Teller and Thorleifson, 1983; Baker and Bunker, 1985; Smith and Since suggestions that the addition of freshwater from glacial
Fisher, 1993; Murton et al., 2010; Margold et al., 2011). In some lake outbursts may have disrupted ocean circulation (e.g. Rooth,
distal locations, one might also expect to find dateable material, 1982; Broecker et al., 1989), palaeoceanographers have been
such as regional erosional surfaces associated with lag deposits (e.g. searching marine sediment records for evidence of freshwaterC.R. Stokes et al. / Quaternary Science Reviews 125 (2015) 15e49 27
discharge events that might complement terrestrial records (Sec- hydrological changes are ambiguous (Poore et al., 1999), whereas in
tion 2.5). Their detection is, however, complicated by several fac- more proximal regions of the Chukchi and Beaufort Seas off North
tors, most notably marine sediment processes, the proximity of America, a number of independent proxy methods provide clearer
core sites to ice sheet margins (and their associated glacial lakes), evidence for deglacial hydrological changes (Andrews and Dunhill,
and the proxies used to infer hydrologic changes (mainly in salinity 2004; Polyak et al., 2007). There is also geophysical (submarine
and temperature) (de Vernal and Hillaire-Marcel, 2006). Along incised valleys) and stratigraphic evidence on the Chukchi Margin
continental margins, close to where these pulses of water entered for deglacial ice-rafting and lake drainage, possibly from Alaska's
the ocean, sedimentary and hydrological processes include a mix of Glacial Lake Noatak, that cannot be accounted for by river discharge
turbidity currents, surface and intermediate meltwater plumes and or precipitation changes (Hill and Driscoll, 2008). Off Siberia, sed-
IRD. In more distal open-ocean regions, meltwater plumes or only iments from the Laptev Sea indicate major hydrological changes
IRD will be recorded (O Cofaigh and Dowdeswell, 2001; Eyles and during the last deglaciation (around 12.9 ka), perhaps from Lena
Lazorek, 2007). The sensitivity of microfaunal and isotopic prox- River discharge (Spielhagen et al., 2005; Taldenkova et al., 2013).
ies will also vary with proximity to meltwater sources. In summary, these few examples illustrate the huge potential to
This complexity means that it is often difficult to unequivocally utilise a variety of evidence from continental shelves and slopes to
identify glacial lake discharge in open ocean sediment records due constrain ice sheet dynamics and runoff. This includes the inte-
to low sediment accumulation rates and uncertainty surrounding gration of submarine geophysical, chronological (e.g. radiocarbon
oceanographic response. For example, there is clear lithological dating, varves), sedimentological (e.g. IRD), microfaunal (e.g. fora-
evidence (red clay layer, spikes in detrital carbonate) for drainage of minifera, ostracodes dinoflagellates), and geochemical proxies
the final phase of GLA ~ 8.5e8.2 ka (glacial Lake Ojibway: Fig. 9) (usually oxygen isotopes). Among the many remaining challenges
through Hudson Strait (Andrews et al., 1995, 1999; Kerwin, 1996; in detecting specific abrupt discharge events, chronology ranks
Barber et al., 1999; Hillaire-Marcel et al., 2007; Jennings et al., highest because it remains difficult to distinguish short-lived,
2015). The lithological signature is lost to bioturbation in distal catastrophic outbursts, most evident in spikes in stable isotope
settings, but oxygen isotopic evidence for this event extends to the records, from hydrological changes due to more progressive influx
Laurentian Fan and continental slope north of Cape Hatteras of glacial meltwater (i.e longer-term baseline flows).
(Keigwin et al., 2005). In contrast, in the deep western Labrador Sea
there is a detrital carbonate spike but no isotopic signature 2.7. Heinrich events and associated meltwater plumes
(Hillaire-Marcel et al., 2007, 2008).
Recent studies of near-shore regions provide more concrete Glacial intervals are characterised by Heinrich events that, sensu
evidence for hydrological signals of abrupt drainage of glacial lake stricto, are identified by a sudden increase in the coarse lithic
water than those from open ocean sites. In the outer St Lawrence fraction, a dominance of the polar planktonic foraminifera Neo-
Estuary, there is microfaunal and geochemical evidence for hy- globoquadrina pachyderma(s), and a lowering of inferred sea-
drological changes, possibly caused by GLA drainage, near the onset surface salinity (Heinrich, 1988; Bond et al., 1993). For the past
of the Younger Dryas ~13 ka (Rodrigues and Vilks, 1994; Keigwin two decades, these events have highlighted the limits of our un-
and Jones, 1995; de Vernal et al., 1996; Carlson et al., 2007). In derstanding with respect to reconstructing ice sheet dynamics and
the central St. Lawrence Lowlands and the Lake Champlain Basin to their links to the ocean-climate system (Hemming, 2004).
the south (regions that are closer to the LIS margin and mid- The original definition of Heinrich layers was based on IRD in
continental proglacial lakes), the evidence is even more the central North Atlantic (Ruddiman, 1977; Heinrich, 1988), but
convincing. Geomorphological evidence from isostatically uplifted their sedimentary signature in the Labrador Sea changes with
lake and marine shorelines and high-resolution (up to ~ distance from Hudson Strait, and is significantly different from that
0.1e0.8 cm a1) lacustrine and marine stratigraphic records (Franzi observed distally. Close to Hudson Strait, the layers are up to several
et al., 2007) from glacial Lake Vermont and Champlain Sea sedi- metres thick. IRD abundance shows high-frequency internal vari-
ments provide a nearly-continuous record of LIS retreat from ~13.5 ations within the Heinrich layers, with two abundance maxima at
to ~10 ka. Evidence points to six regional lake drainage events from the base and the top separated by cyclic deposits of mud turbidites,
these lakes between 13.3 and 10 ka, originating in the St. Lawrence/ meltwater plume deposits (rapid deposition of hemipelagic sedi-
Champlain and OntarioeErie lowlands (Lakes Vermont, Iroquois), ment) and IRD beds (Rashid et al., 2012). Such internal variations
modern Lake Huron (Lake Algonquin), and the interior plains (Lake are less striking moving southwards, as the thickness of Heinrich
Agassiz) (Rayburn et al., 2005, 2007; Cronin et al., 2008, 2012). layers decreases and IRD abundance shows less variation. The
These events involved volumes of lake waters ranging from hun- succession of turbidites, meltwater plume deposits and IRD beds
dreds to thousands of km3 (Teller et al., 2002) and at least three are organized as couplets (Fig. 10) (Hesse and Khodabakhsh, 1998)
events correlate with abrupt millennial scale climate events and are similar to seasonal cycles recognised in the Bay of Biscay by
recognized in Greenland ice cores and other proxy records: the Zaragosi et al. (2006). Dispersed drop clasts and pellets within the
Intra-Allerød Oscillation (~13.3 ka), the YD (12.9e13.1 ka), and turbidite layers suggest that ice calving occurred at the same time
Preboreal Oscillation (~11.2e11.5 ka) (Rayburn et al., 2011; Katz as meltwater supply. High resolution sedimentary records from the
et al., 2011). Bay of Biscay also show a similar pattern for meltwater events, with
As noted above (Section 2.5), GLA drainage through the Mack- turbidites attributed to meltwater during warm periods, and IRD
enzie River at the onset of the Younger Dryas has been proposed as beds topping the turbidites during cold periods (Zaragosi et al.,
an alternative route to the St. Lawrence on the basis of modelling 2006; Toucanne et al., 2009; Roger et al., 2013). Thus, Heinrich
(Tarasov and Peltier, 2005) and dating of Mackenzie delta sands and events appear to involve seasonal meltwater discharge and iceberg
upstream gravels and erosional channels (Murton et al., 2010). Here calving, similar to that seen at modern glacier outlets.
too, there is a contrast between the temporal resolution of central The volumetric importance of meltwater plume deposits in
Arctic marine sediment records and those along Arctic continental proximal Heinrich layers means that Heinrich events cannot be
margins. Sedimentation rates on the Lomonosov, Mendeleev and interpreted only in terms of iceberg supply and rates of iceberg
Northwind Ridges average roughly 0.5e2 cm ka1, while those on melting (Andrews and MacLean, 2003; Roche et al., 2004). Indeed,
continental margins are 2e3 orders of magnitude higher. Conse- the IRD layers may represent only a small portion of the Heinrich
quently, central Arctic isotopic records of meltwater induced events (Fig. 10), and the proportion varies between different events,28 C.R. Stokes et al. / Quaternary Science Reviews 125 (2015) 15e49
Fig. 10. Example of fine-scale structure within a Heinrich Layer from the Labrador Sea that can be several metres thick (modified from Hesse and Khodabakhsh, 1998). Left panel
shows the location map. Right panel shows: (A) X-radiograph showing the rhythmic succession of individual IRD layers (dark) and turbidite and/or meltwater plume deposit layers
(light). The existence of individual IRD laminae is possible only if there is enough time between the occurrences of the turbidity currents, otherwise the IRD would be incorporated
in the turbidites as drop-stones or reworked by the turbidity currents. (B) a large number of lightedark couplets are identified over a 17 cm interval. Additional work is required to
determine the average duration of a couplet, but it is likely that they are annual (T and P ¼ turbidites and meltwater plume deposits; IRD ¼ ice rafted debris; cp ¼ couplet).
implying variability in the proportion of icebergs to meltwater millennial-scale variability (e.g. DansgaardeOeschger (DO) cycles).
(Rashid and Piper, 2007). For example, Heinrich event 3 (H3) is the These are recorded in turbidite records, particularly in the North
most prominent event in the Labrador Sea for the past 40 ka, but Sea fan, the Orphan Basin, and the Laurentian fan, where thick
IRD sourced from the Hudson Strait Ice Stream is barely recorded in sequences of turbidites were interrupted every 1e2 ka by hemi-
the associated Heinrich layer. pelagic sediments (Lekens et al., 2006; Piper et al., 2007; Tripsanas
The geographic distribution of IRD depends not only on supply, and Piper, 2008b; Roger et al., 2013). Recent work, however, sug-
but also on iceberg melting rates and transport distance, which is gests that the existence of individual DeO oscillations does not rely
further controlled by oceanic and atmospheric temperatures, sea upon meltwater outputs to force them, but may arise from self-
ice, winds, and ocean currents. Because the volume of IRD is not sustained nonlinear oscillations of the coupled atmospher-
representative of the event, IRD layers from the North Atlantic eeoceanesea ice system that are ‘kicked’ into action by preceding
cannot be used as the sole proxy for rapid and extreme calving Heinrich events (Peltier and Vettoretti, 2014).
events (Rashid et al., 2012). Furthermore, Andrews et al. (2012) On both the European and eastern Canadian margins, a drop in
have been able to identify at least two sources for the Heinrich the meltwater input is inferred to have begun around 20e23 ka,
layers in the Labrador Sea based on source rock signatures. The and glacigenic debris flows related to readvance of ice streams were
complex internal structure of Heinrich events as well as the vari- common (Lekens et al., 2006; Tripsanas and Piper, 2008a). These
ability in the sediment source (Tripsanas and Piper, 2008b; Rashid readvances coincided with weak Atlantic Meridional Overturning
et al., 2012; Roger et al., 2013) indicates a complex series of ice Circulation (AMOC) between 19 and 23 ka (van Meerbeeck et al.,
stream catchments and tributary redistribution for each event, 2011). More generally, the timing and amplitude of the meltwater
which is consistent with the activation of a number of different ice pulses coincides with major changes in the AMOC during the last
streams (see Section 2.2). glacial cycle (van Meerbeeck et al., 2011).
Because meltwater pulses were associated with high sedimen- Despite recent advances, there is no clear consensus about the
tation rates, long stratigraphic records are difficult to obtain close to timing and amount of meltwater and sediment flux during Hein-
ice stream outlets. Nevertheless, similar patterns from the Eastern rich events (Alley and MacAyeal, 1994; Johnson and Lauritzen,
Canadian margin and European margin are inferred from 14 to 1995; Hemming, 2004; Hulbe et al., 2004; Marshall and Koutnik,
45 ka (Fig. 11). Sedimentary records suggest that meltwater pulses 2006; Marcott et al., 2011). Insufficient data have been collected
started shortly after or around H4 (Lekens et al., 2006; Toucanne near the different glacial outlets (Section 2.6), so that use of marine
et al., 2009). The amount of meltwater increased toward the LGM, records has overemphasised Heinrich events and the post-Heinrich
with a climax from 15 to 28 ka (Fig. 11) (Lekens et al., 2006; event 1 deglaciation. Freshwater flux is difficult to quantify and is
Haapaniemi et al., 2010; Roger et al., 2013). Where ice persisted, not necessarily correlated with IRD flux (the latter being easier to
sedimentation rates remained high until the beginning of the Ho- quantify from sediment cores). This difficulty is well illustrated
locene (Piper et al., 2007). Meltwater pulses did not occur with the multiple attempts at modelling Heinrich events
randomly, and sometimes occurred in cycles that may be related to (Hemming, 2004; Marshall and Koutnik, 2006; Roberts et al.,.You can also read