Climate factsheets - www.pirc.info/factsheets - Public Interest Research Centre
←
→
Page content transcription
If your browser does not render page correctly, please read the page content below
climate factsheets

www.pirc.info/factsheets
welcome
Climate change research encompasses tens of
thousands of peer-reviewed studies, decades
of observations and the work of thousands of
scientists. But too often this valuable know
ledge doesn’t reach the people who need it most:
“ You can’t fake spring coming earlier, or trees grow-
ing higher up on mountains, or glaciers retreating
for kilometres up valleys, or shrinking ice cover in
the Arctic, or birds changing their migration times,
or permafrost melting in Alaska, or the tropics ex-
climate change communicators & campaigners. panding, or ice shelves on the Antarctic peninsula
breaking up, or peak river flow occurring earlier in
This document takes the latest scientific research summer because of earlier snowmelt, or sea level
and translates it into practical factsheets on a rising faster and faster, or any of the thousands of
wide range of climate change topics, ensuring similar examples. ... put all the data from around
that those responsible for communicating it the world together, and you have overwhelming
to a wider public have easy access to the best evidence of a long-term warming trend.
available evidence.
- Michael Le Page
New Scientist
4th December 2009
Written by
Alice Hooker-Stroud, Josie Wexler, Richard Hawkins,
Guy Shrubsole and Tim Holmes.
Designed by
Stephen Wildish and Richard Hawkins.
First published in the United Kingdom 2012 by PIRC.
Public Interest Research Centre is a company limited by guarantee.
Registered Charity No.: 266446. Registered No.: 1112242.
Registered Office: Y Plas, Machynlleth, Wales, SY20 8ER.
The Climate Factsheets are licensed under a Creative Commons
Attribution-ShareAlike 3.0 Unported License. We actively encourage
reproduction in all forms and by all means.
© Creative Commons, 2012 PIRC
Printed on 100% recycled, FSC paper using vegetable-based inks.
ISBN: 978-0-9503648-5-8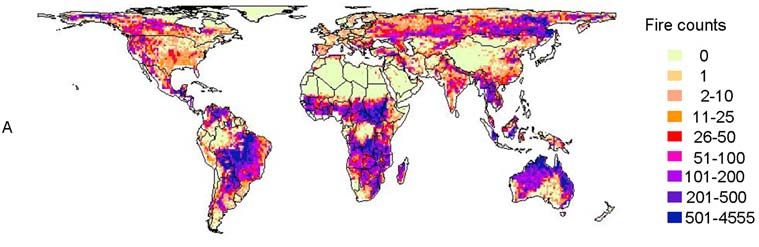
ABOUT PIRC                                                 contents
PIRC is an independent charity integrating research
on climate change, energy & economics - widening
                                                            06 	THANKSS
its audience and increasing its impact. We sit between      07 	FOREWORD
research organisations and decision-makers;
translating technical research into engaging material
which inspires lasting change.                              08 	TEMPERATURE                                                 10 	Arctic SEA ice
                                                           The global temperature record is an important indicator         The Arctic contains a thin, vulnerable layer of sea ice which
Since the failure of the Copenhagen climate talks          of global climate change, and as a result is a major focus of   reaches a minimum every September, providing a regular
in 2009 and the ‘Climategate’ debacle of early 2010,       attention for climate sceptics.                                 opportunity to highlight the impacts of climate change.

media interest in climate science has declined, and
the public become somewhat more sceptical about its
                                                            12          DROUGHT                                             14 	EL NIñO
veracity. Yet the evidence base itself has only become
more robust in that time. Conveying the certainties and    Already one of the most widespread and damaging natural         The El Niño Southern Oscillation (ENSO) involves
                                                           disasters, drought is likely to affect more people, more        abnormal warming (and cooling) of the central and
uncertainties of climate science to the public - through   severely as temperatures increase.                              eastern Pacific Ocean. It has impacts around the globe.
a media that has become much more polarised about
the subject - is a recurrent challenge for campaigners.
                                                            16 	FLOODING                                                    18 	HEATWAVES
Responding to this, PIRC has put together the following
                                                           Climate change is likely to increase flooding, and given        As average global temperatures increase, we are likely to
set of factsheets, covering different aspects of climate   physical limits to flood adaptation, emissions reductions       see more record highs, and fewer record lows. This would
science. The factsheets look at the evidence for           are needed to prevent unmanageable flooding in the future.      make heatwaves longer, more frequent and more intense.
climate change from a range of angles, such as global
temperature trends and Arctic ice melt, and traces the
fingerprint of climate change in various phenomena,         20 	SNOW & COLD                                                 22 	SPECIES EXTINCTION
from floods and heatwaves to wildfires and species         Cold and snowy weather attracts media attention and can         Climate change will likely make a bad situation worse for
extinctions. Each briefing contextualises the issue in     have an impact on public opinion and concern about a            many species, and could become the main cause of species
                                                           warming world, but it does not disprove climate change.         extinction in the future.
question, summarises the background science, and
addresses common objections raised by sceptics.
Drawing on the latest peer-reviewed studies, they are       24 	THE SEASONS                                                 26 	WILDFIRES
intended to be a solid, reliable and concise guide for
campaigners wishing to communicate climate science         A warming world shifts the seasonal activities of plants        Wildfire is important to most ecosystems; but higher tem-
                                                           and animals, with uncertain consequences.                       peratures can alter natural fire-regimes, permanently re-
with accuracy and confidence.                                                                                              leasing greenhouse gases and amplifying climate change.

                                                            28          REFERENCES
                                                            50 	MORE ON PIRC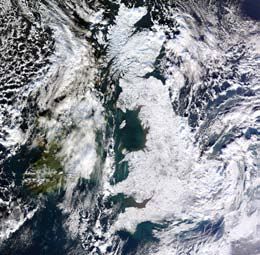
THANKS                                                     FOREWORD
Here we list those who generously donated time             PIRC’s Climate Factsheets are a valuable contribution
and expertise to answer our awkward questions,             to broader public understanding of the present state
straighten out our confusions or review our writing.       of climate science. They clearly and cogently set out
Many kind people helped us with this work in some          the evidence for anthropogenic global warming - from
way or another; far too many to mention individu-          rising global temperatures to melting Arctic sea ice -
ally here. Many, many thanks for all your comments,        and its interaction with various climatic events, such
corrections and conversations.                             as wildfires, droughts and flooding.

Dr John Abrahams, Dr Lisa Alexander, Prof. Jonathan        In constrained economic times, it is vital that we do
Bamber, Dr Eleanor Burke, Dr Mark Cane, Dr Matthew         not lose focus from tackling what remains the most
Collins, John Cook, Prof. Kirsten de Beurs, Maria Dick-
inson, Dr Stephen Dorling, Prof. Nick Dulvy, Dr Erich      pressing challenge humanity faces. It falls to policy-
Fischer, Dr Mike Flannigan, Wendy Foden, Dr Lisa           makers, journalists and civil society organisations to
Goddard, Dr James Hansen, Prof. Sandy Harrison, Dr         communicate accurately and without bias the threats
Stephan Harrison, Prof. Katherine Hayhoe, Prof. Ove
Hoegh-Guldberg, Dr Marika Holland, Christian Hunt, Dr      we face from a warming planet.
Nat Johnson, Prof. Phil Jones, Dr Alison Kay, Dr Eliza-
beth Kendon, Dr Simon Lewis, Prof. Mike Lockwood,          The authors of these Factsheets state clearly what
Terry Marsh, Dr Jeff Masters, Dr Jerry Meehl, Dr Walt      is known, and what isn’t, about the contribution that
Meier, Dr Annette Menzel, Dr Max A. Moritz, Dr Son
Nghiem, Dr Camille Parmesan, Dr Verity Payne, Prof.        human-induced climate change is making to shifting
Stuart Pimm, Prof. Colin Prentice, Dr Mike Raupach,        weather patterns and other observed phenomena. I
Dr Nick Reynard, Dr Jeff Ridley, Dr Reto Ruedy, Dr Ben     commend them to anyone wishing to learn more about
Santer, Prof. Mark Saunders, Dr Gavin Schmidt, Dr
Marko Scholze, Prof. Richard Seager, Dr Justin Shef-       the science of climate change - and particularly to
field, Dr Amber J. Soja, Prof. Richard Somerville, Prof.   those communicating climate change to a wider audi-
Tim Sparks, Dr Julienne C. Stroeve, Jon Taylor, Dr Ste-    ence, who need the facts at their fingertips now more
phen Thackeray, Prof. Chris Thomas, Dr Peter Thorne,
Dr Kevin Trenberth, Olly Watts, Prof. Andrew Weaver,       than ever.
Robin Webster and Dr Chris West.

Responsibility for any errors, omissions or mistakes
lies solely, of course, with PIRC.
                                                           Sir John Houghton
                                                           Former Co-Chair of the Intergovernmental Panel on Climate Change (IPCC)
We’d also like to thank the Network for Social Change,     Former Director General of the UK Met Office

the Joseph Rowntree Charitable Trust and the 1970
Trust for supporting this work.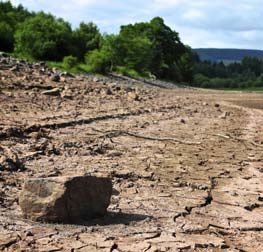
the UHI has contributed only 0.02ºC of warming over The observed warming is caused by the Urban
the last century.27 To minimise these differences, the Heat Island (UHI) effect52,53 or ‘poorly’ located
raw data are converted into temperature anomalies -
a change in temperature from a reference period or
weather stations.54 Urban, rural, land and ocean
TEMPERATURE
baseline. This change in temperature is similar both temperatures are all rising.55 The UHI effect has
up a mountain and down in the valley next to it; in a only a minor impact (roughly 0.02ºC of the 0.75ºC
Temperature
city or surrounding rural areas.28 temperature rise over the last century56), and is
--Short or interrupted records. Old thermometers corrected for in analyses.57,58 Both ‘poorly-located’
are replaced with new ones, or with better technol- and ‘well-located’ weather stations show warm-
ogy. Weather stations are closed down, break or are ing.59 (Sceptics help disprove their own argument
moved to different sites.29 Interruptions are often here: bit.ly/sitelocations)
identifiable during analysis (for example a sudden
The global temperature record is an important indicator of ‘jump’ in temperature), and the record at that station The weather stations are being cherry-picked.60
is calibrated to make it continuous; to make sure any
global climate change, and as a result is a major focus of atten- increase (or decrease) in temperature is not artifi-
It is true that not all weather stations’ data are
cial.30
used. However, most of those dropped actually
tion for climate sceptics. show more warming than those kept – including
--Uneven distribution. There are more weather them would increase the warming trend.61 Analy-
stations in densely populated areas. The South-
ses that use more of the data do not show any sig-
ern Ocean, Africa, Antarctica and the Arctic have
nificant changes in the long term trends.62,63
Summary --GISTEMP (bit.ly/gistemp) - NASA Goddard Insti-
tute of Space Studies (GISS) in the USA.
relatively patchy coverage.31 We can’t change his-
tory, instantly move, or buy more weather stations
Experts
Also, there is a huge amount of other evidence
Average global temperature has increased to get better coverage. Attempts to deal with this
--HadCRUT (bit.ly/hadcrut) - University of East An- problem vary:32 GISTEMP assumes the temperature that indicates a warming world (some of which is Dr James Hansen
by around 0.75ºC since the beginning of the glia Climatic Research Unit (UEA CRU) and the discussed in other factsheets).64,65 NASA, USA
anomaly in an area without many weather stations
20th century. Most of this is very likely to be Met Office in the UK. (most notably the Arctic) is the same as the nearest Climate models;
due to human greenhouse gas emissions.
--NCDC (bit.ly/ncdc_noaa) - National Oceano- weather station (within reason33).34,35 HadCRUT and
NCDC make no such assumption,36 effectively as-
What the scientists say temperature & satellite
All three main temperature data sets agree graphic and Atmospheric Administration (NOAA) data
suming that the temperature change in these areas Dr Vicky Pope (Met Office): “The [main 3 tempera-
on the broad trend, despite slightly different in the USA. is the same as the average.37 GISTEMP has slightly james.e.hansen@nasa.gov
analyses. ture] datasets are all independent, and they all
All three records show: higher estimates of average global temperatures as +1 212 678 5500 GMT -5
a result, since Arctic regions in particular have been show warming.”66
Each of the last three decades was warmer
than the last. The ‘noughties’ was the hottest
--An overall long-term warming trend, showing warming faster than the average. For more informa- Prof. Phil Jones (University of East Anglia Climatic Dr Reto Ruedy
an increase of roughly 0.75ºC (+/-0.05ºC, so be- tion, see bit.ly/datadiff. NASA, USA
decade on record. Research Unit): “The fact that 2009, like 2008,
tween 0.7ºC and 0.8ºC8) since the beginning of will not break records does not mean that global NASA temperature record;
Long-term, temperatures are rising, but this the 20th century.9 (Other research shows most of What the sceptics claim warming has gone away. What matters is the un- greenhouse effect
doesn’t mean that each year will be hotter this is very likely due to human greenhouse gas derlying rate of warming - the period 2001-2007 ...
than the last. The temperature data is unreliable.38,39 The data rruedy@giss.nasa.gov
emissions.10,11) was 0.21ºC warmer than corresponding values for
is not perfect,40 but many imperfections are ironed +1 212 678 5541 GMT -5
the period 1991-2000.”67
Context --Very similar year-on-year ‘ups and downs,’ out or reduced,41 and those remaining leave
Prof. Phil Jones
(natural variations).12 (The El Niño Southern Os- an estimated +/-0.05ºC of uncertainty:42 much Prof. Myles Allen (University of Oxford): “Even in
Every January,1 the global average temperature cillation (ENSO, p.14), volcanic and solar activity the 80s [2008] would have felt like a warm year ... CRU, UEA, UK
smaller than the observed warming of around
for the previous year is announced by three in- account for most of these. Without them, the 0.75ºC since the beginning of the 20th century.43 For Dickens this would have been an extremely CRU temperature record;
dependent organisations. Though a single year’s long-term trend is much clearer.13,14) warm year.”68 paleoclimate
ranking (‘hottest’ or not) attracts media attention, There’s been no global warming since 1998 / this p.jones@uea.ac.uk
only the long-term trend is evidence of climate --That each of the last three decades was warmer decade / this century.44,45 Global warming does Dr Gavin Schmidt (NASA): “for any individual year,
than the last (by 0.15-0.2ºC on average).15 the ranking isn’t particularly meaningful. The dif- +44 (0)1603 592090 GMT
change.2 not mean that each year will be hotter than the
last. There is lots of natural variability - daily to ference between the second warmest and sixth
Before climate negotiations in Copenhagen --That all ten of the hottest years have occurred
warmest years, for example, is trivial.”69 (The Dr Gavin Schmidt
decadal ‘ups and downs’, caused mainly by other
(2009) and Durban (2011), private emails from since 1998.16 difference is a few hundredths of a degree centi- NASA, USA
factors (ENSO, volcanic and solar activity).46,47
those working on global temperature data were Independent analyses of the raw data have been grade.70) NASA temperature record;
Short-term flat or cooling periods have happened
published on the Internet (now referred to as ‘Cli- conducted by many people, sceptics included. climate models
before (take a look at the graphic below).48 Long- Dr John R. Christy (University of Alabama), a long-
mategate’).3 Since then, nine independent reviews Even the Berkeley Earth Surface Temperature gschmidt@giss.nasa.gov
term, the trend is still on average 0.15-0.2ºC time sceptic, acknowledges: “Long-term climate
have cleared the scientists involved and their work (BEST) project – set up following ‘Climategate’ to +1 212 678 5627 GMT -5
warming per decade;49,50 each of the last three change is just that, “long term”, and 12 months of
(for more, see: bit.ly/climateg8).4 resolve criticism of existing temperature analy- decades have been warmer than the last (for data are little more than a blip on the screen.”71
ses by ‘starting from scratch’ – show very similar
What’s more, the average global temperature is more info see bit.ly/temperaturetrends).51
trends (see bit.ly/bestcomparison).17 All reason-
only one piece of evidence of a warming world.5
Other long-term trends like shrinking Arctic sea able methods produce almost identical results.18
What the data says For more info
ice, advancing spring (see p.10 and p.24 respec- Small differences in results (for example which
tively), glacial retreat, melting permafrost and sea year is recorded as hottest) stem from differ-
Global Average Temperature Temperature anomaly from average between 1951-1980. The latest news on
level rise are consistent with the warming evident ences in analyses - differing ways of dealing with
0.7 GISTEMP
in the temperature record. issues in the raw data.19 Some problems will al-
0.6 bit.ly/gistemp
0.5
ways remain (hence the +/-0.05ºC uncertainty20)
Background science whilst others can be ironed out, or reduced for 0.4 The Met Office: Global
warming goes on (2008)
Every day local temperatures are recorded by instance:21 0.3
0.2
bit.ly/warminggoeson
thousands of weather stations on land, and on --Unreliable or poor quality data. Data recording is
[PDF; Archive]
buoys and ships at sea.6 Though the number of not always good. Bad data sometimes simply can- 0.1
weather stations has changed over time, today not be used.22 Large amounts of bad data can skew 0
results unrealistically, though small bits that slip 1850 1900 1950 2000 Different data analyses
data from between 4,000 and 6,000 of these -0.1
through won’t have much effect.23 show the same trend
weather stations are used to calculate average -0.2
bit.ly/temprecord
temperature across the globe.7 --Different surroundings.24 The infrastructure in a city -0.3
makes it slightly warmer than nearby rural areas – Sources: HadCRUTV3 GISTemp NOAA
Three main organisations independently analyse the Urban Heat Island (UHI) effect.25 It is colder up a -0.4
bit.ly/tempdata Met Office NASA
and process data to perform this calculation: mountain than down in a valley next to it.26 Globally, -0.5
8 www.pirc.info/factsheets 9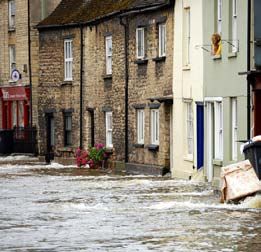
ARCTIC SEA ICE
ARCTIC SEA ICE
The Arctic contains a thin, vulnerable layer of sea ice which
reaches a minimum every September, providing a regular op-
portunity to highlight the impacts of climate change.
Summary that melts because of the less reflective surface is
only a small fraction of the initial melt - it adds up
What the sceptics claim What the scientists say Experts
The Arctic is warming roughly twice as fast as much like interest on a bank account.13 Arctic sea ice is recovering.28 Just because there Dr Vicky Pope (Met Office, UK): “The record-break- Dr Jeff Ridley
the global average. isn’t a new record low, this does not mean that the ing losses in the past couple of years [2006-7] Met Office, UK
Arctic sea ice is affected by a combination of
long-term trend has changed. Arctic sea ice is still could easily be due to natural fluctuations in the Sea ice models
The long-term decline of Arctic sea ice is due ocean currents and weather patterns (tem-
in decline; there is no evidence of ‘recovery’.29,30 weather, with summer ice increasing again over
to rising temperatures. This long-term decline perature, wind, cloud cover etc.) as well as the jeff.ridley@metoffice.gov.uk
reinforces natural variability in record low Furthermore, as explained above, the sea ice is the next few years.”39
increasing influence of climate change.14 It’s not +44 (0)1392 886472 GMT
years. just the area (or extent) of ice that is affected - melting much faster than expected, which has led Dr Gavin Schmidt (NASA Goddard Institute for
to predictions of an ice-free Arctic being brought
Even when a record low in sea ice occurs, the
recurrent melting means that seasonal ice isn’t Space Studies, USA): the Arctic is “a good reminder Dr Marika Holland
able to build up thickness, a process which takes forward by roughly 40 years.31 that uncertainty in model projections cuts both
long-term trend is still most indicative of NCAR, USA
climate change. a number of years.15 It is therefore more vulner- It’s not us: it’s natural variability / it’s the ways.”40 Sea ice models & history
able to fluctuating weather conditions, since it wind.32,33 There is a lot of natural variability in the
The Arctic is changing faster than predicted Dr James Overland (National Oceanic and mholland@ucar.edu
becomes easier for small changes to melt the Arctic, but this can’t explain the long-term trend.
by the IPCC in 2007. As a result, projections Atmospheric Administration): “The melting is hap- +1 303 497 1734 GMT -7
reflective ice, supplementing the feedback.16 The only explanation for this trend is warming
of ice-free Arctic summers have been pening faster in the real world than it has in the
Because of these interactions, there is debate caused by increased atmospheric concentrations models”.41 Dr Son Nghiem
brought forward. of CO2 - a clear and distinct ‘human fingerprint’ on
about whether ice extent (a measurement of sur- NASA, USA
long-term Arctic sea ice melt.34 Dr Ted Scambos (National Snow and Ice Data
Context face area with greater than 15% ice, most com-
monly used), area, thickness, volume or age is the Centre, USA): “The main message is not so much
Sea ice thickness & age
It’s underwater volcanoes.35 There are volcanic whether or not we set a record, but this year son.v.nghiem@jpl.nasa.gov
In 2007, sea ice extent reached a dramatic record best measure or predictor of its future behaviour. eruptions under the Arctic, but the heat doesn’t [2011], without any noticeably unusual pattern of +1 818 354 4321 GMT -8
minimum, 23% below the previous record.1 This However, the overall thickness (and hence vol- reach the surface, and there’s nowhere near
ume) of the sea ice is also falling (for more info, weather, we nearly broke a record, which only four
caused considerable alarm among some Arctic enough of it to melt all the ice.36 years ago took a very unusual weather pattern Dr Julienne Stroeve
scientists, leading to statements such as: “the see: bit.ly/icemetric).17 By 2009 only 10% of the
plus a warming Arctic to achieve”.42 NSIDC, USA
Arctic is screaming”,2 “[it’s] in its death spiral”3 Arctic ice was more than two years old, compared 37
There was less ice in the 1930s. Satellite re-
Sea ice; satellites; albedo
and “the canary has died”.4 Others, such as to 30% on average between 1981 and 2000.18 cords began in 1979. To know what happened Dr Christophe Kinnard (Centro de Estudios Avan-
before then scientists have analysed a variety of zados en Zonas Aridas, Chile): “This drastic and stroeve@kryos.colorado.edu
Vicky Pope at the Met Office and science blog- The 2007 IPCC report said “summer sea ice is different shipping records and historic accounts. continuous decrease [in Arctic sea ice] we’ve +1 303 492 3584 GMT -7
ger William Connolley, were more cautious.5,6 projected to disappear almost completely towards Analysis of Russian ice charts and other data sets been seeing from the satellites does seem to be
They pointed to natural variability (year-to-year the end of the 21st century.”19 In 2009, the Copen- shows Arctic sea ice minima over the last decade anomalous... It does point to a continuation of this
changes in weather or ocean currents and cycles) hagen Diagnosis, published by 29 leading climate are lower than those in the 1930s and 1940s (see trend in the future.”43
as a possible cause of the record decline. scientists (including several IPCC authors) up- bit.ly/arctichistory).38
Since 2007 the minimum moved closer to the dated this forecast, noting that: Dr Walt Meier (National Snow and Ice Data Centre,
long-term trend, as Connolley and Pope sug- USA): “If we get another warm year, anything like
“The observed summer-time melting of Arctic
gested it might. A decline in both maximum7 and 2007, then the ice is really going to go. And the
sea-ice has far exceeded the worst-case projec-
minimum extent (the highest and lowest areas chances are that at some point in the next few
tions from climate models of the IPCC AR4... The
covered by sea ice in a particular year, respec- warming commitment associated with existing What the data says years we are going to get a warm one.”44
For more info
tively) can be seen in the long-term trend (see atmospheric greenhouse gas levels means it is
graphic below). The minimum has been dropping very likely that in the coming decades the summer Arctic Sea Ice Extent Maximum & Minimum,1979-2011
National Snow and Ice
at a rate of roughly 13% per decade since 1979.8 Arctic Ocean will become ice-free, although the Trend
16m km2
Data Centre (NSIDC)
2011 was the second lowest recorded sea ice ex- precise timing of this remains uncertain.”20,21 (to Arctic Sea Ice FAQs
14
tent. 9 read more: bit.ly/sensitivearctic) bit.ly/arcticfaq
12
Latest observations show Arctic sea ice is melt-
Background science ing at least twice as quickly as computer simula- 10
What caused the dra-
tions suggested,22-24 and is “unprecedented over matic ice loss in 2007
The Arctic is warming around twice as fast as the 8 bit.ly/2007causes
global average, largely due to an amplifying (or the last 1450 years.”25 Model runs now predict
‘positive’) feedback.10,11 Losing bright reflective the Arctic being ice-free (in the summer) around Trend 6
40 years earlier than scientists predicted before
UNEP Climate Change
ice leads to more heat being absorbed by darker
4 Compendium p.17-20
ocean surfaces, and more regional warming, 2007.26,27 Record low, 2007 bit.ly/climatecompendium
which in turn leads to more ice melt. This doesn’t 2
necessarily mean it is a ‘runaway’ process, or that Source: NSIDC, bit.ly/seaicedata
0 Latest News (NSIDC)
it might reach a ‘tipping point’.12 The extra amount 1979 1984 1989 1994 1999 2004 2009 bit.ly/arcticnews
10 www.pirc.info/factsheets 11
Climate feedbacks very certain, and may change as we learn more.72
Higher temperatures increase evaporation from Generally, drying regions are likely to continue
land, which in drier areas can increase tempera- getting drier, but the specifics are harder to pre-
DROUGHT
tures further (a reinforcing or ‘positive’ feedback) dict.73
– less heat is lost through evaporation because
DROUGHT
We can adapt agriculture to be more drought re-
there is less moisture in soils, and more heat
comes in because fewer clouds form.44,45 sistant so it’s not a problem.74 To an extent, water
management and food production can be adapted
Drought also causes vegetation to dry out and die, to be more drought resilient.75 However, many
and can lead to fires.46 These release CO2, which simply do not have the resources to adapt, and the
can enhance climate change (another reinforcing
more frequent and severe drought becomes, the
or ‘positive’ feedback).47 Die-back in the Amazon,
Already one of the most widespread and damaging natural dis- caused by severe droughts in 2005 and 2010 (both harder it is to maintain such measures.76
asters, drought is likely to impact more people, more severely, ‘once-in-a-hundred-year’ droughts 48) released
more CO2 than the Amazon usually absorbs in a
Droughts are not becoming more frequent,
more severe or longer.77 Droughts are relatively
as temperatures increase. year (see bbc.in/amazondrought).49,50 In the long-
rare and so the quantity of data is small, making
term, if sufficiently sensitive to drought, the Ama-
zon could change from a sink to a source of CO251 identifying trends difficult.78 Some strong drying
though this may not be permanent.52 trends have been established (for example in the
Summary help measure drought.19 But these records are
often short and poorly spread out. Precipitation Projections
Sahel),79 and there is evidence that shows drought Experts
becoming longer and hence more severe in some
Drought happens all around the world, though and temperature data for basic ‘water-in, water-
out’ calculations20 are more comprehensive, but
In general as global (and local) temperatures in- areas.80-82 Dr Justin Sheffield
its impacts can be reduced and are not always crease, drier areas are expected to dry further.53,54 Princeton University, USA
severe. over-simplify the situation – dryness doesn’t Some research suggests that droughts will there- The IPCC was wrong about the Amazon. ‘Ama- 83
always mean drought.21 Water cycle; drought &
Severe drought, however, directly affects food fore become longer and more widespread, and be zongate’ was widely reported in the media.84,85 flooding extremes
and water availability, and can kill. --Seeing if droughts have changed is difficult. more severe.55,56 Evaporation will likely play a big- The IPCC’s 2007 report said that “Up to 40% of the
Droughts change in severity and frequency ger role under higher temperatures, which some Amazonian forests could react drastically to even justin@princeton.edu
Globally, since the 1970s, droughts are getting
longer and more widespread, but only perhaps year-to-year and decade-to-decade.22 They are research suggests will lead to droughts much a slight reduction in precipitation,”86 referencing +1 609 258 1551 GMT -5
slightly more severe. regional, and happen relatively infrequently, more severe than ever recorded.57 Lower or less
a non-peer-reviewed WWF report. However, inde-
meaning there may be insufficient data to show frequent precipitation will still be the dominant Prof. Richard Seager
Drought projections are still not very accurate, factor increasing drought in the future.58 pendent scientific studies concluded the same or
largely because they rely heavily on uncertain any pattern or trend.23 Columbia University, USA
worse.87-89 For more info - bit.ly/amazongate..
precipitation projections. --Many factors contribute to drought. Some fac- More specific local (or regional) drought projec- Climate variability;
Higher temperatures cause more evaporation
from land which will exacerbate drought in the
tors may be influenced by climate change and
natural variations (El Niño Southern Oscillation
tions are quite uncertain.59 The precipitation
projections on which they rely include natural What the scientists say multi-year droughts
seager@ldeo.columbia.edu
future. (see p.14), or monsoons), such as:24,25 variations such as ENSO and monsoons, which Dr Simon Lewis (Leeds University, UK): “If events
are currently difficult to predict.60,61 +1 845 365 8743 GMT -5
like this [severe drought in 2010] happen more
Context -- Local rainfall.
often, the Amazon rainforest would reach a point Terry Marsh
-- Low levels of snowfall (which can cause ‘delayed’
drought as less spring meltwater flows down riv-
What the sceptics claim where it shifts from being a valuable carbon sink Centre for Ecology and
Drought is one of the costliest and most wide-
spread natural disasters.1 Long droughts reduce ers).26 slowing climate change, to a major source of Hydrology, UK
Droughts have happened before62,63 and are
reservoir levels, limiting or cutting off water sup- -- High local temperatures (which increase evapora- greenhouse gases that could speed it up.”90 Hydrology; drought;
tion, removing water 27,28). (therefore) natural.64,65 The direct cause of a
plies for drinking and agriculture.2 Drought can drought is the particular conditions of the region, Prof. Isaac Held (National Oceanic and Atmos- flooding
cause crop failure, leading to famine locally, and Other factors are hardly influenced by climate:
which include natural factors.66 Climate change, pheric Administration, USA): ”There is a hint that tm@ceh.ac.uk GMT
rising food prices globally.3 Those dependent on -- Irrigation systems and dams diverting water
local land for food and water are most affected however, will likely play a larger part in drought the current drying may be caused by what the
by drought, and usually have the least capacity to
courses.29,30
as precipitation patterns change and higher tem- models suggest [climate change], but it’s only a Dr Simon Lewis
-- Land use change or erosion (which can cause more hint right now.”91 University of Leeds, UK
adapt.4 Drought can, and does, kill.5 water to evaporate or run-off).31,32
peratures enhance evaporation.67
Tropical forests; the
Comparatively, the direct impacts of even severe -- How many people require water and what they need Flooding and rain mean drought projections are Prof. Thomas Reichler (University of Utah, USA)
Amazon rainforest
droughts in the UK (for example 1976, 1995-96) it for (increasing demand can mean supplies fall wrong.68 More severe or frequent droughts do “There is a lot of natural variation from year to
are mild. Drought can diminish water supplies for short.)33,34 year [in the drying of the higher latitudes], but we s.l.lewis@leeds.ac.uk
not necessarily mean there will be no rain;69 and
agriculture and people’s health can suffer, espe- Since different combinations of these factors see a slow, gradual change.”92 +44 (0)113 3433 337 GMT
cially when there is also a heatwave (as in 2003).7 short-term events are different from long-term
interact to create the particular conditions of a
However, winter rainfall helps keep reservoirs drought, the impact of climate change can be trends.70 Prof. Steven Running (University of Montana,
relatively full during summer droughts,8 and regu- difficult to identify. 71 USA) “Globally, we’re seeing larger and longer
There are contradictory projections. Many local
latory measures, like hosepipe bans, save water droughts.”93
for more important uses.9,10 In the UK, droughts However, some changes to drought have been (or regional) precipitation projections are still not
are not usually severe or long-lasting.11 identified: For more info
--Globally, the area affected by serious drought What the data says
Background science has increased since the 1970s,35,36 and some Annual Volumetric Soil Moisture Statistically significant trends, 1950−2008 Drought - today and
evidence suggests that droughts are intensifying, tomorrow
Drought describes abnormally dry conditions though not by much.37-39 bit.ly/futuredrought
caused by below-normal precipitation (rain, hail or
snow) over months or years.12,13 It happens even in --Regionally, since the 1970s, droughts in parts
wet regions because it is defined relative to local of Africa and East Asia have become more se- How severe is a drought,
conditions.14 Deserts don’t necessarily experience vere, and those in southern Europe and eastern and what does it mean
drought because they are always dry.15 Drought Australia have experienced slightly severer bit.ly/droughtmeasures
severity depends on how dry it is (intensity), how droughts.40
long it lasts (duration) and how much area it cov- --These areas have dried significantly since the Current drought situation
ers (size).16,17 1950s, with the Sahel (south of the Sahara) most in the UK
The direct impact of climate change on drought is severely affected (see graphic below).41 Evapora- bit.ly/ukdroughtnow
hard to estimate because: tion has contributed a small amount to drying
since the 1980s.42,43
--Measuring drought is hard.18 Groundwater and Source: Sheffield, Justin; Wood, Eric F.
(2008) Global Trends and Variability
These changes, however, have not been clearly Trend (% yr−1)
reservoir levels, river flows and soil moisture all in Soil Moisture and Drought Charac-
attributed to climate change. teristics, 1950 2000, Journal of
Climate, vol. 21, issue 3, p. 432. −.20 −.16 −.12 −.08 −.04 0 .04 .08 .12 .16 .20
12 www.pirc.info/factsheets 13
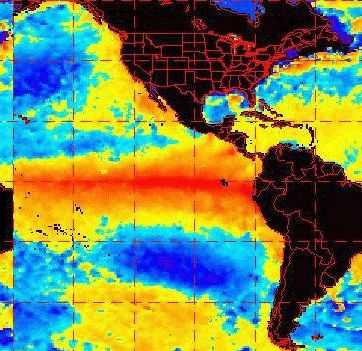
EL NiñO
El Niño ENSO ‘focuses’ weather in particular areas. Ef- Climate models are unreliable because they
The El Niño Southern Oscillation (ENSO) involves abnormal warming (or cool- fects are most severe in the equatorial Pacific, can’t simulate ENSO.54 Climate models simu-
tropics and Pacific rim countries: late ENSO well on a global scale,55 but are often
ing) of the central and eastern Pacific Ocean, brought about by interactions
--Precipitation: El Niño is linked to heavy rainfall less accurate regionally.56 There is disagree-
between the ocean and the atmosphere. It has impacts around the globe. and flooding along the western coast of South ment on how (or if) ENSO might change in the
America, and drought in Indonesia, India and future,57,58 but greenhouse gases have, and will
Australia.31,32 La Niña has opposite, though not likely continue to be responsible for most of the
warming,59,60 meaning global projections are still
Summary Pacific Ocean. El Niño (the warm phase of ENSO)
refers to an abnormal warming of these areas
necessarily equal effects.33,34
reliable. Experts
--Storms: La Niña tends to bring more hurri-
ENSO is a major part of the natural variability of Pacific Ocean.13 The ocean warming causes canes, typhoons and tropical cyclones over the Global warming stopped in 1998.61 The Met Office Prof. Mark Saunders
of the Earth’s climate. a change in the winds, which in turn causes a Atlantic and Gulf of Mexico. El Niño suppresses UCL, UK
states that 1998 was the hottest year on record.62
change in the ocean surface temperatures, rein- them along the eastern coast of North America, Climate variability; ENSO;
Comparatively frequent El Niños (warm Some claim wrongly (see p.8) that this means
forcing the initial warming - a ‘positive’ feedback and increases storm activity over the Pacific seasonal forecasting
phases) likely contributed a small amount global temperatures have been falling since
which builds El Niño.14,15 Ocean. 35-37
to global warming between 1976 and 1998. then.63 In 1998 there was a super-El Niño, which mas@mssl.ucl.ac.uk
A possible shift to more frequent La Niñas The change between El Niño and La Niña is gave an extra boost to temperatures, on top of the +44 (0)1483 204187 GMT
ENSO also affects parts of East and South Africa,
(cool phases) may have moderated warming somewhat erratic: the two phases occur at irregu- long-term warming.64 Global average tempera-
and parts of Asia; 38 it has only minor impacts in
since. lar intervals of two to seven years, lasting between tures in 2010 and 2005, were very close to 1998 – Dr Matthew Collins
Europe and the UK. It can be difficult to untangle
a few months and two years.16,17 There can be sev- despite being unaided by any super Met Office, UK
The effects of climate change on ENSO are the effects of climate change and ENSO. Because
incredibly difficult to identify because it is such eral El Niños or La Niñas in a row, with ‘neutral’ ENSO is irregular, it is difficult to tell if there are El Niño.65,66 ENSO in climate models;
an irregular cycle. conditions in between (see graphic below). The ocean-atmosphere
changes due to global warming.39 Some evidence
We don’t know yet how climate change might
strength of an El Niño or La Niña varies signifi-
suggests a link to the increasing intensity of the What the scientists say interactions
cantly.18 floods and droughts associated with ENSO (see matthew.collins@
affect ENSO in the future, though it will likely John Cook (Skepticalscience.com): “Data analysis,
intensify some of the impacts. ENSO forecasting models can predict El Niño or p.12 and 14 respectively).40 Climate models disa- physical observations and basic arithmetic all metoffice.gov.uk
La Niña six-to-nine months in advance by recog- gree on the future effects of climate change on show ENSO cannot explain the long-term warm- +44 (0)1392 723984 GMT
Context nising ocean temperature patterns.19 It is more ENSO - some predict stronger phases, some
weaker and others no change.41-44 Because ENSO
ing trend over the past few decades.”67
Dr Lisa Goddard
difficult to predict the strength20 or specific local
ENSO is a natural, irregular cycle that has hap- impacts of a phase, because ENSO behaves in- influences global weather patterns so strongly, Dr Wenju Cai (Commonwealth Scientific and In- IRICS, USA
pened for thousands of years.1 No link to climate it is one of the reasons there is uncertainty in re- dustrial Research Organisation, Australia): “While Near-term climate change;
consistently.21,22 It is not entirely understood what
gional projections of climate change. 45 the possibility of large changes in ENSO cannot forecasting
change has been definitively established.2,3 There initiates or ends the reinforcing feedback.23
be ruled out, research conducted to date does not
are, however, similarities between ENSO and cli- goddard@iri.columbia.edu
mate change: Global Impacts What the sceptics claim yet enable us to say precisely whether ENSO vari-
ability will be enhanced or moderated, or how the +1 845 680 4430 GMT -5
--Prediction: Though ENSO processes are not ENSO (El Niño and La Niña on average) has likely
Global warming is due to El Niño.46-48 El Niño frequency of events will change.”68
entirely understood, its general behaviour and contributed about 0.06ºC to global warming since Dr Kevin Trenberth
does temporarily enhance the global average Michel Jarraud (Secretary-General of the World
patterns are predictable.4,5 Specific regional im- 1950.24 El Niño contributions to individual years NCAR, USA
temperature. But ENSO cycles are short - a few Meteorological Organisation): “La Nina is part of
can be larger. 1983 and 1998 featured ‘super El Natural variability; ENSO;
pacts can be difficult to predict.6,7 years maximum.49 ENSO has likely contributed
Niños’ far stronger than previously recorded.25 The what we call ‘variability’. There has always been atmosphere; hurricanes
--Impacts: ENSO affects temperature and precipi- only 0.06ºC to the 0.55ºC increase seen in global and there will always be cooler and warmer years,
super El Niño of 1998 (the hottest year in the Met trenbert@ucar.edu
tation patterns globally. It changes the likelihood average temperatures since 1950 (note the total but what is important for climate change is that
Office record26) likely contributed 0.17ºC of warm- +1 303 497 1318 GMT -7
of floods, droughts and tropical storms/hurri- warming since 1900 is roughly 0.75ºC50 - the trend is up; the climate on average is
ing to that year.27 An El Niño causes a temporary
canes in different areas.8 see p.8).51-53 warming.”69
increase in global average temperature for two
--Attribution: While it is difficult to explicitly label reasons: 28
What the data says For more info
individual extreme events as being caused by El 1. Redistribution of heat: a larger portion of
Niño or La Niña, they are strongly linked.9 A whole host of ENSO-
the surface of the Pacific Ocean is warmer ENSO Index El Niño La Niña ENSO Neutral
However, the impact of ENSO only lasts for the than normal, so there is more evaporation. related info
3
duration of the cycle (a few months to two years), This transfers heat from the ocean to the bit.ly/ensoinfo
or with a small delay.10 Changing somewhat ir- atmosphere.
2 Top misconceptions
regularly year-to-year, it is responsible for much 2. Enhanced greenhouse effect: more evapo- about El Niño explained
of the ‘noise’ (or natural variation) in various cli- ration also means more water vapour (also a
1 bit.ly/topmisconceptions
mate indicators.11 greenhouse gas), which reinforces this effect
- another ‘positive’ feedback. El Niño and global
Background science With La Niña, a larger portion of the surface of the
0
warming on Real Climate
ENSO involves an interaction between ocean and Pacific Ocean is cooler than normal, so there is -1
bit.ly/whatisenso
atmosphere in the tropical Pacific Ocean.12 A La less transmission of heat from the ocean into the
Niña (the cool phase of ENSO) is a stronger ver- atmosphere.29 Despite this, 2011 was the warmest Non-technical El Niño
-2
sion of normal (or ‘ENSO neutral’) conditions: a La Niña year ever recorded (for more information explanation
1950 1960 1970 1980 1990 2000 2010
more intense cooling of the central and eastern see: bit.ly/2011lanina).30 Source: NOAA’s Oceanic Niña Index , see: 1.usa.gov/ensodata
bit.ly/nontechy
14 www.pirc.info/factsheets 15
were twice as likely to have happened because of land ice and warming oceans, contributing to sea-
climate change.36,37 level rise.58
FLOODING
UK There have always been floods.59-61 Large floods
|n the UK, floods have become slightly more fre- have become substantially more frequent globally
FLOODING
quent over the last 30-40 years,38-40 as have longer over the 20th century, as we’d expect in a warming
periods of rainfall (a major cause of flooding).41 climate, and they will likely become even more
Over the 20th century, winter rain has been more frequent as temperatures increase. 62
‘flashy’ (falling in more sporadic, but intense peri-
Rainfall hasn’t increased, and won’t increase.63
ods), though in summer the opposite is true.42 All Average rainfall doesn’t have to change that much
Climate change is likely to increase flooding, and given physical of these changes, however, are small and at pre- for there to be an increase in flooding. If the same
sent indistinguishable from natural variations.43 amount of rain falls in shorter, heavier events,
limits to flood adaptation, emissions reductions are needed to floods are more likely.64
Very generally, the north of the UK is likely to get
prevent unmanageable flooding in the future. wetter in winter, the south drier, though the reli- Increased damages from flooding are due to
ability of such specific regional projections is low
more people living and building on flood plains.65
(see bit.ly/ukprecip for more info].44 As well as these social factors, bigger, more fre-
Summary densation, the atmosphere is able to hold more
water.11 This is like fuel for weather systems,12-15
World quent floods increase damages,66,67 and due to Experts
Globally, large floods have become substantially climate change will likely play a bigger role in the
Identifying the influence of climate change increasing the chances of more intense precipi- Dr Nat Johnson
more frequent over the 20th century,45 with large future.68
in observations is difficult because many tation which, given the right conditions, means IPRC, USA
factors contribute to flooding. more flooding.16 Atmospheric water vapour has inland floods twice as frequent per decade be- You can’t blame drought and floods on climate
Climate variability; ENSO;
However, it is likely that climate change will increased by 5% over the 20th century, in line tween 1996 and 2005 as between 1950 and 1980.46 change.69 Observations already show an increase extreme weather;
contribute to flooding from rising sea levels, with what basic physics expects from the ob- Some of this is likely due to better reporting and in extreme precipitation and in drought, though forecasting
melting glaciers and by intensifying rainfall. served temperature rise.17-19 changing land use.47 in different places (see graphic below).70 Gener-
In parts of the Northern Hemisphere, climate natj@hawaii.edu
ally, wet places will get wetter (and make flooding
change has contributed to more intense But identifying the influence of climate change in The number of heavy precipitation days 48 and +1 808 956 2375 GMT -10
more likely), and dry places will get drier (making
heavy precipitation since the 1950s. observations is difficult, for several reasons:20 sudden downpours49 has increased over the
droughts more likely).71
Multiple factors likely contributed to a --Measuring flooding is hard. Direct measure-
last half of the 20th century in many areas of the Dr Elizabeth Kendon
substantial global increase in large floods over ments of flooding, and factors that influence
Northern Hemisphere. Though total or average
precipitation may not have changed much, evi-
What the scientists say Met Office, UK
the 20th century. flooding (heavy precipitation, continuous wet Extreme rainfall; precipita-
dence suggests climate change is causing it to fall Prof. Ian Cluckie (University of Bristol, UK): “Ten tion projections; modelling
periods, glacier-melt, sea level rise, river flow,
Context water run-off from land) are often short-term
in more intense bursts.50,51 All these trends are per cent of UK housing is on flood plains, but this
elizabeth.kendon@
likely to continue.52 is quite low compared to some countries – it is
Floods affect roughly 140 million people every or only cover small areas.21 Changes in these metoffice.gov.uk
70% in Japan and 100% in the Netherlands.”72
year – more than all other natural disasters put factors don’t necessarily mean more or less These observations have been at the upper end +44 (0)1392 884 760 GMT
together.1 They contaminate drinking water, ruin floods.22 Measuring economic damages from of IPCC projections, suggesting that models Dr Kevin Trenberth (National Center for Atmos-
harvests and wash out fertilizers and nutrients flooding can include changes in population, may be underestimating intense precipitation pheric Research, USA): “There is a systematic in- Dr Alison Kay
from soil; water-logged fields rot food and spread wealth and infrastructure on floodplains and in increases.53,54 Future projections vary widely and fluence on all of these weather events now-a-days CEH, UK
coastal areas, rather than just changes in flood- few robust regional projections have been made. because of the fact that there is this extra water Water; flooding and
crop diseases, prolonging famine.2 Stagnant water
ing.23,24 Generally, higher latitudes will become wetter, vapor [sic] lurking around in the atmosphere ... climate change
contaminated with sewerage, fertilizers and oil
spread water-borne diseases like typhoid, cholera making flooding more likely.55,56 However, because this is one manifestation of climate change.”73
--Finding a trend is difficult. Floods are regional alkay@ceh.ac.uk
and diarrhoea.3 Floods interrupt power supplies, and happen relatively infrequently, making flooding is very localised, and depends on many Prof. Stefan Rahmstorf (Potsdam Institute for +44 (0)1491 838 800 GMT
communications and transport; they damage trends hard to identify.25 Long-term trends factors, it is hard to say where and when floods Climate Impact Research, Germany): “Looking only
homes, property and infrastructure.4 Floods can can be hidden by significant year-to-year and might be more or less common. at individual extreme events will not reveal their Dr Nick Reynard
cause, just like watching a few scenes from a CEH, UK
also trigger landslides.5 Many impacts will worsen
as temperatures continue to rise.6
decade-to-decade variation.26,27 Average precipi-
tation need not change much for more floods to
What the sceptics claim movie does not reveal the plot.”74 Flood risk; flood projections
occur – the same amount of rain might fall in Flooding is not caused by climate change.57 Dr Andrew Weaver (University of Victoria, Canada): nsr@ceh.ac.uk
If flood risk continually increases, adaptive meas- Climate change affects some of the factors that
more intense but sporadic events, increasing the “We should continue to expect increased flooding +44 (0)1491 838800 GMT
ures become obsolete – there are limits on how cause, and can exacerbate flooding - by concen-
likelihood of flooding.28 associated with increased extreme precipitation
high we can build flood defences, for example trating or intensifying precipitation; and by melting
– we can’t play ‘catch-up’ forever.7 British people --Many factors contribute to different types of because of increasing atmospheric greenhouse
exposed to flooding regard climate change as floods. Local precipitation and water availability gas.”75
more concerning and less uncertain, even if the can be influenced by climate change but also What the data says For more info
flood cannot be attributed to climate change. They depend on atmospheric circulations,29 natural
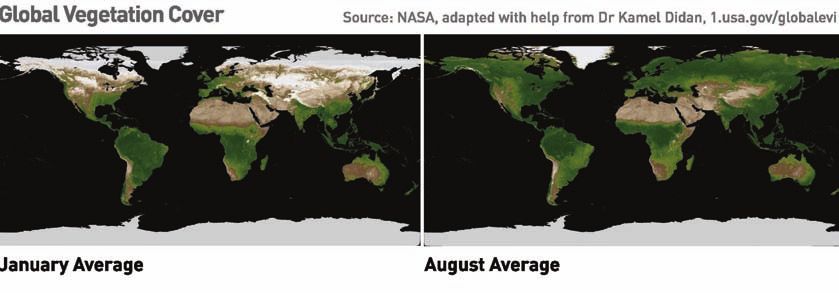
also feel that their actions will have an effect on cycles like the El Niño Southern Oscillation (see Changes in Annual Precipitation 1951-2000 Great satellite pictures of
Change in global
climate change and are more prepared to act.8 p14), and monsoons.30 Human factors like land- annual precipitation
floods (2001-present)
use change, water management and irrigation when averaged over bit.ly/floodimages
Background science have all affected watercourses; agriculture, the whole world
between 1951-2000
deforestation, loss of flood plains, and urbanisa- is only -0.03mm/day.
A summary of research
Increasing temperatures affect flooding directly: tion can all affect the likelihood or severity of showing human effects
--Rising sea levels (from melting land ice, and flooding.31 Source: NASA, on rainfall
1.usa.gov/precipmap
ocean expansion due to warming), in combina- --Attribution to climate change is hard.32,33 The bit.ly/humaneffect
tion with cyclones and high tidal surges, in- impact of climate change on, or amongst, the
crease flood risk.9 Flood insurance and
multiple factors that create the particular cir-
cumstances of a flood (or a trend in flooding)
climate change
--Melting glaciers put pressure on watercourses bit.ly/flood-insurance
downstream which can cause flooding.10 can be difficult to identify.34,35 It is difficult to say
that climate change is the cause of a flood, but mm/day
and indirectly: it can affect the likelihood of one – for example
-4 -2 -1 -0.5 -0.3 -0.1 0.1 0.3 0.5 1 2 4
--By encouraging evaporation and reducing con- one study found that the floods in the UK in 2000
16 www.pirc.info/factsheets 17
side ‘normal extremes’ (see graphic below). They climate change amplifies high temperatures, re-
caused approximately 70,00043-45 and 55,00046 sulting in hotter, longer and more frequent heat
HEATWAVES
deaths respectively.47 Because almost everything waves.76,77
has adapted to, or been made to withstand ‘nor-
It’s the Urban Heat Island (UHI) effect.78 The UHI
HEATWAVES
mal’ historic extremes, the majority of impacts
effect can push already-high temperatures up fur-
are harmful outside this range.48,49 Keep in mind
ther in cities, intensifying heatwave conditions.79
though, that not all recent (and future) heatwaves
It is not the cause of heatwaves. Death rates are
are outside of what would be expected.50 also higher in cities during a heatwave due to air
Future projections pollution, making it seem as though the heatwave
As average global temperatures increase, we are likely to see Heatwaves are very likely to become generally is worse in urban areas.80,81
longer, hotter, and more frequent in places that
more record highs, and fewer record lows. This would make already experience them.51-53 In Europe, heat-
There are also loads of cold snaps!82,83 No-one is
saying there will be no cold periods. But, as aver-
heatwaves longer, more frequent and more intense. waves such as 2003’s could become five-to-ten age temperatures rise, we are likely to see more
times more likely over the next 40 years.54,55 One record highs and fewer record lows. This trend
study suggests that by 2300, with an eventual is already evident in the USA84,85 and Australia.86
global warming of 10ºC (possible under business- Peak temperatures are also rising much faster
Summary Heatwaves with hot nights (as well as days) are
more dangerous as there is no respite from the
as-usual scenarios), heat and humidity would than the averages, making more extreme heat- Experts
make almost half of the world’s most populous waves more likely.87
Both natural cycles and climate change can heat.14 Humid heat is more dangerous than dry Dr Erich Fischer
contribute to the local high-temperature areas uninhabitable.56,57
heat,15 as it is more difficult to cool down by It’s better when it’s warmer because cold win- IAC, Zurich
periods of a heatwave. sweating.16 Even in dry heat, we rarely survive Little research has focused on future impacts of ters kill more people than warm summers.88,89 Climate extremes;
Local temperatures during the heatwaves in temperatures that stay higher than 45ºC for heatwaves on poorer areas; but with little capacity As heatwaves get longer, hotter and more fre- heatwaves & health;
Europe (2003) and in Russia (2010) were much long.17 Less severe heatwaves can and do kill to adapt,58 they will likely be severe.59 Areas less quent the number of additional people killed by recent heatwaves
higher than extremes for these places over the – through heat exposure, or by aggravating pre- used to heatwaves are likely to be ill-prepared.60 them will likely outweigh the reduction in deaths erich.fischer@env.ethz.ch
last 510 years. existing conditions.18 The very young, elderly and Cities will be more severely affected than rural due to fewer harsh winters (up to five times by +41 44 632 82 41 GMT +1
unwell are at most risk.19,20 Air pollution in cities areas.61 The World Health Organisation (WHO) es- 2100).90,91
Globally, heatwaves on average have become
timates that every 1ºC increase in ‘apparent’ tem-
slightly hotter and more frequent. intensifies the impacts of a heatwave.21,22 Changes Dr Lisa Alexander
to behaviour (using air conditioning or resting dur- perature (heat and humidity together), leads to 3% What the scientists say CCRC, Australia
This trend is likely to continue, with record ing the hottest hours) and early warning systems more deaths in European cities.62 Fewer deaths in
Dr Kevin Trenberth (National Center for Atmos- Extreme events; observa-
heatwaves experienced more often in some can reduce the impact.23-25 generally milder winters will likely be outweighed
pheric Research, USA): “For extreme events, the tions; climate models
areas. (up to five times by 2100) by more deaths due to
Knock-on effects such as damage to vegetation heatwaves.63,64 question isn’t, ‘Is it global warming or natural l.alexander@unsw.edu.au
Context from excessive heat, drought or wildfire could act variability?’ It is always both. The question is just GMT +10
Recent heatwaves in Europe (2003) and Russia
as reinforcing (or ‘positive’) climate feedbacks,26-28
and can kill by affecting local food and water
What the sceptics claim how much each is contributing.”92
Prof. Katharine
Dr Myles Allen (Oxford University, UK): “... on a
(2010) were literally off the scale, with tempera- sources, or by increasing global food prices, as You can’t attribute heatwaves to climate Hayhoe
tures significantly higher than the ‘extremes’ in Russia in 2010 (see Drought, p.12 and Wildfires, middle-of-the-road scenario for emissions - as-
change.65 Excessive heat can be caused by several University of Illinois, USA
of the last 510 years,1 and had less than a one- suming we don’t do very much to combat climate
p.26 for more on these points).29 factors, making heatwaves difficult to attribute Impacts; climate models
in-750 chance of occurring naturally in the climate change - temperature heatwaves as high as the
New extremes directly.66 However, warming caused by additional one in 2003 would be occurring every other year katharine.hayhoe@ttu.edu
a few decades ago.2,3 Climate change projections greenhouse gases has increased the likelihood of
Peak temperatures are rising much faster than by the middle of this century, ... By the end of the +1 806 742 0015 GMT -6
suggest heatwaves like these will become more some heatwaves.67
common in the future if we do little to mitigate averages,30 in line with climate model predic- century, 2003 would be a cool year.”93
Heatwaves are natural.68-70 / There have been Dr Jerry Meehl
climate change:4 they may be the ‘norm’ by the tions.31 Extremely hot days are becoming hotter Dr Noah Diffenbaugh (Purdue University, USA): NCAR, USA
2040s,5,6 with a possibility that “by the end of the and more frequent, making heatwaves more heatwaves in the past.71,72 Recent heatwaves in “One might expect that an average warming of
Europe (2003) and Russia (2010) were by far the Climate variability; model-
century, 2003 would be a cool year” (Dr Myles likely.32,33 Globally, there has been an observable four degrees would equate to each day warming
ling; climate extremes
Allen, Oxford University, UK).7 increase in the frequency of heatwaves.34 Since hottest of the last five centuries.73,74 Local tem- by 4 degrees, but in fact the hottest days warm
the 1950s, heatwaves have been lengthening in peratures are influenced by high-pressure sys- quite a bit more.”94 meehl@ucar.edu
Historically, the UK has rarely experienced se- tems, promoted by natural atmosphere and ocean +1 303 497 1331 GMT -7
some places (central and easternEurope,35,36
verely high temperatures, but projections suggest circulations, or cycles such as ENSO.75 However,
we too will have longer, hotter and more frequent Alaska, Canada, Siberia, central Australia 37); but
shortening in others (south-eastern USA, eastern
heatwaves in the future.8 Currently, planning to
Canada, Iceland and southern China).38,39
cope with heatwaves is not a major part of central For more info
and local government policy, especially outside Local temperatures are influenced not only by What the data says
the healthcare sector.9 A recent UK survey of climate change, but by cycles such as El Niño (see Crock of the Week
those most at risk from heatwaves (the elderly p.14) and atmosphere and ocean circulations that Average Summer Temperature Switzerland (day & night), 1864 - 2003
videos on heatwaves
and unwell), found they hugely underestimated promote high-pressure systems. This makes at- bit.ly/heatwavesvideo
the danger of a heatwave.10 tributing any heatwave to climate change difficult,
because both climate change and natural factors Is this extreme down to
Background science contribute.40 New research can, however, tell if climate change?
climate change has made a heatwave more likely bit.ly/extremeevents
Typically, a heatwave is declared once it has been
2003
1923
– for example, the 2003 European heatwave was
2002
hotter than a particular temperature for a number at least twice as likely because of warming caused
of days, though there is no universal definition.11
European (2003) and
by human greenhouse gas emissions.41 There Russian (2010)
Impacts is only a 20% chance that the Russian heatwave heatwaves summarised
in 2010 would have happened without climate
A heatwave has detrimental effects on human life, bit.ly/2003and2010
change, and records like this are now five times
regional economies and ecosystems.12 Anything
as likely.42 Is climate change
that is used to near-constant temperatures, or 10 12 14 16 18 20 22 24 26
that functions near its temperature limits, is vul- Europe (2003) and Russia (2010) experienced the Temperature (°C) Source: Schär, C. et al. (2004) The role of increas- affecting extremes?
ing temperature variability in European summer
nerable to heatwaves.13 hottest heatwaves of the past 510 years, far out- heatwaves, Nature 427, 332-336. bit.ly/extremelyhot
18 www.pirc.info/factsheets 19You can also read