Ecosystem dynamics in the last decades - WP2 - D2.1
←
→
Page content transcription
If your browser does not render page correctly, please read the page content below
Report on tropical Atlantic marine
ecosystem dynamics in the last decades

WP2 – D2.1
Coordination: Arnaud Bertrand1,2,3 and Martin Zimmer4
WP2 participants and additional contributors: Corrine Almeida5, Moacyr Araujo2,
Christophe Barbraud6, Sophie Bertrand1,3, Rebecca Borges4, Andrea Z. Botelho7, Timothée
Brochier8, Ana Carvalho9, Liliana Carvalho9, Daniela Casimiro9, Ana C. Costa7, Alex Costa da
Silva2, Hervé Demarcq1, Malick Diouf10, Gilles Domalain1, Paulo Duarte3, Eric Dutrieux11,
Werner Ekau4, Beatrice P. Ferreira2, Thierry Frédou3, Flavia Lucena Frédou3, Daniela
Gabriel7, Lucy G. Gillis4, José Guerreiro9, Fabio Hazin3, Helène Hegaret12, Véronique Helfer4,
Ariane Koch-Larrouy13, François Le Loc'h12, Alciany da Luz13, Inês Machado9, Vito Melo13,
Albertino Martins13, Vitor Paiva9, Jaime Ramos9, Osvaldina Silva13, Pericles Silva13, Philippe
Soudant14, Modou Thiaw15, Yoann Thomas12, Sébastien Thorin11, Paulo Travassos3,
Humberto L. Varona2, Maria Anunciação Ventura7

Affiliations:
1
  Institut de Recherche pour le Développement (IRD), MARBEC, Univ Montpellier, CNRS, Ifremer, IRD, Sète,
France.
2
  Universidade Federal de Pernambuco, Departamento de Oceanografia, Recife, PE, Brazil.
3
  Departamento de Pesca e Aquicultura, Universidade Federal Rural de Pernambuco, Rua D. Manuel de
Medeiros, sn, Dois irmãos, CEP 52171-900, Recife, PE, Brazil.
4
  Leibniz Centre for Tropical Marine Research, Department of Ecology, Bremen, Germany.
5
  DECM, UniCV/Universidade de Cabo Verde, CP 163 Mindelo, Cabo Verde
6
  Centre d’Etudes Biologiques de Chizé, UMR 7372, Centre National de la Recherche Scientifique, 79360 Villiers
en Bois, France
7
  CIBIO, Centro de Investigacão em Biodiversidade e Recursos Géneticos, InBIO Laboratório Associado, Polo dos
Açores, Universidade dos Açores, 9501-801 Ponta Delgada, Portugal.
8
  IRD, UMMISCO, Sorbonne Université, Université Cheikh Anta Diop, Campus international UCAD/IRD de Hann,
Dakar, Senegal.
9
  MARE – Marine and Environmental Sciences Centre, Faculty of Sciences of the University of Lisbon, Portugal.
10
   Université Cheikh Anta Diop de Dakar (UCAD), Institut Universitaire de Pêche et d’Aquaculture (IUPA),
Dakar, Senegal
11
   CREOCEAN, Les Belvédères, Bâtiment B, 128, Avenue de Fès, 34080 Montpellier, France
12
   Laboratoire des Sciences de l’Environnement Marin (LEMAR), UMR 6539 CNRS UBO IRD IFREMER –Institut
Universitaire Européen de la Mer, Technopôle Brest-Iroise, Rue Dumont d’Urville, 29280, Plouzané, France
13
   Instituto Nacional de Desenvolvimento das Pescas, Mindelo, Cabo Verde.
14
   IRD, Laboratoire d'Etudes en Géophysique et Océanographie Spatiales (LEGOS), Université de Toulouse, CNRS,
IRD, CNES, UPS, 14 avenue Edouard-Belin, 31400 Toulouse, France
15
   Centre de Recherche Océanographique de Dakar-Thiaroye, (CRODT), ISRA Pôle de Recherche de Hann, Dakar,
Senegal.

          This project has received funding from the European Union’s Horizon 2020 research and innovation programme
          under grant agreement No 734271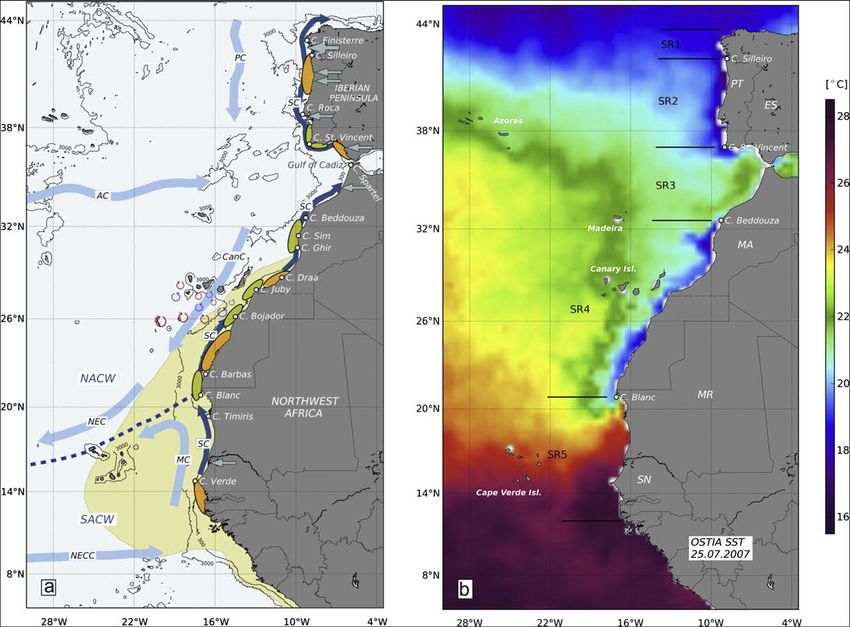
Report on tropical Atlantic marine ecosystem dynamics in the last decades

Outline
1.     INTRODUCTION                                                                                                3
1.1.     FOREWORD                                                                                                  3
1.2.     OVERALL TRENDS IN OCEANOGRAPHIC CONDITIONS IN THE TROPICAL ATLANTIC                                       3

2.     NORTHEAST BRAZIL                                                                                            6
2.1.     CONTEXT/SITUATION                                                                                         6
2.2.     PHYSICAL DYNAMICS                                                                                         7
2.3.     NATURAL AND ANTHROPOGENIC FORCING                                                                         9
2.4.     FISHERIES DISTRIBUTION, ABUNDANCE, SEASONALITY, PRODUCTION AND AQUACULTURE                               13
2.4.1.     OVERALL CHARACTERISTICS                                                                                13
2.4.2.     TEMPORAL TRENDS                                                                                        18
2.5.     CURRENT STATE AND EXISTING MEASURES FOR MARINE SPATIAL PLANNING                                          23

3.     CANARY CURRENT SYSTEM                                                                                      25
3.1. CONTEXT/SITUATION                                                                                            25
3.2. PHYSICAL DYNAMICS                                                                                            27
3.3. NATURAL AND ANTHROPOGENIC FORCING                                                                            29
3.3.1. CURRENT STATE AND EXISTING MEASURES FOR MARINE SPATIAL PLANNING                                            33

4.     CAPE VERDE                                                                                                 35
4.1.     CONTEXT/SITUATION                                                                                        35
4.2.     PHYSICAL DYNAMICS                                                                                        36
4.3.     NATURAL AND ANTHROPOGENIC FORCING                                                                        37
4.3.1.     BIODIVERSITY                                                                                           37
4.3.2.     COASTAL AND MARINE PROTECTED AREAS                                                                     40
4.3.3.     ANTHROPOGENIC FORCING                                                                                  41
4.4.     FISHERIES DISTRIBUTION, ABUNDANCE, SEASONALITY, PRODUCTION AND AQUACULTURE                               42
4.4.1.     ARTISANAL/DEMERSAL FISHERIES                                                                           42
4.4.2.     INDUSTRIAL FISHING                                                                                     44
4.4.3.     AQUACULTURE                                                                                            48
4.5.     CURRENT STATE AND EXISTING MEASURES FOR MARINE SPATIAL PLANNING                                          49
4.5.1.     NATIONAL LEGAL FRAMEWORKS THAT CAN ENHANCE MSP                                                         49

5.     CONCLUSION                                                                                                 50

6.     REFERENCES                                                                                                 51

                                                                                                                   2
           This project has received funding from the European Union’s Horizon 2020 research and innovation programme
           under grant agreement No 734271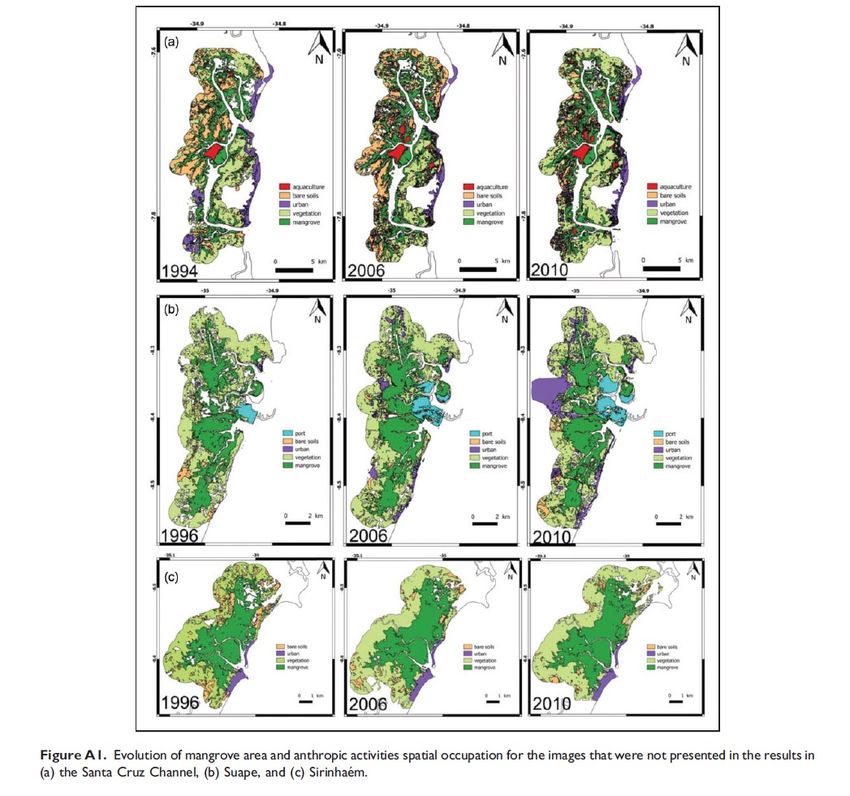
Report on tropical Atlantic marine ecosystem dynamics in the last decades

1. Introduction
1.1. Forew ord
With 625 million inhabitants, the coastal regions of the world –defined as "low-elevation coastal
zone" (LECZ) with less than 10 m elevation above sea level (e.g., Neumann et al., 2015) host more
than 8% of the world population – even 40% of the global population live within 100 km of the
coastline. Taking into account only coastal countries, the LECZ comprises solely 2.3% of the total land
area, but 10.9% of their population (year 2000: Neumann et al., 2015). On a global scale, 83% of the
LECZ population live in the less advanced countries. Global demographic changes, migration and
economic development (Hugo, 2011; Smith, 2011) and ever increasing population growth will
increase the population size and density in coastal areas over the next decades, particularly in
tropical and developing countries of Africa and Asia (Seto, 2011; Neumann et al., 2015). Under
current scenarios of climate change and relative sea level rise, hence, more and more people will be
at risk of being threatened and harmed by extreme weather events, natural hazards and disasters
(McGranahan et al., 2007; Syvitski et al., 2009; Nicholls and Cazenave, 2010; Hanson et al., 2011;
Hallegatte et al., 2013).

The corresponding increased use of natural resources of the coast and the adjacent seas, along with
the increasing production and release of potentially polluting –including eutrophying– substances,
will drive changes in coastal zones and generate ever growing pressure on coastal and marine
ecosystems (Crossland et al., 2005; Patterson et al., 2008). The partly competing uses of resources
and land or sea warrant conflicts among stakeholders. Marine Spatial Planning (MSP) aims at
organizing and harmonizing multitude of human activities in the marine and coastal environment.
Beyond exhaustively knowing the corresponding groups of stakeholders and comprehending their
needs and requirements, spatially explicit information on the availability of the respective resources
is key and of paramount relevance for effective spatial planning. Whereas this prerequisite of MSP is
met across most of Europe's coasts and national EEZs, MSP is still in its infancy in most countries of
the Tropical Atlantic. Often, awareness of natural resources and their exploitation versus availability
is only fragmentary or restricted locally or –at best– regionally. Despite extensive long-term data sets
of transatlantic processes between Africa and South America (e.g. "Prediction and Research moored
Array in the Tropical Atlantic", www.pmel.noaa.gov/gtmba/pmel-theme/atlantic-ocean-pirata), a
global view of tropical Atlantic coasts and coastal seas, and their natural resources, is essentially still
lacking.

This report aims at gathering and summarizing, as a case study for Western (Brazil) and Eastern (Cape
Verde, Senegal) tropical Atlantic countries, information on marine and coastal natural resources and
their use and exploitation status.

1.2. Overall trends in oceanographic conditions in the Tropical Atlantic
The Tropical Atlantic is characterised by a belt of extremely warm sea surface temperature (SST) >
27°C centred at 5°N in the western portion. Fed by the North and South Equatorial currents as well as
the outreaches of the Guinea Dome from the East Atlantic, the warm surface water masses extend to
a range from 15°N to 15°S in the Western Atlantic thereby dominating the East and Northeast
Brazilian coastal waters (Figure 1.1 left panel; Stramma et al., 2008; Servain et al., 2014). The
Mauritanian and Senegalese regions, located in the southern part of the Canary Current upwelling
system, has comparatively low average SST of < 19°C while the Cape Verde area shows SST of 25 to
26°C originating from the North Equatorial Counter Current/Mauritanian Current (Guinea Dome).
The warming observed from 1985 to 2007 (Demarcq, 2009) in the western tropical Atlantic was
strongly attenuated during the last 2 decades (Figure 1.1 right panel). A noticeable cooling in the
                                                                                                    3
          This project has received funding from the European Union’s Horizon 2020 research and innovation programme
          under grant agreement No 734271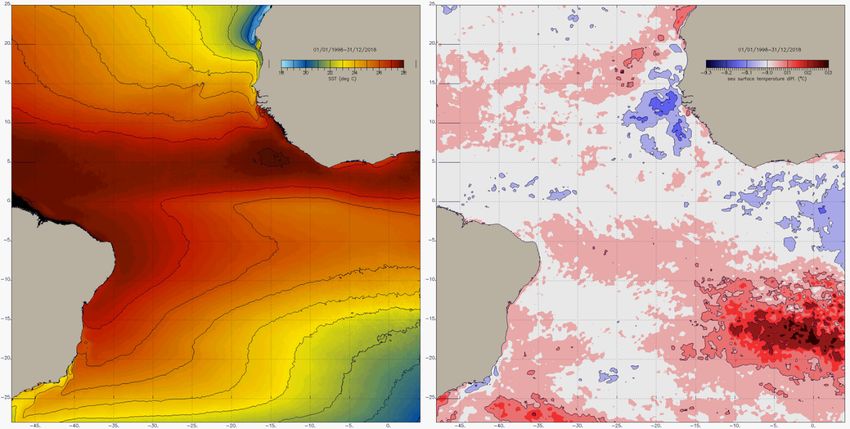
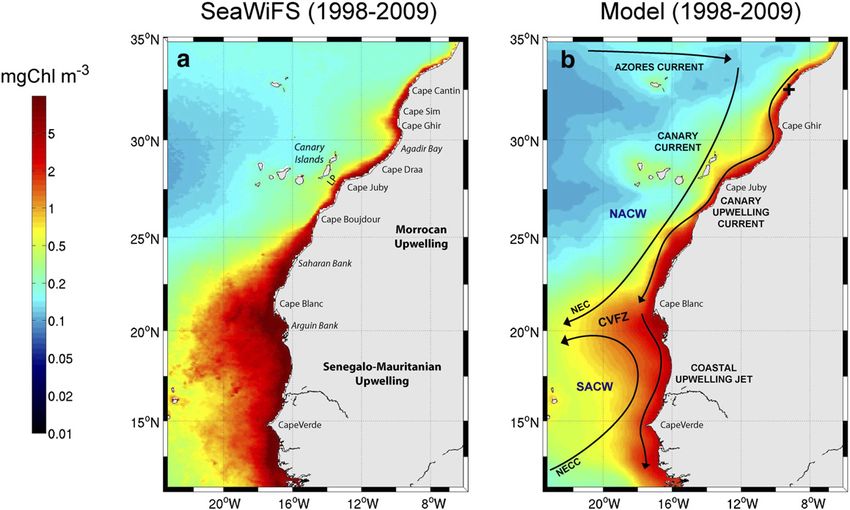
Report on tropical Atlantic marine ecosystem dynamics in the last decades

Senegalese and Guinean regions due to an increase in the coastal upwelling intensity. The Cabo Frio
upwelling in Brazil is also increasing. Other regions including Northeast Brazil present null or
moderate warming (< +0.05°C per decade). The cooling observed in the upwelling areas for the same
period correspond to higher phytoplankton biomasses (Figure 1.2 left panel). This positive trend in
productivity was even stronger during the last 16 years (Figure 1.2 right panel). A moderate positive
SST trend was observed in the equatorial region, where the eastern cooling is associated with a slight
increase in Chlorophyll-c close to the equator. Finally, the temporal trend in productivity does not
present a clear pattern along the coast of Northeast Brazil with a slight coastal increase when
considering the full time period (1998-2018) but a moderate decrease during the last 16 years (2003-
2018). Note that this discrepancy could be due to the use of two satellite sensors during the 1998-
2018 period (Figure 1.2 left panel) versus the 2003-2018 period with a single sensor (MODIS).

Oceanic upwelling along the northwest African coastline stretches from 12°N to 33°N. Between 20°N
and 25°N, off West-Sahara and Mauritania, upwelling occurs year-round (Mittelstaedt, 1991; Cropper
et al., 2014). The sea off Mauritania and Senegal represents a transition zone between the relatively
cool water masses of the Canary Current upwelling system coming from the North and the
outreaches of the warm tropical waters of the Guinea Current from the South. The boundary
between these water masses varies seasonally between the Cap Blanc (northern edge of Banc
d’Arguin) and the region Cap Vert to Cabo Roxo (see Figure 3.1. for details on geographic locations).

The waters off northern Mauritania are among the most productive marine areas in the world (11 µg
l-1 Chl-a [chlorophyll-a]; Quack et al., 2007; primary production = 2.5 g C m-2 d-1, seaaroundus.org)
and are important fishing grounds (Binet et al., 1998). Oceanic upwelling causes elevated
concentrations of nutrients on the shelf (up to 1.3 and 18 mmol l-1 in the surface waters, respectively;
Quack et al. 2007), and influx of eolian dust is thought to result in elevated iron concentrations (e.g.,
Ohde and Siegel, 2010). The narrow (65 km) shelf of NW Africa broadens offshore northern
Mauritania to the Golfe d’Arguin, with a width of some 150 km. This extensive gulf hosts the shallow
Banc d’Arguin (ca. 15,000 km2 mostly
Report on tropical Atlantic marine ecosystem dynamics in the last decades

Figure 1.1. Sea surface temperature mean (left panel) and temporal trend (right panel) in the Tropical Atlantic for
the period ranging from 1998 to 2018. Data source: AVHRR SST (pathfinder v5.3), night SST and day SST data
                                                  combined.

Figure 1.2. Trend in chlorophyll-a concentration in the Tropical Atlantic during 1998-2018 (left panel) and 2003-
               2018. Data source: SeaWiFS (1998-2007 period) and MODIS (2003-2018 period).

                                                                                                                    5
          This project has received funding from the European Union’s Horizon 2020 research and innovation programme
          under grant agreement No 734271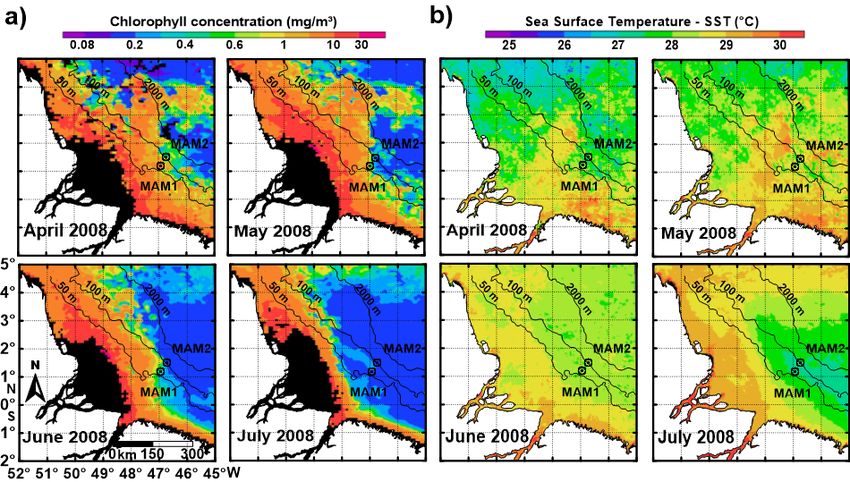
Report on tropical Atlantic marine ecosystem dynamics in the last decades
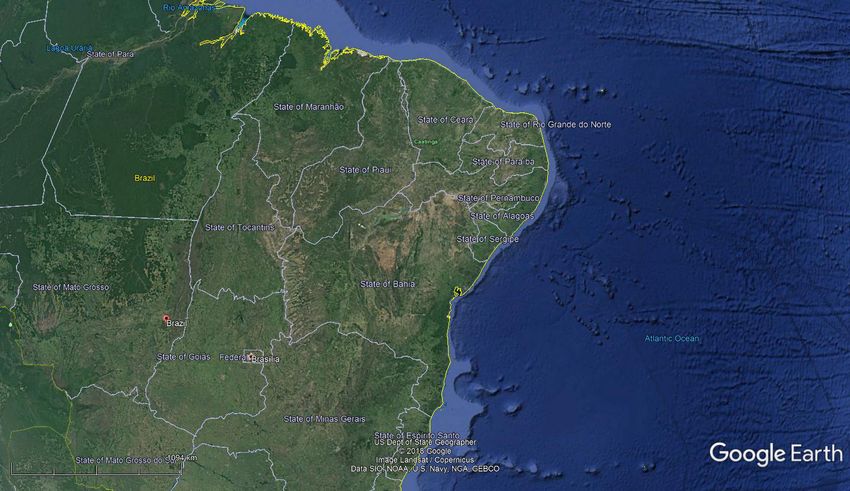
2. Northeast Brazil
2.1. Context/Situation
Figure 2.1. Northeast Brazil.
As compared to highly productive upwelling areas (see above), the Northeast Brazilian coast (Figure
2.1) is characterized by a low level of productivity mainly due to the influence of oligotrophic tropical
waters. The southern branch of the South Equatorial Current originating from the Angola and
Benguela currents and heated up while crossing the tropical Atlantic, dominates the region and
bifurcates between 5°S and 20°S into the North Brazil Current of Brazil, which moves towards
Guyana, and the Brazil Current moving the southern direction. The influence of the oligotrophic
Equatorial Surface Water (ESW) was found to reach up to the area between the 10 and 20 m isobath,
representing 5 to 15 km from shore. This restricts the fertilisation effect by nutrient and POM export
from the estuaries to a very nearshore band of sandstone reefs off Pernambuco and adjacent coasts
(Ekau and Knoppers, 1999, Medeiros et al., 1999; Schwamborn et al. 1999). Also, the permanent
presence of a thermocline along the entire Northeastern water contributes significantly to the
impoverishment of the oceanographic environment. Since the thermal gradient is also a density
gradient (pycnocline), the thermocline hinders the occurrence of vertical movements by mixing,
inhibiting, consequently, the transport of nutrients to the euphotic zone. From the biological point of
view, therefore, northeast Brazil is an oligotrophic region, with low primary productivity (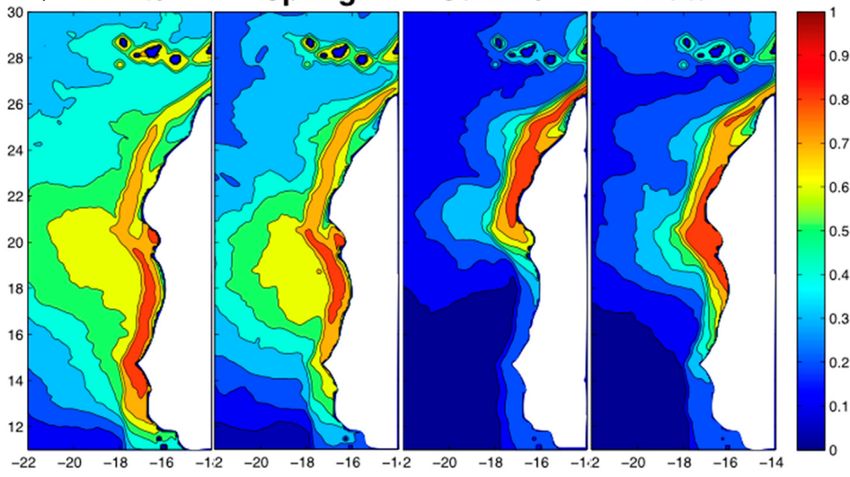
Report on tropical Atlantic marine ecosystem dynamics in the last decades

nodules of coralline algae that occur in shallow waters (less than 150 m depth), are important
ecosystem engineers that could also be affected. Ocean acidification could cause tropical coralline
algae to stop growing by 2040 and subsequently to start dissolving (Doney, 2009).

Estuaries are preeminent ecosystems along the 9200 km of the Brazilian coast (Lana and Bernadino,
2018). As nurseries and feeding grounds for many important coastal fish species, they provide the
basis for livelihood of numerous fishermen along the coast. The weather in Northeast Brazil is mainly
divided into the rainy season (March- June) and the dry season (September- December). The weather
conditions, although much rougher during July- August, due to the intensification of the Southeast
Trade Winds, do allow fishing throughout the entire year.

Marine aquaculture activities are concentrated in Ceará and Rio Grande do Norte accounting for
almost 80% of the total production in Northeast Brazil, with productions in 2007 of 21,500 t and
27,000 t, respectively. The only marine species cultivated is the Litopenaeus vanamei. Attempts to
commercially cultivate cobia (Rachycentron canadum) and other reef fish species were of limited
success.

2.2. Physical dynam ics
The western tropical Atlantic Ocean is an area of prime importance to global climate change. It is an
area through which oceanic signals, from intra-seasonal to decadal scales and multidecadal scales,
must pass (Dengler et al., 2004; Schott et al., 2005). Moreover, this region is subjected to cyclonic
and anticyclonic gyres strongly controlled by surface winds (Stramma and Schott, 1999; Lumpkin and
Garzoli, 2005). These gyres drive the divergence of the southern branch of the South Equatorial
Current (sSEC) (Rodrigues et al., 2007; Silva et al., 2009), which is partially at the birth site of several
current systems that flow along the Brazilian coastline (Figure 2.2). The northern portion of the sSEC
termination flows northward, forming the North Brazil Undercurrent/North Brazil Current
(NBUC/NBC) system. This powerful western boundary current contributes to the northward Guyana
Current (Bourlès et al., 1999; Stramma et al., 2005) and seasonally to the eastward North Equatorial
Counter Current (NECC). It also feeds its associated complex retroflection system (Goes et al., 2005),
as well as the eastward Equatorial Undercurrent (EUC). It is believed that NBC accounts for
approximately one-third of the net warm-water flow transported across the equatorial tropical gyre
boundary into the North Atlantic; this compensates for the southward export of North Atlantic Deep
Water (NADW) through the Deep Western Boundary Current (DWBC) (Dengler et al., 2004; Schott et
al., 2005).

                                                                                                                  7
          This project has received funding from the European Union’s Horizon 2020 research and innovation programme
          under grant agreement No 734271
Report on tropical Atlantic marine ecosystem dynamics in the last decades

   Figure 2.2. Map of the main currents in the tropical Atlantic: North Brazil Undercurrent/North Brazil Current
    (NBUC/NBC), Brazil Current (BC), northern/central/southern South Equatorial Current (n/c/sSEC), North
Equatorial Counter Current (NECC), North Equatorial Current (NEC). Guinea Dome (GD) and Angola Dome (AD).
                                          Source: Araujo et al. (2019).

The north and northeast Brazilian shore is an unusually energetic coastal region subject to strong
seasonally-driven focings, such as the Amazon River discharge, the North Brazil Current transport,
and trade winds. The Amazonian water lenses extent up to 300/50 km offshore during the periods of
maximum/minimum discharge (see Figure 2.3 for SST Chlorophyll concentration in April-June 2008).
In both situations the halocline is at about 20 m depth (Silva et al., 2005). During boreal late winter
and spring the Amazonian water lenses move southwestwards along the coast in northern Brazil. This
pattern is less pronounced in summer and not observed in fall (Fratantoni et al., 2000).

Figure 2.3. Time series of satellite images for April, May, June, and July 2008, in northern Brazil; a) GSM-4km for
chlorophyll; and b) MODIS-4km for MST. Isobath lines at 50 m, 100 m, and 2000 m are also shown, as well as the
 position of moorings MAM1 and MAM2 in the study area during Programme Amandes. Redrawn from: Prestes,
                                          2016 and Prestes et al. (2018).

                                                                                                                  8
          This project has received funding from the European Union’s Horizon 2020 research and innovation programme
          under grant agreement No 734271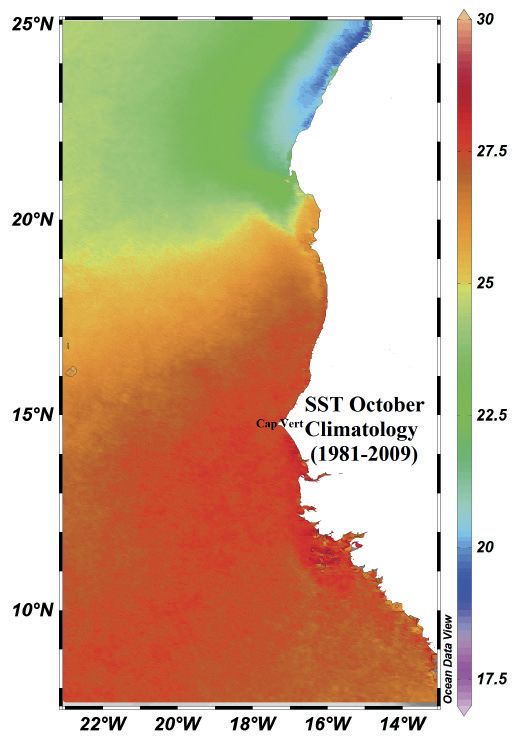
Report on tropical Atlantic marine ecosystem dynamics in the last decades

Trends in sea surface temperature (SST) anomalies from 1979 to 2017 along the northeastern coast
of Brazil averaged from 2° from the coast, are presented Figure 2.4. This time-series was calculated
using the daily means of the SST of the TROPFLUX dataset (Kumar et al., 2012). Until 1996, the most
significant positive SST anomalies occurred in 1987-1988, reaching values slightly higher than 1°C.
From 1997 on, the pattern of positive SST anomalies changes became more frequent, the highest
intensity (1.2°C) occurring in the period 2008-2010. The warming is stronger in strength and intensity
south of 23°S (up to 1.5°C) since 1997. Throughout this region, the years with the greatest SST
positive anomaly were 1998, 2003 and 2010. Finally, drier conditions are projected along the semi-
arid coast of Northeast Brazil (Jennerjahn et al., 2017).

Figure 2.4. Hovmuller of SST anomalies along the Northeastern coast of Brazil from 3.5ºS to 25.5ºS in the period
                                                 1979-2017.

2.3. Natural and anthropogenic forcing
The Northeast is one of the most densely populated coastal regions of Brazil, with the Pernambuco
State, standing out as the epicentre of this concentration. In this region, urbanization and the
degradation of coastal ecosystems has resulted in multiple impacts, mainly due to domestic
pollution, industrial activity and habitat degradation and loss, most severe around the main urban
centre, Recife (Mérigot et al., 2017). There, the rapid growth and expansion of the urban centre over
the last decades have severely affected coastal ecosystems, such as mangroves, seagrass beds and
coral reefs, as well as their connectivity. Considering the multiple usages, coastal and marine
resources are fundamental for the development of the country (Burke et al., 2001). However, human
occupation and expansion threatened water quality and aquatic biodiversity with mangrove removal,
changes in trophic structure, elimination of spawning and nursery sites, decrease in diversity,
infection by pathogens, increase in parasites in commercially important species, and mercury
accumulation (Viana et al., 2010, 2012).

                                                                                                                  9
          This project has received funding from the European Union’s Horizon 2020 research and innovation programme
          under grant agreement No 734271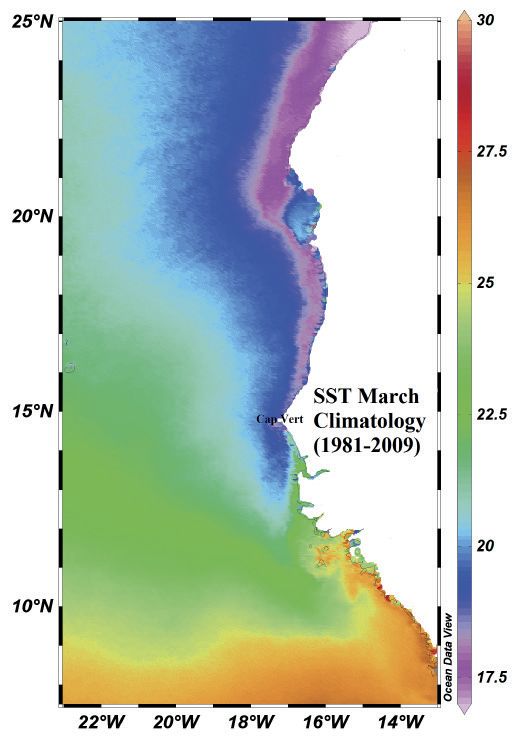
Report on tropical Atlantic marine ecosystem dynamics in the last decades

Brazil harbours the second largest mangrove area in the world. Based on remote-sensing data,
Brazilian mangroves were estimated to have been reduced from 10,124 km2 in 1983 to 9,630 km2 in
2000 (Giri et al., 2011). More recently, Diniz et al. (2019) evaluated the annual Brazilian mangrove
cover status as part of a continental-scale analysis from 1985 to 2018. The first period, from 1985 to
1998, presented an upward trend, which seems to be related more to the uneven distribution of
Landsat-satellite data than to a regeneration of Brazilian mangroves. Then, from 1999 to 2018, a
negative trend of Brazilian mangrove coverage was registered, with a loss reaching up to 2% of the
mangrove forest. In terms of persistence, ~75% of the Brazilian mangroves remained unchanged
(Figure 2.5) for two decades or more, including the states of North and Northeast Brazil, particularly
in the State of Pará where extractive reserves (RESEX) have been implanted and run by regional
cooperatives. Climate change may lead to a maximum global loss of 10% to 15% of this mangrove
forest by 2100 (Alongi, 2008) but such predictions are to be considered with caution. Nevertheless, in
Northeast Brazil, mangroves are expanding rapidly as result of drier conditions and saline intrusion
(Jennerjahn et al., 2017). Overall, mangroves of the region are not expected to be strongly impacted
by the predicted effects of climate change but by anthropic pressures (Alongi, 2015; Bertrand et al.,
2018). Indeed most threats to mangroves arise from land use changes, urbanization, shrimp farms,
alterations to river catchment hydrology, over-exploitation of natural resources, and coastal
construction (Jennerjahn et al., 2017). Protection of coastal ecosystems and management of the use
of their natural resources is hence of pivotal importance. The extractive reserves implemented in
Northeast Brazil explicitly aim at sustainable resource use in locally managed consortia of
stakeholders. For instance, artisanal crab-fisheries and small-scale wood-extraction for the
construction of fish-traps have, according to the latest evaluations, had little, or even negligible,
effects on the mangrove system of the Ajuruteua peninsula. Ongoing analyses of time series of
satellite imageries of this region (V. Helfer and J. Quandt, unpublished data) aim at depicting changes
in mangrove area and species composition over the last decade.

In Northeast Brazil, shrimp farms have been identified as a main threat for mangrove loss (Guimarães
et al., 2010). Pelage et al. (2019) also observed a negative effect of the aquaculture in Pernambuco
state, more evident in Santa Cruz Channel (Figure 2.6). However, in some estuaries of Pernambuco,
an increasing trend of mangrove coverage was observed from satellite data (Diniz et al., 2019; Figure
2.5Figure 2.6), probably related to the salinization, which is a result of anthropogenic activities and
climate change (Jennerjahn et al., 2017; Bertrand et al., 2018). The construction of ports, such as
Suape in Pernambuco, is also another example of human-induced salinization, which altered the
geomorphological and hydrodynamic conditions of the area (Koening et al., 2003), with an increase
in salinity, showing a large ecological impact (Muniz et al., 2005).

                                                                                                                10
         This project has received funding from the European Union’s Horizon 2020 research and innovation programme
         under grant agreement No 734271
Report on tropical Atlantic marine ecosystem dynamics in the last decades
Figure 2.5. Brazilian mangrove cover at the national and regional scale. The top bar shows the overall mangrove
persistence. The bottom graph shows the mangrove persistence per state. The x-axis represents the state
distributions, whereas the y-axis represents the mangrove cover temporal persistence percentages (%). Black
represents 20 years or more of stability, dark grey indicates stability between 10 and 20 years and light grey
represents stability for less than 10 years. The following acronyms represent the Brazilian coastal states: AL
(Alagoas), AP (Amapá), BA (Bahia), CE (Ceará), ES (Espírito Santo), MA (Maranhão), PA (Pará), PB (Paraíba),
PE (Pernambuco), PI (PiauíCE (Ceará), ES (Espírito Santo), MA (Maranhão), PA (Pará), PB (Paraíba), PE
(Pernambuco), PI (Piauí), PR (Paraná), RJ (Rio de Janeiro), RN (Rio Grande do Norte), SC (Santa Catarina), SE
(Sergipe) and SP (São Paulo). Source: Diniz et al. (2019).
11
This project has received funding from the European Union’s Horizon 2020 research and innovation programme
under grant agreement No 734271Report on tropical Atlantic marine ecosystem dynamics in the last decades
Figure 2.6. Spatial evolution of mangrove areas and anthropic activities over the past three decades in (a) the
Santa Cruz Channel, (b) Suape, and (c) Sirinhaém in Pernambuco (Brazil). Source: Pelage et al. (2019).
Anthropogenic impacts related to mercury contamination in the sediment of the drainage basin of
the north coast of Pernambuco state has been also previously documented (Meyer et al., 1998; Lima,
2008, 2009; Gondim, 2015), as a large source of contamination. Despite regulations, which
contributed to reduce the use of mercury (Lacerda, 1997), the problem persists. Mercury is indeed
highly stable in the environment and bioavailable through its biogeochemical cycle for several years,
even if the source of contamination has ceased, as observed in others countries (Birkett et al., 2002;
Fitzgerald and Lamborg, 2013; Levin, 2015). In Pernambuco state, mercury concentrations in the
sediment are higher than the acceptable limit for maintenance of the biota. In addition, strong
relationships were observed between Hg levels in the sediment and those in organisms, confirmed
by a methylmercury biomagnification model (Flavia Lucena-Frédou, unpublished data).
Leaving the coastal zone, Oceanic islands, present in Northeast Brazil are particular environments
that, given their geographic isolation, usually harbour a peculiar biodiversity, with a large number of
endemic species. In Fernando de Noronha for example, the construction of jetties in the late 1980s
generated a population explosion of the white urchin (Tripneustes ventricosus) (Soto, 2009).
12
This project has received funding from the European Union’s Horizon 2020 research and innovation programme
under grant agreement No 734271Report on tropical Atlantic marine ecosystem dynamics in the last decades
2.4. Fisheries distribution, abundance, seasonality, production and
Aquaculture
2.4.1. Overall characteristics
In Brazil, small-scale fisheries (SSF) represent more than 90% of employment in the fisheries sector.
In 2011, almost 600 000 fishers were engaged directly in full time fishing activities within fishing
fleets composed of vessels of less than 12 m length. Most of the industrial fishing fleet is
concentrated in Southern Brazil, while most SSF effort is concentrated in the north and northeast
regions (Bertrand et al., 2018). Brazil has a poor record in fisheries management and several stocks in
that country face over-exploitation and lack of systematic management (Gasalla et al., 2017). Marine
extractive reserves represent the most significant government-supported effort to protect the
common property resources upon which traditional small-scale fishers depend. They benefit 60 000
small-scale fishers along the coast, even though their efficiency is hampered by low enforcement and
other anthropic and economic pressures, including tourism (Santos and Schiavetti, 2014; Bertrand et
al., 2018). In addition, Brazil is a data-poor region in terms of fisheries. Weak governance, the erosion
of traditional resource use systems, open-access regimes, poverty, lack of alternative employment,
and easy access to stocks with low investment and operating costs have promoted overfishing and
exacerbated climate-induced changes in SSF (Gasalla et al., 2017; Bertrand et al., 2018). Actually,
there is a continuous worsening of the problems affecting the production of artisanal fisheries owing
to the depletion of fisheries resources, environmental degradation of coastal areas, and ultimately to
the ineffectiveness of governmental strategies in overcoming the obstacles that impede the
sustained development of the artisanal fishing communities along the Brazilian coast. The overall lack
of information about these fisheries is a subsidiary problem that gives low political visibility to the
sector and thus helps perpetuate its status (Vasconcelos et al., 2011).
In Northeast Brazil, SSF account for more than 80% of the total landings (Paiva, 1997; Diegues, 2006).
Fisheries are based on small- to medium-sized boats using sail or small engines, canoes using oars or
sail. Based on a multi-year Brazilian research Program REVIZEE (Avaliação do Potencial Sustentável da
Zona Econômica Exclusiva do Brasil) created by the Brazilian Government in compliance with the
United Nations Convention of the Law of the Sea, carried out during the late 1990´s and early 2000,
sailboats accounted for 58.2% of the landings, whereas motorized boats accounted for 40.8% (Lessa
et al., 2009b).
There is a large diversity of species and fishing gear/methods used in coastal fisheries in the
northeast (Vasconcelos et al., 2011). Lobsters (Panulirus argus and P. laevicauda), caught by traps, is
an important exportation product and, although it has long been overexploited, it is the most
valuable product in the region. In northeast Brazil, Penaeidae shrimp fishery is carried out mainly by
artisanal motorized boats operating in shallow coastal waters with trawlers, catching (decreasing
order in landing volume) the seabob shrimp Xiphopenaeus kroyeri (Santos et al., 2006), the white
shrimp Litopenaeus schmitti, (which has the highest economic value), and the pink shrimps
Farfantepenaeus subtilis and F. brasiliensis.
In coastal waters, gillnets, longlines, hook-and-line and traps are the most common gears in catching
fish (see Table 2.1 for the main gear for the main species caught in Northeast Brazil). According to
Lessa et al. (2009b), bottom lines and surface lines contribute to around 34% of the production,
capturing species of great economic value, whereas gillnets are responsible for 27% of the regional
production and capture species of lesser value. The line fleet operates up to 250 meters deep, with
distances of up to 30 nm from the coast on trips of up to 22 days. The gillnetting fleet operates in
waters shallower than 100 m on an average 3-day trips. Fish traps are more used in the Pernambuco
than other Northeast States (Lessa et al., 2009b).
13
This project has received funding from the European Union’s Horizon 2020 research and innovation programme
under grant agreement No 734271Report on tropical Atlantic marine ecosystem dynamics in the last decades
Demersal species such as snappers (Lutjanus analis, L. jocu, L. synagris, L. vivanus, L chrysurus), and
pelagic species such as dolphinfish (Coryphaena hippurus), flying fish (Hirundichthys affinis),
mackerels (Scomberomorus brasiliensis and S. cavalla) represents 40.6% of total landing in weight.
Added the catches of groupers (Seriola dumerili and Mycteroperca bonaci) and pompanos (Caranx
spp), this percentage reaches 65.3% (Lessa et al., 2009b).
Fishery inside estuaries and coastal lagoons capturing anchovies, mullets, needlefish, and shrimps are
also reported. Manual collection of crabs and molluscs in mangrove areas is particularly important
throughout the region (Vasconcelos et al., 2011). More than 80% of the rural households in Pará
State gain resources for their livelihood directly from the mangrove forest; 43% of all households fish
and sell mangrove crabs (Glaser 2003; Glaser et al. 2010), being mayor key for sociopolitical stability
and social sustainability in the region and for low-income classes (Glaser, 2003; Glaser and Diele,
2004, Diele et al. 2010). Professional crab fishers capture crabs in their burrow by hand and sell them
alive or for processing, earning about the Brazilian minimum wage (Glaser 2003). Fishing grounds are
reached from land either by walking, with a bicycle or by public bus transportation. Small canoes or
motor vessels are used to access fishing grounds adjacent to the sea. Little is known about the spatial
expansion of the crab fisheries (Araujo 2006).
Brazilian Fisheries Statistics have not been reported since 2007, when the existing system was
gradually dismantled and not replaced. According to the results of this program, Brazilian fisheries far
exceeded sustainable target levels in the main portion and, the majority of stocks were either fully
(23%) or over-exploited (33%) (MMA, 2006). Particularly in the Northeast, 16% were in a
development stage, 25% was considered overexploited, 16% were considered fully exploited and the
remaining 44% of the resources were not assessed (MMA, 2006). The main available information is
summarized Table 2.1. Snappers were mainly over or fully exploited. Pseudupenaeus maculatus,
Haemulon aurolineatum, Carangoides bartholomaei, Carangoides crysus were, by this time,
underexploited and, most small pelagic were considered overexploited, fully exploited or near to
fully exploitation (MMA, 2006). Stocks of lobsters are being overfished and show a decreasing trend
in landings since the 1990s, and landings of groupers show a decreasing trend over time with long-
lived species being overfished, resulting in the targeting of smaller and shorter-lived groupers
(Vasconcelos et al., 2011). In this time, there was no assessments of the status of the stock(s) of
mangrove crabs. However, the decrease in landings of mangrove crabs in most northeastern states
(but not all, e.g. Pará) is understood as a sign of overfishing (Vasconcelos et al., 2011). It is important
to outstand that those assessment of northeast Brazilian resources were not actualised since the
early 2000. This is a serious obstacle for the development of an effective Marine Spatial Planning.
After the Program REVIZEE, the stocks have never been re-assessed though a national initiative.
However, specific programs were developed to assess the sustainability of some fishery resources.
For example, the status of the stocks of penaeidae exploited in Pernambuco have been assessed.
Results indicated that L. schmitti and seabob-shrimp X. kroyeri stocks are relatively close to the state
of full exploitation (Lopes et al., 2014; Silva et al., 2018a) and the pink shrimp F. subtilis exploitation
rate for maximum recruitment yield is lightly above the exploitation rates (0.50-0.64) (Silva et al.,
2015).
14
This project has received funding from the European Union’s Horizon 2020 research and innovation programme
under grant agreement No 734271Report on tropical Atlantic marine ecosystem dynamics in the last decades
Table 2.1. Main species of Northeast Brazilian coast, gear of main vulnerability, depth of occurrence and status of
the stock. Modified from MMA (2006)
Species Gear of main Depth of occurrence Status of the stock
vulnerability
Reef species
Lutajnus analis Bottom longline Continental shelf (20 -80m) Overexploited
Lutjanus crysurus Bottom longline Continental shelf (< 100m) Overexploited
Lutjanus jocu Bottom longline Continental shelf Fully exploited
Lutjanus synagris Bottom longline Continental shelf Overexploited
Lutjanus vivanus Bottom longline Continental shelf (> 70m) Near to fully
exploitation
Lutjanus purpureus Bottom longline Continental shelf (31 a 140m) and Overexploited
Oceanic banks
Pseudupenaus maculatus Fish trap Continental shelf (< 90m) Bellow the maximum
limit
Haemulon aurolineatum Fish trap Continental shelf (15 a 60m) Underexploited
Haemulon plumieri Fish trap and gill net Continental shelf Not evaluated
Seriola dumerili Bottom longline Continental shelf Not evaluated
Caranx latus Handline Continental shelf Not evaluated
Carangoides Bottom longline and Continental shelf Underexploited
bartholomaei handline
Carangoides crysus Gill net Continental shelf Underexploited
Myctepoperca bonaci Bottom longline Continental shelf Not evaluated
Rhizoprionodon porosus Gill net Continental shelf Not evaluated
Small pelagics
Hirundichthys affinis Gill net 0-100 Overexploited
Scomberomorus Surface gill net Continental shelf Fully exploited
brasiliensis
Scomberomorus cavalla Pelagic longline Continental shelf Near to fully
exploitation
Hemiramphus brasiliensis Seine Continental shelf Bellow the maximum
limit
Hyporhamphus Gill net Continental shelf Overexploited
unifaciatus
Ophistonema oglinum Gill net Continental shelf Near to fully
exploitation
The Brazilian program "Institutes of the Millennium", through the project entitled "Use and
Ownership of Coastal Resources" (“Uso e Apropriação dos Recursos Costeiros -RECOS), was
structured in the form of an inter-institutional network, aiming at generating knowledge on fishery
into a broader perspective, involving the economic, technological, social, ecological and management
aspects of the fishery, in order to provide recommendations to the decision makers in the states of
Pará, Maranhão, Pernambuco, Espírito Santo, Rio de Janeiro, Paraná, Santa Catarina and Rio Grande
do Sul. Particularly in Pernambuco, Lessa et al. (2009a) identified seventeen fishery systems covering
gillnets, traps and seines targeting fish and crustaceans as well as hand-collected mussels (Table 2.2).
They observed a decreasing trend in crustacean catches from 1991 to 2009 and an increasing trend
for the bivalve mussels Anomalocardia brasiliana, Protothaca pectorina, Lucina pectinata and
Tagelus plebeius. Following the RAPFISH method (Rapid Appraisal for Fisheries), the shrimp system is
the least sustainable, given its ecological impact mainly; and the most sustainable system were
attributed to the stationary uncovered pound net, followed by the line system (Lessa et al., 2009a),
which mostly approximate of the reference or ideal system (Figure 2.7).
15
This project has received funding from the European Union’s Horizon 2020 research and innovation programme
under grant agreement No 734271Report on tropical Atlantic marine ecosystem dynamics in the last decades
Table 2.2. Fishery systems identified in Pernambuco and variables employed as criteria for system classification.
Source. Lessa et al. (2009a)
Figure 2.7. Average percentage values of sustainability indicators of each evaluation field for fishery systems,
state of Pernambuco, represented in kite diagrams. “GOOD” kite = reference or ideal system, with 100% in all
evaluation fields (SOC = social, ECO = ecological, TEC = technological, ECN = economic, MAN = management).
Source. Lessa et al. (2009a).
16
This project has received funding from the European Union’s Horizon 2020 research and innovation programme
under grant agreement No 734271Report on tropical Atlantic marine ecosystem dynamics in the last decades
Brazilian aquatic resources have also been evaluated according to the IUCN Red List categories at the
regional level. These categories comprise 10 levels: Extinct (EX), Regionally Extinct (RE), Extinct in the
Wild (EW), Critically Endangered (CR), Endangered (EN), Vulnerable (VU), Near Threatened (NT),
Least Concern (LC), Data Deficient (DD) and Not Evaluated (NE). The first list of Brazilian fauna
threatened to extinction was published in 1968 and included 42 species of reptiles, birds and
mammals. That number doubled five years later, when 85 species were on the next list. After 16
years, in 1989, 219 species of vertebrates (except fish), in addition to some terrestrial invertebrates
were evaluated (Pinheiro et al., 2015). Within the Brazilian National Biodiversity Policy instituted
2002, a review of this list was carried out, ending up in a total of 10 aquatic invertebrates and 37
threatened fish, which were considered as overexploited or under threat of overexploitation (IN 5 /
2004) (Pinheiro et al., 2015). The following year, within the National Biodiversity Targets the state of
conservation of all species of plants, vertebrates and key invertebrate groups were reviewed in a
process leaded by the ICMBio (Instituto Chico Mendes de Conservação da Biodiversidade, Ministério
do Meio Ambiente, Brazil), and the red list, published in 2014 (Portaria 445), enumerated 475 aquatic
species as threatened (Figure 2.8Figure 2.8). Marine elasmobranchs represented 56.1% of all
endangered fish in Brazil, and 82.4% of the species categorized as Critically Endangered.
Figure 2.8. Number of aquatic fishes and invertebrates within the three categories: CR (Critically endangered); EN
(endangered); VU (vulnerable). (MMA 445/2014). Blue – aquatic fish. Orange – aquatic invertebrates. Source:
Pinheiro et al. (2015).
Some threatened species are particularly important in the northeast region. The Guaiamú
(Cardisoma guanhumi) is an endemic crab of Brazilian estuaries, mangroves and salt flats, with slow
growth, occupying restricted areas. The species is targeted by artisanal fishing and was classified as
Critically Endangered, which direct impact on some traditional communities in the Brazilian
Northeast, where its extraction is more frequent (Pinheiro et al., 2015). The snapper Lutjanus
purpureus, categorized as Vulnerable, was a relevant fishing resource on the northeastern coast of
Brazil in the 1960s to 1980s, until the fishing collapse in that region. Currently, the fleet explores new
areas in north Brazil, where its fishing is still economically viable. The Scaridae species - Scarus
trispinosus (EN), Scarus zelindae (VU), Sparisoma frondosum (VU) and Sparisoma axillare (VU) –
within the current Brazilian red list, are also important resources in Northeast Brazil.
Freire and Pauly (2010) carried out an analysis of Brazilian marine fisheries catch data covering the
years 1978–2000 aiming at testing for the occurrence of the ‘fishing down the marine food web’
17
This project has received funding from the European Union’s Horizon 2020 research and innovation programme
under grant agreement No 734271Report on tropical Atlantic marine ecosystem dynamics in the last decades
phenomenon in the East Brazil Large Marine Ecosystem. They concluded that the marine biodiversity
of Northeast Brazil is being eroded. Indeed, the decline of the average trophic level of the catches,
occurring through most of Northeastern Brazil was shown to occur at a rate of 0.16 trophic level per
decade, one of the highest rates of trophic level decline documented in the world. The downward
trend in Marine Trophic Index (MTI) was evident when the analysis was performed by States, and
“fishing down the food web” was detected in landings originating from five out of the seven
northeast States for which landing data was collected by the official Brazilian statistics (ESTATPESCA
program) (Figure 2.9).
Figure 2.9. Changes in mean trophic level for landings from Northeastern Brazil in 1978–2000. PI = Piauí, CE =
Ceará, RN= Rio Grande do Norte, PB = Paraíba, PE = Pernambuco, AL = Alagoas, and SE = Sergipe. The States
of Maranhão and Bahia are not shown due to the lack of a proper system of data collection. Large Marine
Ecosystem 16 (East Brazil) is shown in dark gray. Source: Freire and Pauly (2010).
2.4.2. Temporal trends
The last year with fisheries statistics available in Brazil was 2007, more than a decade ago. After that
year on, the existing system for the collection of primary data was gradually dismantled and not
18
This project has received funding from the European Union’s Horizon 2020 research and innovation programme
under grant agreement No 734271Report on tropical Atlantic marine ecosystem dynamics in the last decades
replaced. During 1962-2007 Northeast catches increased from ~40 000 to more than 150 000 tonnes
(Figure 2.10). This trend was not linear since a first maximum (~140 000 t) occurred in the early 1980s
followed by a reduction in the late 1980s-early 1900s. In 2007, the total landings of marine fish from
capture in the northeast region, from Bahia to Maranhão, was 155,625 t, accounting for about 30%
of national landings from marine capture fisheries (540,000 t). Bahia (44,932 t) and Maranhão
(41,840 t) were the largest producers, accounting for more than half (56%) of the landings in the
region. The ten main finfish products were: snappers (Lutjanidae) (5,021 t), tunas and mackerels
(Scombridae) (3,951 t), sardines (Clupeidae) (3,413 t), mullets (Mugilidae) (3,333 t), grunts
(Haemulidae) (1,473 t), flying-fish (1,255 t) (Exocoetidae), jacks (Carangidae) (1,212 t), anchovies
(Engraulidae) (1,131 t), croakers (Sciaenidae) (750 t), and catfish (Ariidae) (616 t). Among the
crustaceans, the main products were the spiny lobsters (4,900 t) and shrimps, including mainly the
seabob (8,607 t) and the white shrimp (3,612 t).
Catch data per municipality are available in Pernambuco state (Figure 2.11). Trends are dissimilar
according to the municipality, but those accounting for the bulk of catches, located mainly in the
northern part of the state (see Figure 2.12 for temporal trends in the number of active boats per
municipality) presented an overall increase from 1988 to 2007. Note that these trends should be
viewed with caution. Indeed, the sharp increase in catches that began in 2005 (Figure 2.11) seems
unrelated to the increase in the number of active boats for this period (Figure 2.12). One of the
explanatory hypotheses seems to be related to the coverage of surveys, mainly those concerning
shellfish collection, which has probably increased over the years. Moreover, it is difficult to estimate
the number of boats exhaustively in the absence of precise documentation and the values (catches
and effort) are probably underestimated but in a lesser extend at the end of the time-series.
Figure 2.10. Annual catch (in tonnes) per State in Northeast Brazil during 1962-2007.
19
This project has received funding from the European Union’s Horizon 2020 research and innovation programme
under grant agreement No 734271Report on tropical Atlantic marine ecosystem dynamics in the last decades
Figure 2.11. Annual catches per Municipality in Pernambuco State from 1988 to 2007. Data source: Ibama
(1995), Ibama-Cepene (2000-2007) and Freire (2003).
Figure 2.12. Number of operating boat (histograms) per year and per Municipality in Pernambuco State from 1988
to 2007 and average proportion of types of boats (pies) per Municipality (NID: manual collect of shellfish). Data
source: Ibama (1995), Ibama-Cepene (2000-2007) and Freire (2003).
20
This project has received funding from the European Union’s Horizon 2020 research and innovation programme
under grant agreement No 734271Report on tropical Atlantic marine ecosystem dynamics in the last decades
Tuna fisheries
The fishery of oceanic pelagic species in Brazil began before the intense process of industrialization
of the national fishing sector at the end of the 1960s. The first prospections for tuna on the Brazilian
coast was carried out in 1956 by FAO and the Japanese oceanographic ship Toko Maru. The
commercial fishing of tuna and like with longline boats on the northeastern coast of Brazil began in
the same year, when Japanese boats were rented. In 1964, the activities of these leased boats, based
in the Port of Recife, were suspended for political and economic reasons. Fishing activities with
foreign boats were resumed at the end of 1976, and in 1983, a fishing company based in Natal (RN),
started fishing with longliners using national technology and labour. From 1996 onwards, from the
lease of an American boat equipped for the fishery of swordfish with monofilament, the tuna fleet of
Rio Grande do Norte experienced a strong growth, reaching more than 30 boats in 2000 (Ferreira and
Hazin, 1997).
During its development, the fishing of tuna and like with longlines from the port of Natal presented 6
distinct phases. In the first phase, between 1983 and mid-1986, the target species were yellowfin
tuna, which accounted for most of the catches and, from that year on, given the commercial value of
sharks, they became the most commonly caught species, particularly the blue shark Prionace glauca,
characterizing the second phase. In the third phase, starting in 1988, the boats began to concentrate
their fishing effort near the São Pedro and São Paulo Archipelago, during the first quarter of the year,
obtaining high rates of capture of yellowfin. From June 1991, the fourth phase began, it was
observed that sharks of the genus Carcharhinus were concentrated on the ocean banks located north
of Rio Grande do Norte and Ceará. These sharks then became the main component of catches. In
mid-1997, the fifth phase began, with a substantial increase of the capture rates of the swordfish and
Thunnus obesus, due to the introduction of the monofilament longline fishing technique. Finally, at
the end of 2001, the sixth phase began, with the introduction of rented vessels operating with
Taiwanese technology, aimed at capturing the Thunnus alalunga and T. obesus (Ferreira and Hazin,
1997). Despite the 10-year lag in data, the present situation of the fisheries sector in Brazilian
northeast region did not change much and, therefore, its overall composition and structure remained
basically the same. The only significant change was the advent of a new fishing method, which
started in 2010 and developed rapidly, reaching in 2016, about 250 boats, landing about 20,000 t of
tunas every year, mainly yellowfin (67%) and bigeye (25%) tunas, with a minor participation of
skipjack (7%). Most of the fish caught (more than 90%) are juvenile. This fishery started targeting the
tunas gathering around the buoys of the PIRATA program ("Prediction and Research moored Array in
the Tropical Atlantic", http://pirata.ccst.inpe.br), located in the equatorial Atlantic. Despite the
purpose of these buoys is to collect oceanographic data, they end up acting as a Fish Aggregating
Device (FAD), promoting the concentration of large schools of small tunas, mainly yellowfin and
bigeye. According to Silva et al. (2018b), soon after this practice began, skippers started to realize
that the boat itself could work as well as a FAD and that they could keep the schools associated to
the boats and, therefore, keep fishing away from the FADs. They also realized they could transfer the
school to other boats, before moving back to port to unload their catches and, therefore, keep a
“captive” school out at sea. This fishery presently has landings (20,000 t) that are four times higher
than the previous top group of species (snappers, with about 5,000 t). However, fishing activity
around the oceanographic buoys is prohibited and need to be better controlled since it causes
serious problems to the integrity of the buoys and their material.
The temporal trends in tuna and swordfish catches landed in Brazil and captured by Brazilian and
foreign fleets between 2000-2017 is presented Figure 2.13 (Travassos, 2019). Skipjack tuna (Figure
21
This project has received funding from the European Union’s Horizon 2020 research and innovation programme
under grant agreement No 734271Report on tropical Atlantic marine ecosystem dynamics in the last decades
2.13a) is mainly captured by baitboat fishing and in a lesser extent by hand-lines. Catches have
remained stable at around 24,000 to 25,000 t per year until 2010. In the period 2011-2013 catches
increased, reaching about 32000 t in 2013, decreasing to values below 20000 t per year in recent
years, as a result of the decrease in vessels operating in this fishery. In the last 5 years of the series, a
proportion of about 15 to 20% of the catches of the species comes from the associated schooling
fishery. There is no fishing quota defined for Brazil by ICCAT for this species. Yellowfin tuna (Figure
2.13b) is mainly captured by longline, baitboat and hand-line. Yellowfin tuna catches ranged from
2500 to 7000 t per year between 2000-2013. Then a significant increase was observed with catches
reaching about 18000 t in 2017. This increase was also due to the catches made by the new
"associated schooling" fishery. There is no fishing quota defined for Brazil by ICCAT for this species.
Bigeye tuna is mainly captured by longline, baitboat and hand-line (Figure 2.13c). Bigeye tuna catches
always remained below 3000 t per year until 2012. From 2013 onwards, catches have grown rapidly,
reaching values close to 7000 t in the last three years. This increase occurred as a consequence of the
development of a new fishery called "associated schooling", which captures fish aggregated to the
hull of the vessel. There is no fishing quota defined for Brazil by ICCAT for this species. The catches of
albacore tuna (Figure 2.13d) showed a significant decrease from 2003, when foreign leased vessels
(Panama) stopped operating in Brazil. Since then, catches have remained well below 1000 t per year,
with the exception of the 2011-2013 period, when again foreign leased vessels (Japan) operated in
the country. The Brazilian quota of the species defined by ICCAT is 2,160 t. Swordfish (Figure 2.13e) is
captured by longline fishing carried out by foreign leased vessels (operated until 2010) and domestic
vessels. The catches reached 4500 t in 2000 and 2006, with a decreasing trend since then until
reaching values close to 3000 t per year in recent years. There are swordfish fishing quotas defined
by ICCAT for Brazil. From 2007-2009, the quota was 4720 t per year for the southern stock and 50 t
per year for the northern stock. For 2010 and 2011 the quota for the southern stock was reduced to
3666 t and 3785 t, respectively, with no change to the northern quota. Since 2012, the quota is 3,940
t for the stock of the South Atlantic and 50 t for the stock of the North Atlantic.
22
This project has received funding from the European Union’s Horizon 2020 research and innovation programme
under grant agreement No 734271Report on tropical Atlantic marine ecosystem dynamics in the last decades
Figure 2.13. Annual catches (in tonnes) of (a) skipjack tuna Katsuwonus pelamis, (b) yellowfin tuna Thunnus
albacares, (c) bigeye tuna Thunnus obesus, (d) albacore tuna Thunnus alalunga, and (e) swordfish Xiphias
gladius by the Brazilian fleet from 2000-2017. Source: Travassos (2019).
2.5. Current State and existing m easures for M arine Spatial Planning
Brazil possesses an EZZ of about 3.5 million km2 and a continental shelf of 912 000 km2, i.e., a vast
ocean area named the “Blue Amazon” by the Brazilian Intergovernmental Council for Marine Affairs
(www.secirm/ingles/promar.html). The recognition of the need to discuss Marine Spatial Planning in
Brazil within governmental levels has raised since the Rio +20 conference. In 2014, the Ministry of
Environment, with the support of UNESCO, promoted the International Seminar on Integrated
Marine Planning in order to broaden the understanding on the subject, as well as to promote
exchanges with international experiences. The event was opened with lectures given by the
Intergovernmental Oceanographic Commission (IOC) and the Interministerial Commission for the
Resources of the Sea (SECIRM) to clarify understanding and concepts of Marine Spatial Planning, and
1
a report was generated . More recently progress have been achieved with a joint action of The Blue
Solutions Initiative and the Brazilian Navy who convened a training on Marine Spatial Planning (MSP).
Representatives of the federal inter-ministerial working group on MSP participated in the course and
1
http://www.mma.gov.br/gestao-territorial/gerenciamento-costeiro/colegiados/item/8956
T1 - Marine Spatial Planning Brazil (Planejamento Espacial Marinho Brasil) 2014 Report
23
This project has received funding from the European Union’s Horizon 2020 research and innovation programme
under grant agreement No 734271Report on tropical Atlantic marine ecosystem dynamics in the last decades
jointly discussed potential pathways for integrated marine and coastal policies in the country.
However, so far advances at the national level have mostly been oriented towards Integrated coastal
zone management (ICZM) and are mainly sectorial (DeFreitas et al., 2014; Gerhardinger et al., 2018 -
who also present a review on ocean governance scenario an opportunity in Brazil).
Since 1997, the Ministry of Environment started a process of identification of “Priority Areas for
Conservation, Sustainable Use and Benefit Sharing of Biodiversity”. The rules for this process were
formally instituted by Decree No. 5092 of May 21, 2004. The first evaluation was published in 2004
2
and subsequently updated in 2007 and 2018 . Recently, a set of initiatives, namely the Impact
Reduction Plans (PRIMS), have been created, according to the Chico Mendes Institute for the
Conservation of Biodiversity (ICMBio) to contribute to analyse the potential impact of the main
threats to biodiversity, in order to propose alternatives for reconciliation between environmental
protection and development of socioeconomic activities. Those plans aim at supporting and securing
the decision-making processes and the environmental management of potential threats using
systematic conservation planning tools to define spatially sensitive areas for biodiversity. From the
industry point of view, this can also work as previous indication of potential conflict in the licensing
process. Ideally PRIMS will be reviewed periodically to incorporate new information. In the marine
3
regions, mining and oil and gas exploration are main considered activities so far .
At the legislative level, a proposal of a Marine Bill (Lei do Mar) was put forward to the
Brazilian National Congress in 2013, however it is still under discussion, a process hindered by lack
political momentum at the national level (Gerhardinger et al., 2018).
MSP is a process that needs to bring together multiple users of the ocean to make informed and
coordinated decisions. At this date, Integrated Marine Spatial Planning has not been implemented in
Brazil, however the basis for such has been growing in terms of available information. As zoning
advances, mainly due to sectorial pressures, the need for an integrated approach becomes more
urgent.
2
http://areasprioritarias.mma.gov.br/2-atualizacao-das-areas-prioritarias.
3
http://www.icmbio.gov.br/portal/images/stories/docs-prim/PRIM_Livreto.pdf.
24
This project has received funding from the European Union’s Horizon 2020 research and innovation programme
under grant agreement No 734271You can also read