WORKING GROUP ON INTEGRATED ECOSYSTEM ASSESSMENT OF THE GREENLAND SEA (WGIEAGS) - ICES
←
→
Page content transcription
If your browser does not render page correctly, please read the page content below
WORKING GROUP ON INTEGRATED
ECOSYSTEM ASSESSMENT OF THE
GREENLAND SEA (WGIEAGS)

VOLUME 2 | ISSUE 75
ICES SCIENTIFIC REPORTS

RAPPORTS
SCIENTIFIQUES DU CIEM

                          IC E S   INTERNATIONAL COUNCIL FOR THE EXPLORATION OF THE SEA
                          CIEM     CONSEIL INTERNATIONAL POUR L’EXPLORATION DE LA MER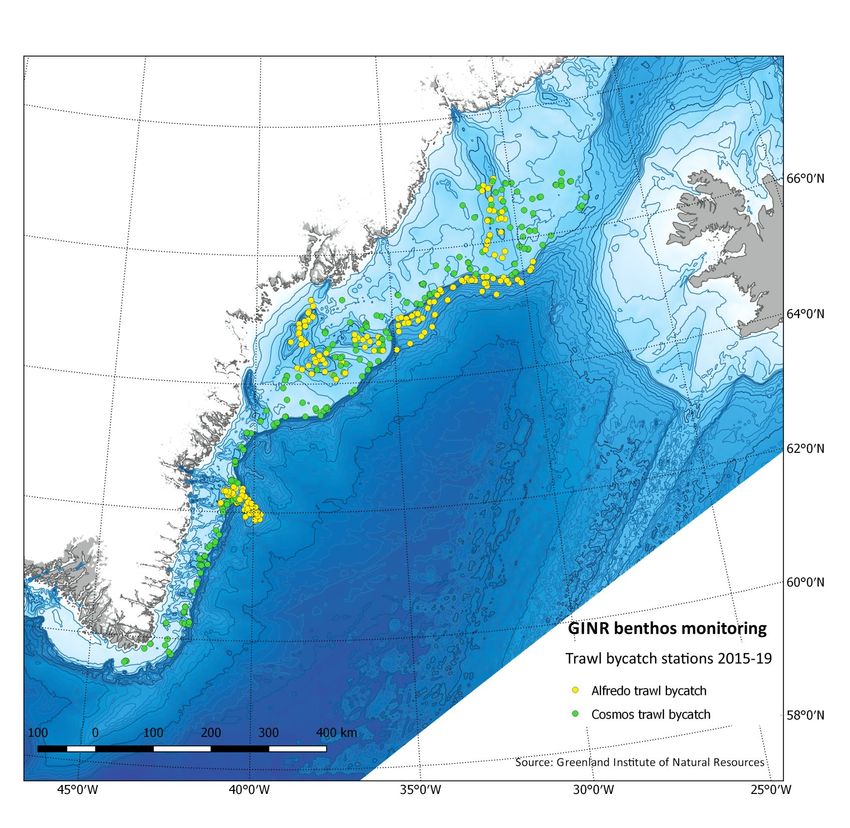
International Council for the Exploration of the Sea
Conseil International pour l’Exploration de la Mer
H.C. Andersens Boulevard 44-46
DK-1553 Copenhagen V
Denmark
Telephone (+45) 33 38 67 00
Telefax (+45) 33 93 42 15
www.ices.dk
info@ices.dk

The material in this report may be reused for non-commercial purposes using the recommended cita-
tion. ICES may only grant usage rights of information, data, images, graphs, etc. of which it has owner-
ship. For other third-party material cited in this report, you must contact the original copyright holder
for permission. For citation of datasets or use of data to be included in other databases, please refer to
the latest ICES data policy on ICES website. All extracts must be acknowledged. For other reproduction
requests please contact the General Secretary.

This document is the product of an expert group under the auspices of the International Council for the
Exploration of the Sea and does not necessarily represent the view of the Council.

ISSN number: 2618-1371 I © 2020 International Council for the Exploration of the Sea
ICES Scientific Reports

Volume 2 | Issue 75

WORKING GROUP ON INTEGRATED ECOSYSTEM ASSESSMENT OF THE
GREENLAND SEA (WGIEAGS)

Recommended format for purpose of citation:
ICES. 2020. Working Group on Integrated Ecosystem Assessment of the Greenland Sea (WGIEAGS).
ICES Scientific Reports. 2:75. 72 pp. http://doi.org/10.17895/ices.pub.7450

Editors
Jesper Boje ● Colin Stedmon

Authors

Aqqalu Asvid-Rosing ● Martin Blicher ● Jesper Boje ● Helle Torp Christensen ● Jørgen Schou
Christiansen ● Margrete Emblemsvåg ● Anne Kirstine Frie ● Steingrimur Jónsson ● Eva Friis Møller
Anders Mosbech ● Peter Munk ● Adriana Nogueira ● Thomas Juul Pedersen ● Søren Post ● Mikael Sejr
Colin Stedmon ● Mie S Winding
ICES   |   WGIEAGS 2020                                                                                                                                               |   i

           Contents
           i      Executive summary ....................................................................................................................... ii
           ii     Expert group information ..............................................................................................................iii
           1      ToRs and progression .................................................................................................................... 1
                  1.1      Terms of Reference (ToR) ................................................................................................ 1
                  1.2      ToR progress .................................................................................................................... 1
           2      Ecosystem Description .................................................................................................................. 3
                  2.1      Geographical boundaries ................................................................................................. 3
                  2.2      Oceanographic conditions ............................................................................................... 4
                  2.3      Oceanographic Trends ..................................................................................................... 6
                  2.4      Phytoplankton.................................................................................................................. 7
                  2.5      Zooplankton ................................................................................................................... 10
                  2.6      Benthic Environment ..................................................................................................... 11
                  2.7      Area based studies – TUNU project in Northeast Greenland ........................................ 14
                  2.7.1 Data contribution ........................................................................................................... 16
           3      Fishes in East Greenland.............................................................................................................. 17
                  3.1      History and development of fishery in East Greenland ................................................. 17
                  3.1.1 Northern shrimp (Pandalus borealis) ............................................................................. 18
                  3.1.2 Capelin ........................................................................................................................... 21
                  3.1.3 Mackerel ........................................................................................................................ 22
                  3.1.4 Herring ........................................................................................................................... 23
                  .1.5     Pelagic redfish, Deep Pelagic beaked redfish ................................................................ 24
                  3.1.6 Blue whiting ................................................................................................................... 26
                  3.1.7 Cod ................................................................................................................................. 27
                  3.1.8 Beaked redfish (Sebastes mentella)............................................................................... 28
                  3.1.9 Golden redfish (Sebastes norvegicus) ............................................................................ 29
                  3.1.10 Greenland halibut (Reinhardtius hippoglossoides) ........................................................ 31
                  3.1.11 Roughhead grenadier (Macrourus berglax) ................................................................... 32
                  3.1.12 Roundnose grenadier (Coryphaenoides rupestris) ........................................................ 34
                  3.1.13 Tusk (Brosme brosme).................................................................................................... 34
           4      Marine mammals ........................................................................................................................ 36
                  4.1      Diversity and basic characteristics of the marine mammal community ........................ 36
                  4.2      Current exploitation and management ......................................................................... 37
                  4.3      Ecology ........................................................................................................................... 38
                  4.4      Effects of hunting ........................................................................................................... 41
                  4.5      Effects of physical and biological environmental changes ............................................ 45
                  4.6      Effects of contaminants ................................................................................................. 47
                  4.7      Anthropogenic noise ...................................................................................................... 47
           5       Marine birds ................................................................................................................................ 51
                  5.1      Breeding seabirds .......................................................................................................... 51
                  5.2      Non-breeding coastal seabirds ...................................................................................... 51
                  5.3      Seabirds-at-sea .............................................................................................................. 52
           6      References ................................................................................................................................... 54
           Annex 1:        List of participants and observers .................................................................................. 72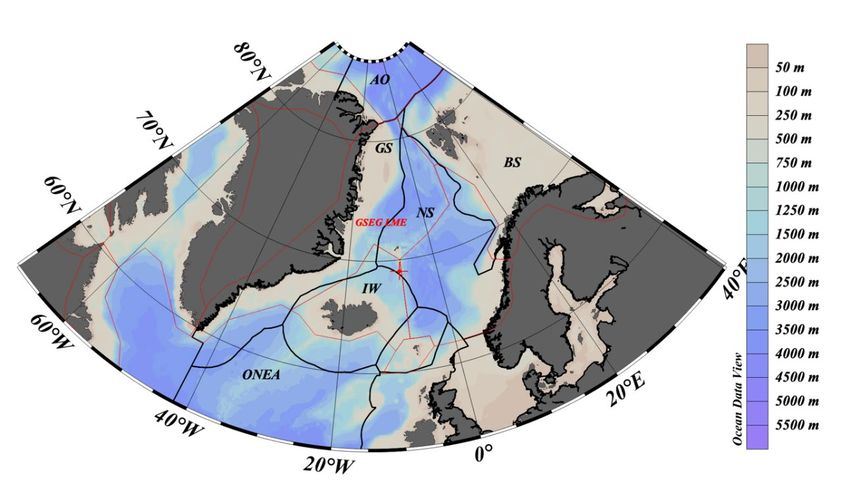
ii   |   ICES SCIENTIFIC REPORTS 2:75                                                                          |   ICES

     i Executive summary

         WGIEAGS works to provide an Ecosystem Overview and identify trends, knowledge gaps and
         research priorities for the region. The Greenland Sea ICES ecoregion encompasses both open sea
         and shelf waters along the Eastern coast of Greenland from Cape Farewell in the south to the
         northern boundary of Kong Frederiks VIII’s Land in the Fram Strait. The region is experiencing
         change in the form of northward extension of Atlantic waters and freshening of surface waters.
         Several oceanic fisheries on widely distributed fish species take place in the region. WGIEAGS
         is focused on assessing the linkages between the physical, chemical and biological oceanographic
         conditions to the distribution and productivity of fish stocks in the region. The aim for the first
         meeting was to assemble the available data, report on status and trends, provide the basis for the
         Ecosystem Overview for the region and identify research and monitoring needs for a future in-
         tegrated ecosystem assessment.
         Information on phytoplankton was mostly achieved from research cruises for inshore and coastal
         areas and remote sensing for offshore areas, which allowed a rather broad description. Data on
         zooplankton is also mainly available from sporadic research cruises. In the northern part of the
         ecoregion, most focus has been on the open Greenland Sea, and the coastal region of Young
         Sound. In the southern part, Icelandic fishery and zooplankton surveys extend into the ecore-
         gion. Recently the Greenland Institute of Natural Resources (GNIR) has also collected zooplank-
         ton data during their fishery surveys. Historical records of benthos from Greenland waters down
         to 1000 m depth exists from investigations in late 1900s and early 2000s, however vast areas re-
         main unstudied. In 2015, a program for long-term and large-scale monitoring of marine bottom-
         living invertebrate fauna were launched in the southern part of the region, which together with
         seabed mapping allows an initial detection of potential Vulnerable Marine Ecosystems. Limited
         information from fisheries operating with active bottom gears are also available. Knowledge on
         fisheries and commercially exploited fish species is generally good based on annual scientific
         surveys and logbooks from the fishery from the past 3-4 decades. Fisheries and surveys on de-
         mersal fish species are mainly in the southern part of the ecoregion while pelagic species are
         surveyed and fished more northerly. Information received on marine mammals is presently lim-
         ited to seals in the southern part of the ecoregion from various investigations. Data on birds are
         scarce and derived from various expeditions dating back to the 1990s. Most effort has been car-
         ried out in the Northern part of the ecoregion, while little or no data are available from the off-
         shore part of the southern ecoregion.
         While data availability in the Greenland Sea is patchy and differ widely across trophic levels, the
         efforts of WGIEAGS to bring together this information will better elucidate ecological patterns
         and changes in this ecoregion and help identify gaps in knowledge that can be resolved.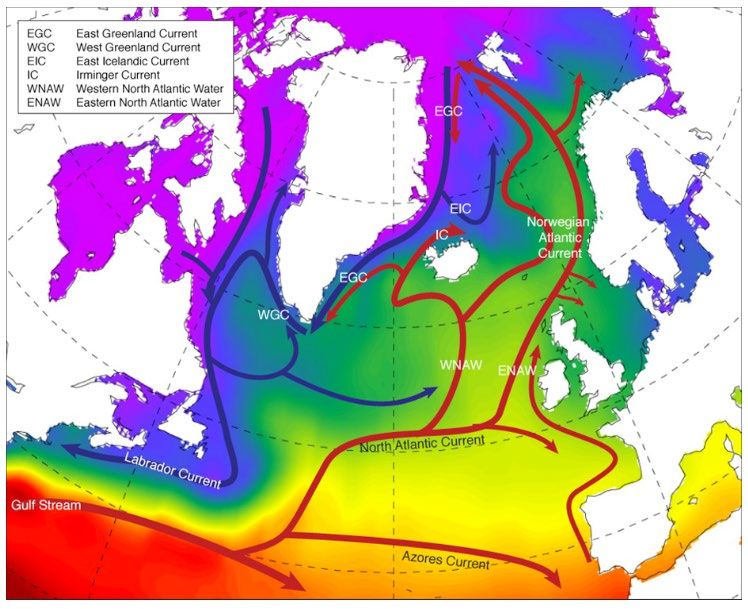
ICES   |   WGIEAGS 2020                                                                                         |   iii

       ii Expert group information

           Expert group name            Working Group on Integrated Ecosystem Assessment of the Greenland Sea
                                        (WGIEAGS)

           Expert group cycle           Multiannual fixed term

           Year cycle started           2020

           Reporting year in cycle      1/3

           Chair(s)                     Jesper Boje, Denmark

                                        Colin Stedmon, Denmark

           Meeting venue(s) and dates   11-13 February 2020, ICES HQ, Copenhagen, Denmark (22 participants)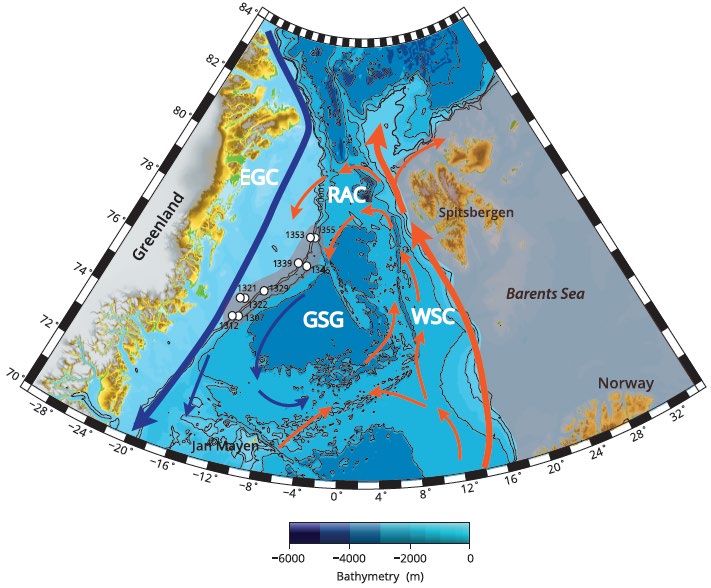
ICES   |   WGIEAGS 2020                                                                                                                         |   1

       1 ToRs and progression

           1.1              Terms of Reference (ToR)

                                                                                 L INKS TO THE SEVEN
                                                                                     ICES SCIENCE
                                                                                 PRIORITY AREAS AS
                             D ESCRIPTION                 B ACKGROUND               PROPOSED BY                       E XPECTED D ELIVERABLES
               TOR                                                                    SCICOM              D URATION

           A         Assemble relevent data for   The database will contain             1.1            Years 1-3      Merged database.
                     describing spatial and       physical, chemical and                                              Metadata to be
                     temporal changes in the      biological (incl. higher                                            reported to ICES.
                     Greenland Sea                trophic levels)
                                                  oceanographic data.

           B         Review and consider          Before starting data                  1.1            Years 1-3      Report to ICES
                     methodological               analysis, basic discussions
                     approaches and analytical    on suitable
                     tools for conducting         methodological/analytical
                     integrated ecosystem         approaches are required.
                     assessment for the           This can be started after
                     Greenland Sea                initial datasets are
                                                  assembled.

           C         Report on the status and     This ToR will be based on             1.1            Years 2-3      Report to ICES.
                     trends of the Greenland      activities and                                                      Manuscript to be
                     Sea, based on integrated     advancements of the                                                 submitted to peer-
                     analysis of multivariate     above. It is a hope to                                              reviewed science
                     datasets, incl. associated   produse scientific                                                  journal
                     with major hydroclimatic     manuscript.
                     changes and human
                     activities

           D         Prepare an Ecosystem         This is advisory                      1.3            Year 1         Ecosystem Overview
                     Overview for the             requirement.                                                        submitted to ICES
                     Greenland Sea

           E         Identify knowledge gaps      To further advance the IEA       1.1, 3.1, 3.2       Year 3         Report to ICES
                     and priority research        for the region, identifica-
                     needs to improve future      tion of knowledge and
                     integrated ecosystem         data gaps is inevitable, to-
                     assessments. Provide         gether with considering
                     recommendations for          improvements in data col-
                     improvement of data          lection.
                     collection and monitoring
                     in the ecoregion

           1.2              ToR progress

           a)         Database: Group members that were able to attend the first meeting have started the
                      process of gathering and sharing data. This includes obtaining that available in public
                      databases, drawing on data from individual research projects and programmes, and data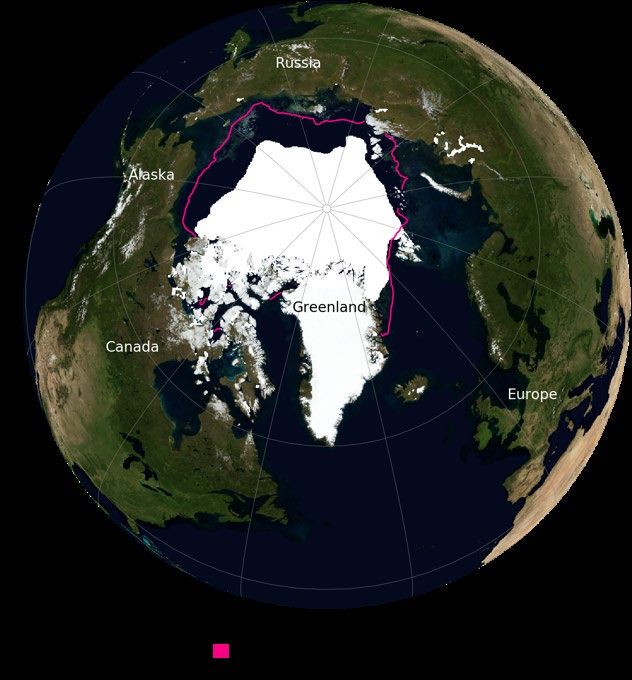
2   |   ICES SCIENTIFIC REPORTS 2:75                                                                           |   ICES

               from fish landings. Work is ongoing and this task will extend across the three years of
               the WG.

        b)     Review of path towards an integrated ecosystem assessment. During the first WG mee-
               ting initial steps were taken to map the activities and pressures that were most relevant
               for the region. This will contribute to the first Ecosystem Overview but also to an iterative
               process of developing an approach for an integrated ecosystem assessment. Work is on-
               going and this task will extend across the three years of the WG.

        c)     Manuscript on status and trends in the region: This task is to be initiated in 2021, once
               the dataset is assembled, and delivered in 2022.

        d)     Prepare an Ecosystem Overview: The EO is in preparation and the first draft will be de-
               livered to ICES before summer. It should be noted that the group expect to update this
               over the coming years as it is clear that compared to other ICES regions, there is a consi-
               derably poorer data coverage.

        e)     Identify knowledge gaps and research needs: To be completed in 2022.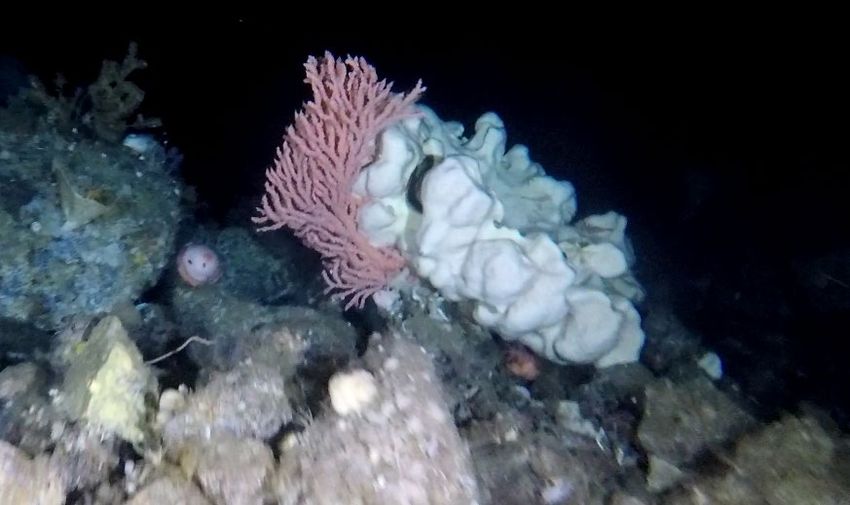
ICES   |   WGIEAGS 2020                                                                                                            |   3

       2 Ecosystem Description

           2.1           Geographical boundaries
           The Greenland Sea ICES Ecoregion essentially follows the Greenland Exclusive Economic Zone
           (EEZ) for East Greenland spanning from 56.39N (east of ~42W) in the south to 81.5 N in the North
           (Figure 1). The ecosystem area stretches over 2000 km from north to south, from the Arctic Ocean
           to the sub-polar gyre. Much of the region comprises of continental shelf waters. The neighbour-
           ing ocean basins, partly included in the region, are the Irminger Sea, Iceland Sea and Greenland
           Sea.
           The region borders six other ICES Ecoregions: Oceanic North East Atlantic, Iceland Sea, Norwe-
           gian Sea, Barents Sea and Arctic Ocean. The focus of the WG is placed on coastal and shelf sea
           waters (extending seaward of coastal state baseline) and therefore for now excludes fjord and
           archipelago waters along the Greenland coastline.

           Figure 1 Map of northern ICES Ecoregions outlined in black. AO: Arctic Ocean; GS: Greenland Sea; BS: Barents Sea; NS:
           Norwegian Sea; IW: Icelandic Waters; ONEA: Oceanic North East Atlantic. The Greenland Sea and East Greenland Large
           Marine Ecosystem defined by PAME is shown in red.

           The Greenland Sea Ecoregion (GSE) overlaps with Region 1, the Arctic Waters, of OSPAR (Oslo-
           Paris commission for protecting the North East Atlantic). This Region 1 also extends over ICES
           ecoregions Iceland Sea, Norwegian Sea, Faroes, Barents Sea and Arctic Ocean. The GSE further
           includes some of the Northeast Atlantic Fisheries Commission (NEAFC) areas in waters south
           of Iceland and in the Norwegian Sea area of the Ecoregion.
           The GSE covers the Greenland EEZ, and within this area the coastal nation has control of all
           economic resources, including fishing, mining, oil exploration. The fisheries in the ecoregion are
           managed by Greenland, with some pelagic fisheries managed by the North East Atlantic Fisher-
           ies Commission (NEAFC). Fisheries advice is provided by the International Council for the Ex-
           ploration of the Sea (ICES). Environmental issues are managed by Greenland authorities and
           through OSPAR, based on advice provided by OSPAR, and ICES. Hunting on marine mammals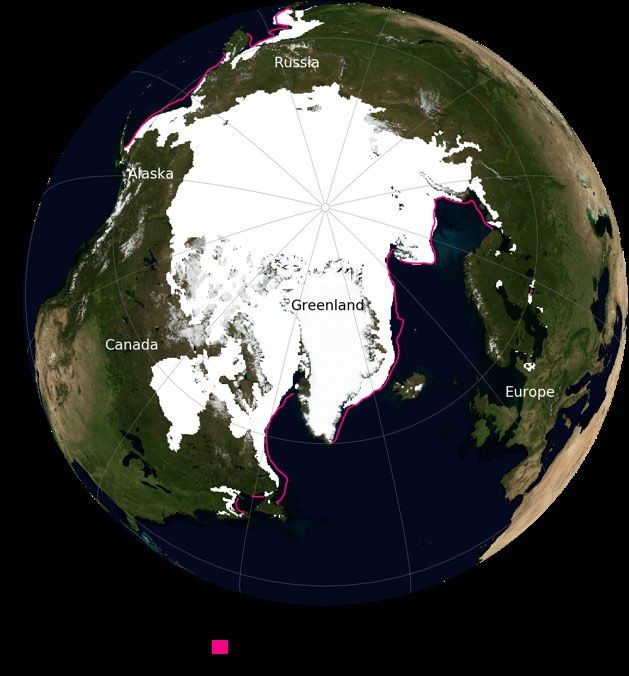
4   |   ICES SCIENTIFIC REPORTS 2:75                                                                                               |   ICES

        are managed by Greenland and international commissions. The International Whaling Commis-
        sion (IWC) has regulations for the conservation and harvest of whales in the area. Issues related
        to marine mammals are also considered in cooperation under the North Atlantic Marine Mam-
        mal Commission (NAMMCO). Further, international shipping is managed under the Interna-
        tional Maritime Organization (IMO).

        2.2            Oceanographic conditions
        In two areas the shelf extends across the whole ecoregion: Denmark Strait (67°N) and Fram Strait
        79°N) (Figure 1). Typical cross sections of the bathymetry in the region are shown in Figure 2.
        The width of the shelf decreases when proceeding southwards, and the southern areas includes
        to a larger extent the oceanic waters above depths greater than 2000m contrary to the shelf re-
        gions which typically are of depths
ICES | WGIEAGS 2020 | 5
Figure 3 General pattern of surface ocean circulation in the region (0-1000m). Blue arrows represent cold currents from
Polar region and red arrows warm currents from the subtropical gyre (Gonzalez-Pola, el al. 2019).
In the South there is no sign of the MAW and the polar waters are suppressed to a narrow coastal
region on the shelf. Here warmer and more saline Atlantic waters originating from the sub-
tropical gyre and transported by the Irminger Current are more prevalent (Figure 2 and Figure
3). This water flows along Iceland’s west coast and great part of this subsequently flows towards
Greenland where it meets the PW of the EGC where after these flow side by side southwards
along the shelf and slope.
A large extent of the ecoregion experiences seasonal sea ice coverage (Figure 4). In late summer
the ice retreats and then only covers the NW area of the Fram Strait. The East Greenland Current
transports a large amount of Arctic Ocean pack ice during the summer months. These waters
also receive ice from glacial calving at the coast of Greenland.6 | ICES SCIENTIFIC REPORTS 2:75 | ICES
Figure 4. Sea ice extent during the last minimum (September 2019) and in January 2020, towards the sea ice maximum
expected in March. The pink line shows the median ice edge for the given month based on data from 1981-2010. Source:
http://nsidc.org/data/seaice_index Credit: Sea Ice Index, National Snow and Ice Data Center.
2.3 Oceanographic Trends
This ecoregion is among the least studied of the ICES ecoregions and there is a lack of regular
observations, making long-term trends difficult to identify.
The sea ice cover and thickness in the Arctic have been diminishing over several decades and
especially during summer this is reflected in the sea ice cover along East Greenland. This leads
to larger areas of open water during longer time periods (Figure 5)
The amount of freshwater in the central Arctic Ocean has been increasing over the last two dec-
ades due to a strong Polar high pressure (Rabe el al. 2011). A weakening of the high pressure
system upstream of this region might lead to more outflow of freshwater through Fram Strait
causing serious changes to the ecosystem as happened during the late sixties and early seventies
(Dickson el al. 1988; Curry 2005).
Furthermore, increased melting of the Greenland Ice Sheet over the last two decades (Khan el al.
2014) will increase the amount of freshwater flowing to the ecosystem, however, this is probably
still a minor source (12 mSv) compared to water and ice inflow from the Arctic Ocean (Dodd el
al. 2009).
The Atlantic water (AW) flowing poleward in the northern North Atlantic has over the last two
decades been warmer and more saline than during the period since the late sixties. This has been
observed in the Irminger Sea and is apparently accompanied by ecosystem changes (Valtýsson
and Jonsson 2018). This shift in the properties of the AW have been related to the AMO (Atlantic
Multidecadal Oscillation). Some of the increase in temperature is probably also related to climate
change, but it is difficult to separate the two effects.ICES | WGIEAGS 2020 | 7
Figure 5. Monthly average sea ice extent for Greenland region (Meier el al. 2007) which corresponds to an area covering
the Greenland Sea, Iceland Water, and western part of the Norwegian Sea ICES ecoregions.
Recent summary of physical oceanographic conditions in the North Atlantic has identified nota-
ble changes in surface water temperatures in the ecoregion (Gonzalez-Pola, el al. 2019). Surface
waters on the narrow southeast Greenland shelf and in the region North of Denmark Strait for
much of the year are 1-2 ◦C warmer than the mean conditions for 1981-2010. In contrast surface
waters in North Atlantic and the southeastern reaches of the region have cooled by up to 2 ◦C in
spring, summer and fall. There are also changes occurring in surface salinity with open waters
of the Greenland Sea showing evidence of increasing in salinity and the East Greenland shelf
waters and Irminger Sea surface waters evidence of freshening (Gonzalez-Pola, el al. 2019).
2.4 Phytoplankton
The southward transport of Arctic waters and sea ice greatly impacts the overall physical envi-
ronment (e.g. temperature, salinity, stratification and incoming light) and the nutrient supply,
and thereby also affects the primary production and phytoplankton species composition along
the shelf region of the Greenland Sea. There are no sustained observation programs for phyto-
plankton in offshore East Greenland shelf regions. Existing data and knowledge on phytoplank-
ton from the region are therefore based on research cruises and remote sensing products. The
latter provide surface chlorophyll and modelled primary production. A fjord/near-coast moni-
toring programme at Zackenberg in Northeast Greenland, which is part of the “Greenland Eco-
system Monitoring” (GEM; www.g-e-m.dk), represents the only marine monitoring programme
covering phytoplankton in East Greenland (Rysgaard and Glud 2007; Krawczyk el al. 2015; Hold-
ing el al. 2019).
In offshore waters with bottom depths greater than the photic zone (ca. >40 m), i.e. beyond the
depth range of macroalgae and benthic diatoms, phytoplankton constitute the only primary8 | ICES SCIENTIFIC REPORTS 2:75 | ICES
producers and the sole source of marine carbon for the higher trophic levels, such as zooplank-
ton, fish, seabirds and marine mammals. The East Greenland shelf region covers high-Arctic to
sub-Arctic conditions and pose a southward transport pathway for drifting planktonic organ-
isms. Between the Fram and Denmark straits, diatoms typically dominate the phytoplankton
community in May when the seasonal light is increasing, and sufficient nutrients are available
in the water column (Richardson el al. 2005). Afterwards, smaller flagellated phytoplankton take
over and dominate the species composition throughout summer in open water areas. While the
incoming light remains the limiting factor for phytoplankton productivity during the autumn
and winter months, nutrient supply to the photic zone controls productivity during summer
(Richardson el al. 2005; Michel el al. 2015).
The cold, fresher outflow of Arctic Water through the Fram Strait is generally low in nitrogen,
which poses a limit for the magnitude of primary production (Codispoti el al. 2013). A different
scenario of primary production has been observed along ice edges in summer, where abrupt
increase in incoming light, due to ice breakup or retreat, combined with available nutrients re-
sults in diatom blooms (Richardson el al. 2005; Michel el al. 2015; Qu el al. 2016; Mayot el al. 2018,
2020). Low nutrient availability in surface waters during summer forces phytoplankton biomass
deeper down the water column, creating deep chlorophyll maxima, which remains photosyn-
thetically active (Møller el al. 2019). These important deep chlorophyll maxima remain largely
undetectable by remote sensing, thus when using this methodology there is a risk of underesti-
mating phytoplankton biomass and productivity. Nonetheless, remote sensing products repre-
sent the best available proxy of spatio-temporal patterns and interannual variability in phyto-
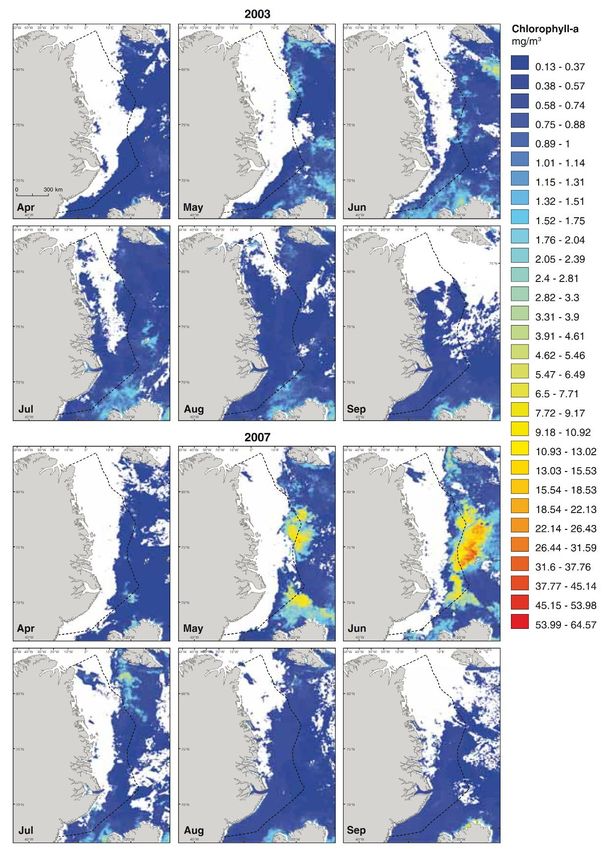
plankton dynamics (Figure 6).ICES | WGIEAGS 2020 | 9
Figure 6 Estimated monthly mean surface chlorophyll concentration in the April-September 2003 (upper two rows) and
April-September 2007 (lower two rows) in the western Greenland Sea. The maps are based on level 3 data from the
MODIS Aqua satellite sensor and downloaded from OceanColorWeb (https://oceancolor.gsfc.nasa.gov). The spatial res-
olution used was 4 km, 16-bit satellite readings were converted to chlorophyll concentrations using the equation: Chl
(mg/m3) = exp10 ((0.000058137756*scale-dreading)-2). White areas represent lacking data, due to e.g. sea ice, lack of
light or high cloud concentration (Boertmann el al. 2009)
During summer, the near-coast waters of the Greenland Sea, originating from the cold East
Greenland Current, are dominated by diatoms (Krawczyk el al. 2015). In contrast, the warmer
and more saline offshore waters of the Greenland Sea are characterized by both diatoms and10 | ICES SCIENTIFIC REPORTS 2:75 | ICES
silicoflagellates during summer, particularly the subsurface Modified Atlantic Water can be
dominated by silicoflagellates suggesting a link between silicoflagellates and waters of Atlantic
origin (Krawczyk el al. 2015). The same study found diatoms silicoflagellates and dinoflagellates
in the waters of the mid Denmark Strait, further south.
A recent biological oceanographic survey during late summer indicated distinct frontal zones
representing biological hot spots, transcending from phytoplankton through zooplankton up to
sea birds (Møller el al. 2019). Higher nutrient replenishment, induced by frontal mixing of the
water column, result in elevated phytoplankton biomass and productivity, which in turn sup-
ports the highest concentrations of zooplankton and sea birds across the shelf.
2.5 Zooplankton
The area consists of zones with different physical regimes, and correspondingly the length of
productive season and the intensity of plankton production shows high variability. As for phy-
toplankton, data on zooplankton is mainly available from sporadic research cruises. In the north-
ern part of the ecoregion, most focus has been on the open Greenland Sea (Hirche 1991; Richter
1995; Møller el al. 2006), the North East polynya (e.g. (Hirche el al. 1994; Ashjian el al. 1995) and
the coastal region of Young Sound (Rysgaard el al. 1999; Middelbo el al. 2018b). In the southern
part, Icelandic fishery- and zooplankton- surveys extend into the ecoregion (Gislason and Silva
2012), and recently the Greenland Institute of Natural Resources (GNIR) collected zooplankton
data during their fishery surveys. Apart from a monitoring of mesozooplankton in the fjord sys-
tem at Young Sound, carried out since 2003, there are no time-series of data for zooplankton and
micronekton in the area. Measurements from Young Sound showed changes in both sea ice cov-
erage and freshwater content during 2003 to 2015, but no major trends were apparent for cope-
pod species composition, suggesting a relative resilient pelagic community (Middelbo el al.
2018a). However, the zooplankton community composition is clearly influenced by the origin
of the water masses; waters of Atlantic origin dominated by Atlantic copepod species, while
those of polar origin are dominated by polar copepod species (Hirche el al. 1994; Møller el al.
2019). The same pattern is found further south, although the Atlantic contribution is usually
stronger here (Gislason and Silva 2012; Espinasse el al. 2017).
Copepods dominate the mesozooplankton biomass both in the northern and southern
part of the ecoregion and one of the most important zooplankton groups, both in numbers and
biomass, is the genus Calanus. Their biomasses are generally highest along the shelf break area
(Møller el al. 2019). Other abundant copepods species are Pseudocalanus spp., Microcalanus spp.,
Oithona similis, Oncaea borealis and Metridia longa. Other abundant zooplankton groups are Lar-
vaceans (Oikopleura spp, Fritillaria borealia), Chaetognatha (Eukhronia hamata, Sagitta spp.) and
meroplankton larvae. The macrozooplankton is dominated by krill (Meganyctiphanes norvegica,
Thysanoëssa inermis, Thysanoëssa longicaudata), amphipods (Themisto libellula, Themisto abyssorum)
and Chaetognatha.
The dominating genus Calanus show a large shift in the vertical distribution between summer
and winter. All the three Calanus species present in the area spend spring and early summer
grazing in the surface waters to build up their lipid stores, which are later used to fuel winter
hibernation (Lee el al. 2006; Falk-Petersen el al. 2009). However, species have different phenology
and consequently they reach their maximum abundance in the surface/bottom waters at different
times of the year. This means that differences in the Calanus community composition between
areas, or changes in this due to shifting ocean currents and/or climate, potentially will impact the
dynamics of higher trophic levels. This impact will be linked to the availability of Calanus as preyICES | WGIEAGS 2020 | 11
in certain depths of the water column (Laidre el al. 2007; Varpe and Fiksen 2010; Møller el al.
2018).
2.6 Benthic Environment
A large number of benthic studies were conducted in Greenland waters, including East Green-
land, by Danish research expeditions in the late 19th century and the first half of the 20th century.
The Natural History Museum of Denmark (NHM) has compiled the large amounts of historical
records of benthos from Greenland waters down to 1000 m depth. This work was done to provide
a regional baseline, but it seems never to have reached a larger audience. Recently, a CAFF’s
State of the Marine Biodiversity Report (Jørgensen el al. 2017) summarize that the complete dataset
cover more than 2100 species of benthic invertebrates, with arthropods, molluscs and poly-
chaetes representing 55% of the species. However, the state of knowledge is strongly limited by
sampling effort. There is a significant correlation between the number of sampling stations in
each of 18 sub-regions and the number of species registered in these sub-regions (Figure 7). This
is also the case if we only consider East Greenland, where vast areas remain unstudied. Still, this
extensive data compilation is a valuable baseline for contemporary and future benthic studies in
Greenland.
Figure 7. Left: Map of Greenland illustrating the 18 regions defined by the Natural History Museum. Right: Number of
species registered in each of the 18 subregions (label numbers) plotted against the number of stations. Modified from
Tendal & Schiøtte (2003).
Seabed mapping on the Greenland shelf has documented a complex topography in a mix of
seven different substrate categories covering the entire spectrum from soft clay and mud, to
sand, gravel and solid rock (Gougeon el al. 2017). However, the benthos sampling approached
employed has not reflected the diversity of the physical habitat. Until recently, the majority of
benthos information available from Greenland consisted of macroinfauna collected with scien-
tific grabs, typically sampling 0.1 m2 of soft seabed. Consequently, there has until recently been
very little knowledge about benthos communities with an affinity to hard and mixed seabed
substrates, and about large benthic organisms (megafauna) typically occurring in relatively low
densities. These components contribute to a complex habitat structure and may ultimately sup-
port ecosystem services by creating micro-habitats and nursery grounds for a diverse range of
associated fauna, including fish and shellfish.
In 2015, GINR launched a program for long-term and large-scale monitoring of marine bottom-
living invertebrate fauna, a program that covers the shelf area of the southern component of the
ecoregion (Figure 8). This was done by integrating a “trawl bycatch-program” on national fish-
eries assessment surveys in Greenland waters, which enabled collection of information about12 | ICES SCIENTIFIC REPORTS 2:75 | ICES
focal components of the benthic community on the continental shelf and slope at depths from c.
50 to 1500 meters. Fisheries surveys are conducted annually in East Greenland from 59°30’N up
to 67°N (Blicher and Arboe 2017; Jørgensen el al. 2017). The bycatch of benthic invertebrates in
assessment trawl hauls are analysed and identified to highest possible taxonomic resolution (Fig-
ure 9).
Figure 8. Overview of GINR’s assessment trawl stations (n = 423) where the bycatch of benthic invertebrates has been
identified by specialist taxonomists.
To this date, more than 450 benthos species/taxa have been registered as trawl bycatch in East
Greenland waters by an international team of benthos taxonomists involved in the program. De-
spite the low catch-efficiency of the used commercial-type demersal trawls and the programs
geographical restriction to the fisheries survey areas, the method has proven effective for quali-
tative and semi-quantitative documentation of large-scale distributions of benthic megafauna
(Jørgensen el al. 2014; Blicher and Arboe 2017). The program enables an initial detection of po-
tential Vulnerable Marine Ecosystems (VME, www.FAO.org), valuable ecosystem components
or areas subject to dramatic changes (e.g. biodiversity hot spots, coral or sponge gardens, nursery
grounds). As a management action, a detection of potential focus areas based on the standard
observations can be followed up by more targeted benthos research (e.g. photo/video, beam
trawl, grab, acoustics). Due to limited ship-time, such additional sampling has to date only been
carried out off West Greenland.
The available trawl bycatch data from East Greenland point to a species rich and structurally
complex benthos community with high biomasses of large sessile species, including VME indi-
cator taxa, such as corals and sponges. The highest concentrations of Geodia spp. sponges regis-
tered in Greenland waters, are found on the continental shelf between 64 and 67°N in East Green-
land (Klitgaard & Tendal 2004, Blicher & Arboe 2017). Accidental high catches in commercial
trawl hauls is a well-known phenomenon among fishermen known as “Ostur” when (Figure 9).ICES | WGIEAGS 2020 | 13
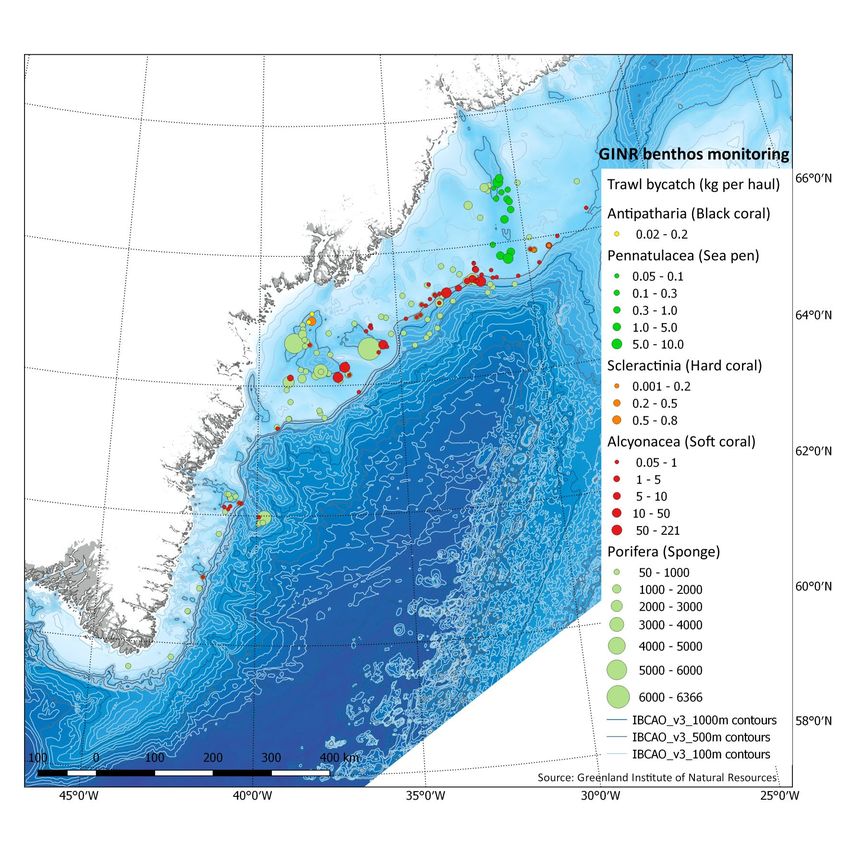
Soft corals and Gorgonian corals (Alcyonacea) are also observed frequently in this area, particu-
larly along the shelf edge. A dense concentration of another group of VME indicators, Sea Pen
(Pennatulacea), have been observed in the shelf area between 65 and 67°N (Figure 10). The ma-
jority of large catches of VME indicators are from outside the main footprint of bottom trawling
(logbook data not shown). Thus, if the spatial coverage of the fishery changes, without consider-
ing any spatial management of the seabed, conflicts with VME habitats are likely. More targeted
research will be needed to accurately describe these bottom habitats, including their spatial dis-
tribution and ecological role.
Figure 9 Left: Large bycatch of sponges (“Ostur”) in a demersal trawl. Mid: a trawl catch primarily consisting of sponges
and redfish emptied on the trawl deck. Right: In situ image of large sponge, Geodia sp. and Gorgonian coral, Paragorgia
arborea on the Greenland shelf (Photos: Martin Blicher and Nanette Hammeken Arboe).14 | ICES SCIENTIFIC REPORTS 2:75 | ICES
Figure 10. Overview of large observations of corals and sponges collected as trawl bycatch on fisheries assessment sur-
veys conducted by GINR in East Greenland. Species-level information is stored in GINR’s benthos database. Modified
from (Blicher & Hammeken Arboe 2017).
2.7 Area based studies – TUNU project in Northeast Green-
land
The international “TUNU-Programme: Euro-Arctic Ocean Fishes – diversity and conservation”
at UiT–The Arctic University of Norway, conducts regular marine biological expeditions to the
barely studied fjords and adjacent shelf in Northeast Greenland (latitudes 70–80 °N) (Christian-
sen 2012) (Table 1, Figure 11). In this high Arctic region, which comprises the Northeast Green-
land National Park, the programme build time series (2002–) and biodiversity baselines for fishes
across biological scales from genes to communities – all initiatives within the framework of ocean
climate. The TUNU-VI and TUNU-VII expeditions conducted systematic investigations on in-
vertebrate benthos and plankton in addition to fishes. Since the TUNU-III Expedition in 2007,
marine geology studies complement the biological studies of seafloor habitats. The TUNU-VIII
Expedition scheduled for August 2020 is postponed to 2021 due to COIVD-19.ICES | WGIEAGS 2020 | 15
Table 1 TUNU expeditions. Preliminary overview of locations for biology (BIO) and oceanography (OCE) in Northeast
Greenland spanning the years 2002–2017. Note: one location may comprise several stations (i.e. gear operations), each
with a specific-ID. Locations cover depths between shore and 1500 m and between latitudes 70° and 80 °N. Selected
locations have been visited regularly as part of a first time series for the area.
TUNU-Expedition Year TUNU- BIO TUNU-OCE
Pre-TUNU 2002 12 23
TUNU-I 2003 21 22
TUNU-II 2005 7 15
TUNU-III 2007 4 16
TUNU-IV 2010 15 14
TUNU-V 2013 8 22
TUNU-VI 2015 9 12
TUNU-VII 2017 9 12
TUNU in toto 2002-2017 85 136
Recent studies suggest that fishes and invertebrates such as Atlantic cod (Gadus morhua), beaked
redfish (Sebastes mentella), capelin (Mallotus villosus) and deepwater prawn (Pandalus borealis)
move from the Barents Sea to the Northeast Greenland shelf via the Return Atlantic Current
across the Fram Strait (Christiansen 2016; Andrews el al. 2019; Gjøsæter el al. 2020). The magni-
tude and regularity of this faunal connection between the Greenland Sea and the Barents Sea
need further study especially in light of ocean warming and the resulting northward spreading
of biota. Such shared living resources may affect future fisheries management across political
borders between Norway and Greenland.16 | ICES SCIENTIFIC REPORTS 2:75 | ICES
Figure 11 Locations visited during the TUNU-VI Expedition 5–17 August 2015. Grey shades delineate the extant distribu-
tion of Atlantic cod (Gadus morhua) on the Northeast Greenland shelf break and in the Barents Sea. EGC=East Greenland
Current (Arctic), GSG=Greenland Sea Gyre, RAC=Return Atlantic Current, WSC=West Spitsbergen Current (Atlantic). Fig-
ure from Christiansen el al. (2016).
2.7.1 Data contribution
TUNU has gathered exceptional baseline data on biodiversity and oceanography within the
fjords and across the shelf in Northeast Greenland. The TUNU data are the first of their kind,
and so the TUNU-area has become an Arctic key-site in the Circumpolar Biodiversity Monitoring
Programme (CBMP, http://www.caff.is/monitoring) commissioned by the Arctic Council. Data
comprise:
• Baseline data on biodiversity for fishes, benthos and plankton
• Baseline data on oceanographic conditions
• Bathymetry and multibeam maps of sea floor habitats (Department of Geology, UiT)
• The TUNU-Museum Collection with voucher specimens of primarily fishes (Univ. Mu-
seum Bergen)
• Time series for selected locations (years 2002–2021)
After quality check of data, the TUNU data will be made public available through ICES and
WGIEAGS – this in agreement with the authorizations given by the Government of Greenland.ICES | WGIEAGS 2020 | 17
3 Fishes in East Greenland
3.1 History and development of fishery in East Greenland
Since the mid-20th century East Greenland has been an important fishing area for many nations.
The main target species are Greenland halibut (Reinhardtius hippoglossoides), Northern shrimp
(Pandalus borealis), cod (Gadus morhua) and redfish (Sebastes mentella and S. norvegicus).
Along with observed changes in the environmental conditions, the spatial distribution of the
target species and thereby the fishery is expected to change. Changes in the environment have
been reported for east Greenland (Våge el al. 2018) and for high latitudes ecosystems (Fossheim
el al. 2015, Kortsch el al. 2015, Lind el al. 2018) in the same time period. New species such as
Atlantic mackerel (Scomber scombrus) and Atlantic herring (Clupea harengus) are becoming in-
creasingly important. As described above, a frontal zone between the cold low saline Polar Cur-
rent and the warmer and more saline Irminger Current dominate the waters off East Greenland,
and annual variability of these two current systems results in longitudinal change of the frontal
zone and consequently in a change in fish distribution. For example, analyses of the spatial dis-
tribution of the fisheries over a 20 years period based on detailed logbook information, shows a
spatial northward displacement of northern shrimp while a great decline in catches is taking
place. Contrary, the fishery for cod is displaced southward and catches increase in the same pe-
riod (Figure 12). The spatial distribution and catch level of Greenland halibut is relatively stable
during the time series.
During the last decades significant pelagic fishery has been introduced in the area. During this
spatial changes in a westward direction are apparent. In 2007, the first landings of herring was
recorded followed by the introduction of a fishery on Atlantic mackerel in 2011 (Figure 12). The
change from shrimp to cod and the presence of pelagic species are expected to continue during
future periods of climate related changes in the environment. In the following the main fish spe-
cies of high or some commercial importance will be described with focus on their distribution,
biology, fishery and ecological role.18 | ICES SCIENTIFIC REPORTS 2:75 | ICES
Figure 12. Development in catch (t) from the first recorded landings for cod in 1954 until present. Cod (Gadus morhua)
light blue, Redfish (Sebastes mentella and Sebastes norvegicus combined) orange, Northern shrimp (Pandalus borealis)
yellow, Greenland halibut (Reinhardtius hippoglossoides) grey, Atlantic herring (Clupea harengus) green and Atlantic
mackerel (Scomber scombrus) dark blue.
3.1.1 Northern shrimp (Pandalus borealis)
3.1.1.1 Biology and distribution
Northern shrimp (Pandalus borealis) is an expansive species (Bergström 2000) with a circumpo-
lar occurrence. In East Greenland shrimps are distributed along the entire coastline from the
south and up to 70°N and are most common at 100-600 m in depth (Horsted 1978; Bergström
2000). The preferred habitat is muddy bottom, and the bottom water temperature optimum in
Greenland waters is between 2 °C and 4 °C (Bergstöm 2000). The Northern shrimps are highly
mobile both horizontally and vertically, showing a diurnal migration, i.e. foraging at the bottom
during daytime and in the water column during the night (Horsted and Smidt 1956).
Northern shrimp is a protandric hermaphrodite. In East Greenland waters, the juveniles mature
as males at about 3-5 years of age, remain so for 2-3 years, and then undergoes transition to
female at an age of 5 to 8 years (Horsted and Smidt 1956; Wieland 2004).
Mating and spawning occur during July to September, the egg-bearing period lasts 8 to 10
months, depending on the temperature in the bottom water. The larvae hatch in April to June of
the following year (Horsted 1978; Shumway el al. 1985; Bergstrøm and Wilhjámsson 2006).
Spawning occurs during April in inshore shallow waters (Horsted 1978). The newly hatched
larvae live freely in the upper part of the water column. During spring and summer, the larvae
pass through six planktonic stages over a period of three to four months. In the last larval stages,
the larvae settle on the bottom and become immature (juvenile) shrimps (Shumway el al. 1985;
Storm and Pedersen 2003).
3.1.1.2 Fishery
Access to the fishing grounds at East Greenland depends on ice conditions and a multinational
fleet exploits the stock. During the recent ten years, vessels from Greenland, EU, the Faroe Is-
lands and Norway have fished in the Greenland EEZ.ICES | WGIEAGS 2020 | 19
Technical regulation includes minimum legal mesh size of at least 40 mm for both Greenlandic
and foreign trawlers and sorting grids with 22-mm bar spacing to reduce bycatch of fish. Discard
of shrimp is prohibited. The fishery started in 1978 and during the period from 1985 to 2003, total
catches fluctuated between 9 000 and 15 000 tonnes. Since 2004, total catch has decreased con-
siderably to only 547 t in 2018 (Figure 13). However, in the first half year of 2019, catches signif-
icantly increased to 1579 t (Riget 2019).
The fishery was originally conducted north of 65°N in the Dohrnbank-Stredebank area on both
sides of the territorial midline between Greenland and Iceland and on the slopes of Storfjord
Deep. In 1993, a fishery was also initiated south of 65°N in various smaller areas extending south
to the Cap Farewell. Since 2013, little to no fishery has been conducted south of 65°N (Figure
14).
Figure 13. Catch by shrimp trawlers fishing in Denmark Strait/off East Greenland. Series are given for the areas north and
south of 65N and overall. (Data for 2019 is part-years data, until July).20 | ICES SCIENTIFIC REPORTS 2:75 | ICES
Figure 14. Thematic mapping of different levels of catch in the shrimp fishery in Denmark Strait/off East Greenland 2013-
2019 (2019 until July)..
3.1.1.3 Management
Northern shrimp off East Greenland in ICES Div. XIVb and Va is assessed as a single population
by evaluation of fishery dependent and fishery-independent data. Thus, data from an annual
survey series has been available since 2008; however, no survey were performed in the period
2017 to 2019. The assessment is based on indices from survey and logbooks. The stock is managed
by catch quotas in the Greenlandic zone.
3.1.1.4 Ecosystem aspects
Changes in the physical and biological conditions for shrimp might have an effect on the popu-
lation size and distribution. However, for the time being, the impact of potential changing water
temperature and food availability on the shrimp population in East Greenland is unknown.
The northern shrimp are omnivores and predate on worms, dead organic material, algae and
zooplankton, and serve as food for large fish such as cod and Greenland halibut (Parsons 2005).
There is a tight relationship between the occurrence of cod and the disappearance of shrimps
(Worm and Myers 2003). Nevertheless, in recent years the estimated biomass of cod has been
low and the removal of shrimp by cod at the East Coast in unknown.ICES | WGIEAGS 2020 | 21
3.1.2 Capelin
3.1.2.1 Biology and distribution
The capelin is a small pelagic schooling fish. It is a cold-water species that inhabits arctic and
subarctic waters in the North Atlantic and North Pacific. Capelin in the Iceland-East Greenland-
Jan Mayen area is considered to be a separate stock. Capelin is a relatively short-lived fish being
4-5 years. Capelin reaches maturity-at-age 2–4. The main part of each year-class matures and
spawns at age 3. The remainder of the year-class spawns at age 4. Capelin are demersal spawners
that deposit their eggs on fine gravel at 10–150 m depth (Vilhjálmsson 2002). The main spawning
areas are off the southeast, south and west coast of Iceland. Spawning peaks in March in the
main spawning areas but somewhat later (April) elsewhere. The larvae hatch after approxi-
mately three weeks and drift toward the nursery areas. Most juveniles are found on or close to
the continental shelf. Until early 2000s, the nursery areas were located northwest, north and
northeast of Iceland, and on the East Greenland plateau, west of the Denmark Strait. Since the
early 2000s, the nursery areas have expanded to colder waters near east Greenland. Maturing
capelin usually undertakes extensive migrations in spring and summer to the feeding areas north
of the nursery areas. The summer–autumn distribution of the maturing stock has, like juvenile
population, shifted west since the early 2000s. Southern return migration in September–October
leads the adults to the shelf edge off the northwest Iceland where they are found in November.
3.1.2.2 Fishery
The capelin fishery is an international fishery mostly within the Iceland EEZ mainly using large
purse seiners while a smaller fraction is caught with pelagic trawl. The catch is for both con-
sumption and reduction. Beside Iceland, Norway, Greenland and Faroe Islands are the fishing
nations. Most of the fishery takes place in the autumn and winter due to good access of schools
of capelin and due to the better condition of the fish in this period.
3.1.2.3 Management
Capelin in the Iceland-East Greenland-Jan Mayen area is TAC managed by a tri-lateral agree-
ment between Iceland, Greenland and Faroe Islands. An initial TAC based on monitoring of im-
mature fish is set from the beginning of the fishing year (late June) until it is replaced by a pre-
liminary TAC in late autumn or winter. The latter is based on an autumn survey of the mature
stock and a final TAC set in February/March based on updated information of the mature stock.
The fishing year ends by 31st of March. The reasoning behind this TAC schedule is the short life
span of capelin and an objective of keeping the spawning stock above safe limits in order to
ensure a high probability of a good recruitment to the stock.
3.1.2.4 Ecosystem aspects
Capelin are pelagic, migratory, planktivorous fish, and changes of their physical and biological
environment may have profound effects on their abundance, migrations, distribution, and
growth. As in other areas, capelin play a key role in the marine ecosystem in the area. They not
only fall prey to several species of marine mammals and seabirds, but they are also the main
single item in the diet of Icelandic cod and of importance as food for several other commercial
fish species in Icelandic and Greenland waters. Capelin is a planktivore that mainly eat cope-
pods, euphausiids and amphipods (Gjøsæter 1998; Carscadden el al. 2001; Vilhjálmsson 2002).
Generally, the importance of copepods decreases with capelin size and that of euphausiids and
amphipods increases. The main copepod species eaten by small larval and juvenile capelin is
Calanus finmarchicus, Oithona spp, Temora spp, Acartia spp, Oncaea borealis and Pseudocalanus elon-
gatus. The importance of each species differs according to areas and size of the capelin. Later in
the season, there is a shift from smaller to larger food items. C. finmarchicus, C. hyperboreus and
euphausids (mainly Thysanoessa inermis) become increasingly important in the stomachs of larger22 | ICES SCIENTIFIC REPORTS 2:75 | ICES
capelin. Capelin are considered particularly sensitive to the ever-changing hydrobiological con-
ditions of the seas where they feed. However, the relationships between zooplankton abundance,
and abundances of capelin could not be proven significant during a multiyear study (Vilhjálms-
son 2002).
3.1.3 Mackerel
Atlantic mackerel (Scomber scombrus) occurs on both sides of the North Atlantic and has tradi-
tionally been grouped into five spawning components, some of which have been thought to be
isolated natal homing populations. In the Northeast Atlantic (NEA), mackerel spawns from the
Portuguese waters in the south to Iceland in the north and from Hatton Bank in the west to
Kattegat in the east. Despite the lack of complete spatial or temporal separation, NEA mackerel
is divided into three distinct entities, namely the Southern, Western and North Sea spawning
components (ICES 1977; 2013.a). Spawning starts in January/February in Iberian Peninsula wa-
ters and ends in July to the northwest of Scotland and in the North Sea (ICES, 2013a). While
spawning intensity varies locally from day to day (Bakken, 1977; Iversen, 1981), it seems to form
one large spatio-temporal continuum on the larger scale.
Post larval mackerel feed on a variety of zooplankton and small fish. They generally eat quite
large prey compared to their own size (Pepin el al., 1987; Langoy el al., 2006). Feeding patterns
during later stages vary seasonally, spatially and with size. Mackerel stops feeding almost com-
pletely during winter. Main zooplankton prey species in the North Sea are: Copepods (mainly
Calanus finmarchicus), euphausiids (mainly Meganyctiphanes norvegica), while primary fish prey
species are: sandeel, herring, sprat, and Norway pout (Walsh and Rankine, 1979; Mehl and West-
gård, 1983; ICES, 1989; ICES, 1997). In the Norwegian Sea euphausiids, copepods (mainly Calanus
finmarchicus and Oithona), Limacina retroversa, Maurolicus muelleri, amphipods, Appendicularia
and capelin are the main diet during the summer feeding migration (Prokopchuk and Sentyabov,
2006; Langoy el al., 2010). The mackerel is opportunistic, and from one year to the next they may
exploit any available oceanic areas for feeding purposes (Langøy el al. 2012). A westwards and
northwards expansion of populations has been observed in the Nordic Seas in recent years (since
2007), as far as Icelandic and south Greenlandic waters in the west and as far north as Spitsbergen
(Nøttestad, 2014). Historically, expansions into Icelandic waters are known to coincide with pe-
riods of warm waters (Astthorsson el al., 2012).
While spawning occurs widely on the shelf and shelf edge from the Bay of Biscay to the southern
Norwegian Sea, most of the egg production is concentrated in two core spawning areas. One
elongated area is seen along the shelf break from Spanish and Portuguese waters in January to
March, and another is seen around southwest Ireland to the west of Scotland where spawning
peaked in April (Beare and Reid, 2002; Iversen, 2002), however the spawning peak has shifted to
March in the most recent years. In the central North Sea spawning takes place in May–July.
Mackerel performs extensive migrations between spawning grounds, feeding grounds and over-
wintering areas. The migration pattern has changed substantially through time. During the feed-
ing migration in summer (3rd quarter) the larger fish reaches furthest to the north and west (Holst
and Iversen, 1992; Nøttestad el al., 1999; Anon 2009; ICES, 2009) as far as East Greenland and the
Norwegian Sea. Similarly, the larger mackerel also arrive to the feeding areas (observed in east-
ern Danish waters) earlier and leave later than smaller mackerel (Jansen and Gislason, 2011). The
mackerel return in late summer and early autumn from the feeding areas on the European shelf
and in the Nordic Seas, and aggregate through late autumn and early winter along the continen-
tal shelf edge.ICES | WGIEAGS 2020 | 23
3.1.3.1 Fishery
Fishery for mackerel in the east Greenland area is a relatively new fishery that began in 2011.
This fishery is limited to the summer season from ultimo June to September when the mackerel
has migrated to the northern and western feeding grounds. Pelagic trawling and to a lesser de-
gree purse seining are conducted from large freeze factory vessels. Total catches taken from the
NEA mackerel stock has in recent years been more than one million tonnes while in East Green-
land waters catches are around 50 thousand tonnes.
3.1.3.2 Management
The NEA mackerel stock is managed by the coastal states under the Northeast Atlantic Fisheries
Organization (NEAFC), since the stock is widely distributed outside national EEZs. More nations
in the Northeast Atlantic are aiming to agree on a TAC management, however, for a decade they
have not succeeded in such common TAC and autonomous quotas are therefore set by each na-
tion, resulting in total TAC well in excess of the advised TAC.
3.1.4 Herring
3.1.4.1 Biology and distribution
The Norwegian spring-spawning herring (Clupea harengus) is the largest herring stock in the
world. It is widely distributed and highly migratory throughout large parts of the NE Atlantic
during its lifespan (Dragesund el al. 1997). The herring spawns along the Norwegian west coast
in February-March. The larvae drift north and northeast and distribute as 0–group in fjords along
the Norwegian coast and in the Barents Sea. The Barents Sea is by far the most important juvenile
area for the large year classes (Dragesund 1970; Holst and Slotte 1998), and is the basis for the
large production-potential of the stock. Most of the young herring leave the Barents Sea at 3 years
age and feed in the northeastern Norwegian Sea for 1–2 years before recruiting to the spawning
stock (Holst and Slotte 1998). When mature, the young herring starts joining the adult feeding
migration in the Norwegian Sea. The feeding migration starts just after spawning with a maxi-
mum feeding intensity and condition increase occurring from late May until early July (Homrum
el al., 2016). After the dispersed feeding migration the herring concentrate in one or more win-
tering areas in September-October. After the wintering, the spawning migration starts around
mid-January. A characteristic feature of this herring stock is a very flexible and varying migra-
tion pattern. In May the herring is migrating westwards into the Norwegian Sea for summer
feeding and the main concentrations are found in the central part of this area. In July the herring
spread out over a wide area. They are then feeding around the fringes of the Norwegian Sea,
particularly in the northern and western region, while almost no herring are observed in the
central region. In this period herring is abundant in East Greenland waters.
3.1.4.2 Fishery
The fishery is carried out all year-round by purse-seines and pelagic trawlers. The catches are
used as well for reduction purposes and human consumption.
3.1.4.3 Management
The fishery is regulated by the Coastal States. The TAC is set by the Coastal States and derived
from an agreed long-term management plan under the Northeast Atlantic Fisheries Organiza-
tion (NEAFC). The Coastal States also agree on the allocation of the TAC into national quota. The
Coastal States involved are the European Union, Faroe Islands, Iceland, Norway and the Russian
Federation. However, since 2013 there has been no agreement due to shift in stock distribution
(and territorial claims) which has led to autonomous quotas (and catches) in excess of the advice.You can also read