GLOBEFISH RESEARCH PROGRAMME - Global Production and Marketing of Canned Tuna - Food and ...
←
→
Page content transcription
If your browser does not render page correctly, please read the page content below
Global Production and Marketing of Canned Tuna
                                                                                                           GLOBEFISH RESEARCH PROGRAMME

                                                                                                                 Global Production and Marketing
                                                                                                                 of Canned Tuna
                                                               Volume 93

Food and Agriculture Organization of the United Nations
         Fish Products and Industry Division
             Viale delle Terme di Caracalla
                   00153 Rome, Italy
                 Tel.: +39 06 5705 5074
                Fax: +39 06 5705 5188
                   www.globefish.org
                                                                                                                         Volume 93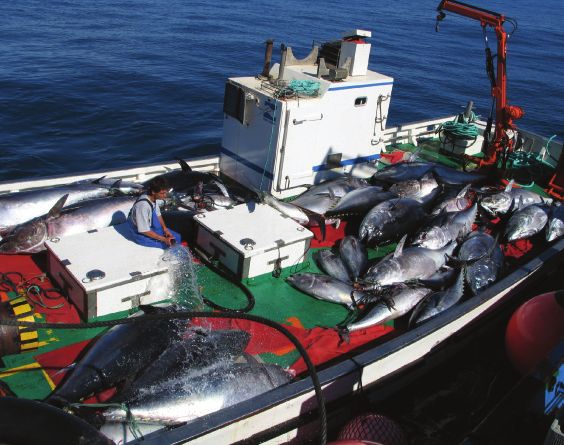
Global Production and Marketing of
                                  Canned Tuna

                                                             by

                                                  Lahsen Ababouch
                                                   Camillo Catarci

                                                      (April 2008)

The GLOBEFISH Research Programme is an activity initiated by FAO's Fish Utilisation and Marketing Service, Rome,
Italy and financed jointly by:

-       NMFS (National Marine Fisheries Service), Washington, DC, USA
-       FROM, Ministerio de Agricultura, Pesca y Alimentación, Madrid, Spain
-       Ministry of Food, Agriculture and Fisheries, Copenhagen, Denmark
-       European Commission, Directorate General for Fisheries, Brussels, EU
-       Norwegian Seafood Export Council, Tromsoe, Norway
-       OFIMER (Office National Interprofessionnel des Produits de la Mer et de
        l’Aquaculture), Paris, France
-       ASMI (Alaska Seafood Marketing Institute), USA
-       DFO (Department of Fisheries and Oceans), Canada
-        SSA (Seafood Services Australia), Australia
-       Ministry of Fisheries, New Zealand

      Food and Agriculture Organization of the United Nations, GLOBEFISH, Fish Products and Industry Division
                      Viale delle Terme di Caracalla, 00153Rome, Italy – Tel.: (39) 06570 56313
                  E-mail: GLOBEFISH@fao.org - Fax: (39) 0657055188 – http//:www.globefish.org

                                                              i
The designation employed and the presentation of material in this publication do
not imply the expression of any opinion whatsoever on the part of the Food and
Agriculture Organization of the United Nations concerning the legal status of any
country, territory, city or area or of its authorities, or concerning the delimitation of
its frontiers or boundaries.
Lahsen Ababouch, Camillo Catarci.;
GLOBAL PRODUCTION AND MARKETING OF CANNED TUNA
GLOBEFISH Research Programme, Vol.94 Rome, FAO. 2008. p. 65
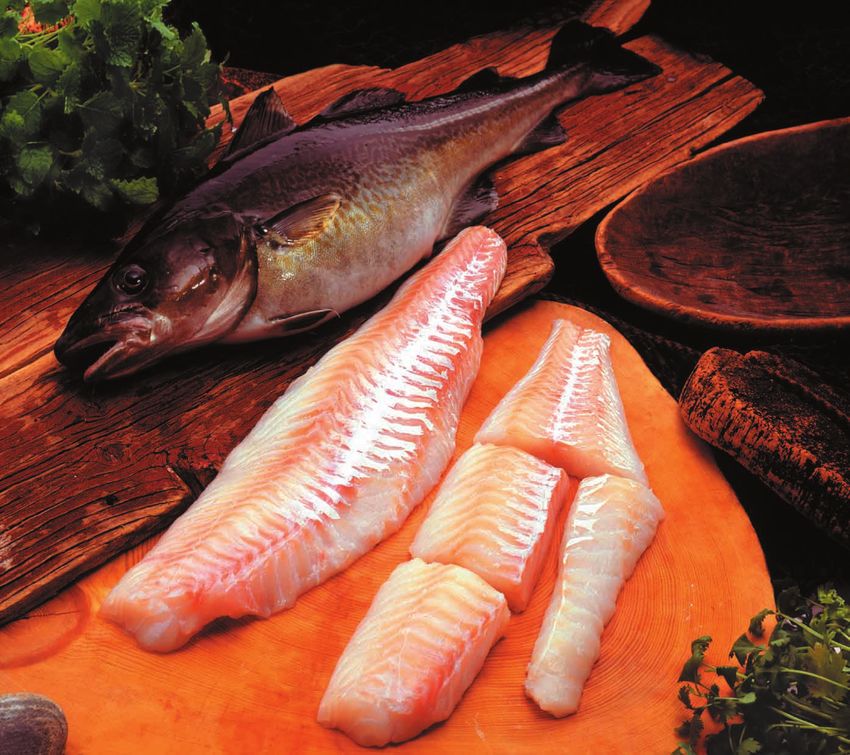
Fish in general and tuna in particular have been canned for many
centuries. The three main tuna species that are canned are skipjack
(Katsuwonus pelamis), yellowfin (Thunnus albacores) and albacore
tuna (Thunnus alalunga). The main consuming countries are the EU,
the United States, Canada, Japan, Mexico and Iran. In terms of
geographic origin, there has been since the seventies a decline of the
traditional canned tuna production poles in the North, and the
emergence of new production poles in South East Asia, Africa and
Latin America. In the future, globalization of the tuna canning industry
is foreseen to continue at a steady pace, both in terms of outsourcing
processing into low labour cost countries and of further vertical
integration and consolidation at retail level.
Acknowledgement : The report layout was prepared by Tony Piccolo
GLOBEFISH.
All rights reserved. No part of this publication may be reproduced, stored in a retrieval system,
or transmitted in any means, electronic, mechanical, photocopying or otherwise, without the
prior permission of the copyright owner. Applications for such permission, with a statement of
the purpose and extent of the reproduction, should be addressed to the Director, Information
Division, Food and Agriculture Organization of the United Nations, Viale delle Terme di
Caracalla, 00100 Rome, Italy.
© FAO 2008
iiTABLE OF CONTENT
1. INTRODUCTION ................................................................................................................... 1
2. THE GLOBAL CANNING INDUSTRY ................................................................................ 2
2.1. Technology..................................................................................................................... 2
2.2. Canned Tuna Production................................................................................................ 4
2.3. Major producers of canned tuna..................................................................................... 5
2.4. Labor costs ..................................................................................................................... 8
3. GLOBAL TRADE OF CANNED TUNA ............................................................................... 9
3.1. Consumption .................................................................................................................. 9
3.2. Global trade of canned tuna ......................................................................................... 10
3.2.1. Canned tuna exports .............................................................................................. 11
3.2.2. Canned tuna imports .............................................................................................. 13
3.3. Market access requirements ......................................................................................... 15
3.3.1. Tariffs and quotas .................................................................................................. 15
3.3.2. Rules of origin ........................................................................................................ 17
3.3.3. Environmental protection requirements ................................................................ 18
3.3.4. Consumer protection requirements........................................................................ 19
3.3.4.1. Institutional and regulatory frameworks .......................................................... 20
3.3.4.2. Product certification ......................................................................................... 23
4. PRICES .................................................................................................................................. 25
5. CONCULUSION AND OUTLOOK FOR THE GLOBAL MARKET OF
CANNED TUN.............................................................................................................................. 31
6. ANNEX 1: MAIN TUNA IMPORTERS, EXPORTERS AND PROCESSORS.................. 33
7. SUGGESTED READINGS ................................................................................................... 33
8. LIST OF ABBREVIATIONS................................................................................................ 35
iiiTABLES
TABLE 1: MAIN PRODUCERS OF CANNED TUNA AT A GLOBAL LEVEL ...................... 7
TABLE 2: LABOUR COSTS IN TUAN CANNING, IN EUR/TONNE ...................................... 8
TABLE 3: MINIMUM WAGE OF TUNA CANNERIES IN THE US, AMERICAN SAMOA
AND ASIA....................................................................................................................................... 8
TABLE 4: MAIN CONSUMING COUNTRIES OF CANNED TUNA IN 2005 ................................. 9
TABLE 5: MAJOR TRADED COMMODITIES WORLDWIDE, 2005............................................. 11
TABLE 6: TARIFFS APPLIED TO TUNA AND TUNA PRODUCTS ENTERING THE EU ............ 16
TABLE 7: DETENTIONS AND REJECTIONS OF FISH CONSIGNMENTS AT EU BORDERS DUE
TO HISTAMINE ............................................................................................................................. 24
FIGURES
FIGURE 1: EXAMPLE OF A FLOW CHART FOR THE PRODUCTION OF CANNED TUNA ......... 3
FIGURE 2: EVOLUTION OF WORLD TUNA CAPTURES AND PROCESSING, 1976-2005 . 4
FIGURE 3: WORLD PRODUCTION OF PROCESSED TUAN, 1976-2005 ............................... 5
FIGURE 4: EVOLUTION OF WORLD CONSUMPTION OF CANNED TUNA, 1980-2005 .... 9
FIGURE 5: EU 15 COMPOSITION OF CANNED TUNA KG/PERSON/Y (2003)................... 10
FIGURE 6: WORLD EXPORTS OF PROCESSED TUNA, QUANTITY 1976-2005................ 12
FIGURE 7: WORKD EXPORTS OF PROCESSED TUNA, VALUE 1976-2005 ...................... 12
FIGURE 8: UNITED STATES' IMPORTS OF CANNED TUNA, 1989-2006 ........................... 14
FIGURE 9: MAIN EXPORTERS OF CANNED TUNA INTO THE UNITED STATES
QUANTITY 1989-2006................................................................................................................. 14
FIGURE 10: UNITED STATES' IMPORTS OF TUNA IN POUCHES 1989-2006 ................... 15
FIGURE 11: PRICES OF FROZEN SKIPJACK IN THAILAND, 1987-2007 ............................ 26
FIGURE 12: PRICES OF FROZEN YELLOWFIN IN THE EU, 1993-2007.............................. 27
FIGURE 13: PRICES OF YELLOWFIN LOINS IN ITALY, 1999-2007.................................... 28
FIGURE 14: PRICES OF CANNED TUNA IN THE EU, ORIGIN: THAILAND 1983-2007 ... 29
FIGURE 15: THE WORLD TUNA MARKET, 1987-2005 ......................................................... 30
iv1. INTRODUCTION.
Since its discovery by the Frenchman Nicholas Appert at the beginning of the nineteen
century, the method of preserving food by heat and hermetical packaging has become a fairly
well established process and industry. For many decades, this preservation method,
sometimes referred to as “appertization” but mostly known as canning, was based on a trial
and error approach until scientific developments enabled the emergence of its technological
foundations and the subsequent growth of the food canning industry.
Fish in general and tuna in particular have been canned for many centuries. Early reports
dating back to the fifteen century indicate that Spanish people in Seville were already
preserving tuna using boiling seawater and hermetical packaging. During the eighteenth and
the nineteenth centuries, Italians from the region of Genoa had already developed a tuna
canning operation with processing and distribution channels spreading over to Sardinia,
Tunisia, Spain and Portugal. But, it is in California around 1903 that the modern tuna canning
industry was initiated when local canneries faced a decline in supply of sardines and started
substituting them with albacore tuna for canning.
Nowadays, consumers enjoy billions of fish cans worldwide, representing over 12.2 million
tonnes or 24 percent of the fish processed for human consumption including over 3 million
tonnes of tuna (live weight equivalent LWE) used for canning.
The organization and structure of the tuna canning industry and canned tuna market has
evolved over the years as a result of several developments, including:
• the extension of tuna fishing to tropical and subtropical fishing grounds, initiated in
the 1960s and accelerated during the 1970s and 1980s;
• the extension of the EEZ limit to 200 miles
• the progressive dismantling of tariffs and quotas under the General Agreement on
Tariffs and Trade (GATT) and the World Trade Organization (WTO) and
• the development of special tariff and quota regimes under various regional or bilateral
trade agreements
As a result, tuna canning plants were moved progressively from the countries of consumption
such as the European Union (EU), the United States and Japan, to countries close to tuna
fishing grounds, or with low corporate taxes and/or to countries with very attractive labour
costs.
Also, the increase in tuna production and subsequent decrease in price of raw material in the
1970s, attracted new players to invest in tuna canning, especially from Latin America and
South East Asia.
Consequently, the globalization of the tuna production and processing industry has had an
important impact on the tuna canning industry in terms of investment, technology, product
developments, marketing and market access requirements. This paper outlines the major
developments that have occurred in the canned tuna markets and the future prospects of this
industry.
12. THE GLOBAL CANNING INDUSTRY
2.1. Technology
The three main tuna species that are canned are skipjack (Katsuwonus pelamis), yellowfin
(Thunnus albacores) and albacore tuna (Thunnus alalunga). Canned skipjack and yellowfin
tuna are called light meat tuna because of the light pink colour of the tuna flesh whereas
canned albacore tuna is called white meat tuna because of the white flesh colour.
Canneries are generally supplied with frozen whole tunas from fishing vessels or reefer
carriers, sometimes with pre-cooked frozen tuna loins and rarely with fresh whole tunas.
The process of canning tuna involves several steps (Figure 1).
Once the captured fish is loaded on-board, it is frozen in brine and stored in tanks filled with
refrigerated brine. During the storage, the fish will absorb salt and care should be exercised to
ensure it does not exceed one percent of salt in the aqueous phase of the muscle.
Once the vessel reaches port, the tunas are unloaded from the fishing vessels or reefer carriers
and graded by size and quality to ensure uniform thawing and cooking throughout the
products. Certain controls such as histamine and salt levels are sometimes carried out before
unloading and transportation to canneries.
In the cannery, frozen tunas are thawed in cool water or in tanks equipped with water sprays,
following which they are gilled, gutted and headed using mechanical stainless steel saws.
After butchering, the tunas are sorted by size and loaded onto trays that are in turn stacked on
wheeled shelf racks and taken to the cooker. In addition to facilitating the subsequent dressing
operations, cooking drains water and gases from the flesh. If not removed, the water and
gases will swell or burst the cans during sterilization. Up to 30 percent weight loss occurs
during the cooking phase, which takes generally from 45 minutes to three hours, depending
on the size and species of tuna.
After cooking and cooling, the tunas are put on conveyor belts that carry the fish to the
dressing tables where workers, equipped with knives, remove manually the skin and dark
meat from the fish and separate the tuna loins from the skeleton. The dark meat scraped from
the loins may be used to prepare pet food. The waste from tuna dressing is combined with
waste from gutting and used to produce fish oil and fish meal in a separate plant.
Fish loins or chunks are packed into cans and hot filled with oil, brine, spring water or sauce.
Various flavouring and seasoning additives, including salt, vegetable broth, lemon,
monosodium glutamate, vinegar, hydrolysed proteins or spices can also be added. The packed
cans are then hermetically sealed, using a double seaming process, and washed. The double
seaming operation is highly automated and some machines can seal up to 300 cans per minute
or more for standard can formats.
2Figure 1. Example of a flow chart for the production of canned tuna
Landing fresh or frozen tuna (eventual quality and histamine control)
Transportation to the cannery
Frozen tuna loins Receiving at the cannery
Thawing frozen tuna or loins (eventually at temperatures < 5 C)
Beheading, gutting and gills removal of whole tunas
Cooking in steam (around 30 percent weight reduction)
Manual dressing (removal of skin, dark muscle and separation of loin and skeleton)
Packing in cans
Hot filling (oil, brine, spices, sauces, additives)
Double seaming
Sterilization (heating-up, sterilization and cooling up to F0 > 3 min but often > 5 min)
Cooling and drying
Packaging cans into cartons
Palletization and storage
Transportation and distribution
After the cans are sealed and washed, they are placed in a retort where they are sterilised
using a time-temperature combination that will achieve a commercially sterile product. The
sterilization process is also automated and involves three steps, e.g. heating, sterilization and
cooling. The cumulative sterilizing effects of these three steps should add up to an F0 > than
3.6 minutes but often > 5-7 minutes. F0 is defined as the equivalent process time of a
sterilization process at 121.1° C with a Z factor of 10° C. Z is defined as the increase in
temperature that is necessary to reduce a thermal process duration by 90 percent.
After the sterile cans are cooled and dried, they are labelled and packed into cardboard
cartons and onto pallets for storage and distribution. Cartons generally contain either 24 or 48
cans of tuna for home/picnic consumption or 6 large cans of tuna for the catering sector.
During the last 10 years, many canneries in Europe and the United States have been
increasingly supplied with frozen cooked tuna loins in order to reduce labour costs in tuna
fish canning. It is estimated that around 100,000 to 120,000 tonnes of frozen cooked tuna
loins are used yearly for tuna canning. The preparation of frozen cooked tuna loins involves
3similar preliminary steps as described above. The frozen tuna is thawed, before being
beheaded, gilled and gutted and cooked. Then, the side fish muscles (loins) are removed
before being frozen and packed for frozen transportation to canneries. In the tuna canneries,
the loins are cut into pieces for solid packs or chunks and packed into the cans. The rest of the
process is similar to that of the whole frozen tuna.
2.2. Canned tuna production
Worldwide data show that tuna capture has increased from 400,000 tonnes in 1950 to 2
million tonnes in 1980 and to 4.3 million tonnes nowadays, of which a major proportion,
equivalent to 70 percent in live weight equivalent (LWE), is processed into canned fish
(Figure 2). LWE of canned or precooked loin tuna is obtained by multiplying the net weight
of the product by a conversion factor of 1.92.
Figure 2.
Fig. 2 Evolution of world tuna captures and
processing, 1976-2005
5 000 000
4 500 000 Tuna catches
4 000 000 Processed tuna (lw )
3 500 000 Processed tuna (nw )
3 000 000
tonnes
2 500 000
2 000 000
1 500 000
1 000 000
500 000
1976
1977
1978
1979
1980
1981
1982
1983
1984
1985
1986
1987
1988
1989
1990
1991
1992
1993
1994
1995
1996
1997
1998
1999
2000
2001
2002
2003
2004
2005
year
Traditional canned tuna products are marketed as solid packs, chunks or flakes. They are
conditioned in tins or rarely in glass jars, either in standard formats (e.g. 170 g net weight in
the United States) or other varying format sizes in Europe (80g, 120g, 160g, 200g, 240g,
500g, 1 kg or 2 kg). Canned tuna for the catering sector is conditioned in 2 kg or 5 kg tins.
Traditional canned tuna is packed either in brine (“au naturel”) or in oil (soy, rapeseed,
sunflower, olive oil).
In addition to these traditional canned tuna products, several value-added products have been
developed worldwide over the last 30 years to adapt to consumer lifestyle change,
requirements and preferences. High value canned tuna products comprise canned tuna packed
in extra virgin olive oil, tuna salads, tuna paté, tuna in sauce, with herbs or spices, and
specialty canned tuna covering products corresponding to specific tuna-based recipes,
especially from Italy and Spain. The packing size is varied: 85, 100, 200 or 300g for home
consumption or 1 to 2 kg for catering.
More recently, flexible pouching has gained market recognition for tuna products. Several
ready-to-eat tuna products packed in flexible pouches have been developed. These include
tuna salads, tuna dices, smoked tuna fillets, spiced tuna, mayonnaise tuna, tuna in “sweet –
4sour” sauce or whole canned tuna steaks, all packed in flexible pouches. The market for these
products has developed mainly in the United States and to some extent in the EU, especially
Northern Europe. For example, the demand for tuna in flexible pouches has increased by
120 percent in the United States between 2002 and 2003.
2.3. Major producers of canned tuna
Figure 3 shows the evolution of canned tuna production worldwide. The United States, which
used to be the main producer, has been overtaken by Thailand and Spain. These three
countries represent the major canned tuna producers. Over the years the situation has evolved
significantly to adapt to the expansion of tuna fishing into new grounds and tropical and inter-
tropical waters.
Figure 3.
Fig. 3. World production of processed tuna, 1976-
2005
Others
1 800 000
France
1 600 000
Indonesia
1 400 000 Japan
1 200 000 Italy
tonnes
1 000 000 Iran (Islamic Rep. of)
800 000 Mexico
600 000 Ecuador
400 000 United States of America
Spain
200 000
Thailand
1976
1977
1978
1979
1980
1981
1982
1983
1984
1985
1986
1987
1988
1989
1990
1991
1992
1993
1994
1995
1996
1997
1998
1999
2000
2001
2002
2003
2004
2005
year
As early as the 1960s, the tuna canning industry sector reacted to the expansion of the tuna
fishing industry from traditional fishing grounds towards the inter-tropical tuna zones by
delocalizing tuna canning plants from the consumers countries (United States, Europe and
Japan) into overseas countries to benefit from low labour costs, the proximity of the fishing
grounds and/or low corporate taxes. A first wave of canning plants’ delocalization was
undertaken in the 1960s, initiated by the major firms in developed countries. Thus, French
tuna firms opened canneries in West Africa (Senegal and Cote d’Ivoire) and California-based
companies moved canning operations to Puerto Rico and American Samoa.
Starting in the 1970s, further expansion of tuna fishing led to an increase in tuna supply and a
natural subsequent decrease in raw material cost. This context, coupled to a sustained growth
in demand, was favourable to the entry of new companies and countries in the canning
industry, especially from Latin America, Africa and South East Asia. In South America, the
modern tuna fishing fleet of Mexico favoured the development of a canning industry which
targeted the domestic market as a reaction to the dispute with the United States over tuna
resources in the Eastern Central Pacific Ocean, which did not enable export of Mexican
canned tuna to the United States.
5But it is in South East Asia that tuna canning experienced the most sustained development.
This was favoured by the conjunction of investors’ interest in canning operations in low
labour cost countries and the interest in hard currency earnings by exporting countries such as
Thailand, Indonesia and the Philippines.
In parallel, an increase of tuna fishing by countries such as Venezuela and Ecuador attracted
foreign investment, especially from Spain and United States, which invested in canning
operations in these countries starting in the 1980s.
Finally, a second wave of investment in tuna canning took place in Africa in the early 1990s
as a result of the development of tuna fishing by Europe in the West Indian Ocean and by
Ghana in the Eastern Central Atlantic. French, American and Japanese interests invested to
build canning operations in Mauritius, Seychelles and Ghana as early as the 1980s. In terms
of industry structure, the multiplication of countries where canning operations have been
installed was paralleled by a concentration of canneries in the hands of few corporations from
Europe, the United States, South East Asia and Japan.
In terms of geographic origin, there has been since the 1970s a decline of the traditional
canned tuna production poles in the North, and the emergence of new production poles in
South East Asia, Africa and Latin America.
In 1976, the United States produced 53 percent of world canned tuna, Japan 18 percent and
EU countries (France, Italy, Spain and Portugal) 18 percent. These percentages have fallen in
2005 to respectively 13 percent for the United States, 4 percent for Japan and increased to
21 percent for the EU. At the same time, the production of canned tuna by new players has
increased from 5 to 12 percent for ACP countries, from 1 to 31 percent for South East Asian
countries and from 3 to 8 percent for Latin American countries which benefited from the
generalised preferential system (GPS Plus, see table 3). Together, these three new poles of
production of canned tuna handle around 51 percent of tuna canning.
It is worth noting that the 6 main production poles of canned tuna are either consumption
centers (United States, EU and Japan) or countries exporting to the United States, Japan and
EU (South East Asia, ACP countries and GPS- drugs countries). The rest of the countries
comprise mainly Mexico and Iran, both countries representing 85 percent of the canning
centers outside of the important 6 poles. Both Iran and Mexico produce canned tuna mainly
for domestic markets. Other small scale producers of canned tuna for domestic markets are
Tunisia and Morocco
Despite the expansion of tuna canning plants to different regions and countries, the industry is
highly integrated and dominated by few multinational corporations (Table 1). These
companies have invested in their production lines in various developing and few European
countries.
6Table 1. Main producers of canned tuna at the global level (in alphabetical order)
Company Ownership Headquarters Plants Markets
Bolton Bolton France France, Italy Mainly France and Italy
Alimentari Group (Saupiquet) and Côte market, also important in
(Dutch- and Italy (Rio d'Ivoire (the Germany, Belgium,
Italian Mare) Ivorian plant Austria, Slovenia, Croatia
corporation) has temporarily and Saudi Arabia.
ceased
operations due
to political
turmoil)
Bumble Bee Centre United States California, 24 percent of the United
Partners of America Puerto Rico, States’ market; also
Management Fiji, Trinidad, important in Canada
Ltd. joint Ecuador,
ownership Thailand
with Connor
Bros Income
Fund
Calvo, Grupo Calvo Spain Spain, Spain, Italy, other EU
Venezuela, El countries
Salvador,
Brazil, Morocco
Chicken of the Thai Union United States American 17 percent of the United
Sea Inc. of America Samoa States’ market
Isabel Isabel Spain Spain, Ecuador, Spain, EU
Garavilla Morocco
Jealsa- Jealsa Spain Spain, France, Spain, Italy, other
Rianxeira Guatemala, EU countries
Chile
Lehman United States Seychelles, UK and Ireland with John
Brothers of America Ghana and West, Australia avec
France Greenseas; France with
Petit Navire and Italy
with Mareblú
Salica - Albacora Spain Spain, Ecuador Spain, EU
Albacora
Seafood Hub Ireland Ireland and Mauritius UK and Ireland, France,
(Thon des Blyth Ltd. Mauritius United States
Mascareignes)
Starkist Del Monte United States American 40 percent of the US
of America Samoa, Ecuador market
and Papua New
Guinea
Thai Union Thailand Thailand United States with
Group Chicken of the Sea, other
countries with
supermarket brands and
own labels
(sources: industry contacts).
72.4. Labour costs
Table 2 compares labour costs in EU, African and Latin American countries. It shows clearly
the competitive advantage of African countries as compared to Latin America or to the EU.
Table 2. Labour costs in tuna canning, in EUR/tonne.
Yellowfin Skipjack
Labour cost
from whole from tuna from whole from tuna
(€/tonne)
tuna1 loins tuna loins
EU 664 146 797 146
Africa 160 184
Latin America 237 273
(adapted from Anonymous 2005).
Likewise, Table 3 demonstrates clearly the competitive advantage of Asian countries in terms
of labour costs as compared to other American or Pacific canning operations.
Table 3. Minimum wage of tuna canneries in the United States, American Samoa and
Asia.
Country Wage (US$/hour)
United States – California and Puerto Rico 5.15
United States – American Samoa 3.26
Ecuador 0.77
The Philippines 0.67
Thailand 0.66
(2004; source: United States Department of Labor).
1
Assuming a production of 50 percent canned tuna in oil and 50 percent canned tuna in brine in the
areas taken into account.
83. GLOBAL TRADE OF CANNED TUNA.
3.1. Consumption
Canned tuna has always enjoyed worldwide consumption because of its gustative and
nutritional properties, convenience and affordable price. During the period 1980 – 2002,
world consumption of canned tuna LWE has increased by almost 85 percent, from
0.26 kg/caput/year to almost 0.5 kg/caput/year. In the years that followed, however, tuna
consumption declined slightly (Figure 4).
Figure 4.
Fig. 4. Evolution of world consumption of canned
tuna (live weight equivalent), 1980-2005
0.50
0.45
0.40
0.35
kg/pc
0.30
0.25
0.20
0.15
0.10
1980
1981
1982
1983
1984
1985
1986
1987
1988
1989
1990
1991
1992
1993
1994
1995
1996
1997
1998
1999
2000
2001
2002
2003
2004
2005
year
The main consuming countries are the EU 25, the United States, Canada, Japan, Mexico and
Iran (Table 4).
Table 4: Main consuming countries of canned tuna in 2005.
Country Supply of canned tuna Population Per capita
(tonnes) consumption
(kg/person/year)
EU 25 712 088 459500 1.55
United States 406 043 298200 1.36
Canada 34 751 32300 1.08
Iran 68 696 69500 0.99
Japan 94 744 128100 0.74
Mexico 74 808 107000 0.70
World average 1540534 6464700 0.24
(sources: FAO FISHSTAT Plus and UN Population Division).
In the EU, tuna consumption is much higher than the world average. The main EU consuming
countries are Spain, Italy, France, UK and Portugal (Figure 5).
9Figure 5.
Fig. 5 EU 15 consumption of canned tuna
kg/person/year (2003)
3.50
3.00
2.50
2.00
kg/pc
1.50
1.00
0.50
0.00
Denmark
EU15 total
United Kingdom
Germany
Portugal
Belgium
France
Finland
Ireland
Greece
Luxembourg
Italy
Netherlands
Spain
Austria
Sweden
country
3.2. Global trade of canned tuna
Tuna is the second major commodity traded worldwide after groundfish in terms of volume.
The value of tuna products traded globally represents 10 percent of total global fish trade, of
which around 44 percent is represented by processed tuna (Table 5).
10Table 5. Major traded commodities worldwide, 2005
Commodity Import quantity (tonnes) Import value (US$1,000)
Marine fishes not identified 10,072,358 15,410,539
Cods, hakes, haddocks 3,313,293 9,782,057
Tunas, bonitos, billfishes 3,204,371 8,058,189
-of which canned tuna 1,205,305 3,526,304
Herrings, sardines, anchovies 2,671,536 2,939,699
Shrimps, prawns 2,135,076 12,807,241
Salmons, trouts, smelts 1,903,126 8,189,007
Squids, cuttlefishes, octopuses 1,384,053 4,061,522
Miscellaneous pelagic fishes 1,770,071 2,028,182
Flounders, halibuts, soles 564,250 1,961,234
Miscellaneous demersal fishes 406,566 1,377,687
Crabs, sea-spiders 381,649 2,413,609
Miscellaneous freshwater fishes 353,439 1,521,354
Miscellaneous coastal fishes 317,481 982,932
Miscellaneous marine molluscs 275,634 1,262,604
Mussels 257,324 530,551
Lobsters, spiny-rock lobsters 164,995 2,669,389
Clams, cockles, arkshells 155,095 306,109
Tilapias and other cichlids 144,754 416,783
Sharks, rays, chimaeras 119,861 576,965
Scallops, pectens 110,625 1,037,548
Miscellaneous aquatic invertebrates 107,101 257,208
Miscellaneous marine crustaceans 85,002 363,042
River eels 83,698 1,002,380
Oysters 57,263 216,088
Sea-urchins and other echinoderms 33,030 361,299
King crabs, squat-lobsters 31,464 424,549
Carps, barbels and other cyprinids 24,227 42,652
Freshwater crustaceans 11,686 65,597
Miscellaneous diadromous fishes 11,242 7,429
Abalones, winkles, conchs 9,825 360,741
Miscellaneous aquatic mammals 6,469 8,926
Shads 6,059 8,016
Sturgeons, paddlefishes 210 78,155
TOTAL 30,172,833 81,529,283
(source: FAO FISHSTAT Plus).
3.2.1 Canned tuna export
Export volumes of canned tuna has increased significantly over the years, from less than
100,000 tonnes in 1976 to more than 1 million tonnes in 2005, valued at US$ 3.1 billion
(figure 6).
11Figure 6.
Fig. 6 World exports of processed tuna, quantity
1976-2005
1 200 000
1 000 000 Thailand Ecuador
800 000 Spain Others
tonnes
600 000
400 000
200 000
1976
1977
1978
1979
1980
1981
1982
1983
1984
1985
1986
1987
1988
1989
1990
1991
1992
1993
1994
1995
1996
1997
1998
1999
2000
2001
2002
2003
2004
2005
year
This includes export of frozen tuna loins used in canning. A decline was observed in 2001
due probably to the major crash in prices of both frozen and canned tuna. This prompted the
World Tuna Purse Seine Organization (WTPO) to adopt drastic measures in 2001 and again
in 2003 aimed at reducing fishing efforts or fishing duration to stabilise supply and prices. In
terms of value, the impact of the oversupply and price decline in 2000 was much more
significant (Figure 7).
Figure 7.
Fig. 7 World exports of processed tuna, value
1976-2005
3 500 000
Thailand Spain
3 000 000
2 500 000 Ecuador Others
US$1 000
2 000 000
1 500 000
1 000 000
500 000
1976
1978
1980
1982
1984
1986
1988
1990
1992
1994
1996
1998
2000
2002
2004
year
The value of export decreased significantly in 2000 and 2001 but has since recovered to
record high levels of US$ 2.7 billion in 2004 and US$3.1 billion in 2005.
12In the late 1970s, export of canned tuna started developing with Japan as the main exporter to
the United States’ market, followed by African countries, namely Côte d’Ivoire and Senegal
which supplied the European market, especially France.
Starting in 1981, new exporters entered the global market although Japan maintained its pole
export position. In 1985, Philippines matched the export capacity of Cote d’Ivoire and
Thailand became the first canned tuna exporter in the world. In 2003, the major canned tuna
exporters were Thailand, Ecuador, Spain, Philippines, Indonesia, Côte d’Ivoire, Seychelles,
Ghana and Mauritius. During the last few years production and export of canned tuna from
Côte d’Ivoire have been declining because of political instability in the country.
Data for Ecuador comprise export value of tuna loins. Also, significant increases in the
volumes of canned tuna export were reported for Germany and the Netherlands, but represent
probably re-export statistics of the EU intra regional trade.
3.2.2 Canned tuna import
The importing role of major tuna markets remained mostly unchanged over the last 25 years
despite the significant changes experienced by the main producers and exporters of canned
tuna. In 1976, the main importers of canned tuna were the United States, France, Germany,
Canada and the United Kingdom. In 2005, main importers of processed tuna are the United
States, the United Kingdom, France, Italy and Germany. Frozen tuna loins destined for
canning represent probably an important proportion of the import data of Italy, Spain, France
and the United States.
Over the period 1995-2005, EU import of canned tuna represented around 57 percent of the
world import (by volume) on average. Large retailers (supermarkets and hypermarkets) are
the main distribution centres of canned tuna. They are highly concentrated, especially in
Northern Europe. Some 10 large retailers control most of the distribution. Canned tuna is also
purchased by the catering sector, supplied mainly by the Philippines and Thailand in Northern
Europe and by Spanish, French and Italian producers in Southern Europe.
Canned skipjack tuna is appreciated in Northern Europe whereas canned yellowfin tuna is
appreciated in Southern European countries. However, yellowfin tuna products have been
successfully introduced into Germany and the UK and a fair amount of canned skipjack tuna
is distributed in Spain, France and Portugal.
13Figure 8.
Fig. 8 United States' imports of canned tuna,
1989-2006
250 000 600 000
quantity 500 000
200 000
value
400 000
150 000
US$1 000
tonnes
300 000
100 000
200 000
50 000
100 000
1989
1990
1991
1992
1993
1994
1995
1996
1997
1998
1999
2000
2001
2002
2003
2004
2005
2006
Import of canned tuna into the United States decreased during the period 1991- 1996, mainly
because of quality depreciation, before increasing again (Figure 8), the main exporters to the
United States being Thailand, The Philippines, Ecuador and Indonesia (Figure 9). Similarly to
the EU, US retailers distribute over 75 percent of canned tuna while the rest is absorbed by
the catering and restaurant sector. Seventy percent of the canned tuna is made mainly from
skipjack (light meat tuna) and 30 percent of the market is albacore (white meat tuna).
Figure 9.
Fig. 9 Main exporters of canned tuna into the United
States, quantity 1989-2006
250 000
Indonesia
200 000 Ecuador
Philippines
150 000 Thailand
tonnes
100 000
50 000
1989
1990
1991
1992
1993
1994
1995
1996
1997
1998
1999
2000
2001
2002
2003
2004
2005
2006
year
Distribution of tuna packed in flexible pouches has seen a major success in the United States
(Figure 10) mainly because of its convenience for the preparation of sandwiches and salads.
Thus, import volume of tuna in flexible pouches has more than doubled, going from 18,600
14tonnes in 2002 (valued at US$49 million), to 40,700 tonnes in 2003 (valued at US$132
million), Thailand and Ecuador being the main exporters of this type of products.
Figure 10.
Fig. 10 United States' imports of tuna in pouches,
1989-2006
45 000 180 000
40 000 160 000
35 000 140 000
30 000 120 000
US$1 000
25 000 100 000
tonnes
20 000 80 000
15 000 quantity 60 000
10 000 40 000
value
5 000 20 000
2002
2003
2004
2005
2006
Other major canned tuna importers are Japan (39,200 tonnes in 2005), Canada (34,700 tonnes
in 2005), Australia (33100 tonnes in 2005), Colombia with 18’,600 tonnes in 2005, Israel
with 12,200 tonnes in 2005, the Middle East (Egypt, Saudi Arabia and United Arab Emirates
with a yearly volume of import which varies from 6,000 to 31,000 tonnes depending on the
country) and North African countries (Libya, Algeria and Morocco), with a yearly import
volume which varies from 2,000 to 6,000 tonnes depending on the country in 2005). Canada
is mainly supplied from Thailand and the Philippines; Thailand is also the main supplier of
Japan and the Middle East. Italy has succeeded in securing a niche market share of high value
canned tuna in the Middle East.
3.3. Market access requirement
Over the years, the major import markets have developed comprehensive market access
requirements which can be classified into 3 main categories:
• tariffs and quotas,
• consumer protection requirements and
• environmental protection requirements.
These requirements have been established mainly by governments and government
institutions, although more and more access requirements and market-driven standards are
established by major importers and retailers.
3.3.1 Tariffs and Quotas
In general, tuna products are subject to import duties that increase as a function of the degree
of processing applied for the production of the finished products. Thus, fresh or frozen tuna
destined for further processing in the importing countries are generally not taxed, whereas
duties are applied to processed tuna, namely frozen tuna loins and canned tuna.
15However, exceptions to this general rule exist in the frame of preferential duty regimes that
are either unilateral (e.g. Generalised System of Preferences GSP) or reciprocal (e.g. bilateral
or regional free trade agreements). Unilateral duty concessions are generally designed to
assist in the economic development of the benefiting country whereas the reciprocal
concessions are negotiated between the parties to the Agreement.
The EU market: Three types of tariff systems are applied to canned tuna entering the EU:
• The Most Favoured Nation MFN (or erga omnes) applied to all countries members of
the World trade Organization WTO, The provisions of the MFN under Article I of the
WTO Agreement stipulate that “WTO members shall grant to each other’s products
treatment no less favourable than that accorded to the products of any one member”.
In other words, MFN tariffs are tariffs applied to countries without any form of trade
preference.
• the GSP and ACP (Africa, Caribbean and Pacific countries, under the Economic
Partnership Agreements, EPA) preferential systems and
• other preferential systems established under bilateral or regional agreements.
The most favourable tariff systems applied to tuna products, especially processed tuna,
entering the EU are the system applied to ACP countries under the EPAs and two types of
GSP Plus schemes. GSP Plus one is destined to promote sustainable development and good
governance. It is offered to countries which demonstrate desire and capacity for implementing
specific standards of human and labour rights, environmental protection, the fight against
drugs and good governance as per the requirements of Regulation 480/2005. The main
beneficiaries are from Latin America. GSP Plus two, also known as everything but arms
(EBA) is destined to the least developed among the developing countries. The tariff
concessions under each of these regimes are presented in table 3.
Table 6. Tariffs applied to tuna and tuna products entering the EU.
Duty rate percent
GSP
GSP GSP
Description Plus
MFN (General) Plus
two ACP/EPA
tariffs 2 As of one 3
(EBA) 4
1/1/20006 (1/7/05)
Whole frozen Yellowfin
0 0 0 0 0
tuna for canning
Whole frozen Skipjack tuna
0 0 0 0 0
for canning
Tuna fillets and loins for
24 20.5 0 0 0
industrial manufacture
Canned yellowfin/Skipjack
24 20.5 0 0 0
tuna in oil
Canned yellowfin/Skipjack
24 20.5 0 0 0
tuna (other products)
(source: ITEC 1).
1
ITEC: The integrated tariff of the European Community. 2 MFN tariffs are tariffs applied to countries
without any form of trade preferences. 3 This regime is destined to promote sustainable development
and Good Governance. The beneficiaries are mainly Latin American countries. 4 EBA: Everything but
arms for the benefice of the LDC (least developing countries).
16In addition, following a threat for legal action at the World Trade Organization in 2003, the
EU has revised import tariff quotas for canned tuna from certain countries allowing 25, 000
tonnes of imports at a duty rate of 12 percent in 2003 and 25, 570 tonnes at the same duty rate
as from 2004 onwards. The beneficiary countries are Thailand (52 percent of the quota), the
Philippines (32 percent of the quota), Indonesia (12 percent of the quota) and other nations
(one percent of the quota). Furthermore, the general tariff for frozen pre-cooked tuna loins
was lowered to 6 percent for a quota of 8,000 tonnes (2007), 9,000 (2008) and 10,000 (2009)
according to the provisions of EU regulation 824/2007.
Finally, special concessions are negotiated under bilateral free trade agreements (e.g. with
Chile or Mexico).
The United States: The harmonised tariff schedule of the United States has also special
provisions for GSP countries and other countries with bilateral (e.g. United States + Chile) or
regional trade agreements with the United States (e.g. Caribbean Basic Economic Recovery
Act CBERA, Andean Trade Promotion and Drug Eradication Act ATPDEA (which allows
for duty-free imports of tuna in pouch from the area), African Growth and Opportunity Act
AGOA.
In practice, tuna loins weighing more than 6.8 kg (yellowfin) are subject to a tariff of 1.1 cent
per kilo. The tariff is zero for SPG countries. Loins weighing less than 6.8 kg (skipjack) are
subject to a 6 percent tariff but the tariff is zero for SPG countries except Colombia.
Canned tuna in oil, including in flexible pouches are subject to 35 percent tariff except for the
least developed countries which benefit from a zero tariff. Other types of canned tuna (e.g.
tuna in brine) are subjected to a 6 percent for a quota equivalent to 4.8 percent of the canned
tuna consumed in the United States. Beyond this volume, tariffs are 12.5 percent. Least
developed countries benefit from a zero tariff for canned tuna in brine as well.
Japan: Japan has developed a general import duty system with specific derogations and
temporary regimes for specific products lower than the general regime. Likewise, Japan has
special provisions for GSP least developed countries, in addition to tariff concessions in
favour of Singapore as a result of the Japan-Singapore agreement for a new economic
partnership.
In practice, Japan charges 3.5 percent duty for fresh and frozen tuna, the general tariff system
(not applied) being 5 percent. GSP countries benefit from zero tariff applied to their exports
of fresh and frozen tuna to Japan. Canned tuna and fushi products are subjected to 9.6 percent
but GSP countries benefit from a lower tariff of 6.4 percent for canned skipjack and other
bonito species (Euthynnus spp.) and 7.2 percent for other canned tuna and fushi products.
Least Developed Countries are granted zero tariff for all canned tuna/skipjack/bonito and all
fushi products exported to Japan.
Thailand and Indonesia, main exporters to Japan, benefit from the GSP scheme.
3.3.2. Rules of origin
In order to ensure proper implementation of a preferential tariff system, the EU and the
United States developed rules to demonstrate that the tuna products under preferential
treatment come from the country entitled to benefit from the specific tariff concession.
In the EU, rules of origin for preferential tariff systems specify that the tuna should be caught
by the EU fleet or the beneficiary country fleet, and processed in the beneficiary country. A
traceability system is needed to provide evidence of the origin of the product and its
processing sites.
17For the United States, the country of origin is the country where the product has been
manufactured, produced or cultured. If processing in another country changes substantially
the denomination, the use or the characteristics of the original raw material, the country of
origin will be the country where the substantial changes have taken place. Evidence for a
substantial transformation is evaluated on a case by case situation. Also, the country of origin
can be the beneficiary country where direct costs of processing operations are > 35 percent of
the value of the product.
3.3.3. Environmental protection requirements
Over the last decades, global trade in fish and fishery products has developed in a setting of
increasing influence of civil society and consumer advocacy groups over the agenda of
governments, companies and international organizations on a wide array of issues relevant to
food production and distribution systems.
Increasingly demanding consumers expect not only safe and quality food but also a
transparent and informative trail that can be used to trace the origin of the food, its quality, as
well as the environmental and/or social conditions that prevailed during its production,
processing and distribution.
As the last link in the supply chain between producers and consumers, retailers have seen
their responsibility towards consumers’ increase, resulting in a greater need for controlling
regulatory and consumer demands to prevent any risk of damage to their reputation.
Consequently, retailers have increasingly translated these demands back through the supply
chain to producers and processors by developing process and product standards and
certification schemes.
Eco-labelling aims at using market based tools to promote conservation measures and the
sustainable use of natural resources. In the past decade, significant resources have been
devoted worldwide by the seafood industry to promote the purchase of seafood only from
sustainable sources and several production and processing companies and retailers have built
comprehensive food sourcing campaigns around sustainable and environmentally friendly
seafood initiatives. These initiatives aim to tap into a growing consumer demand for
environmentally preferable products, channeling purchasing power towards seafood products
from fisheries that are managed in a sustainable manner and/or aquaculture activities and or
apply conservation measures. By appealing to consumer preferences, the eco-labelled
products may generate higher returns than those that either do not qualify for eco-labelling or
those whose producers do not seek to obtain such labelling.
Consequently, a number of eco-labelling initiatives have been introduced in the fisheries
sector as market-based incentives to improve fisheries management systems and conservation
measures. Eco-labels are certifications given to products that are deemed to have a lower
negative impact on the environment than other similar products. Already several national,
international, industry-sponsored, NGO-led and consumer-supplier partnership certification
and standards schemes in the fisheries sector exist –each with distinct criteria and assessment
methods that have variable levels of transparency.
Tuna fisheries have been among the first fisheries confronted to eco-labelling. The US
Marine Mammal Protection Act (MMPA), largely motivated by the high dolphin mortality
rate in tuna purse-seine operations, established standards for marine mammal conservation
and protection for the US tuna purse seine fishing fleet. In 1988, this Act was amended to
include new regulations concerning US embargoes on yellowfin tuna and yellowfin tuna
products from countries that do not have marine mammal protection regulations comparable
to US regulations or whose dolphin mortality rates do not meet the US standards. Current
18embargoes exist for Belize, Bolivia, Colombia, Guatemala, Honduras, Nicaragua, Panama,
Vanuatu, Venezuela and Peru.
In 1990, the US enacted the “Dolphin Protection and Consumer information Act (DPCIA)”,
which established standards for the use of “dolphin safe” labels on yellowfin tuna products
that are exported from or offered for sale in the United States. Under the DPCIA, “dolphin
safe” means that no purse-seine net was intentionally deployed on or used to encircle dolphins
during the particular voyage on which the tuna were caught and no dolphins were killed or
seriously injured. This applies only to tuna caught by purse-seine nets in the Eastern tropical
Pacific Ocean.
This issue was the subject of disputes introduced by Mexico and the EU in the 1990s with
GATT. The dispute settlement group of GATT ruled in favour of Mexico and EU although it
also ruled that labelling tuna products as “dolphin safe” and letting consumers decide whether
or not to buy them, was not against GATT rules.
Since then, Mexico and the United States have settled the issue by adopting, along with 13
other countries, the Agreement on the International Dolphin Conservation Program (AIDCP)
under the framework of the Inter American Tropical Tuna Convention (IATTC). This
programme comprises commitment by master fishermen to implement the provisions of the
programme, the presence of observers on fishing vessels, the supply of regular information by
fishing vessels and the use of certification systems.
In parallel, the environmental NGO Earth Island Institute (EII) had developed its own
certification system which has been adopted by several canneries to access the American
market. The EII has challenged the definition change of “dolphin safe” under AIDCP and was
supported by a ruling of the San Francisco federal court. The embargo on yellowfin tuna
imports from Mexico was lifted in 2000. Mexico may export tuna into the United States but
any tuna product accompanied by a label suggesting it is “dolphin safe” must comply with the
standards established under the DPCIA.
As a party to IATTC, the EU has adopted a “tuna tracking system” and a regulatory
framework requiring tuna caught in the East Pacific Ocean to be accompanied by a catch
documentation indicating the risk (or not) incurred by dolphins during tuna capture. Adhering
to the EU dolphin safe scheme is voluntary and users can adopt either the EII or AIDCP
definition of dolphin safe.
3.3.4 Consumer protection requirements
Low acid canned foods (ph ≤ 4.6), which include canned tuna, have had an excellent record
of consumer safety. However, outbreaks of food poisoning involving canned fish made unsafe
because of inadequate handling during raw material storage, landing, processing or
distribution, although very rare, can result in severe health problems, especially in the case of
a botulism outbreak. Business-wise, it can damage the reputation of a company or undermine
a whole industry. For example, a 1982 outbreak of botulism that caused the death of one
person in Belgium who consumed canned salmon led to the examination of the entire 1980
and 1981 production records of the Alaskan salmon canning industry and a series of recalls
involving over 50 million cans of salmon worldwide.
Earlier outbreaks of botulism incriminating low acid canned foods in the 1960s led food
control authorities and the food canning industry in the United States in the early 1970s to
embrace safety and quality approaches embodied in the Code for Good Manufacturing
Practices (GMP) and in the HACCP principles. Likewise, International Organizations, under
the aegis of the FAO/World Health Organization (WHO) Codex Alimentarius Commission
19(CAC), and national food control authorities have enacted regulations that require mandatory
application of these approaches which stipulate that:
• canned food products should be prepared/processed in certified plants. The certification
process requires that the plant meets minimal requirements in terms of layout, design and
construction, equipment, personnel hygiene and qualifications and plant sanitation
• canning companies are responsible for developing and implementing a HACCP-based
safety and quality assurance program
• national food control authorities are responsible for certifying canneries, approving and
monitoring in-plant HACCP-based programs and product certification.
The major canned tuna importers have developed comprehensive strategies and working
procedures to implement these approaches, using the Codex Codes of practice and canned
tuna standards as a basis.
3.3.4.1 Institutional and regulatory frameworks
In the United States, the United States Food and Drug Administration (FDA) adopted the
Better Process Control Plan (BPCP) of 1971. The plan, a GMP regulation (21 Code of
Federal Regulations, CFR Part 108 titled Emergency Permit Control and Part 113 titled
Thermally processed low acid foods packaged in hermetically sealed containers became
effective in January 1973. A few years later, safety concerns regarding the hazard of botulism
in heat-sensitive low-acid foods that are acidified to permit less severe thermal processing
requirements led the FDA Commissioner to add a separate GMP regulation (Part 114 for
acidified foods) which became effective in May 1979.
The United States’ BPC plan places the responsibility for the production of safe canned food
on the food industry. The plan requires that operators of thermal processing retorts and
seaming machinery work under the supervision of a person who has attended and completed a
prescribed course of instruction at a school approved by the FDA commissioner (The Better
Process Control School BPCS). BPC schools represent a co-operative venture between
universities, FDA and industry. In the 1990s, the FDA Commissioner authorised the holding
of BPC schools in foreign countries in Africa, Latin America and South East Asia. In parallel,
the canning industry, through its professional associations in Europe and America conducts
research to establish reliable heat processes and container closure evaluation schemes and
advise the industry regarding technological developments and their quality and safety
implications.
The legal framework for HACCP implementation in tuna canneries is provided by the
Federally Mandated Seafood Rule (21 CFR 123: Procedures for the safe and sanitary
processing and importing of fish and fishery products, Final Rule, Federal Register 1995),
which entered into force in December 1997. The Rule requires importers from the United
States to ensure that foreign producers meet these requirements and have documentation and
evidence for FDA inspectors to demonstrate that the requirements have been met.
In addition, the 2003 FDA Interim Final Regulation (21 CFR Parts 1 and 20) was
promulgated under the 2002 Public Health Security and Bio-terrorism Preparedness and
Response Act. This regulation requires that domestic and foreign facilities that
manufacture/process, pack or hold food for human or animal consumption in the United
States’ register with FDA and submit electronically prior notice to FDA, at least 8 hours
before the shipment is due to arrive into the United States.
At the United States’ border, FDA examines food offered for entry into the United States
through United States Customs, either prior to entry or after secured delivery to
20importers/brokers. Importers, or their representatives, are required to file a notice with the
customs to gain entry of each shipment of goods. Importers are also requested to provide to
FDA, copies of customs entry documents, together with an invoice of the items in each entry.
Recent electronic filing advancements are simplifying this procedure. Customs notifies FDA
of notices received for all FDA regulated products. FDA decides which entries need to be
examined and samples are collected accordingly. All imported seafood is required to meet the
same standards as domestic goods. Products which appear to be adulterated, misbranded, or
manufactured/processed/packed under unsanitary conditions are refused admission.
FDA is authorised to take food samples for examination and investigation purposes. Each
year, the Programme offices of FDA and the Office of Seafood at the Centre for Food Safety
and Applied Nutrition (CFSAN) prepare Compliance Programmes that direct the field
inspection and surveillance activities. The Programme describes the product areas to
emphasise, the types of product to target, the make-up of samples, the types of analyses to
conduct on specific products, the analytical methods to be used, and the regulatory parameters
to determine compliance. If during the course of the year, concerns about specific products
arise, assignments are written to address inspection and/or sampling to investigate the
particular concerns. FDA checks the standard of identity of canned tuna, labelling (including
nutritional labelling), and economic deception such as short weights or specie substitution.
The EU: Since the mid 1990s, canned tuna import into the EU has been authorised only from
third countries which have a competent control authority that has been certified by the
European Commission. The EU delegates the control of food safety to the competent
authority of the exporting country, which in turn ensures that processing and exporting
companies are producing safe food under a system equivalent to that the EU’s.
When the laws of a third country are harmonised with the EU legislation, and systems to
monitor and control food (fish) processing establishments and vessels are deemed equivalent,
the exporting country is approved for export to the EU. Individual companies are checked by
the competent authority and, if deemed appropriate, are listed as approved in a national
register, with a certification number. This register is then passed to the European Commission
which makes the information public via its website and other public documents. These are the
so-called List I countries. Other countries that are in the process of gaining approval but are
deemed to produce safe foods are included in List II. Shipments from List II countries are,
however, subject to 100 percent border checks.
Unfortunately for processors, these are the only routes by which processors can export to the
EU. Even if a processing establishment is meeting international standards of safety and
quality, it can only export if the country where it operates is recognised and certified by the
EU on List I or List II. This has caused problems for qualified processors in several countries
who then have to wait for the government to complete the process of recognition by the EU.
During recent years, the EU has completed a recast of the legislation governing food hygiene
and laying down specific hygiene rules for food of animal origin.
The scope of EC Regulation 178/2002 is very broad; it establishes the general principles and
requirements of food law, lays down procedures on matters of food safety, and establishes the
structure and role of the European Food Safety Authority (EFSA). It also covers the basic
concepts of equivalence and traceability.
The new EU food legislation gives producers primary responsibility for the safety of food
through self-checking and hazard control techniques. It integrates 17 existing specific
directives into a new “Food Hygiene Package” of 4 regulations. Within the Package,
regulation EC/853/2004, lays down the food hygiene requirements for products of animal
origin, including HACCP systems and procedures.
21You can also read