The Donegal Local Economic & Community Plan 2016-2022 - Appendix 1 The Profile of the County
←
→
Page content transcription
If your browser does not render page correctly, please read the page content below

The Donegal Local Economic &
 Community Plan 2016-2022

            Appendix 1
      The Profile of the County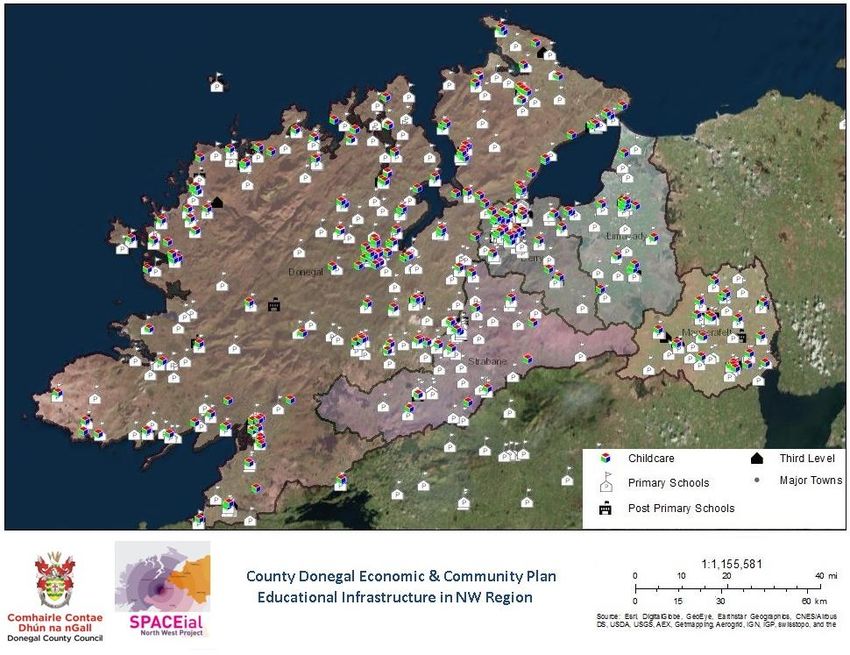
1

                                    Table of Contents

Chapter 1     Donegal, A Unique Place & Connected Place
1.0   Defining Donegal - The Gateway, The Islands, The Gaeltacht

1.1   Donegal’s Functional Area /Cross Border Context

1.2   Accessing Services in the Donegal Context
      1.2.1 Settlement Patterns
      1.2.2 Connecting Donegal Physically & Digitally

1.3   The Strategic Transport network
      1.3.1 Transport Infrastructure
      1.3.2 Modes of Transport

1.4   Area Needs Analysis: Sustainable Digital and Physical Connections

Chapter 2     Repowering Our Towns
2.0   Spatial Trends

2.1   Urban Vitality
      2.1.1 Population Trends
      2.1.2 Vacancy and Dereliction
      2.1.3 Population Targets

2.2   The People of the Towns
      2.2.1 Demographics
      2.2.2 Employment and Economic Activity
      2.2.3 Education Training and Skills

2.3   Area Needs Analysis: Driving Economic Recovery Through Towns

Chapter 3 Delivering Socially Inclusive Services
3.0   Examining Deprivation in Donegal

3.1   Hard to Reach Communities
      3.1.1 Rural Dwellers
      3.1.2 Gaeltacht communities
      3.1.3 Coastal & Island Communities

3.2   Vulnerable Rural Groups
      3.2.1 Youth
      3.2.2 Elderly

3.3   Sustainable Community Services
      3.3.1 Community Centres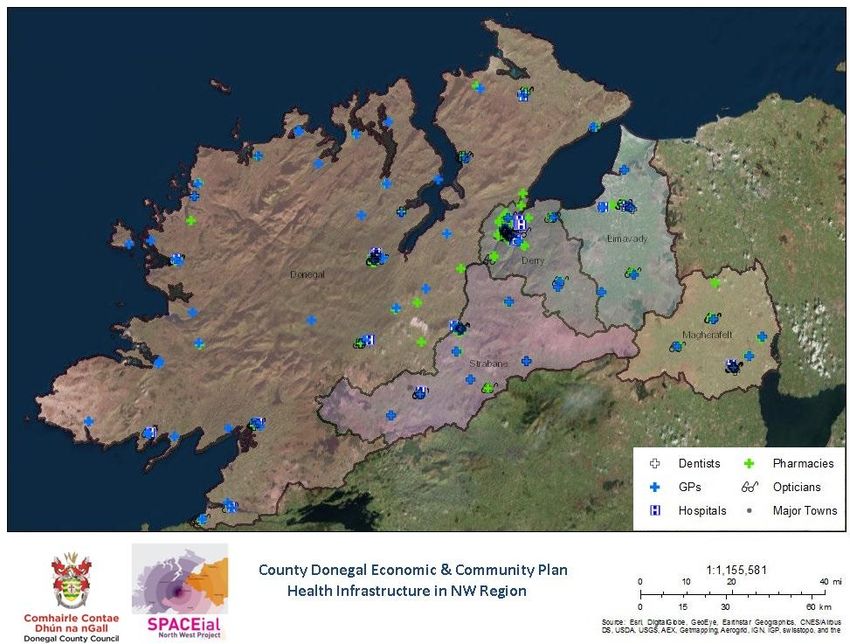
2

      3.3.2   Education & Learning

3.4   Sustainable Homes
      3.4.1 Housing Age
      3.4.2 Housing Ownership
      3.4.3 Household Composition
      3.4.4 Essential Housing Services

3.5   Sustainable Employment Creation
      3.5.1 Employment Opportunities
      3.5.2 Employment Trends

3.6   Skills and Human Resource Development
      3.6.1 Educational Infrastructure
      3.6.2 Education Attainment Levels

3.7   Area Needs Analysis: Increasing Social Inclusivity & Sustainability in Rural Communities

Chapter 4 Protecting and Harnessing Our Rural Environment
4.0   A Wild and Varied Biosphere

4.1   Environmental Assets
       4.1.1   Natura Sites
       4.1.2   Natural Heritage Areas and Other Wildlife Reserves
       4.1.3   Geology & Landscape

4.2   Our Water Resource
       4.2.1    Waterbody Quality
       4.2.2    Supply of Drinking Water
       4.2.3    Quality of Drinking Water
       4.2.4    Water Usage & Unaccounted for Water
       4.2.5    Wastewater Network

4.3   Renewable Energy Resources
      Wind, Wave, Biomass & Bio-Crops, Fossil Fuel

4.4   Area Needs Analysis: Protecting and Harnessing our Natural Heritage and Water Resources

Chapter 5     Donegal’s Primary Sectors
5.0   Developing a Vibrant Local Food Economy

5.1   A Picture of Agriculture in Donegal
      5.1.1 Agricultural Trends
      5.1.2 Agricultural Produce & Markets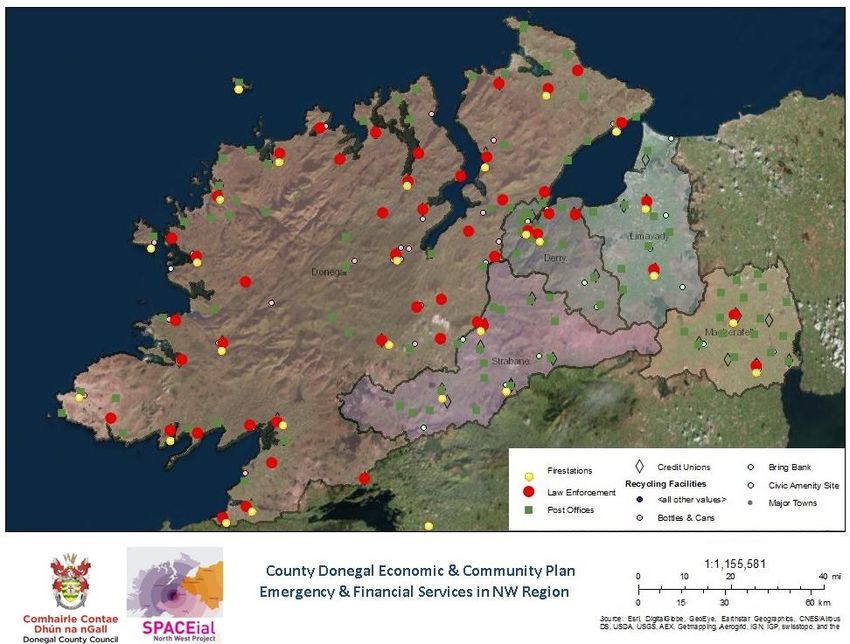
3

5.2    Forestry
       5.2.1 Forestry Ownership
       5.2.2 Species Composition
       5.2.3 Forestry Planting
       5.2.4 Forestry Owner Groups

5.3    Seafood Sector
       5.3.1 Fishing Ports
       5.3.2 Fish Farming
       5.3.3 Sea Fish Processing
       5.3.4 Marketing
       5.3.5 Donegal Fishing Communities
       5.3.6 Research, Development & Training in the Marine Sector

5.4    Area Needs Analysis: Developing the Primary Sectors in Donegal

5.5    Economic Activity

Chapter 6 Unlocking or Cultural Resource

6.0    Our Unique Cultural Offering

6.1    Cultural Infrastructure

6.2    Visual Arts

6.3    Performing Arts

6.4    Traditional Arts

6.5    Our Diaspora

6.6    Festivals

6.7    Film

6.8    Language
       6.8.1 The Age Composition of Irish Speakers
       6.8.2 Irish Speaking in Donegal
       6.8.3 Gaeltacht Service Towns
       6.8.4 New Languages

6.9    The Creative Sector

6.10   Material Heritage

6.11   A Rich Built Heritage
       6.11.1 Architecture
       6.11.2 Archaeology and Underwater Archaeology

6.12   Area Needs Analysis: Conservation through Access & Promotion
4

Chapter 7    Capitalising on Our Rural Tourism Advantage

7.0   Rising Tourism Numbers

7.1   Our Rural Tourism Assets
      7.1.1 Adventure & Activity Tourism
      7.1.2 Food Tourism
      7.1.3 Cultural Tourism

7.2   Tourism Infrastructure & Accommodation
      7.2.1 Essential Tourism Infrastructure
      7.2.2 Accommodation

7.3   Area Needs Analysis: Building on Our Strong Tourism Base
5

Chapter 1: Donegal, A Unique & Connected Place

1.0        Defining Donegal

To appreciate Donegal’s present socio economic picture, it is important to understand its
evolution and a good starting point is by understanding its geography. County Donegal is
located in the Border Region and is bounded on the southwest, west and north by the
Atlantic Ocean1 and on the east by counties Derry, Tyrone, Fermanagh and Leitrim. County
Donegal shares 93% of its entire land boundary with Northern Ireland and the remaining 7%
(or 9km stretch) is with County Leitrim at its most southerly point. County Donegal is the
fourth largest County in the State with a land mass of 4,861 sq kms or 6.9% of the total land
area of the State. The landscape is varied and dramatic, comprising of mountains, valleys,
and fertile plains with a deeply indented coastline forming natural sea loughs, bays,
peninsulas and many islands both inhabited and uninhabited.

Donegal is the most northerly county in Ireland. Despite improvements and investment in
transportation and communications in recent decades, this corner of Ireland has managed
to retain much of its rich and unique cultural identity. How we speak, how we celebrate our
traditions, how communities have carved out an existence in some of the most remote and
inhospitable locations in Europe are all features of life in Donegal which are as relevant
today as they were centuries ago. How we have defended our lands in the past, how we
have influenced and have been influenced by new immigrants, such as Planters, the Celts,
the coming of Christianity and how invaders such as the Vikings and the Normans have
shaped our place and our way of life, how our coastal waters were used as important
shipping routes, how we farmed, fished and travelled, have all left us with a unique legacy
upon which we must build a socially, economically and environmentally sustainable
community.

The Gateway
Letterkenny and Derry was designated as a joint Gateway in the National Spatial Strategy in
2002. Letterkenny is the largest urban centre in Donegal with a population of 19,588
having grown by 28% from 2002-2011. It is the 22nd largest town in the State (out of a total
197 towns, CSO 2011) and is projected to grow to 23,000 by 2016 and 25,700 by 2022. The
population of the Letterkenny Derry joint Gateway has increased from 105,894 to 113,099
persons from the period 2001/2002 to 2008/20112. The Gateway region is evidenced as
geographically larger than the settlements of Letterkenny and Derry, with distinct impacts
and opportunities for economic collaboration along the border including opportunities
flowing from the A5 /N14/ N15 interconnectivity at Lifford- Strabane.

1
    Giving it the largest mainland coastline in the country @ 1,134km
2
    This includes the wider Derry Urban Area of Culmore, Strathfoyle and Newbuildings
6

Figure 1: Donegal as a Connected Place

The Border area
Donegal has a significant cross border dimension with 84% of its border adjoining Derry City
& Strabane District Council and Fermanagh & Omagh District Council and 16% adjoining
County Leitrim. The border area has developed as a unique region within the North West
and evidences many unique challenges and opportunities for both economic collaboration
and community development and this will be further enhanced through the improved
interconnectivity at Lifford- Strabane as a result of the A5/N14/N15 link providing significant
potential for further economic, social and cultural development at this gateway location.
The unique border region has particular characteristics as regards trade, currency
fluctuation, shared history, culture and heritage as well as the shared legacy and impact of
the troubles. It is also distinctive in terms of its role in providing the backbone of strategic
roads infrastructure to the County. Through the collaborative work of the Local Authorities
in the region, significant partnerships, such as the North West Partnership Board, have been
established in recognition of the cross border dynamic and in order to promote a
coordinated approach with regard to economic, social and cultural development on a cross
border basis.

The Islands
Donegal has 13 inhabited islands with a population of 796 persons in 2011. The islands of
Donegal are a huge natural resource, with rich levels of biodiversity offering huge potential
for eco tourism and other niche types of development

All of the above distinctive features have played a very important role in influencing the
economic, social, cultural and political landscape of today’s Donegal. This is an important

7

first step in profiling the strengths, weaknesses, opportunities and threats facing the county
and in the development of a Local Development Strategy that recognises this historical and
geographical context.

The Gaeltacht
In Donegal, the Irish Language is a living language where 69% of the total population regards
themselves as Irish Speakers. The Donegal Gaeltacht has a population of 24,744 and
represents 24.5% of the total Gaeltacht population in the State3; In addition, the Donegal
Gaeltacht encompasses a geographical area of 1,502km². This represents 26% of total
Gaeltacht land area.

3
    Census 2011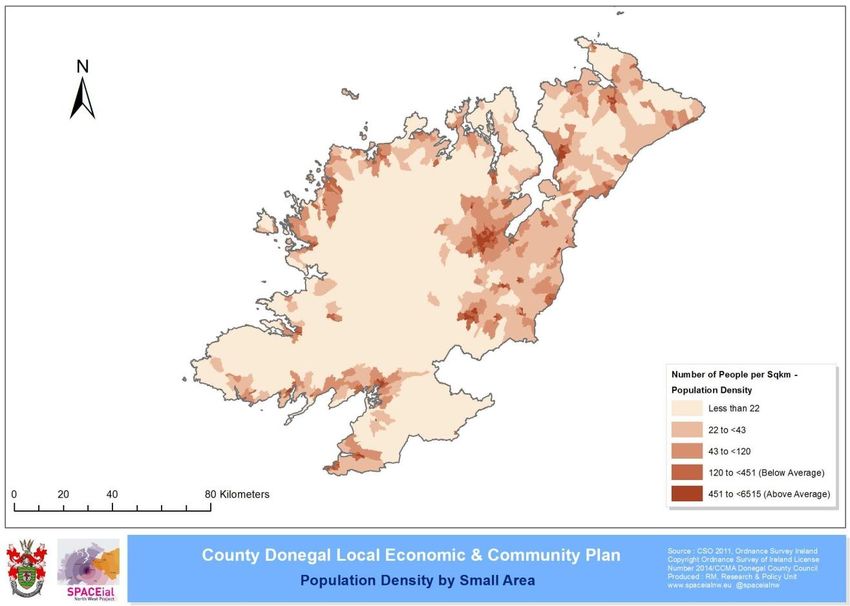
8

1.1    Donegal’s Functional /Cross Border Area

As referenced in the previous section, the border area is a unique area. Its people, living on
both sides of the border, predominantly access services and facilities across both
jurisdictions and as a consequence may need to negotiate any barriers that arise directly or
indirectly as a consequence of these administrative boundaries. Numerous linkages already
exist in terms of accessing education, health, policing; fire services, work and retail, etc.
These distinctive cross border relationships have developed a number of particularly strong
geographical linkages such as at Lifford- Strabane, Letterkenny- Bridgend- Derry, Muff -
Derry and Pettigo- Tullyhommon. Change in one jurisdiction can therefore also have a
significant impact on the other jurisdiction. Such cross border linkages must be taking into
account when developing any strategy to enhance rural development, reduce poverty and
tackle social exclusion.

Figure 2: Educational Infrastructure in the NW Region
9

Figure 3: Health Infrastructure in the NW Region

Figure 4: Emergency and Financial Services in the NW Region
10

1.2    Accessing Services in the Donegal context

1.2.1 Settlement Patterns
County Donegal is the fifth most rurally dispersed county in Ireland with 33.8 persons per sq
km compared to a State average of 67 persons per sq km (See Table 1, Appendix 1). The
county has a predominantly weak urban structure with a large number of small towns, with
just 9 settlements falling into the aggregate urban area category of over 1,500 inhabitants.

Figure 5: Population Density by Small Area

The above map, illustrates the population density within County Donegal, with darker
shading reflecting denser areas. The density pattern reflects the east/west settlement size
divide within the County, with the majority of the larger and medium size towns located to
the north east with the smaller towns to the south west. Similarly, an examination of
population change in the county over the period 2006 -2011, illustrates that above average
growth has taken place along the Eastern Access and around the linked Gateway Area.

Donegal had a population of 161,137 persons in 2011, which is broken down into the 5
Municipal Districts (MD’s). The population is almost evenly distributed between
Letterkenny MD (41,697 persons or 25.9%) and Inishowen (MD 41,127 persons or 25.5%).
In addition, the population share is similar between Donegal MD (26,863 persons or 16.7%)
and Stranorlar MD (26,133 or 16.2%) while 15.7% reside in the Glenties MD (25,317
persons). Letterkenny, Inishowen and Stranorlar all have higher levels of their population
11

falling under 30 years of age at 44%, 43% and 42%, while Glenties and Donegal have higher
percentages of their populations over 65 years at 19% and 15% respectively.

Figure 6: Total Population by Municipal District 2011

                               Total Population, 2011
   45000
                                                                         Letterkenny
   40000                                                                 Inishowen
                                                                         Donegal
   35000                                                                 Stranorlar
   30000                                                                 Glenties

   25000
   20000
    15000
   10000
    5000
        0
             Letterkenny     Inishowen        Donegal       Stranorlar       Glenties

1.2.2 Connecting Communities Physically and Digitally
Given the County’s size, its weak urban structure and low population density, accessing and
providing services can be difficult. It is important that strategies take into account these
challenges in developing efficient, sustainable and economically viable services. At the same
time, it is important to examine creative and innovative methods to sustain rural services in
Donegal.

Connecting people to services can be done either physically or digitally, which requires the
delivery of essential infrastructures such as a quality road network, bridges, bus services,
high speed broadband, etc.
County Donegal is totally dependent on a road based transport system reflecting the small
internal market and the dispersed settlement patterns. The road network is the artery for
the Region’s economy with 100% of goods and people being transported by road and road
freight, therefore accessibility costs are among the highest in Western Europe.
Opportunities exist to increase connectivity through improving access to transport and
communications infrastructure.

In addition, the functionality of digital technologies provides an opportunity to counteract
this, such as access to online shopping, online public services, research, e-learning,
connecting with friends and families, etc. In order for online services to be accessible to all,
a primary consideration is the availability of physical access (broadband connection, laptop
etc) however, of equal importance is the individuals ‘know-how’ to have the competence to
access it. The map below illustrates a generally higher uptake of broadband along the
eastern axis of the County and linked Gateway, notably areas with higher concentrations of
12 populations under 15 years, while the western axis of the County has lower a lower uptake and a notably higher concentration of population over 65 years. This tends to illustrate the emergence of a digital divide between the uptake of broadband among younger and older segments of the population but also in a geographical context and between urban and rural areas within the county. Figure 7: Accessibility to Broadband 1.3 The Strategic Transport Network Ireland’s economic growth depends on the ability of businesses to trade successfully in increasingly competitive global markets. The availability of competitively priced world-class infrastructure (e.g.; energy, telecom; transport – road, public transport, airport, seaports; waste and water) and related services is critical to support competitiveness. The availability of high quality industrial and commercial property and the upgrading of our key urban centres to make them attractive places to live and work are also vital to support economic growth and job creation.4 Significant investment has been made in infrastructure particularly in the road network over the last decade. In September 2015, The Department of Public Expenditure and Reform (DPER) published ‘Building on Recovery- Infrastructure and Capital Investment Programme 2016- 2022’ setting out Irelands investment programme that will increase the State’s 4 Department of Jobs, Enterprise and Innovation, Policy Statement on Foreign Direct Investment in Ireland, July 2014
13
infrastructure, support economic recovery and jobs, support sustainable communities
throughout Ireland and provide modern, fit for purpose buildings for the delivery of
services. In relation to the strategic transport network in the North West region, the
programme reaffirms the Governments support for the commitment under the St Andrews
Agreement to co- fund the construction of the A5 route. The Programme also identifies
future investment in the maintenance and strengthening of the existing network of roads in
the country including the N56 Dungloe to Glenties and N56 Mountcharles to Inver routes. It
is important that Donegal and the North West region can deliver on the strategic
infrastructural investment required to ensure the economic sustainability and
competitiveness of the Derry Letterkenny Gateway.
A high quality transport network is crucial to sustaining growth across all areas of social,
environmental and economic development. The Donegal Transportation Strategy
recognises the fundamental importance of protecting, promoting and improving the
network in attracting investment, developing the tourism industry, addressing climate
change and in creating sustainable places and communities.
1.3.1 Transport Infrastructure
Donegal’s strategic transport network comprises of Ports, Airports and Strategic Road
Networks and key to this is its ability to connect with other national and international hubs
and gateways.
Air & Ports
Donegal Airport and City of Derry Airport are of key strategic importance in the provision of
international, national and regional access to/from County Donegal. Plans and policies must
support, promote and facilitate the development of this key infrastructure.
Road Network
Donegal has a predominantly road based transport network, this is accentuated by limited
availability/feasibility of alternative modes, the absence of rail infrastructure and by high
levels of car ownership and car dependence in the County.
The Strategic Road Network as established in the Donegal County Development Plan 2012-
2018 flows from and facilitates the Donegal Core Strategy, in that, it was developed to
Promote the Letterkenny Derry Gateway and linkages with other National and
International Gateways including; Dublin, Belfast, Sligo, as well as access to and
through strategic ports and airports.
Support the National Road Network, through promotion, development and
protection policies
Establish and improve strategic intra-county linkages between the Letterkenny Derry
Gateway and Tier 2 and Tier 3 settlements to promote and improve efficient
movement of persons and goods within and into the County to encourage
investment, to grow tourism, to support agriculture and other indigenous enterprise.14
Bus Service, Taxis and Hackneys
Bus and taxi services play a vital social role in rural communities, linking rural areas with
settlements and essential services such as schools and healthcare. There are various types
of bus and taxi transport serving the County:
Bus Éireann expressway provides long-distance services, linking Donegal with Derry,
Dublin, Sligo and Galway.
Bus Éireann/Ulster Bus and private transport operators provide local commuter
routes and services throughout the County.
School bus services operated on behalf of the Department of Education and Science.
Private coach and mini-bus services to Derry, Belfast, Galway, Dublin and Glasgow.
Community bus routes operated under the Rural Transport Initiative (RTI).
Private taxi services.
Publicly funded taxi services, such as those operated under Health Service Executive
(HSE).
Rural hackneys are a vital element of the rural transport network. They provide
transport services across rural communities particularly for those who do not have
access to a motor car and those in more remote areas where bus services are
limited or unavailable.
However, there are notable gaps in rural transport particularly in out of hours provision.
1.3.2 Modes of Transport
Of the 57,721 private households with the County, 45% (25,874) have one motor car, 32 %
(18,569) have two cars, 5.4 % (3,132) have three cars and 1.8% (1,035) have four or more
cars. 15.8% or 9,111 households in County Donegal did not have access to a motor car,
according to the Census 2011. In relative terms , Donegal ranked in 11 th position in terms
of all local authorities that did not have access to a motor car in 2011, compared to 10th
highest position in 2006. (See Table 2; Appendix 1)
The Census, 2011 illustrates a substantial increase from 2006 in those travelling to work,
school or college by car in County Donegal. (See Table 3(a, b, c &d); Appendix 1)
Travelling to Work
The percentages travelling to work by ‘Bus, Mini Bus or Coach’ have decreased from 1.8% in
2006 to 1.2% in 2011 in County Donegal. The comparable figure for the State in 2011 was
5.2%. Travel to work in Donegal using them more environmentally friendly methods or ‘By
Foot’ (6.7%) or ‘By Bicycle’ (0.4%) has decreased since 2006 where the figures were 8.4%
and 0.4% respectively. In addition, the comparable figures for the State in 2011 were 9.6%
(By Foot) and 2.2% (By Bicycle)
Travelling to School
In 2011, 59.9% of children aged between 5 and 12 years travel to school as a ‘Motor car
passenger’ compared to 51.7% in 2006. The increase in car usage was accompanied by a
drop in travel by ‘Bus, Mini Bus or Coach’ from 32.3% in 2006 to 27.7% in 2011. There was
also a decrease in travel to school by ‘Foot or Bicycle’ dropping from 12.8% in 2006 to 10.3%
in 2011. In 2011, 39.4% of children aged 13 – 18 years of age travel to school by ‘Motor
Car’ increasing substantially from 2006 where the corresponding figure was 29.4%. In 2011,15 47.6% of students aged between 13 – 18 years travelled by ‘Bus, Mini Bus or Coach’; compared to 54.4% in 2006. Travelling to College There was also a drop in students aged 13 – 18 years using environmental modes of transport to school with 11.5% travelling ‘On Foot ‘or ‘By Bicycle’ in 2011 compared to 14.2% in 2006. 50.4% of students at school or college aged 19 years and over travelled by motor car in 2011 compared to 43% in 2006. Those travelling ‘By Foot’ or ‘By Bicycle’ decreased from 27.7% in 2006 to 25.8 % in 2011. (See Tables 3(a) – (c); Appendix 1). There is a significant shift away from sustainable modes of travel such as bus, cycling and walking to car based travel which needs to be addressed from an environmental and social inclusion perspective. Reasons for this change need to be identified in order to reverse this trend. 1.4 Area Needs Analysis: Sustainable Digital and Physical Connections The unique physical characteristics and colourful history of County Donegal have shaped the economic, social, cultural and political context of the present day. Increased digital and physical connectivity are required within the County to overcome the challenges of accessing services given Donegal’s geographical context; for example its peripherality, size, rugged landscape, weak settlement structure, island life and an extensive Gaeltacht area. To offset the digital divide that is emerging in the Donegal context will require focused and innovative solutions by supporting initiatives that seek to build up the digital capacity of rural communities to be able to shop, communicate, pay bills, etc. online. Key aspects should focus around up skilling and knowledge transfer within the community, based around existing digital schools, Taobh Tíre centres in libraries, digital hubs in community centres, etc. Furthermore it is necessary to examine creative and innovative proposals that increase the online presence of rural enterprises including the functionality to process online transactions. To physically connect our rural populations, it is necessary to support and facilitate proposals that provide innovative transport solutions in rural, disadvantaged and border areas such as rural park and ride schemes, rural carpooling and car sharing schemes, and bus and taxi schemes in consultation with public, private and community organisations. In addition it is necessary to support initiatives that offset gaps in existing transport provisions especially at off-peak hours and on non-viable routes. Strong service towns which provide a high level of wide-ranging services is a key element in building a critical mass of consumers which in turn makes the delivery of more frequent and higher quality transportation services to and from such towns increasing viable. Easily accessible streets and spaces make our towns more attractive place to live, work, visit and do business. By maintaining, creating and promoting high quality routes within and around our towns and villages, it can be as easy and attractive to walk and cycle as it is to travel by car. Projects and initiatives including small scale environmental improvements and works to public spaces should therefore have regard to how such proposals could improve the existing movement network by making them walk and cycle friendly, etc
16

When accessing a wide range of services in Donegal on the basis of the County’s functional
area and its geographical boundaries, it is necessary to examine strategies on an all island
basis in developing physical and digital connections whilst working within well established
cross border structures and partnerships.
17
Chapter 2: Repowering Our Towns
2.0 Spatial Trends
Donegal is often described as a rural county; however, after Cork it has more towns and
villages5 than any county in Ireland. These 61 settlements range in size from just over 100
inhabitants to almost 20,000 persons and are vital in sustaining economic and social vitality
and growth in the County. They provide a wide range of services and employment functions
which both drive and are supported by their rural hinterlands. The towns have the potential
to play a crucial role in regenerating economically stagnant areas of the County. Such
physical regeneration will have far reaching cumulative benefits to not only the town
catchments but to whole areas of the County.
Table 1 (Appendix 2); examines population distribution and growth in the County across 6
settlement sizes6. Broadly speaking the demographic nature of the County is defined by a
number of distinct characteristics:
54% of the population live in the open countryside
12% of the population live in the Letterkenny Gateway
34% of the population live in 60 relatively small geographically dispersed settlements
2.1 Urban Vitality
2.1.1 Population Trends
46% of Donegal’s total population (or 73,466 persons) live in the 61 settlements scattered
throughout the county while 54% (or 87,671 persons) live in the rural areas. Of the 61 towns
there are 19 in the Inishowen Municipality,i 14 in Glenties Municipality, 12 in Donegal
Municipality; 8 in Letterkenny Municipality and 8 in Stranorlar Municipality.
5
Census of Population, 2011
6
Established by the Regional Planning Guidelines for the Border Region 2010-202218
Overall, the 19 towns located in the Inishowen Municipality experienced positive population
growth over the 2002 - 2011. Of the top 10 fastest growing towns in the county, 8 were
located in Inishowen – Kildrum (117.6%) Carrigans (112.7%) Manorcunningham (100.9%)
Burnfoot (94.2%) Fahan (68.3%) Bridge End (66.8%) Muff (64.4%) and Newtowncunningham
(60.9%).
Figure 1: Population Change by Town, Inishowen Municipal Area
Population Change by Town, Inishowen Municipal Area
250.0%
200.0%
150.0%
100.0%
50.0%
0.0%
-50.0%
Chg 2002-06 Chg 2006-11 Chg 2002-2011
The trend for the Glenties Municipal Area is slightly different with the positive growth in the
population in the latter part of the decade, more than compensating for the negative
growth in the 2002-2006 period with the result that only Ailt an Choráin (Burtonport)
experienced declines in population.
Figure 2: Population Change by Town, Glenties Municipal Area
Population Change by Town, Glenties Municipal Area
70.0%
60.0%
50.0%
40.0%
30.0%
20.0%
10.0%
0.0%
-10.0%
-20.0%
-30.0% Chg 2002-06 Chg 2006-11 Chg 2002-201119
Over the period 2002 -2012, 6 of the 12 towns in the Donegal Municipality decreased in
population size, these include; Cill Chartaigh, Killybegs, Ballintra, Ballyshannon, Gleann
Cholm Cille and Pettigo.
Figure 3: Population Change by Town, Donegal Municipal Area
Population Change by Town, Donegal Municipal Area
40.0%
30.0%
20.0%
10.0%
0.0%
-10.0%
-20.0%
-30.0%
-40.0%
Chg 2002-06 Chg 2006-11 Chg 2002-2011
The Letterkenny Municipality accounted for two of the fastest growing towns in the county;
Kilmacrennan (59.3%) and Carrowkeel (53.4%). Overall, all towns in this municipality grew
over the 2002–2011. The negative growth in Rathmullan in the 2002-2006 (-8.8%) was
compensated for by; 2011 positive growth in the 2006-11 period.
Figure 4: Population Change by Town, Letterkenny Municipal Area
Population Change by Town, Letterkenny Municipality
120.0%
100.0%
80.0%
60.0%
40.0%
20.0%
0.0%
-20.0%
Chg 2002-06 Chg 2006-11 Chg 2002-201120
Population growth trends in Stranorlar are very strong as all of the 8 towns in the Stranorlar
Municipality grew over the 2002–2011 period.
Figure 5: Population Change by Town, Stranorlar Municipal Area
Population Change by Town, Stranorlar Municipality
140.0%
120.0%
100.0%
80.0%
60.0%
40.0%
20.0%
0.0%
-20.0%
Chg 2002-06 Chg 2006-11 Chg 2002-2011
2.1.2 Vacancy and Dereliction
There is a shared public interest in ensuring the most efficient use of land and buildings,
especially in urban areas. Strategic planning guidelines in Ireland advocate the optimisation
of town centres as key economic drivers of rural hinterlands and whole regions7. In line with
this, Town Development Plans and Settlement Frameworks recognise consolidation,
revitalisation and the sustainable sequential development of towns outwards from the core
as key development objectives for towns across the County. These policy approaches aim to
reduce instances of vacancy, dereliction and underutilised land in our towns which can have
a very damaging effect.
To derive the maximum benefit from regeneration it is important to target central parts of
the worst affected areas. Our most stagnant urban locations can be identified using
indicators such as vacancy, dereliction and population density. Donegal County
Development Plan 2012-2018 identifies town centre areas for all settlements at Tiers 1, 2 &
3 in the settlement hierarchy. It is a key objective of the plan to increase sustainability
within these core areas through redevelopment and regeneration.
Table 2 (Appendix 2) examines the number of vacant and derelict buildings and the
vacancy-dereliction rates in our town centres8. Overall instances of dereliction and vacancy
are prevalent in our town centres, with just 4 of the 26 settlements under 8%
vacant/derelict. Milford has the highest rate at 30%, while Ballybofey Stranorlar has the
highest number of vacant and derelict properties at 122 followed by Letterkenny with 101.
7
Sustainable Residential Development in Urban Areas, 2009, Pg. 42 & Pl & Dev Acts 2000-2012
8
Incl. towns in tiers 1-3 only21
Another factor that can determine urban vibrancy is population density. This is measured by
the number of persons per square kilometre. The state average is 1,137 persons per sq km 9
while Donegal settlements have a significantly lower level with a combined population
density of 638 persons per sq km. There are a number of factors driving population density
levels including undeveloped and underutilised urban lands etc. The Letterkenny
Development Plan identifies 66% (613 ha) of such lands within its plan area.
Table 3 (Appendix 2), identifies the density of different sized population categories in
County Donegal in comparison to the State, it illustrates that towns falling in population
band category 10,000 – 20,000 are nearly 50% lower than the State average and so forth.
Projects, initiatives and proposals which intensify urban land use by reusing vacant or
underutilised buildings and lands and thus serve to regenerate such locations are
encouraged.
2.1.3 Population Targets
The Donegal County Development Plan 2012-2018 provides a framework targeting how
much and where development will take place in the County. This framework, namely the
‘Core Strategy’ provides for:
a linked Gateway focus for Letterkenny as the primary centre where the creation of
critical mass and alignment of key infrastructures is crucial in driving development
and prosperity for the region (Tier 1)
substantial managed growth for the larger Letterkenny
Tier 1
Strategic Support Towns to strengthen these 9 Gateway
key centres to increasingly act as economic Tier 2 Strategic
drivers and service centres for the rural Support
Towns
catchments (Tier 2 Settlements) Tier 3 Strong Towns &
targeted development to consolidate and Villages
rejuvenate the smaller towns and villages Tier 4 Small Villages
(Settlements in Tiers 3 & 4)
balanced development to sustain rural Tier 5 Rural Area
communities and protect the environment
(Tier 5). Figure 5: Population Targets
9
Calculated using Census Settlement Boundaries22
Based on population projections, infrastructural capacities, housing vacancy rates and other
indicators the County Donegal Development Plan estimated a need for 4,578 new houses in
Donegal over the 2012-2018 period. Figure 6 below, illustrates the share of this predicted
growth by settlement tier. The Donegal Housing Monitor indicates an increase of 754
dwellings in the County from 2011-2012. Figure 7 illustrates the share of this growth (754)
by tier. The charts show significant displacement of new housing from that targeted for tiers
1 & 2 to where housing growth is predominantly taking place in tier 5. These trends
highlight an increased risk of stagnancy and reduced levels of activity in our town centres.
Vibrant urban centres are key to driving growth and recovery; therefore the introduction of
projects and initiatives which assist in increasing urban vibrancy and in consolidating and
rejuvenating town centre locations in line with the current County Plan framework are of
vital importance to urban and rural Donegal.
Figure 6: Housing Growth Target by Tier 2012-18
20% Tier 1 Letterkenny
28%
Tier 2 Settlements
4%
Tier 3 Settlements
8%
40% Tier 4 Settlements
Tier 5 Countryside
Figure 7: Share of Housing Growth for 2011-12
Tier 1 Letterkenny
76%
Tier 2 Settlements
Tier 3 Settlements
6% Tier 4 Settlements
5%
3%
10%
Tier 5 Countryside23
2.2 The People of the Towns
This section provides some socio economic characteristics of the people who live in the
different rural towns in each of the Municipal districts in County Donegal .
2.2.1 Demographics
Age
On average towns in County Donegal had an age dependency ratio of 57.6%. This is a
measure showing the number of dependents (aged 0-14 and over the age of 65) to the total
population of working age (15-64 years). Above average age dependency ratios (or >58%)
were found in 9 of the 12 towns in the Donegal MA; 11 of the 14 towns in Glenties MA; 12
of the 18 towns in Inishowen; 4 of the 8 towns in Letterkennny and 4 of the 8 Towns in
Stranorlar. Detailed in Table 4 (Appendix 2).
Figure 8: Age Cohorts of Towns
Age
Cohort 13%
22% 0-14
of Towns
15-24
22%
25-44
13%
45-64
65 plus
30%
Nationality
Table 5 (Appendix 2); illustrates that 11.3% (or 8,115 persons) of the population in County
Donegal had a non Irish nationalityii. Above average rates (Greater than 11.5%) were
recorded in 3 (Bundoran, Donegal, Mountcharles) of the 12 towns in Donegal MA; in 1
(Ardara) of the 14 settlements in Glenties MA; in 1 (Buncrana) of the 18 towns in
Inishowen; in 1 town (Letterkenny Legal Town and Environs) in the Letterkenny MA and 1
town (Ballybofey-Stranorlar) in the Stranorlar MA. See Table 5 (Appendix 2) for a
breakdown of the population of towns by ethnicity.
Lone Parent Families
Census 2011 illustrates that are there 4,762 or 35% of all families living in urban areas in
County Donegal that are headed by a lone parent. Above average rates (greater than
35.5%) were found in 3 (Bundoran, Ballyshannon and An Charraig) of the 12 settlements in
Donegal MA; in 8 (Creeslough, Dunfanaghy, An Fál Carrach, Anagaire, Ailt An Chorráin,
Glenties, Loch An Iúir, Gort An Choirce) of the 14 settlements in Glenties; in 4 (Carndonagh
Clonmany, Manorcunningham and Bridge End) of the 18 settlements in Inishowen; in 5
(Carrowkeel, Kilmacreannan, Milford, Ramelton and Carraig Airt) of the 8 settlements in
Letterkenny MA and in all of the 8 settlements in Ballybofey Stranorlar MA. See Table 6
(Appendix 2).24
People with Disabilities
15.4% of the population or 11, 286 persons with a disability were living in towns in County
Donegal. Above average rates (i.e. 16% or higher) were found in 5 (Bundoran, Ballintra,
Ballyshannon, Dunkineely and Killybegs) of the 12 towns in the Donegal MA; in 11 (An Bun
Beag-Doirí Beaga, Creeslough, Dunfanaghy, An Fál Carrach, Mín Lárach, Anagaire, Ardara,
Ailt An Chorráin, Glenties, Loch an Lúir) of the 14 towns in the Glenties MA; in 4
(Carndonagh, Clonmany, Moville, Malin) of the 18 towns in Inishowen MA; in 4
(Kilmacreannan, Milford, Ramelton, Carraig Airt ) of the 8 towns in the Letterkenny MA and
in 5 (Ballybofey/Stranorlar, Castlefin, Convoy, Raphoe and Drumkeen) in the Stranorlar MA.
(See Table 7 Appendix 2)).
Figure 9: Persons with a Disability, By Age Cohort
Persons with a Disability, by Age Cohort
9%
36% 7%
20%
28%
Age 0-14 years Age 15-24 years Age 25-44 years
Age 45-64 years Age 65+ years
On average 36% of persons with disability in rural towns were aged 65 years and over while
15% were under 15 years.
Social Class
Table 8 (Appendix 2); examines the top socio economic groups of all persons living in
private households in each town by municipality and illustrates that that :
In the Donegal Municipality:
3 towns had the highest concentrations of their population falling into the ‘non
manual’ socio economic grouping and these were Bundoran @24%, Ballyshannon@
24% and DonegalTown @ 23%.
3 towns recorded ‘manual skilled’ as their top social economic groups - Ballintra @
17%, Dunkineely @ 16% and Pettigo @ 13%.
Mountcharles recorded both 17% or persons falling in both the ‘manual skilled’ and
‘non manual skilled’. Laghy had the highest proportion of its population falling into
the ‘employers and managers’ category @19%.
4 towns fell into the ‘semi skilled’ category - An Charraig 15% , Glen Cholm Cille 28%,
Cill Chartaigh 23% and Killybegs 25%.
In the Glenties Municipality:
8 towns - Creeslough @19% , Dunfanaghy @19%, An Fál Carrach @15%, Ailt An
Chorráin @19%, An Clochán Liath @17%, Glenties @21%, Rann Na Feirste @12%
and Gort An Choirce @ 15% had the highest concentrations falling into the non
manual category.25
3 towns have highest concentration of their populations falling into the ‘semi skilled
socio economic grouping’ these are An Bun Beag-Doirí Beaga @15%, Bun Na Leaca
@17% and @ Loch An Iúir @19% .
2 towns had the highest concentrations falling into the ‘manual’ & semi skilled
categories which were Mín Lárach @ 16% and Ardara @16%. While Anagaire had
19% falling into the ‘employers and managers’ category.
In the Inishowen Municipality:
10 towns had the highest concentration of their populations falling into the ‘non
manual’ socio economic grouping and these were Buncrana @ 16%, Burnfoot @
17%, Carndonagh @ 18%, Carrigans @ 22%, Moville@ 19%, Newtowncunningham
@ 17%, Manorcunningham @ 19%, Kildrum@ 18%, Culdaff @15% and Quigleys
Point @ 22%
5 towns had highest concentrations falling into the ‘employers and managers’ socio
economic grouping and these were Ballyliffen @21%, Fahan @ 25%, Greencastle @
25%, Muff @ 18% and Bridgend @ 18%.
2 towns fell into the ‘manual skilled’ category, which were Tievebane @ 21% and
Malin @15%. In Clonmany, the highest concentration fell into ‘own account
workers’ @ 12%.
In the Letterkenny Municipality:
6 of the 8 towns (Letterkenny @ 21%, Cnoc na Muirleog @ 22%, Kilmacrennan @
26%, Milford @ 23%, Remelton @ 19% and Carraig Airt @195 had the highest
concentrations of their populations falling into the Non Manual Category.
Highest concentrations were recorded in Carrowkeel in the Lower Professional
Category@ 15% and Rathmullen @ 17%.
In the Stranorlar Municipality:
All of the 8 towns had the highest concentrations of its population falling into the
‘Non Manual Category’ Ballybofey –Stranorlar @ 24%, Castlefin @ 19%, Convoy
@21%, Lifford@24%, Raphoe @17%, St. Johnston @18%, Killygordan @ 20% and
Drumkeen @ 25%.
Non Labour Force Participation
Table 9 (Appendix 2); 42% of the population living in rural towns in County Donegal were
not participating in the labour force, this equates to 23,986 persons. The reasons for non
participation in the labourforce were mainly due to persons being retired (37%), being
students (26%), looking after the home or family ( 23%) or unable to work due to sickness or
disability (14%).
Above average rates of participation (or rates> 43%) were recorded in:
9 of the 12 towns in the Donegal MA , namely Bundoran, Ballintra, Ballyshannon,
Dunkineely, Laghy, Pettigo, An Charraign , GlencolmCille and Cill Chartaigh.
11 of the 14 towns in the Glenties MA , namely An Bun beag-Doirí beag, Creeslough,
Dunfanaghy, An Fál Carrach, Mín Lárach, Anagaire, Ailt An Chorráin, An Clochán
Liath, Glenties, Loch An Lúir and Rann na Feirste.
5 of the 18 towns in the Inishowen MA, which were Carndonagh, Clonmany, Fahan,
Greencastle and Moville.
6 of the 8 towns in Letterkenny MA, including Carrowkeel, Cnoc na Muirleog,
Kilmacrennan, Ramelton, Rathmullen and Carraig Airt.
3 of the 8 towns in Stranorlar MA , namely Castlefin, Convoy and Raphoe,26 Unemployed 9,402 persons living in rural towns in County Donegal were unemployed, this equates to 28.4 % of the total labourforceiii for these towns. Above average rates (i.e.> 29%) were recorded in Ballintra, Ballyshannon, Laghy, An Charrraig and Glenn Cholm Cille or 5 of the 12 towns in the Donegal MA. These above average rates were also recorded in Creeslough, An Fál Carrach, Mín Lárach, Anagaire and Bun Na Leaca or 5 of the 14 towns in the Glenties MA. While 8 of the 18 towns in the Inishowen MA recorded above average rates and these included Buncrana, Burnfoot, Carndonagh, Carrigans, Moville, Mannorcunningham, Culdaff and Quigleys Point. 5 of the 8 towns in the Letterkenny MA recorded above average unemployment rates and these included Carrowkeel, Kilmacreannan, Milford, Ramelton and Carraig Airt. All of the 8 towns in the Stranorlar MA recorded above average unemployment rates. 2.2.2. Employment and Economic Activity Employment There were 23,730 persons at work in the rural towns in County Donegal in 2011, giving a work rate of 71.6%. Below average work rates (or
27

2.2.3 Education, Training & Skills
Educational Attainment

Figure 10: Educational Attainment in Towns in the Donegal Electoral Area
               Killybegs            27.8%                 19.6%           17.0%            21.3%
                                                                                                                     No formal or
          Cill Charthaigh          24.4%                  25.0%            16.1%            21.1%                    primary
      Gleann Cholm Cille                   38.5%                   17.9%             18.6%          13.5%

             An Charraig           23.0%             17.5%           16.9%           18.6%                           Lower
                                                                                                                     Secondary
                 Pettigo                   37.4%                    17.5%          14.6%       10.5%

           Mountcharles            23.2%             20.1%           17.8%           19.1%                           Upper
                                                                                                                     Secondary
                   Laghy              32.8%                   16.4%          13.9%         17.2%

             Dunkineely                   37.6%                   22.1%             18.8%       13.3%
                                                                                                                     Technical/Adva
                Donegal           19.1%           14.8%        19.4%               19.5%                             nced/Higher
                                                                                                                     Certificate
 Ballyshannon Legal Town…          23.0%             17.8%           19.8%             19.5%

                Ballintra                 35.6%                    19.9%           13.7%     8.9%                    Degree or
                                                                                                                     Higher
  Bundoran Legal Town &…          17.4%           15.5%           20.3%             19.5%

                            0%             20%             40%               60%             80%             100%

Figure 11: Educational Attainment in Towns in the Glenties Electoral Area

            Bun Na Leaca             28.3%                   27.6%             16.4%         13.5%     13.8%         No formal or
          Gort An Choirce         15.2%       18.9%           21.2%           15.2%             27.3%                primary

          Rann Na Feirste             32.9%                13.2% 11.1%         15.8%            22.2%
                                                                                                                     Lower
              Loch An Iúir           29.3%                   24.7%             19.5%           17.7%        8.8%     Secondary
                  Glenties           28.4%                19.2%            19.7%        15.3%        12.2%
                                                                                                                     Upper
         An Clochán Liath            27.3%                18.7%        18.0%           18.1%         13.5%
                                                                                                                     Secondary
          Ailt An Chorráin         21.1%              26.1%            15.1%          19.3%          14.7%
                   Ardara           22.9%            18.0%          19.4%            19.0%         14.7%             Technical/Adva
                                                                                                                     nced/Higher
                 Anagaire             30.4%                  23.2%           14.9%         16.0%     11.6%
                                                                                                                     Certificate
               Mín Lárach                 36.6%                   19.6%       12.9%         18.3%       12.6%        Degree or
           An Fál Carrach                  34.2%                   15.9%            18.8%           13.7%            Higher
             Dunfanaghy           16.1%      13.9%         20.2%             20.2%              27.4%
                                                                                                                     Not Stated
              Creeslough              32.0%               12.5%       16.9%          18.4%          15.4%
  An Bun Beag-Doirí Beaga           24.0%            16.9%         16.8%           20.0%           16.5%

                             0%             20%              40%             60%              80%             100%
28
Figure 12: Educational Attainment in Towns in the Inishowen Electoral Area
Quigleys Point 17.3% 19.7% 14.2% 19.7% 26.0%
Malin 38.1% 19.0% 17.9% 7.1% 17.9% No formal or
primary
Culdaff 26.9% 15.9% 15.9% 20.3% 17.0%
Kildrum 18.3% 20.1% 18.3% 16.9% 20.3%
Bridge End 26.7% 18.6% 15.9% 15.5% 19.6% Lower Secondary
Manorcunningham 28.1% 21.2% 20.4% 14.6% 13.5%
Tievebane 26.5% 21.0% 13.5% 15.0% 21.5%
Newtowncunningham 26.7% 17.9% 15.4% 14.7% 19.7% Upper Secondary
Muff 16.9% 16.6% 16.8% 15.7% 27.4%
Moville 22.0% 18.0% 18.9% 16.4% 19.2%
Greencastle 17.7% 15.8% 17.9% 16.6% 27.9% Technical/Advan
ced/Higher
Fahan 13.2% 11.9% 15.3% 16.4% 36.4% Certificate
Clonmany 36.0% 19.1% 12.7% 10.2% 16.6%
Carrigans 29.3% 21.3% 16.9% 16.0% 15.1% Degree or Higher
Carndonagh 26.8% 19.6% 15.6% 16.3% 18.2%
Burnfoot 32.8% 17.2% 13.6% 12.3% 19.5%
Ballyliffin 23.4% 19.8% 17.9% 16.9% 16.2% Not Stated
Buncrana Legal Town & Env 20.8% 20.3% 17.7% 18.4% 19.0%
0% 20% 40% 60% 80% 100%
Figure 13: Educational Attainment in Towns in the Letterkenny Electoral Area
Carraig Airt 25.5% 15.9% 25.5% 12.7% 14.6% No formal or
primary
Rathmullen 20.3% 14.6% 18.1% 15.7% 24.5%
Lower Secondary
Ramelton 26.0% 16.8% 18.9% 13.9% 20.6%
Upper Secondary
Milford 20.9% 17.3% 20.3% 18.9% 15.9%
Technical/Advanc
Kilmacrennan 29.7% 22.3% 18.1% 14.0% 15.0% ed/Higher
Certificate
Cnoc Na Muirleog 18.8% 15.9% 22.5% 18.1% 22.5% Degree or Higher
Carrowkeel 23.0% 20.2% 20.6% 13.6% 15.6%
Not Stated
Letterkenny Legal Town &
14.4% 14.1% 19.3% 18.0% 28.9%
Env
0% 20% 40% 60% 80% 100%29
Figure 14: Educational Attainment in Towns in the Stranorlar Electoral Area
Drumkeen 25.3% 20.2% 19.2% 11.1% 11.1% No formal or
primary
Killygordan 24.8% 18.6% 19.4% 17.0% 12.9%
Lower Secondary
St. Johnston 33.7% 22.3% 18.3% 10.6% 10.1%
Upper Secondary
Raphoe 37.3% 23.3% 16.8% 12.1% 7.9%
Technical/Advance
Lifford 31.7% 20.8% 16.3% 13.0% 10.6% d/Higher
Certificate
Convoy 30.8% 19.6% 19.3% 13.2% 11.4% Degree or Higher
Castlefin 36.4% 23.9% 13.5% 14.3% 7.8%
Not Stated
Ballybofey-Stranorlar 23.8% 19.0% 19.5% 18.3% 17.2%
0% 20% 40% 60% 80% 100%
2.3 Area Needs Analysis: Driving Economic Growth Through Towns
Towns and rural areas have a strong interdependency. Settlements provide a wide range of
social and economic services to those living in their hinterlands while rural areas create
demand for many services in the settlements through the production of raw materials and
economic activities such as agriculture, manufacturing, tourism and recreation.
Sustainable, vibrant and economically viable (large or Bundoran – Marine Tourism
medium sized) settlements are therefore essential in
sustaining rural communities, which in turn serve to Ballyshannon – Cultural Tourism
drive their settlement centres. Donegal Town – Tourism
Ballybofey/Stranorlar – Sports
A number of towns across Donegal have been
designated as development hubs. These designations Carndonagh/Buncrana – Tourism
set out to promote and guide more specific sectoral Gweedore – Business Development
development in a number of key towns as set out in
Killybegs – Renewables & Food
the adjacent tables.
Large or small scale urban regeneration initiatives based around such sectoral themes have
the potential to stimulate a range of towns across the County to act as sustainable economic
drivers and service centres for their respective catchments.
It is essential that new projects, policies and initiatives maximise the potential of our towns
to increasingly develop as economic and social drivers to support the sustainable
development of their rural hinterlands by;
Sequential development from the core
Reuse of vacant and derelict buildings
Targeted development of brownfield and other underutilised town centre lands30
In examining the potential for rural towns to act as vehicles for economic revival, the urban
planning objectives of consolidation and strengthening identified for a range of towns in the
Donegal Core Strategy provides a platform for regeneration and redevelopment initiatives.
To assist proposals by local communities and businesses aimed at tackling urban
decay and stagnation through regeneration and upgrade at central urban locations
(buildings & spaces)
The above serves to address the trends identified with regard to town centre dereliction,
vacancy and population density. Such proposals also serve to increase quality of life through
enhancing our living environment and to grow our local service centres to increasingly serve
as tourism bases, retail hubs, employment centres, etc. In general, opportunities to reuse
existing buildings have the potential to conserve and promote our historic and
architecturally important buildings, streetscapes and heritage towns. In this way other
important LEADER themes associated to maximise finite resources such as land and to
increase environmental efficiencies through building upgrade are all targeted.31 Chapter 3 Delivering Socially Inclusive Services 3.0 Examining Deprivation in Donegal Deprivation and social exclusion continue to present challenges in the Donegal Context. The Haase Pratschke Relative Deprivation Score attributed to County Donegal in 2011 was -6.251 making it the second most deprived local authority area in the State after Limerick City at - 6.66. An analysis of the indicators making up Haase Pratschke Index reveals that the key drivers of Donegal low deprivation score are low educational attainment (@ 26.1%) and high male unemployment rates (@ 31.4%). The relative deprivation scores in County Donegal range from the most affluent score of +11.09 (recorded in Lough Eske to the most disadvantage score of – 25.54 (recorded in An Dúchoradh). Spatially, below average rates are both evident in aggregate urban and rural areas. Of the 149 Electoral Divisions within County Donegal, 103 could be described as ‘marginally below average’; 36 were classified as ‘disadvantaged’ and 2 as ‘very disadvantaged’. Therefore, 141 Electoral Divisions had scores that fell below the national average of +0.24. The ‘marginally above average’ deprivation scores were recorded in the electoral divisions surrounding Letterkenny, Bundoran and Lough Eske. Figure 1: Relative Deprivation
32

3.1    Hard to Reach Communities

3.1.1 Rural Dwellers
According to the Rural Development Programme 2014 – 2020, rural areas in Ireland are
considered to be those areas outside of the cities of Dublin, Cork, Limerick, Galway and
Waterford. Therefore, all of County Donegal can be regarded as being part of the rural area.
The Census 2011 classifies an aggregate urban area as comprising of populations of 1,500
inhabitants and there are nine such towns in County Donegal; Letterkenny, Buncrana,
Ballybofey-Stranorlar, Donegal Town, Carndonagh, Ballyshannon, Bundoran, Lifford and An
Bun Beag-Doirí Beaga. Therefore, 27.4% iv of the total population of County Donegal reside
in aggregate urban areas compared to 62% in the Statev . This further emphasises the rural
nature of County Donegal with 72.6 2% of its population (or 116,890 persons) residing in
aggregate rural areas compared to 38% in the State.

The following map (Figure 2) presents the changing population trends by Electoral Division
in County Donegal, over the period 2006 - 2011. This map illustrates that the strongest
population growth is located in Electoral Divisions along the North East Axis which coincides
with the location of largest aggregate urban areas but also the fastest growing towns in the
County. The weakest growth was recorded in Electoral Divisions in the South West of the
County. In addition, there were notable pockets in; Letterkenny Urban, Crossroads, Fanad
North & West, Greenfort and Carthage and around Pettigo and Ballyshannon. 123 EDs
grew, 25 declined, 1 remained the same, 4th largest rural component in the state.

Figure 2: Population Patterns
33

3.1.2 Gaeltacht Communities
The Donegal Gaeltacht is located mainly in the west of the County along the coast and is the
second largest Gaeltacht in the country. The Donegal Gaeltacht has a population of 23,783
(Census 2011) and represents 24.5% of the total Gaeltacht population. The three parishes
of Na Rosa, Gaoth Dobhair and Cloich Cheann Fhaola constitute the main centre of
population of the Donegal Gaeltacht and with a population of just over 16,000 is considered
to be the most densely populated rural area in Europe. While language is the foremost
uniquely defining feature of this area, the Gaeltacht also maintains a rich social and cultural
heritage. The peripherality of the Donegal Gaelthacht and use of the Irish language can
often make accessing goods and services a major issue for persons living in Gaeltacht areas.

3.1.3 Coastal & Island Communities
Donegal has a rugged coastline of 1,134km (17% of the States total) and dotted with islands.
Of the islands, Aranmore, Tory, Inishfree Upper, Island Roy and Gola are inhabited and
located within the Gaeltacht. Ireland’s territorial waters extend to the 12mile (22km)
nautical limit. Historically, the fishing industry was of great importance in Donegal.
However, restructuring and quota restrictions over the decades have impacted on this
industry. The geographical location of the coastline and islands, creates difficulties
associated with access, communications and economic development for these communities.
The fishing communities of Donegal were badly impacted by the recession and they require
an alternative means of earning a living.

3.2    Vulnerable Rural Groups
3.2.1 Youth
In 2006 there were 33,426 persons under the age of 15 years compared to 36,949 in 2011.
This represents a growth of 10.1% (3523) compared to a growth of 13.3% in the State. So
23% of the population of County Donegal are under the age of 15 years and this is higher
than in the percentage share in the State @21.3%. Figure 3; illustrates the age distribution
of the population age under 15 years which depicts lower concentrations towards the South
West of the County and higher concentrations along the North East Axis.

Figure 3: Youth Population
34
There were 45,704 persons aged 0-18 years inclusive and these can be broken down into a
number of distinctive life cycles:
Pre School Children (0-4 years) - Census 2011, illustrates an increase in the number
of pre-school children from 11,168 in 2006 to 12,727 in 2011 or an increase of 14%
(1,599 children). This is higher than the 9.4% increase in the population of County
Donegal as a whole, but lower than the 18% increase experienced in the State. This
has a number of implications for service delivery within the county, in terms of
ample childcare provision, supports for children with special needs, access to GP’s,
hospital services etc.
Primary School Children (5 – 12 years)- There was an increase in the number of
children of primary school age in County Donegal, rising from 17,830 in 2006 to
19,463 in 2011, or an increase of 9.2% (or 1,663 children). The number of primary
school children in the State in 2011 was 504,267, increasing by 12% over the
intercensal period and at a faster rate than in the State. Services are much the same
for primary school children, however transport to schools and different type of
sporting and recreation activities increase in importance.
Secondary School Children (13 -18 years) - There was a slight increase (0.2%) in the
number of children of secondary school age ( 13-18yrs) in County Donegal from
13,482 in 2006 to 13,514 in 2011. In 2011, the total number of children in the State
at secondary school age was 344,931, an increase of 0.8%. Again similar services
are required as above in addition to transport to both schools, colleges and work
placements etc.
3.2.2 Elderly
People in County Donegal are living longer and in 2011 the population aged 65 years plus
had increased by 17 % (or by 3,060 persons) to 21,471. Of the 21,471 persons falling into
this age category 9,241 persons were aged 75 years plus, 168 persons were aged 95 years
plus and 25 persons were 100 years plus. In total, Donegal had 13.3% of its population
falling into the 65 years and over age category. Whilst increased life expectancy can be
testimony to advancements in health care in general and to quality of the natural and
physical environment in particular in County Donegal, from a service delivery perspective it
is important to ensure that those additional years are healthy years vi. The 2011 Census
highlighted that 12.5% of the population of the Border Regional Authority Area were 65
years and over. Recent research recently carried out by AIROvii indicates that in 2031, 21.5%
of the population of the Border Regional Authority Area will be over 65 years of age,
bringing with it major demographic and service related challenges.
Figure 4 below reveals that above average concentrations of elderly persons are located
towards the West and North West of the County, mainly in Gaeltacht areas and in areas that
have experienced lower levels of population growth.You can also read