NORTH END HALIFAX IN TRANSITION: GOTTINGEN STREET - Nathan Roth Supervisor: Dr. Jill Grant School of Planning Dalhousie University, 2013
←
→
Page content transcription
If your browser does not render page correctly, please read the page content below

NORTH END HALIFAX IN TRANSITION:

                GOTTINGEN STREET

                               Nathan Roth
                   Supervisor: Dr. Jill Grant
                        School of Planning
                 Dalhousie University, 2013
                                         1

Table of Contents

     List of Figures and Maps											 iv
     Acknowledgements											 vii
     Executive Summary											 ix
I. Introduction													 1
II. Lessons From Literature											 3
     Uneven Geographical Development and Polarization								                   4
     City Marketing and “Creative” City Placemaking									                    5
     Gentrification												                                                 6
     The Gentrification Debates											                                      7
     Development and Gentrification: Businesses and Community Services						    9
III. Context and Brief History of Gottingen Street								                     11
IV. Methodology												 15
V. Charting Change on Gottingen Street Since 2000						               		       19
     Socioeconomic Change											 20
     Property Value and Land Use Change										 23
     Current Impacts to Businesses and Community Services								 26
		        Locational Strengths and Issues								                              26
		Clientele and Relation to Local Community								 29
		Costs of Operation											 31
     Polarization and the “Embedded Landscape”									 34
VI. Gentrification and the Future of Gottingen Street							                   43
     Is Gentrification Occurring? Is Gentrification a Potentiality?							     44
		Future for Local Businesses and Community Services: Staying Put, Displacement
		and/or Entrapment											 45
     The Development of a New Business and Service Landscape							            49
     Future Development, Affordable Housing, and the Role of Planning							   52
VII. Conclusion												 62

   References												 66
      Figure and Map References											 73
   Appendix I - Consent Form and Interview Questions							 75

                                                                               iii
List of Figures and Maps
FIGURES:
3.1 – Gottingen Street Circa 1960s - 12
4.1 – Mixed Methods Analysis Diagram - 16
4.2 – Research Questions and Applicable Methods - 18
5.1 – Total Population Change Since 1996 - 20
5.2 – Total In-Movers (as Percent of Total Population) Within Last 5 Years of Census Date - 20
5.3 – Household Tenure Type 1996-2006 - 21
5.4 – Self-Identifying Ethnicity (as Percent of Total Population) 1996-2006 - 21
5.5 – Median Household Income Change 1996-2006 - 22
5.6 – Incidence of Low Income After Tax - 22
5.7 – Proportion of Total Population (20 Years and Older*) With University Certificate, Diploma, Degree
        or Higher - 22
5.8 – North End Housing Price Change Since 2000 - 23
5.9 – Average Rent ($) Since 2000 - 24
5.10 – Vacancy Rates Since 2000 - 24
5.11 – Gottingen Street Average Assessed Property Values Since 2001 - 25
5.12 – Inventory of Types and Uses of Gottingen Street Businesses and Community Services - 25
5.13 – Retail Space For Lease Below the Falkland Street Condos and Theatre Lofts - 35
5.14 – Protective Gate in Front of Architect’s Office on Gottingen Street - 35
5.15 – The “Graffitized” Former Bank Building - 36
5.16 – Geography of 2012 Property Values Among Community Services and Businesses on Gottingen
        Street - 38
5.17 – A Representative Snapshot of the Current “Embedded Landscape” - 40
5.18 – A New Mixed-Use Condominium Neighbours a Vacant Property - 40
5.19 – Alter Ego’s Café Sits Next to the Potential Site for a Mixed-Income, Mixed Use Housing
        Development - 41
5.20 – The Long Established North End Community Centre Adjacent to a Building in Transition - 41
5.21 – A Barber Shop and Older Housing Stock - 42
5.22 – Renovated and Upgraded Heritage Homes - 42
5.23 – A Corner Store Business Use Inserted Into the Existing Built Form - 42
5.24 – New Renovated Office of T4G Limited, a “Technology Solutions” Firm - 42
5.25 – Northwood Manor, a Large Retirement and Assisted Living Complex for Seniors - 42
5.26 – Canadian Forces Base Halifax (Stadacona) Behind A Continuous Wall - 42
6.1 – Rendering of the St. Joseph’s Square Mixed-Use Condominium Development - 52
6.2 – Proposed Centre Plan Development and Design Guidelines for the Gottingen Street Corridor - 53
6.3 – Renderings of Two Proposed Housing Trust of Nova Scotia Projects - 53
6.4 - Site Plan of Current and Proposed CGDA Developments - 55
6.5 – Vast Vacant Lot Across from the YMCA; Proposed Site of Gottingen Terrace Project - 55
6.6 – Brick Townhouses of Uniacke Square - 57
iv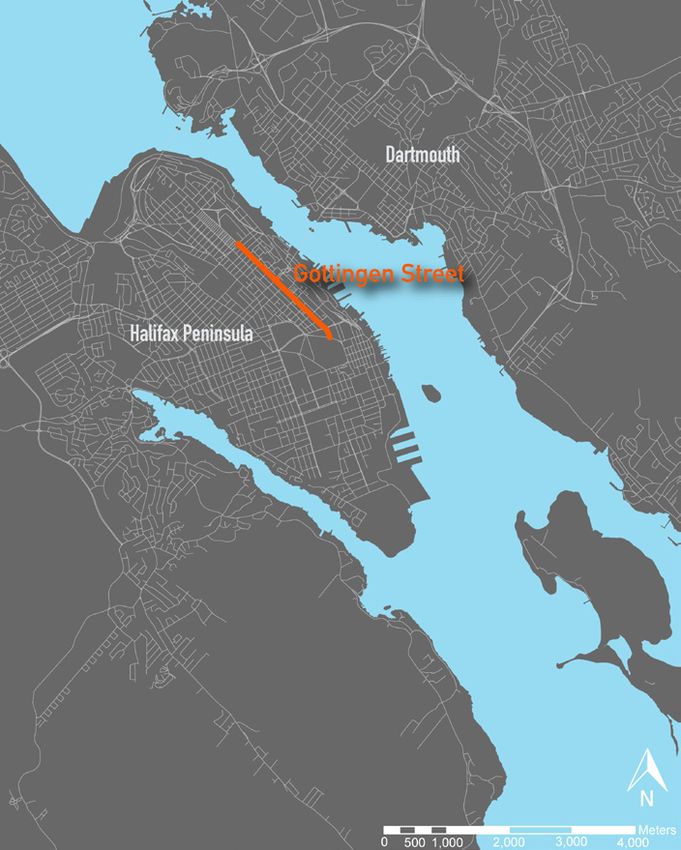
MAPS
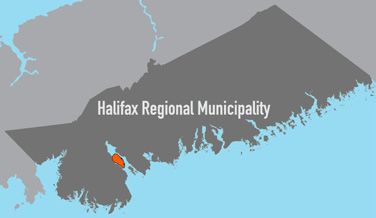
3.1 – Gottingen Street, Halifax Regional Municipality Context Map - 12
3.2 – Gottingen Street Study Area - 14
4.1 – Study Area Census Tracts - 17

                                                                         v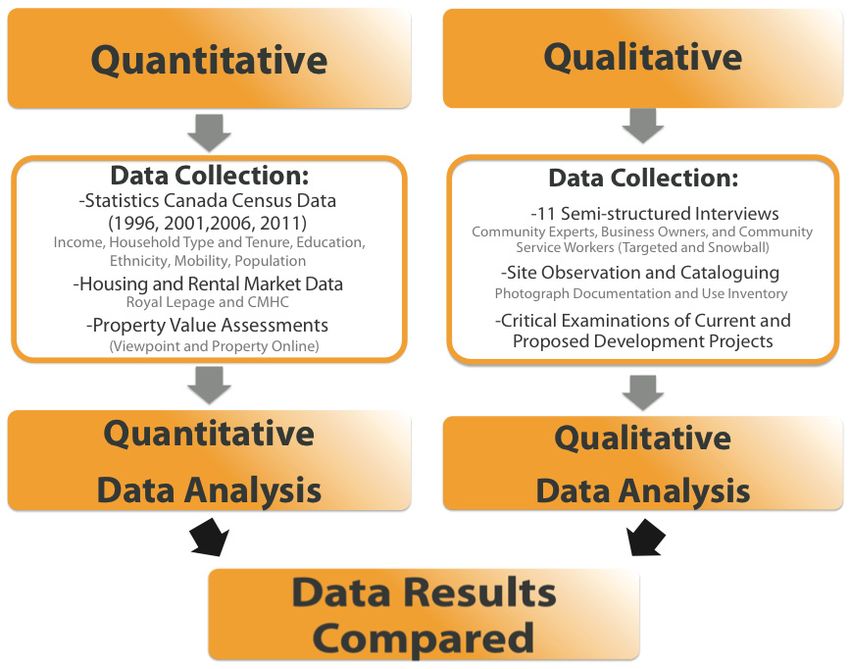
vi
Acknowledgements
I wish to thank all of the interview participants who took time out of their busy lives to share with me their
exceptional insight and perspective. Their contributions are fundamental to the findings of this report. I
am tremendously grateful.

A sincere thank-you to the supervisor of this project, Dr. Jill Grant. Her profound observations, guidance
and advice were indispensable in the completion of this project.

I am thankful for the support, discussions, and suggestions provided by my Master of Planning colleagues.
And finally a special thank-you to Taryn, whose patience and support were unwavering.

                                                                                                           vii
viii
Executive Summary
       Despite decades of disinvestment, much media attention has been directed towards the current
redevelopment of Gottingen Street in Halifax, Nova Scotia. Historically the main commercial, entertain-
ment, and transportation corridor of North End Halifax, Gottingen Street fell into decline in the latter half
of the twentieth century as a victim of “slum” clearance and urban renewal. Contemporary redevelopment
has prompted some to argue that “revitalization” is precisely what is needed for the area to return to eco-
nomic and commercial prominence. Others contend redevelopment will lead to a polarized community
where local services, marginalized residents and affordable housing will soon disappear. Consequently,
Gottingen Street is a significant case study of urban uneven geographical development.
       This study explores the redevelopment of Gottingen Street since 2000. Of particular concern are
established community services and local businesses on Gottingen Street, and the existing residents who
use them. The study utilizes seocioeconomic Census and property assessment data, 11 semi-structured in-
terviews with local business owners, community service operators, and community experts, and case study
exploration to critically examine the changes brought upon Gottingen Street by recent redevelopment, and
whether affordability is being compromised for existing business owners and community services in the
neighbourhood. Whether gentrification (the dynamic process by which middle and upper class individu-
als migrate to and reinvest in affordable and less affluent urban neighbourhoods) is currently occurring on
Gottingen Street is also investigated, as many interview participants identified gentrification as a current
or potential concern.
       Gottingen Street is in the midst of a gradual but potentially significant transformation. The num-
ber of Gottingen Street businesses has increased moderately since 2000, while the number of community
services has remained stable. Redevelopment on Gottingen Street has created a polarizing and “embed-
ded landscape” (Patch, 2004), whereby new and/or more affluent uses are sited among and between the
existing, established, and disinvested. This polarization was also reflected in the socioeconomic Census
data collected for the Gottingen Street area, as median household income has begun to climb while low in-
come incidence is still significant (albeit gradually decreasing). The study found little evidence of current,
gentrification-induced displacement of established businesses, community services, or residents. However,
interview participants expressed concern whether they will be able to stay located on Gottingen Street in
the near future given the recent rapid increases in property values and pressure for redevelopment to take a
more upscale approach. Although increased redevelopment and business interest on Gottingen Street will
benefit a community that has long been saddled with economic disinvestment and devaluation, this study
concludes that concern is warranted when questioning whether current and future services will serve as
many Gottingen Street residents as possible. The fundamental question “who benefits” (Mehta, 2012) needs
to be asked of Gottingen Street redevelopment to ensure evaluation is based on more equitable outcomes
rather than only potential overall economic growth.

                                                                                                            ix
x
Introduction

I.
Introduction

                          1
North End Halifax in Transition
You know, even 20 years ago, nobody Street in North End Halifax since 2000.1
wanted to even walk up and down Got- Of particular concern are established community
tingen Street. Nobody wanted to be here.
services and local businesses of Gottingen
And now it seems to be the cool place to be
or the ‘in’ place. I don’t know, I’m not quite Street, and the existing residents who use them.
sure what it is yet (Participant G06C12). The study utilized property value assessment
data, interviews, and case study exploration to
Gottingen Street, once declared the critically examine the changes brought upon
“most feared neighbourhood” (Benjamin, 2010) Gottingen Street by recent redevelopment, and
in Halifax, Nova Scotia, has had a tumultuous whether affordability is being compromised for
history to say the least. For most of the early existing business owners and community services
and mid-twentieth century, Gottingen Street to operate in the neighbourhood. How local
was the main commercial, entertainment, and residents may be impacted, as customers, clients,
transportation corridor for North End Halifax. and users of these services, is also investigated.
The Street’s precipitous decline began in the Two main research questions, developed
1960s as a victim of “slum” clearance and urban further by sub-questions, guide the findings and
renewal, along with rapid suburban population analysis of the study:
and economic growth. By 2000, Gottingen Street 1) How have uses changed on Gottingen Street
was a site of disinvestment and devalorisation,
since 2000?
with a reputation, sensationalized by the media,
• What has been the local business and
of poverty and crime. However, much has been
community service turnover since 2000?
written in the popular media of Gottingen
• How has current redevelopment physically
Street’s redevelopment over the past decade
transformed Gottingen Street?
(Bousquet, 2011; Van Berkel, 2007). Some argue
2) What are the impacts of redevelopment
that the area is slowly regaining its former status,
on current and long established business
stating “there’s a new energy on Gottingen Street”
owners, community service operators, and
(Bousquet, 2011, para. 1). With the development of
local residents (as users and clients) of
new condominium and mixed-use projects on the
Street, and several more proposed, it is visually Gottingen Street?
apparent that Gottingen Street is changing. • Have their choices to operate on Gottingen
Debates have emerged whether the Street been affected by recent
increasing redevelopment of Gottingen Street is redevelopment?
precisely what is needed for the area to return • How have redevelopment projects contributed
to economic and commercial prominence, or to uneven development, polarization, and
whether redevelopment will lead to a polarized increased costs of living/doing business in the
community where local services, an impoverished community?
population and affordable housing will soon
disappear (Van Berkel, 2007; Silver, 2008). This 1 This time frame is chosen in order to update and build
study will explore the redevelopment (through on Melles’ (2003) Urban and Rural Planning thesis at Dalhousie
University, which examined the historical change of develop-
both built and proposed projects) of Gottingen ment on Gottingen Street from 1950 to 2000.
2Lessons From Literature
II.
Lessons
From
Literature
3North End Halifax in Transition
Uneven Geographical Development And Polarization extreme result of this process is the “postmodern
city” and what he terms “keno capitalism,” where
The process by which certain areas develop
capital and development “jump” in almost complete
while others are sites of disinvestment has
disregard for the existing urban landscape.
fascinated researchers (Badcock, 1997; Blomley,
Patterns of uneven development in
2004; Dear, 2011; Harvey, 2006; Lees, Slater, & Wyly,
contemporary times are also shaped by the
2008; Smith, 1996; Ward, 2003; Zukin, 1991). Harvey
political and economic tenets of neoliberalism
(2006) declares that “one of the most intriguing
(Badcock, 1997; Harvey, 2006; Smith, 1996).2
and politically salient features of our contemporary
The liberalization of trade, deregulation of finance,
world” is the “chronic and ever-fluctuating state
privatization and commodification of what were
of uneven geographical development” (116). This
previously public assets, and realignment of the
process becomes even more accentuated and
state’s primarily role to promoting economic growth,
intensified in urban areas, given the concentration
allow for “flexible accumulation” and production
of wealth and capital that accumulate in cities
(Badcock, 1997; Harvey, 2006). The “heightened
(Lees et al., 2008; Smith, 1996). Lees et al. (2008)
competition between ‘borderless’ economies”
provide two main foundations of urban uneven
(Badcock, 1997, 252) is not universal, but it has
geographical development: the paradoxical nature
exacerbated regional economic differences while
of contemporary capitalism (by which growth
equalizing conditions for economic development
and the “discovery” of new areas for investment
and production (Smith, 1996; Zukin, 1991). While
and accumulation are coupled with disinvestment
some areas become concentrated centres of
of previous areas of profit); and the finding that
development and subsequent wealth, other “areas
new urban development of competitive market
that begin to lose business investment become even
economies is driven to maximize profit above all
less attractive. They utterly fail to develop high-
other priorities. Smith (1996) describes this “rhythm
status production and consumption. The same
of unevenness”:
country, and the same region, can easily be divided
the logic of uneven development is that the between these two paths of development” (Zukin,
development of one area creates barriers 1991, 13).
to further development, thus leading to an Such patterns of uneven geographical
underdevelopment that in turn creates op-
portunities for a new phase of development. development have had tremendous impacts on
Geographically, this leads to the possibility the built environment and the city, as changes in
of what we might call a ‘locational seesaw’: urban development are related to the larger scale
the successive development, underdevelop-
national and international economies (Smith, 1996;
ment and redevelopment of given areas as
capital jumps from one place to another, Zukin, 1991). Smith (1996) argues that “at the urban
then back again, both creating and destroy- scale, the main pattern of uneven development lies
ing its own opportunities for development
(88). 2 Although neoliberalism as a political and economic
process has become hegemonic in Western countries like Can-
Although there are limits to the “jumping” of capital ada, its development and adoption has been unique, contextual,
and differential even at the regional and urban scales (Blomley,
in most cities (Smith 1996), for Dear (2011) the most 2004; Harvey, 2006).
4Lessons From Literature
in the relation between the suburbs and the inner polarization occurring in cities between those who
city. The crucial economic force mediating this are able to benefit from development and those
relation, at the urban scale, is ground rent” (80). who are not and are subsequently left behind
Smith recognizes that there are social, cultural, and (Allegra, Casaglia, & Rokem, 2012; Badcock, 1997;
political factors that influence where development Blomley, 2004; Smith, 1996; Ward, 2003; Zukin,
occurs in the city. However, as land and property 1991). Several authors argue the State’s primary
values are complex and collective social creations role is now economic growth rather than social
(Lees et al., 2008), social and cultural distinctions wellbeing (Allegra et al., 2012; DeVerteuil, May, &
and preferences of certain locations are often Mahs, 2009; Smith, 1996; Ward, 2003). Given the
included in the value of a place. Suburban growth broad economic and labour trends of “bifurcation”
does not only represent new consumer preferences (Badcock, 1997; Ward, 2003), urban inequalities
for housing, but also simultaneously as the means are deepening at the same time as many urban
to significant economic growth and a barrier to areas are being “revitalized” (Blomley, 2004; Ward,
development of other locations due to its near- 2003). Blomley (2004) characterizes the increasing
monopoly status (Smith, 1996). social polarization of downtowns and inner-city
Typically, patterns of uneven development neighbourhoods as “the valorization of certain
at the urban scale do not change often or rapidly spaces and people, and the simultaneous but inter-
(one need only think of the condition and popular locking devalorization of those deemed marginal,
image of inner-city disinvestment in North America such as immigrants and the urban poor” (31).
since the 1970s) (Harvey, 2006; Smith, 1996). Harvey Urban socio-spatial polarization, as a product of
(2006) attributes the generally slow movement of uneven development, can at its most extreme make
development to “competition between different localities “sharply divided between landscapes of
land uses, the power of land owners to extract rent consumption and devastation” (Zukin, 1991, 5).
from favored locations as well as the tendency While this conclusion may be overstated (Patch,
for physical landscapes to become more sclerotic 2004), local government efforts to promote urban
and less flexible with time” (102). However, Smith development through city-marketing strategies
(1996) argues that the long disinvestment and rarely benefit low-income populations (Allegra et.
underdevelopment of inner-city neighbourhoods al, 2012).
eventually provides new opportunities for
reinvestment, economic growth and high rates of City Marketing and “Creative” City Placemaking
return (i.e. a “spatial fix” for capital (Harvey, 2006)).
With the increasing flexibility of capital,
This is not a “return to the city” movement by
regions and cities must now compete on a global
people, but by capital (Smith, 1996). Blomley (2004)
scale for economic growth. Therefore, cities must
concurs, recognizing the downtown and central city
market and brand themselves, and adopt governance
as current sites of “massive reinvestment” (30).
structures such as “urban entrepreneurialism” in
Uneven geographical development in cities
order to gain competitive advantages (Atkinson &
has a significant social dimension too. Much research
Bridge, 2005; Badcock, 1997; Harvey, 2006). The
has focused on the deepening socioeconomic
5North End Halifax in Transition
increasingly popular work of Florida (2010; see culture will bring prosperity” (2006a, 4).
also 2002) claims that cities are best able to attract However, multiple authors have critiqued
economic investment and development when they the “creative class” argument for economic growth
cater to the “creative class” (identified as bohemians, as not only ambivalent (Lees et al., 2008), but
design professionals, students, musicians, the GLBT targeted primarily towards middle and upper
community, etcetera) and “creative” industries income individuals while ignoring those with less
(film, architecture, music, new media, and so on) purchasing power (Catungal et al., 2009; Silver,
(Catungal, Leslie, & Hii, 2009; Lees et al., 2008; Rose, 2008; Slater, 2006). Catungal et al. (2009) concludes
2004; Slater, 2006; Ward, 2003). This argument that “creative city initiatives, while successful in
prioritizes creativity for its economic value and facilitating inner-city renewal and the formation of
associated consumptive practices of the “creative business clusters, actually fail to address attendant
class” (Catungal et al., 2009; Slater, 2006). Slater urban problems such as gentrification, inequality,
(2006) characterizes the “creative class” thesis as: working poverty and racialised exclusion” (1111).
Others argue that promoting “creative class”
hip, bohemian, cool, arty tribes who occupy urbanism and development leads to the process
the cafes, galleries and cycle paths of
formerly disinvested neighbourhoods once of gentrification which “threatens the longevity of
lacking in ‘creativity’, is increasingly seen the diverse and creative conditions which attracted
as a sign of a healthy economic present and them” (Lees et al., 2008, 108).
future for cities across the globe (738).
Florida’s (2010) work on the “creative class” Gentrification
has been promoted and adopted by a plethora of Gentrification is a dynamic process by
local governments and policy makers looking for which middle and upper-class individuals migrate
a competitive advantage (Atkinson & Bridge, 2005; to and reinvest in affordable and less affluent
Catungal et al., 2009; Lees et al., 2008; Slater, 2006). urban neighbourhoods (Brown-Saracino, 2010;
For instance, the Halifax Regional Municipality Hackworth, 2002; Johnson, 2000; Lees et al., 2008;
(HRM) has actively branded and promoted itself Smith, 1996). Although gentrification as a concept
as a “creative” city (Silver, 2008). HRM’s Cultural has proven malleable over time and by study, it is
Plan (2006a) proclaims “new public agendas are generally agreed that socioeconomic change and
highlighting Culture as a pillar of economic and potential displacement of established residents
community growth” (4). HRM (2006a) promotes and services through migration are its defining
its second place ranking on the “bohemian index” characteristics (Brown-Saracino, 2010; Johnson,
among similarly sized Canadian cities (and seventh 2000; Slater, 2006; Van Criekingen, 2009). The
in North America) (Silver, 2008). Furthermore, the process of gentrification has been proclaimed as the
Cultural Plan “recognizes that people will not be “leading edge of neoliberal urbanism” and uneven
attracted to HRM if its cultural identity is hidden development (Lees et al., 2008, xvii; Smith, 1996).
and its creative development is suppressed. It is Gentrification has been widely debated and
HRM’s culture that sets it apart, and ultimately that studied among academics since the initial study
6Lessons From Literature
on the phenomenon almost fifty years ago (Glass, and debated gentrification is among researchers
1964). Lees et al. (2008) note that the concept of and commentators given how popular and political
gentrification is likely more “political, politicized, this area of study is (Bridge, 2001; Lees et al., 2008).
and politically loaded” (155) than any other urban Slater (2006) finds various aspects of gentrification
phenomenon studied. Investigations of the have been studied and debated, from causes and
consequences of gentrification have expanded effects of the process to articles that only discuss the
since the studies of the 1960s and 1970s from semantics of gentrification (see Redfern, 2003). The
primarily observable residential migration changes major areas of debate within gentrification literature
and economic development via renovation only discuss whether the causes of the phenomenon are
(Brown-Saracino, 2010; Glass, 1964; Lees, 2008; production or consumption driven, and whether
Lees et al., 2008). Contemporary research identifies the process itself has positive or negative effects
gentrification as being manifested by spatial for disinvested communities (Bridge, 2001; Brown-
representations of larger social, cultural, political Saracino, 2010; Lees et al., 1998; Slater, 2006; Smith,
and economic repercussions within a community 1996).
(Atkinson & Bridge, 2005; Brown-Saracino, The production-side explanations of
2010; Lees, 2008; Lees et al., 2008; Smith, 1996). gentrification focus on the larger economic and
Contemporary gentrification processes, which have capital patterns of the city, concentrating on “the
become a global phenomenon (although unique in importance of the capital accumulation process
each specific local context), are viewed as similar through the urban land market” (Bridge, 2001, 205;
to redevelopment processes in that the physical see also Lees et al., 2008; Smith, 1996). Smith (1996)
makeup of neighbourhoods (e.g. construction of is recognized as the most influential contributor of
new buildings and demolishing of old structures) production-side gentrification theories. His theory
also undergoes transformation along with the of the “rent gap” has become highly influential and
demographic composition (Atkinson & Bridge, hotly debated (Lees et al., 2008; Smith, 1996). The
2005; Brown-Saracino, 2010; Lees, 2008; Lees rent gap is essentially “the shortfall between the
et al., 2008; Ley & Dobson, 2008; Shaw, 2005; actual economic return from a land parcel given its
Smith, 1996; Uitermark, Duyvendak, & Kleinhans, present land use (capitalized ground rent) and the
2007). Consequently, Hackworth (2002) defines potential return if it were put to its optimal, highest
contemporary gentrification as “the production of and best use (potential ground rent)” (Lees et al.,
urban space for progressively more affluent users” 2008, 52). Older, devalorised urban areas like inner-
(815). Slater (2006) contends this definition is closest cities often have significant rent gaps due to many
to how contemporary gentrification is viewed and of the factors of uneven geographical development,
understood, noting its mutation since Glass’ (1964) such as the necessity for capital to continually
first coining of the process. find new areas of investment while disinvesting in
others (Bridge, 2001; Lees et al., 2008; Smith, 1996).
The Gentrification Debates Therefore, as the rent gap grows larger, the greater
the opportunities for profit by developers, investors,
It is not surprising how highly contested
property owners, and governments to “orchestrate a
7North End Halifax in Transition
shift in land use—for instance, from working-class and Smith—that both theories are equally useful to
residential to middle- or upper-class residential” understanding gentrification and are likely working
(Lees et al., 2008, 52; Smith, 1996). While Smith in tandem rather than as mutually exclusive
(1996) recognizes the importance of consumer causalities (Bridge, 2001; Bridge & Dowling, 2001;
choice and social restructuring to the gentrification Lees et al., 2008; Slater, 2006; Zukin, 1991).
process, he argues that it only makes sense “in the Current gentrification literature also
context of the emergence of a rent gap and a wider debates whether the phenomenon is a positive
political and economic restructuring” (110). or negative process for disinvested communities
On the other hand, many researchers— (Butler, 2007; Freeman, 2005; Lees et al., 2008;
most notably Ley (2003) and Zukin (1982, 1991, Shaw, 2005; Slater, 2006). Some scholars argue that
et al., 2009)—are recognized for their work in gentrification brings economic development and
identifying consumption and cultural practices as a improved housing and services to neighbourhoods
main motive for the gentrification process (Bridge, in decline (Butler, 2007; Duany, 2001; Freeman,
2001; Lees et al., 2008; Slater, 2006). The consumer 2005, 2006). Many governments are promoting
preferences of a new, post-industrial middle class, gentrification as “urban renewal” and a tool
which holds “liberal” cultural and lifestyle values, to establish mixed-income development in
are argued to prefer non-standard consumption impoverished neighbourhoods (Blomley, 2004;
and value historic preservation (Bridge, 2001; Lees Crump, 2002; Davidson, 2008; Lees, 2008; Newman
et al., 2008). In other words, the artistic and so- & Wyly, 2006; Slater, 2006; Uitermark et al., 2007).
called “bohemian” populations are crucial for initial For Freeman (2005, 2006) and others, the risk of
reinvestment of devalorised neighbourhoods due direct displacement of residents via gentrification
to their “post-modern lifestyles of self-conscious was found to be minimal. Others, such as Duany
consumption” (Bridge, 2001, 205; Ley, 2003). (2001), contend more overtly that gentrification is a
However, despite the preference of urban areas that positive process overall:
are alternative to suburban life, the artistic and
“bohemian” groups are often the inadvertent “first gentrification rebalances a concentration of
poverty by providing the tax-base, rub-off
wave” of gentrifiers as investors and developers work ethic, and political effectiveness of a
look to capitalize and profit from the “cool” and middle class, and in the process improves
niche area created by those groups who are high in the quality of life for all of a community’s
residents. It is the rising tide that lifts all
cultural capital but low in economic capacity (Ley,
boats (37).
2003; Zukin, 1982). The formerly affordable area
thus becomes a more upscale neighbourhood for
Others assert that Duany’s position
those middle and upper middle class individuals
privileges and romanticizes economic development
who have similar postmodern tastes but more
over civic and social cohesion and equity (Lees et al.,
capital to invest (Lees et al., 2008; Zukin, 1982).
2008; Slater, 2006). Furthermore, many researchers
Despite the apparent dichotomy of
argue that positive arguments for gentrification
production versus consumption explanations, many
ignore the major impacts of the process, namely
commentators have recently noted—including Ley
8Lessons From Literature
displacement and socioeconomic change (Atkinson shown that some community members, particularly
& Bridge, 2005; Davidson, 2008; Slater, 2006; those existing or long established, do not feel that
Smith, 1996; Wacquant, 2008). Newman and Wyly new businesses reflect their needs, nor do they feel
(2006) provide a critique of Freeman’s findings, comfortable in how their community is changing
concluding in their study with similar data sets that (Deener, 2007; Freeman, 2006; Sullivan & Shaw,
displacement of existing residents is still a salient 2011). Furthermore, existing local businesses may
feature of gentrification. Several commentators be displaced as property values rise and incoming
have also found indirect displacement—such as services are increasingly upscale (Bridge & Dowling,
rising costs of property values so that individuals 2001; Catungal et al., 2009; Zukin et al., 2009).
are not able to move into a certain area—to be just Bridge and Dowling (2001) find that retail changes
as critical an impact as direct displacement (e.g., not only reflect changing consumption patterns
eviction, conversion of rental units to ownership, but also “pressures in the housing market” (96)
housing costs, rent and taxes) (Atkinson & Bridge, and subsequent income differences. Consequently,
2005; Davidson, 2008; Newman & Wyly, 2006). several commentators have argued that the question
Slater (2006) and Wacquant (2008) call for a “who benefits?” from new business uses has been
return of critical perspectives and research on missing from the discussion (Deener, 2007; Shaw &
gentrification, which they feel have been missing Sullivan, 2011).
from the literature and policy work. Community services, as non-profit
organizations, are often at risk of displacement
Development and Gentrification: Businesses and in redeveloping and gentrifying areas as well
Community Services (DeVerteuil, 2011, 2012). It is commonly thought
that community services, which often provide
Research on local businesses in redeveloping
services to the most stigmatized and marginalized
and gentrifying areas has only recently become
clientele, are likely to leave or be priced out of
more prevalent (Bridge & Dowling, 2001; Catungal
redeveloping areas as businesses increase, or vice
et al., 2009; Deener, 2007; Freeman, 2006; Shaw
versa in disinvested communities (Davidson, 2008;
& Sullivan, 2011; Patch, 2004, 2008; Zukin et al.,
DeVerteuil, 2011; Melles, 2003; Reese, DeVerteuil, &
2009). Research has found increases in retail,
Thach, 2010). However, there is very little research
café, and boutique uses in gentrifying areas
on displacement impacts on community service
(Bridge & Dowling, 2001; Deener, 2007; Sullivan
outside of two recent studies by DeVerteuil (2011,
& Shaw, 2011; Zukin et al., 2009). The benefits to
2012). DeVerteuil (2011, 2012) finds interesting,
increased business development include aesthetic
and at times contradictory, results illustrating
improvements, increased access and variety of
that while some community services are at risk of
services, community development through owners
displacement, others have resisted moving through
who are also “social entrepreneurs”, and potential
property ownership or generous lease agreements,
increases in comfort and safety for some residents
while many others are victim to entrapment (i.e.
and customers (Patch, 2008; Sullivan & Shaw, 2011;
“involuntary immobility” (2011, 1569)).
Zukin et al., 2009). However, other research has
The out migration of existing residents,
9North End Halifax in Transition
businesses, and social services, that are common on Gottingen Street businesses and community
outcomes of gentrification processes, illustrate services. Thus, this project will attempt to provide
the significant impact these can have on the a greater understanding of the dynamic and
social and urban fabric (Brown-Saracino, 2010; transforming nature of Gottingen Street, both in
Johnson, 2000; Slater, 2006). Understanding the terms of how uses and the resultant physical make-
processes of redevelopment and gentrification are up of the area are changing, and their impact on
crucial for consensus-based community planning, the users of these services. This project attempts to
as neighbourhoods undergoing transition often collect and analyze data from a balanced yet critical
become highly politicized and “contested space[s]” stance, which Slater (2006) and Wacquant (2008)
(Silver, 2008, 16), not only between new and argue have been missing from the gentrification
existing residents, but also by the conflict between literature.
those who see the area in question as their home
community versus others who view it primarily as
a place of ideal economic investment (Lees et al.,
2008; Silver, 2008).
Little research has been published on the
experience of non-gentrifiers, such as community
services operators and established local businesses
(Slater, 2006; DeVerteuil, 2011, 2012). As noted
above, there are significant gaps in the literature
on the redevelopment and gentrification impacts
on community services, despite the fact that these
facilities “influence opportunities and life-chances
of the most vulnerable citizens” (DeVerteuil, 2011,
1564).
The redevelopment of Gottingen Street has
not been a common topic in academic research.
While Silver (2008) and Kimber (2007) have briefly
discussed Gottingen Street and gentrification
in their examinations of Uniacke Square, there
has been no scholarly literature discussing the
developmental changes on Gottingen Street since
Melles’ (2003) thesis, and only one master’s thesis
from two decades ago (Stern, 1993) that focused
on potential gentrification and Gottingen Street.
Millward and Davis’ article from 1986 is the lone
applicable study on gentrification in Halifax. No
research has examined the impact of redevelopment
10Introduction
III.
Context and
Brief History
of Gottingen
Street
11North End Halifax in Transition
urban growth policies that spurred suburbanization
and disinvestment in the inner-city and urban
core (Millward, 1981; Sandalack & Nicolai, 1998).
Utilizing a federal grant from the Canadian
Mortgage and Housing Corporation (CMHC),
the City of Halifax hired Gordon Stephenson, a
professor of urban planning from the University
of Toronto, to develop an urban renewal study to
“modernize” the Halifax peninsula (Erickson, 2004;
Sandalack & Nicolai, 1998). Stephenson advocated
a vast restructuring of downtown and inner-city
Halifax, arguing that the older, more working class
neighbourhoods of North End Halifax were “slums”
in both physical appearance and social behaviour
(Erickson, 2004; Sandalack & Nicolai, 1998). The
City of Halifax carried out almost all of Stephenson’s
recommendations, including the razing of several
North End neighbourhoods, the construction of
Map 3.1 - Gottingen Street, Halifax Regional Municipality Context Map
large downtown developments, and the forced
Gottingen Street has historically been the relocation and demolition of the predominantly
main commercial and traffic artery of inner city African-Nova Scotian Africville community
North End Halifax, Halifax Regional Municipality, (Erickson, 2004). Urban renewal projects, such as
3
Nova Scotia (see Map 3.1 and 3.2) (Erickson, 2004; Scotia Square (which displaced residents just south
Sandalack & Nicolai, 1998; Silver, 2008). Prior to of Gottingen Street) and the Cogswell Interchange,
the suburban growth and large-scale urban renewal and suburban commercial development (such as the
projects of the 1960s and 1970s, Gottingen Street Halifax Shopping Centre) of the 1960s initiated the
was a thriving commercial and entertainment decline of the number and diversity of businesses
district with a diverse residential population (see on Gottingen Street (Melles, 2003; Sandalack &
Figures 3.1-2) (Sandalack & Nicolai, 1998; Silver, Nicolai, 1998).
2008). Much of Gottingen Street’s development was The trend of diminishing population and
spurred by the expansion of the Halifax Shipyards economic disinvestment continued for the next
and Naval bases during World War II, as most North several decades (Melles, 2003; Sandalack & Nicolai,
End residents were industrial workers and military 1998; Silver, 2008). As a result, land value and
personnel (Erickson, 2004; Melles, 2003; Sandalack
3 Despite paying taxes to the City of Halifax, Africville
& Nicolai, 1998; Silver, 2008). did not receive full services from the municipality (Erickson,
However, the economic boom of the postwar 2004). In an obvious example of the malign neglect performed
by the municipality—of which race certainly played a major fac-
period, the return of Canadian servicemen and tor—the City of Halifax placed a rail road, an infectious disease
women, and the emergence of the automobile led to hospital, and a garbage dump within the Africville community
(Erickson, 2004).
12Context and Brief History of Gottingen Street
rents decreased on Gottingen Street, leading to here. The adjacent neighborhood has been
increased development of public housing (such as disfigured, remodeled, vilified by the press,
yet still struggles with vigour and brazenness
Uniacke Square in 1966) and community services in a city largely indifferent to its outcome (3).
by non-profit organizations (Silver, 2008; Kimber,
2007; Melles, 2003). Many of the former Africville The dramatic decline of the Street, coupled
residents ended up relocating in the Gottingen with the increasing number of services for the
Street area around Creighton and Maynard Streets most marginalized populations of Halifax, led to a
(traditionally the area with the most established primarily negative perception of Gottingen Street
African-Nova Scotian residents) or in public since the postwar period (Melles, 2003; Silver,
housing such as Uniacke Square (Erickson, 2004; 2008).4
Kimber 2007; Silver, 2008). The Gottingen Street While suburban development is still the
area lost over sixty-five percent of its residential primary means of residential growth in the Halifax
population between 1961 and 1996 (Melles, 2003). Regional Municipality (HRM), the Regional
By 2000, Gottingen Street had 100 fewer retail and Municipal Planning Strategy for HRM (2006b)
commercial uses than it did at its peak in 1960 states the desire to attract economic and residential
(Melles, 2003). Stern (1993) describes the Street’s growth back to the urban core of Halifax. Silver
status in the early 1990s: (2008) argues that this is an attempt by HRM, like
most North American municipalities, to encourage
Gottingen Street is a sad shadow of its
former self. Its commercial devalorization economic growth and a higher income tax base
is visible in its physical deterioration. in the context of the neoliberal era of decreasing
Its people-scaled buildings and street- funding for municipal governance. The competition
accessible facades are shabby with neglect.
among cities is to attract inner city redevelopment
Craters of vacant lots have disrupted the
continuity of its streetscape and attest to the and in-migration by those with the ability to invest
market-driven opportunism of speculative (Silver, 2008; Lees et al., 2008). As Gottingen Street
ownership and lack of planned direction
has currently become an area of interest due to
that marks the city’s attitude to development
its relatively affordable property and proximity to
downtown, the increasing redevelopment of the
Street since 2000 has suggested that a gentrification
process may be underway (Silver, 2008).
4 Large public housing projects, such as the 250-unit
Uniacke Square development, have become both “stigma and
scapegoat[s]” (Kimber, 2007, para. 1) in North American cities,
mainly due to social perceptions of poverty, race, and social as-
Figure 3.1 - Gottingen Street circa 1960s sistance (Silver, 2008).
13North End Halifax in Transition
Map 3.2 - Gottingen Street Study Area
14Introduction
IV.
Methodology
15North End Halifax in Transition
Urban redevelopment and gentrification are perception of the changes on the Street, and how
complex phenomena that involve large, structural life choices and chances have been affected, if at
issues, but which also affect individuals and physical all, on Gottingen Street in recent times. Qualitative
space “on the ground.” In other words, gentrification methods—specifically semi-structured interviews
and urban redevelopment manifest in personal with business owners, community service operators
experience and perspective, quantitative data and community and planning experts, and visual
and trends, and in the physical urban landscape. analysis of redevelopment on the Street—were
Consequently, this project utilized a concurrent required to answer these important questions of the
mixed methods approach, which combines and process of gentrification and redevelopment.
synthesizes data collected from quantitative and The quantitative data collected included
qualitative methods (see Figure 4.1) (Creswell, descriptive socioeconomic statistics from
2009). The quantitative data gathered and Statistics Canada for the 1996, 2001, 2006, and 2011
analyzed—socioeconomic data, property value (population change only) Censuses, housing and
assessments, and housing stock data—is required rental market information from the Royal LePage
to empirically address structural issues such as cost Housing Price Survey (2000-2012), and property
of living and tenure type of housing (among others). value information from Viewpoint Realty Services
However, these quantitative analyses provide little (2012) and the Property Online tool provided
information to answer questions of the effects on by Service Nova Scotia and Municipal Relations
individuals, similarities and differences of (2012).5 Specific census data categories gathered
Figure 4.1 - Mixed Methods Analysis Diagram
5 A limitation to the census data collected is that the
2011 Census and National Household Survey data for the cat-
egories utilized in this study (except total population) will not
be released by Statistics Canada until mid to late 2013.
16Methodology
included incidence of low-income, university is still useful (Heidkamp & Lucas, 2006; Silver, 2008;
education, median household income, ethnicity, Sullivan, 2007; Wyly & Hammel, 1998). Census data
dwelling tenure type, mobility, and population of the chosen socioeconomic categories were also
change. These categories have been presented as collected of the Halifax peninsula (census tracts
some of the most salient to examine the process 3-13, 18-23) and the Halifax CMA for comparison
of gentrification and redevelopment in previous purposes to observe whether the trends presented
studies (Hammel & Wyly, 1996; Heidkamp & Lucas, were unique to Gottingen Street.
2006; Meligrana & Skaburskis, 2005; Sullivan, 2007; Qualitative data collected consisted of
Wyly & Hammel, 1998). The socioeconomic data 11 semi-structured in-person interviews with
was gathered for census tracts 09, 10, and 20 of the community experts (community leaders and
Halifax Census Metropolitan Area (CMA). These organizers, academics, professionals), local
three tracts most closely align to the Gottingen business owners, and community service operators.
Street study area (see Map 4.1). A limitation to the A targeting method was initially used to find
collected census data is that the census tracts do interviewees, while snowballing was subsequently
not cover only the Gottingen Street area, but also used to locate additional participants. The
larger swaths of the North End and the downtown interviews were recorded and transcribed with
(i.e. census tract 09). However, other studies have the participants’ consent, and were then coded to
illustrated that the generalizability of census data ensure confidentiality in analysis (see Appendix
which does not perfectly line up with the study area I for consent form and interview questions).6
Specifically, interviews were coded for where
themes are similar, divergent, appear to reflect
redevelopment and gentrification trends or
contradict them, and/or other unique themes that
appear when compared to the existing literature
and the other data gathered (Creswell, 2009). The
interview data gathered, while not necessarily
representative of all of Gottingen Street, are a
crucial data source for gathering, understanding,
and exploring people’s perspectives, which are
key to how individuals act and how they view the
world in which they live.
Data collected from visual site observations
included a cataloguing of recent development and
the types of community services and businesses
6 The codes used to cite participants throughout the pa-
per identify the location of study (“G” for Gottingen), sequence
of the interview, in chronological order (01-11), the category of
participant (“B” for business owner, “C” for community service
operator, or “E” for community expert) and the year (“12” for
Map 4.1 - Study Area Census Tracts
2012) (e.g: G01E12).
17North End Halifax in Transition
that currently exist on Gottingen Street (aided with have been demonstrated as a useful method of data
Halifax city directories and phonebooks). Bridge collection and analysis (Patch, 2004, 2008) as they
& Dowling (2001) have successfully utilized such exist as “visual quotes” and “provide a degree of
an approach in visually assessing the consumptive tangible detail, a sense of being there and a way of
practices associated with processes of gentrification, knowing that may not readily translate into other
while Heidkamp & Lucas (2006) and Patch (2004, symbolic modes of communication” (Prosser &
2008) used site observations to identify areas that Schwartz, 1998, 116).
were gentrifying and redeveloping more or less The collection of quantitative and qualitative
than others. A similar approach was employed to data allowed for triangulated analyses through
collect data from proposed development projects which salient themes emerged (Creswell, 2009).
to determine what visual cues and cultural symbols The comparison and analysis of all quantitative and
they may bring to the Street that might reflect qualitative data gathered was required to answer
typical or unique redevelopment and gentrification the research questions and fulfill the purpose of the
processes. Photographs were taken to document study (see Figure 4.2). In order for themes to have
the current state of change of Gottingen Street. emerged from data analysis and interpretation,
Photographs were used as a rigorous method of and the conclusions to be drawn about the
data collection, where shots were carefully taken redevelopment process of Gottingen Street required
to consider the surrounding context and landscape an “ongoing process involving continual reflection
(Harper, 1998). Visual analysis and photography about the data” (Creswell, 2009, 184).
Research Questions Methodology
How have uses changed on Business and community service
Gottingen Street since 2000? use inventory since 2000
What has been the local business and community Site Survey and investigation
service turnover since 2000? Quantitative data: housing and rental
How has current redevelopment physically market trends, property assessment
transformed Gottingen Street? values
What are the impacts of
redevelopment on current and
long established business owners,
community service operators, and Qualitative semi-structured
interviews with local business
local residents (as customers and
owners, community service
clients) of Gottingen Street?
operators, and community experts
Have their choices to operate on Gottingen Street
Quantitative data: Property
been affected by recent redevelopment?
assessment values, Census socio-
How have redevelopment projects contributed economic data
to uneven development, polarization, and
increasing costs of living, operating, and doing
business in the community?
Figure 4.2 - Research Questions and Applicable Methods
18Introduction
V.
Charting
Change on
Gottingen
Street
Since 2000
19North End Halifax in Transition
Socioeconomic Change older residential areas and Canadian Forces
Base Halifax (Stadacona), has seen a continually
The total population for census tract 10 grew
decreasing population for the last decade and a
between 2006 and 2011 for only the second time
half. The portion of Gottingen Street north of North
since 1961 (see Figure 5.1; Melles, 2003). However,
Street that is included in this tract has seen little of
this growth added 535 individuals to the 1996 total of
the development pressures applied to those portions
4,494, which Melles (2003) notes was approximately
of the street closer to central Halifax. However, a
8,500 less than the 1961 total. Despite this modest
significant new mixed-use condominium and retail
addition, both census tract 10 and 09 grew at a more
building is scheduled to be built at the northernmost
rapid pace than the Halifax peninsula since 1996.
intersection of Gottingen Street before it turns into
This trend indicates at least a moderate resurgence
Novalea Drive (St. Joseph’s Square; HRM, 2011).
in the Gottingen Street area south of North Street.
The mobility rates for the subject census
Census tract 09, which includes most of downtown
tracts, and for the peninsula and CMA as well, have
Halifax, has had a greater change in its population
remained relatively consistent (see Figure 5.2).
than that of the Halifax CMA, despite the fact that
Census tracts 9, 10, and 20 have seen little change
the majority of population growth in HRM has
in the percentages of population that have moved
been in the suburban and rural commutershed
into the tract over 5-year periods at each census
areas (HRM, 2006b). Some of the growth of the
date. The high mobility rates of the three census
Gottingen Street/North End may be attributed to
tracts are indicative of the predominance of rental
a limited “return to the city” movement in HRM.
housing tenure in subject census tracts, and of the
However, several community experts expressed little
peninsula overall (see Figure 5.3; Van Criekingen,
hope that central Halifax commercial development
2009). This is evident when compared to the Halifax
will outpace suburban growth anytime in the near
CMA category, which is undergoing a gradual
future (Participant G01E12; Participant G02E12).
reduction of the percentage of in-migrants while an
Census tract 20, which comprises primarily increasing majority of residents are homeowners.
Figure 5.1
Figure 5.2
Note: A Base 100 Index sets a value at given time (in this case, the year
1996) at 100 (or base value). Each subsequent year’s value is compared
to the base value, which produces the percentage over (or under) the
20 Base of 100. This is performed to easily represent change.Community Non-Profit 11 13 15
National NGO 5 6 4
Government (Municipal) 5 4 4
Government (Provincial) 2 2 2 Charting Change on Gottingen Street Since 2000
TOTALS 23 25 25 Figure 5.4
Figure 5.3
Household Tenure Type 1996-2006 Self-Identifying Ethnicity (As Percent of Total
Halifax CMA 1996 2001 2006 Population) 1996-2006
Rent 40% 36% 36% CT 09 1996 2001 2006
Own 60% 64% 64% Total Black 4.81% 5.75% 5.11%
Halifax Peninsula Total Aboriginal Identity 0.60% 0.58% 1.08%
Rent 64% 64% 63% Total Visible Minority 9.92% 8.92% 11.3%
Own 36% 36% 37% Total Non-Visible Minority 90.4% 89.5% 84.2%
CT 09 CT 10
Rent 85% 84% 85% Total Black 25.8% 24.3% 26.7%
Own 15% 16% 15% Total Aboriginal Identity 2.00% 1.82% 3.83%
CT 10 Total Visible Minority 31.7% 31.4% 31.6%
Rent 87% 90% 86% Total Non-Visible Minority 67.8% 67.7% 66.6%
Own 13% 10% 14% CT 20
CT 20 Total Black 5.67% 4.49% 3.18%
Rent 76% 71% 66% Total Aboriginal Identity 0.35% 0.36% 0.94%
Own 24% 29% 34% Total Visible Minority 8.50% 6.64% 4.87%
Total Non-Visible Minority 72.4% 75.5% 78.6%
Although the three census tracts of the Gottingen
Street-North End area are relatively unstable in affluent newcomers are likely to be white (or non-
terms of residential mobility, this trend in isolation visible minorities)—which is the general trend in
says little about whether a significant socioeconomic the United States, with exceptions—this does not
shift is occurring in the area, or whether wealthier preclude the possibility that visible minorities may
residents are gradually moving into the community also be the “gentry” (as is the case in predominantly
or even displacing lower income individuals (Van African-American Harlem (Zukin et al., 2009)).
Criekingen, 2009). Between 1996 and 2006, all three census
Freeman (2005) and others have suggested tracts of the Gottingen Street-North End area had
that as neighbourhoods undergo continuing rounds median household incomes less than the Halifax
of gentrification, they become more ethnically peninsula and CMA. In 2006, census tracts 09,
homogenous and less diverse. This is currently 10, and 20 registered median household incomes
not the case in census tracts 09, 10, and 20 (see of $37,641, $24,800, and $37,908, respectively.
Figure 5.4). All three tracts continue to represent Compared to those of the Halifax peninsula ($39,726)
areas that have some of the highest proportions and the CMA ($54,108), the subject census tracts—
of visible minorities in all of HRM. The African- and especially census tract 10—remain primarily as
Nova Scotian population has remained consistent areas of modest income. However, as illustrated by
or risen slightly in the subject census tracts, except Figure 5.5, census tracts 09, 10, and 20 experienced
for tract 20, which has seen an overall reduction median household income growth rates since 1996
in the proportion of visible minorities since 1996. that outpaced both the peninsula and the CMA.
The Aboriginal population has grown in all three The median household incomes of census tracts 10
census tracts, a trend noted by several interview and 20 increased rapidly between 2001 and 2006,
participants. These trends do not illustrate an with both census tracts registering increases at over
absence of socioeconomic shift just because the 150 percent of their 1996 median income levels.
population is maintaining its heterogeneity. While The median household income growth of census
Freeman (2005) makes the argument that more tract 09 mirrors the percent change of the Halifax
21You can also read


