Downtown Retail and Entertainment Strategy 2016-2025 - City of ...
←
→
Page content transcription
If your browser does not render page correctly, please read the page content below
Downtown Retail and
Entertainment Strategy
2016-2025

                  In partnership with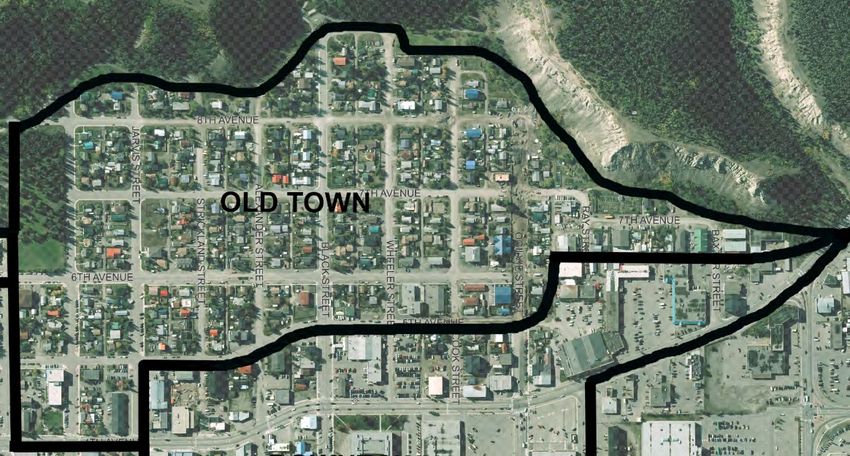
Executive Summary
The goal with any city’s downtown and its retail, service and entertainment offering - regardless of size or
geographic market area - is to not only meet the needs and wants of residents, workers, and visitors, but
serve as the social and civic heart of the community. A city’s downtown is in effect its calling card,
communicating its uniqueness, personality, and appeal as a place to live, work, and invest.

The pending update of the 2006 Downtown Plan by the City of Whitehorse initiated a corresponding
update to the Retail Strategy that accompanied it a decade ago. Nurturing a healthy downtown core is an
ongoing priority of the City of Whitehorse and has been a component of various City plans and strategies
of recent years. The 2016 update to the Retail Strategy provides an opportunity to assess the current
status of the retail-commercial elements of Downtown Whitehorse, note changes from 2006, and identify
the issues and trends that merit action and/or follow-up investigation in the upcoming 2016 Downtown
Plan. The City also chose to incorporate the added element of entertainment in the 2016 strategy in
recognition of the vital role it plays creating a vibrant Downtown and quality of life for Whitehorse
residents.

The strategy aimed to achieve the following:

    •   Assess, on a quantitative and qualitative basis, the existing retail-commercial infrastructure and
        arts and entertainment offer Downtown;
    •   Assess Downtown Whitehorse retail and service provision strengths, weaknesses, opportunities
        and threats from the perspectives of the business community and local residents;
    •   Analyze changes in Downtown Whitehorse retail-commercial uses since 2006;
    •   Assess and identify the level of entertainment market support, absorption and general content
        for entertainment type uses;
    •   Review the local and regional entertainment market, its competitive influences, and relevant
        trends;
    •   Analyze the market opportunity for entertainment in Downtown Whitehorse;
    •   Identify merchandising gaps in Downtown Whitehorse;
    •   Forecast market demand for key retail categories in Whitehorse in terms of sales volume and
        warranted building floor area, based on population and expenditure data; and,
    •   Develop strategies to strengthen the Downtown core for retail-commercial and entertainment
        uses.

The strategy was undertaken over a three-month period from December 2015 to March 2016 and
included a business survey, retail-commercial inventory of the Downtown, interviews with 16
stakeholders and leaders in the business and arts/cultural community, a retail market analysis, secondary
research, and discussions with City representatives.

The 2016 update to the retail-commercial inventory found that the commercial floor area of Downtown
Whitehorse increased by 32% during the past decade with the addition of almost 500,000 ft2 of space. The
proportion of retail, service, and office uses has stayed relatively similar. Factoring in new categories
developed for this update (and recommended for inclusion in the future), service-oriented uses comprise
about 39% of commercial floor area Downtown (with 8% being entertainment-specific), retail uses 35%,
public/non-profit sector offices 14%, and private sector offices 7%. Vacant space accounts for about 5% of
commercial floor area. The numbers speak to a relatively balanced retail-service mix with a vacancy rate

                                                                                                           i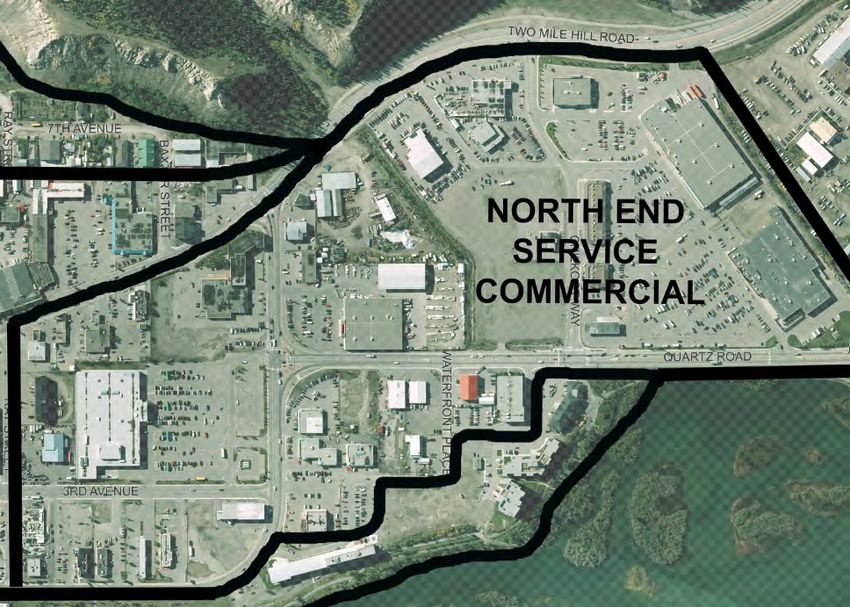
that falls within the 5-7% range generally considered conducive to business growth and development in a
downtown.
2016 FLOOR AREA 2006 FLOOR AREA % CHANGE
COMMERCIAL USE 2 2 % % 2 % FLOOR
FT M FT AREA
TOTAL TOTAL TOTAL
RETAIL 881,600 140,571 43 35 632,000 41 +39
SERVICE (ENTERTAINMENT) 192,246 28,610 8 792,000
48 51 +25
SERVICE (OTHER) 798,718 126,032 31 N/A
OFFICE - PRIVATE SECTOR 183,056 28,200 9 7 134,000 8 +37
OFFICE - PUBLIC/NFP N/A N/A N/A N/A
349,795 53,469 14
SECTOR
VACANT 137,328 26,996 N/A 5 N/A N/A N/A
TOTAL – 2006 CATEGORIES 2,055,620 323,414 100 N/A 1,558,000 100 +32
TOTAL 2,542,743 403,879 N/A 100
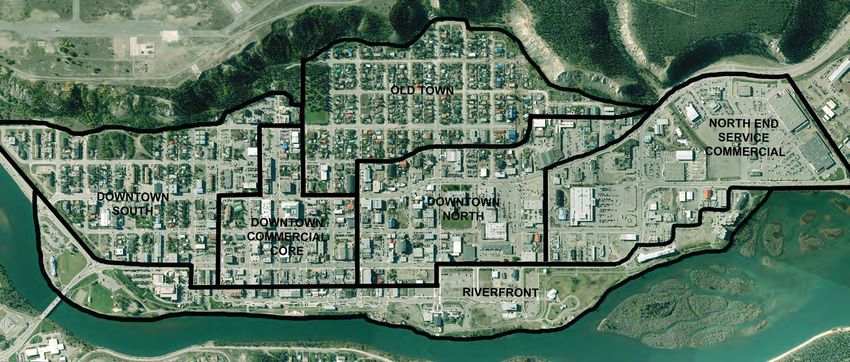
The consultant team observed a number of significant changes from 2006, most notably the significant
increase in both residential and commercial density via new development throughout the Downtown and
the revitalization of the Whitehorse waterfront via the development of new attractions, venues,
commercial spaces, parks, and attractions. Comparing the six Downtown sub-areas, the following trends
were noted:
• Old Town has undergone the least amount of change, adding little in terms of retail-commercial
space but considerable new residential, including multi-unit, construction;
• Downtown North has now surpassed the North End Commercial Service area in terms of
commercial floor area with 791,189 ft2 versus 598,826 ft2;
• The highest percentage of live-work units can be found in Downtown South (13% of units) and
Downtown North (9%); live-work units represent only 2-4% of units in other sub-areas; and,
• There are relatively high levels of new construction or redevelopment in all sub-areas, with the
Riverfront area the highest at 51% of units, followed by North End Service Commercial and Old
Town (30%) and Downtown South (26%).
The Whitehorse arts, culture and entertainment scene is thriving, with a large number of active non-profit
societies and the Yukon Arts Centre providing a diversity of programming and performances throughout
the year at various government and privately run venues and facilities throughout the city. The Yukon is
home to the highest percentage of people working in cultural occupations in the country and boasts the
highest per capita artist funding: this strong foundation of public sector support leaves arts and
entertainment consumers “spoiled for choice”. Along with arts and entertainment venues, Whitehorse
boasts a number of cultural and heritage attractions such as the waterfront trolley, Macbride Museum,
Old Log Church, Beringia Centre, and Yukon Transportation Museum. Festivals and events comprise
another key facet of the local arts and entertainment scene, and the Whitehorse event calendar is full
with a range of music, film, First Nation culture, and seasonally themed offerings, some of them attracting
audiences outside of the territory.
Downtown businesses surveyed as part of the strategy comprised a small sample of largely independent
businesses who had been in operation between 3-10 years and were located throughout the Downtown
area. The majority noted that revenues were up as compared to last year and 5 years ago. Businesses
spoke to access, visibility, and location near offices and other businesses as key strengths. Parking was
almost universally cited as a weakness. When asked what improvements could help their businesses
succeed, survey respondents prioritized improved marketing, maintenance and cleanliness, and festivals
and events. Entertainment, specialty food retail, restaurants and cafes, and art galleries and gift shops were
seen as the establishment types most conducive to a vibrant downtown. Market/competitive constraints
were considered the most significant barriers to business growth, most notably online shopping, lack of a
ii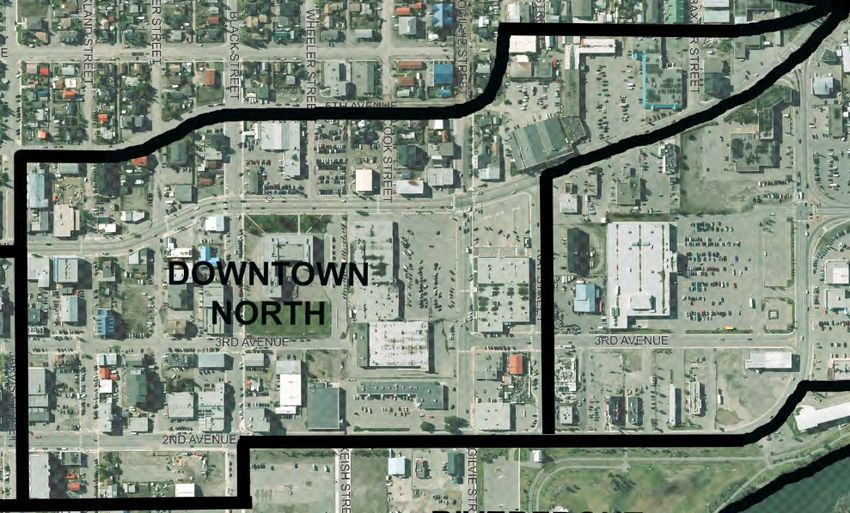
“buy local” culture, and unsupportive government procurement policies. Difficulties finding staff, and
competing with higher government wages, were also commonly cited barriers.

While consumers were not surveyed as part of this exercise, a review of other recent surveys conducted
by the City of Whitehorse shows that access to retail and services is strongly valued by residents,
although considered secondary to other amenities such as wilderness and recreation. Some residents hold
negative perceptions of the business community and claim that local businesses operate “monopolies” due
to the relatively isolated location and lack of competition. Reviews of customer service are mixed at best.
When asked about the types of businesses or services they would like to see, Whitehorse residents
indicate a preference for big box and chain retail offerings, updated movie theatres, and food retail.

Stakeholders in the business community spoke to a general level of vitality in the Downtown, particularly
given the pronounced downturn in the mining sector post-2012. The Horwood’s Mall specialty and micro-
retail and new market entries such as mobile vendors were offered up as success stories. Other sectors –
such as mining service/supply and high-end dining – are reportedly struggling, and lease rates have
dropped 10-15%; however, there have been few closures to date. The predominance of the public sector
in the Yukon economy was seen as both a strength and weakness, with some expressing concern about
the vulnerability of local businesses to government policies and decision-making and others noting a
general absence of entrepreneurial thinking and culture in Whitehorse.

The retail market analysis component of the study found that per capita spending increased almost 30%
from 2004-2014. Annual retail sales growth from 2011 to 2014 was a modest 0.5% overall and while
spending in certain categories has increased – food retail, motor vehicles, health care, etc. – these are
mostly a function of population growth versus shifting consumption patterns. Some categories, particularly
clothing, building supplies, electronics, and household furnishings are showing decreases likely as a
function of outflow spending in larger centres and (for construction) the downturn in the mining sector
and corresponding private sector activity. Based on trade area spending data, population growth
projections, and the current commercial space inventory, the market opportunity in key categories
through to 2026 is as follows:

             Category                       2015             2021               2026
                                                  Additional Floor Area (ft2)
             Restaurants/Taverns                 -750            19,250            40,250
             General Merchandise               13,000            33,000            63,000
             Clothing                           -2000             4000             10,000
             Retail Food                       30,000            49,000            66,000

The pending construction of a Save-On Foods store will capitalize on the most significant short-term
opportunity in food retail. In comparison, general merchandise shows relatively modest expansion
potential and clothing/accessories and restaurants/taverns appear to be currently over-represented in the
market. The future prospects for the electronics, clothing/accessories, and household furnishings
categories are considered marginal at best. High potential areas for expansion and new market entries
include “made in Yukon” product, mid-range ethnic offerings (Thai, Lebanese, etc.) and craft
breweries/cideries. A diverse, independent-oriented restaurant and tavern scene is a critical differentiator
not only for prospective residents but also Yukon’s target visitor markets.

While there was insufficient data available to undertake a quantitative arts and entertainment demand
analysis, the use of indirect indicators and expert interviews suggests that demand for arts and culture
programming has held steady over the past five years. There is very high demand for arts and crafts retail
opportunities, musical performances (particularly those offered outside of pubs/taverns), family-oriented
programming, and participatory experiences. Volunteer burn-out is perceived to be high in the arts and
cultural sectors, and the various not-for-profit (NFP) groups primarily responsible for programming are
competing for limited audiences. Stakeholders spoke to the geographic barriers between the Downtown
and various venues and attractions throughout town; they also cited a lack of coordination around
tourism development and marketing and promotions. The predominance of NFPs creates a revenue
challenge for venues offering discounts; conversely, larger, expensive spaces are a poor fit for many
fledgling organizations with limited budgets. The waterfront is still seen to hold significant promise as a

                                                                                                          iii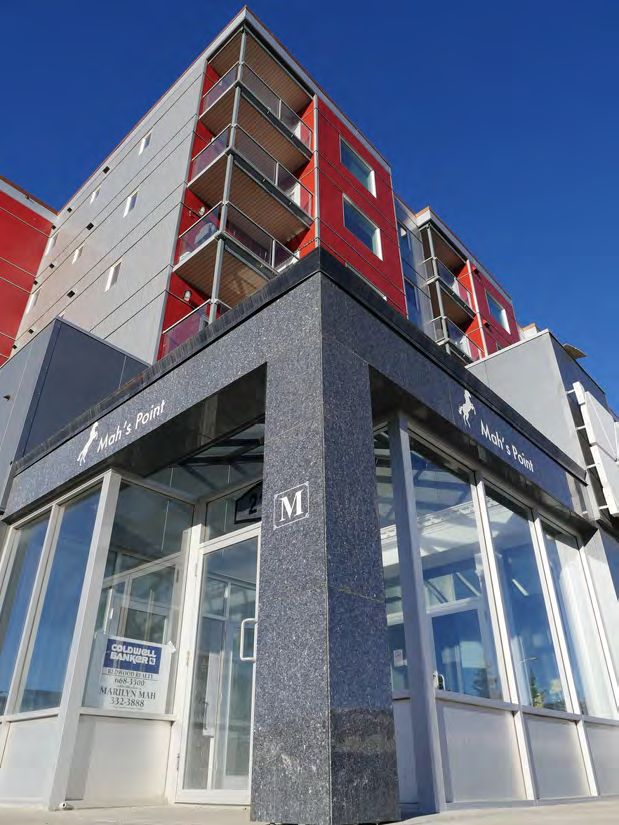
focal point for arts, culture and entertainment in the Downtown, although parking is cited as a barrier to
growth.

The consultant team concludes that Downtown Whitehorse is showing healthy levels of vitality overall.
The increasing residential density of the Downtown, coupled with waterfront revitalization, preservation
of Main Street character, and location of big box retailers in close proximity (versus the highway) are key
strengths. The emergence of micro-retail units, increased presence of mobile vendors, and a growing
complement of “made in Yukon” product are all highly encouraging signs. The waterfront and its cultural
and recreational attractions serve as a perfect complement to the growing presence of specialty retail and
restaurants and cafes in the area. The Horwoods Mall redevelopment is seen as an ideal springboard for
the development of a Railspur Alley-type area showcasing locally-made product in a diversity of business
types and formats ranging from established storefronts to small-scale, mobile vendors.

There are, however, a number of weaknesses in the Downtown that merit monitoring and/or attention by
the City and business community. While there have been significant commercial redevelopments since
2006, they have achieved varying levels of success, partly due to attention (or lack thereof) to basic retail-
commercial design best practices. Parking is perceived to be a major challenge by the business community,
and the City is seen to be an impediment as much as ally in addressing it. Aesthetic values require more
protection in priority areas and the principle of highest and best use could be better applied to highly
strategic built heritage assets located on the waterfront, as well as land-intensive uses located throughout
the Downtown. Connectivity and walkability in the north end of Downtown are also problematic. The
waterfront and other local heritage assets are underleveraged for their storytelling and place-making value
to the city, and the lack of a central point-of-sale for visitors represents a missed opportunity to increase
visitor spending and exposure to local arts and entertainment. Housing affordability is a critical barrier to
private sector growth and success, and its indirect effects - homelessness, poor social cohesion, increased
crime, and low levels of participation in both economic and social spheres of the community – impact
local businesses in a myriad of ways.

The private sector and arts and cultural communities have the primary role to play in creating Downtown
retail-commercial and entertainment vibrancy, but the City of Whitehorse can exercise leadership within
its sphere of policy and funding influence and provide support on a range of business-led initiatives. The
City’s commitments to Downtown beautification, public art, trails, active transportation, and festivals and
events facilitate the success of the Downtown; furthermore, the City interacts with the local business
community as a major procurer and purchaser of goods and services. The City business licensing process
provides an ideal starting point for improved communications with the business community and ongoing
tracking of private sector performance and trends.

Recommendations arising from the 2016 Retail and Entertainment Strategy include the following:

General

    1.    Maintain (or increase) funding for City key quality of life amenities in the Downtown that current
          (and prospective) residents and businesses value: parks, trails, street and sidewalk maintenance,
          beautification, public art, etc.
    2.    Continue to facilitate downtown densification via zoning and incentives for multi-unit residential
          development.
    3.    Continue to actively partner on and promote affordable housing and homelessness initiatives.
    4.    Champion continued place-making efforts along the waterfront, including wayfinding signage and
          enhanced interpretation of the cultural and historic aspects of the Yukon River.
    5.    Develop design guidelines for Main Street and consider the application of streetscape
          improvements from 3rd Avenue and Jarvis north to Black Street in the upcoming Downtown Plan.
    6.    Focus on strategies to improve walkability, active transportation and connectivity in the
          Downtown North and North End areas during the upcoming Downtown Plan.

                                                                                                            iv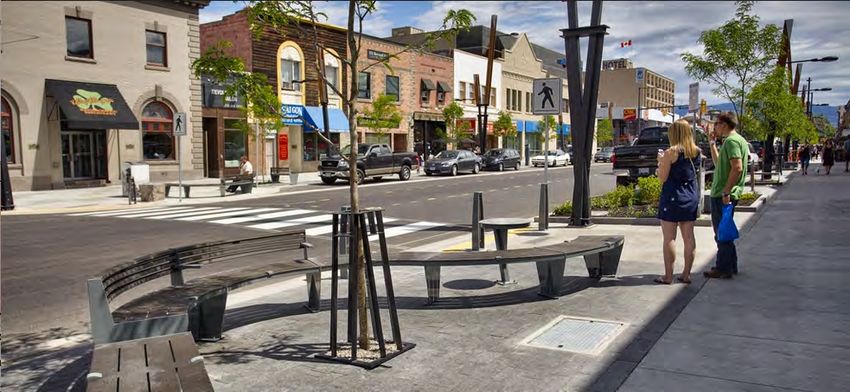
7.   Link to YG and other recruitment/retention initiatives and champion development of a
         Whitehorse-specific investment/resident attraction campaign and website.
    8.   Provide support for “buy local” campaigns.
    9.   Maximize opportunities for local business in City procurement policy and practice.
    10. Pursue low-cost measures to improve Main Street area parking in conjunction with the 2011
        plan, including:
         •    On-line payment and meter “top up” options; and,
         •    A joint effort with the Government of Yukon to encourage employees to use other modes
              of transport.
    11. Improve communications with local businesses, particularly post-planning.
    12. Champion entrepreneurial culture and innovation.
    13. Improve/expand City business-related data gathering and analysis, including the adoption of
        North American Industry Classification System codes and use of the business licensing process to
        track trends and issues.

Arts, Culture and Entertainment

    14. Facilitate coordinated planning efforts and communication among the multiple players involved
        with tourism, arts, and entertainment in the Main Street and waterfront areas.
    15. Identify and implement opportunities to provide more City of Whitehorse family-oriented
        recreational and event-oriented programming in the Downtown.
    16. Facilitate the increased use of Front Street for smaller public events and festivals via the City
        special events approval process.
    17. Implement a paid parking “amnesty” from 5:30 pm on Fridays to 10:00 am on Saturdays1.
    18. Partner on a pilot project with the Yukon Arts Centre to encourage residents to dine
        Downtown and use transit for major programming events.

1Administering the Saturday morning amnesty could involve submission of proof of purchase at a Downtown
entertainment venue, restaurant, or pub/tavern to City of Hall in the following business week for parking ticket
amnesty.

                                                                                                                   v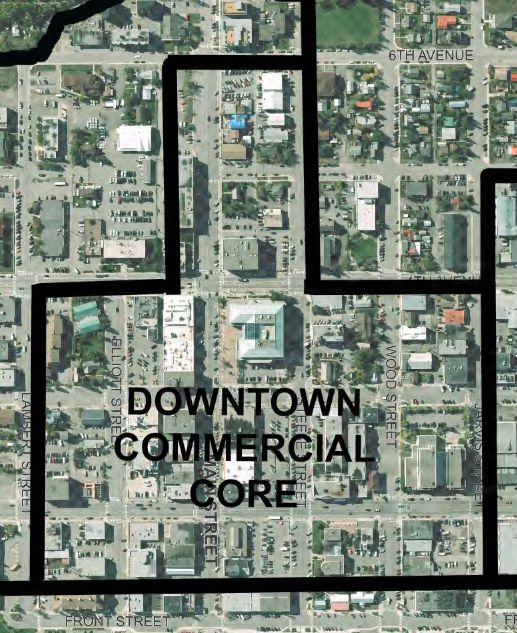
vi
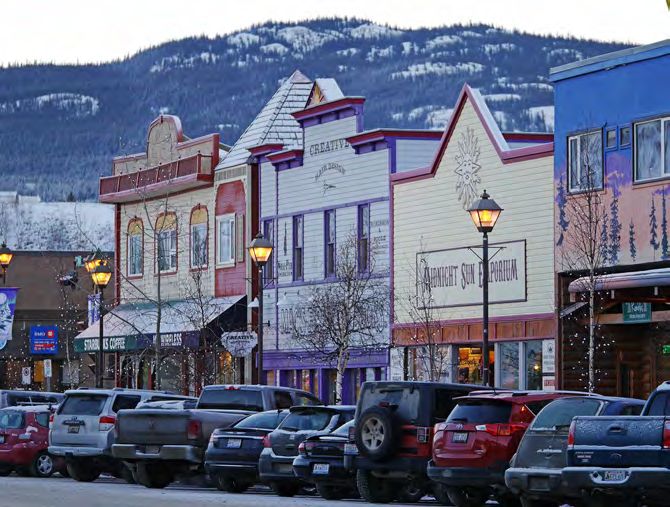
Table of Contents

1.0 INTRODUCTION                                                 1
1.1 PURPOSE AND SCOPE                                            1
1.2 HOW THE STRATEGY WAS DEVELOPED                               1

2.0 RETAIL INVENTORY                                             2
2.1 METHODOLOGY                                                  2
2.2 SUB-AREA INVENTORY ASSESSMENTS                               3
    2.2.1 Riverfront                                             3
    2.2.2 Downtown South                                         4
    2.1.3 Downtown Commercial Core                               5
    2.1.4 Old Town                                               6
    2.1.5 Downtown North                                         7
    2.1.6 North End Service Commercial                           8
2.2 DOWNTOWN COMMERCIAL FLOOR AREA AND POST-2006 CHANGES         9

3.0 ARTS & ENTERTAINMENT INVENTORY                          12
3.1 ARTS & ENTERTAINMENT SECTOR STRUCTURE                    12
    3.1.1 Artists and Performers                             12
    3.1.2 Government Organizations                           13
    3.1.3 Not-for-Profit Organizations                       13
    3.1.4 Private Sector                                     14
3.2 VENUES AND ATTRACTIONS                                   14
3.3 ARTS AND ENTERTAINMENT OPTIONS                           15
    3.3.1 Regular Programming and Events                     15
    3.3.2 Festivals                                          16

4.0 BUSINESS COMMUNITY PERSPECTIVES                         17
4.1 DOWNTOWN RETAILER AND SERVICE PROVIDER SURVEY            17
    4.1.1 Strengths and Weaknesses                           17
    4.1.2 Opportunities and Threats                          18
4.2 STAKEHOLDER INTERVIEWS                                   20
    4.2.1 Strengths and Weaknesses                           20
    4.2.2 Opportunities and Threats                          21

5.0 RESIDENT/CONSUMER PERSPECTIVES                          23
5.1 GENERAL ATTITUDES AND PERCEPTIONS                        23
5.2 CUSTOMER SERVICE                                         24
5.3 AREAS OF RESIDENT/CONSUMER DEMAND                        24

6.0 RETAIL MARKET ANALYSIS                                  26
6.1 DOWNTOWN WHITEHORSE RETAIL TRADE AREA                    26
6.2 TRADE AREA POPULATION GROWTH                             27
6.3 YUKON TOURISM ACTIVITY                                   27
    6.3.1 Visitor Volumes                                    28
    6.3.2 Visitor Spending                                   29

                                                           vii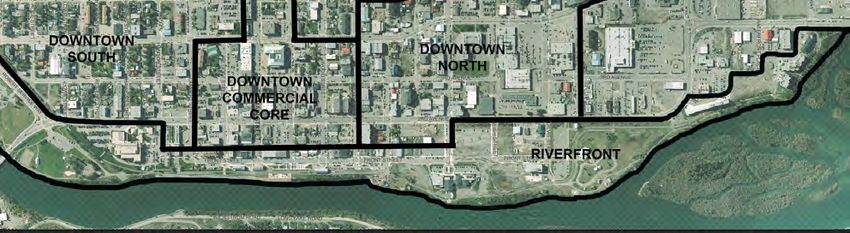
6.4 HISTORICAL ANNUAL YUKON RETAIL SALES                                 30
6.5 CURRENT ANNUAL YUKON RETAIL SALES                                    31
6.6 WHITEHORSE RETAIL DEMAND ANALYSIS BY CATEGORY                        33
    6.6.1 Supermarkets and Grocery Stores                                33
    6.6.2 General Merchandise Stores                                     33
    6.6.3 Clothing and Accessories                                       34
    6.6.4 Restaurants and Taverns                                        34
6.7 CONCLUSIONS                                                          36

7.0 ARTS & ENTERTAINMENT MARKET ANALYSIS                                37
7.1 RESIDENT DEMAND                                                      37
7.2 VISITOR DEMAND                                                       39
7.3 ARTS AND ENTERTAINMENT COMMUNITY PERSPECTIVES                        41
    7.3.1 Strengths and Weaknesses                                       41
    7.3.2 Opportunities and Threats                                      41

8.0 KEY ISSUES & OPPORTUNITIES                                          43
8.1 RESIDENTIAL DENSITY                                                  43
8.2 WATERFRONT AS ARTS/ENTERTAINMENT HUB                                 43
8.3 INTEGRATION OF DOWNTOWN WITH ARTS/ENTERTAINMENT                      44
8.4 PARKING AND PARKING MANAGEMENT                                       44
8.5 HOUSING AFFORDABILITY                                                45
8.6 ECONOMIC LEAKAGE                                                     45
8.7 ENTREPENEURIAL CULTURE AND LEADERSHIP                                46
8.8 HIGHEST AND BEST USES                                                46
8.9 AESTHETIC VALUES AND PLACE-MAKING                                    47
8.10 COMMUNICATIONS, DATA GATHERING, AND COORDINATION                    47

9.0 BEST PRACTICES                                                      48

10.0 CONCLUSIONS AND RECOMMENDATIONS                                    50

REFERENCES                                                              53

KEY CONTACTS                                                            55

APPENDIX A. DOWNTOWN BUSINESS OWNER SURVEY

APPENDIX B. DOWNTOWN BUSINESS OWNER SURVEY RESULTS

APPENDIX C. RETAIL MARKET ANALYSIS DETAILED CALCULATIONS

Photo Credits:
Cover photo upper right, pp. 22, 36, 43, 45, 47 – Derek Crowe Photo
Page 48 – Outland Design.ca
All other images are courtesy Government of Yukon

                                                                      viii
1.0 INTRODUCTION
1.1 Purpose and Scope
A healthy Downtown Whitehorse retail, services and entertainment sector is a priority of the City of
Whitehorse and has been supported in numerous City documents including the 2010 Official Community Plan
(OCP), 2006 Downtown Plan, and 2015 Community Economic Development Strategy. In 2006, a Downtown
Whitehorse Retail Strategy was undertaken in conjunction with the 2006 Downtown Plan in order to achieve a
broad view of both community and commercial interests. In preparing for the 10-year update of the Plan, the
City again wished to examine the status of retail-commercial and entertainment uses in Downtown Whitehorse.
The 2016 Downtown Whitehorse Retail Strategy aimed to:
• Assess, on a quantitative and qualitative basis, the existing retail-commercial infrastructure and arts and
entertainment offer Downtown;
• Assess Downtown Whitehorse retail and service provision strengths, weaknesses, opportunities and
threats from the perspectives of the business community and local residents;
• Analyze changes in Downtown Whitehorse retail-commercial uses since 2006;
• Assess and identify the level of entertainment market support, absorption and general content for
entertainment type uses;
• Review the local and regional entertainment market, its competitive influences, and relevant trends;
• Analyze the market opportunity for entertainment in Downtown Whitehorse;
• Identify merchandising gaps in Downtown Whitehorse;
• Forecast market demand for key retail categories in Whitehorse in terms of sales volume and
warranted building floor area, based on population and expenditure data; and,
• Develop strategies to strengthen the Downtown core for retail-commercial and entertainment uses.
.
1.2 How the Strategy was Developed
The subject study was undertaken over a three month period from December 2015 to March 2016 and included
the following tasks:
• An inventory of Downtown privately owned, non-residential spaces;
• Stakeholder and “expert” informant interviews with 16 individuals and organizations in the retail-
commercial and arts/entertainment sectors;
• Primary and secondary research;
• An updated retail demand analysis and discussion of implications for key categories; and,
• Analysis, discussion and strategy formulation in consultation with City representatives.
12.0 RETAIL INVENTORY
Understanding the current extent and composition of retail-commercial uses in the Downtown is a pre-requisite
to identifying merchandising gaps and forecasting incremental need for future retail-commercial facilities. The
following section provides an overview of the methodology and results of the 2016 Downtown retail inventory.
2.1 Methodology
An inventory of commercial retail, service and office floor area was conducted for Downtown Whitehorse in
January and February of 2016. As in 2006, the inventory was conducted via a field survey and supported off-site
with Google Earth and information provided by business owners and/or building managers. The consultant team
refined the 2006 methodology in an effort to better examine interrelationships between the public and private
sectors, pinpoint entertainment-related uses, and track the frequency and distribution of mixed residential-
commercial uses in the Downtown.
As in 2006, commercial units were categorized according to the nature of their use, with the key focus being
privately owned, non-residential buildings. Accordingly, government, heritage, non-profit (community), and
institutional uses occurring in privately owned buildings were included in calculations of Commercial Retail Unit
Representation. The Professional/Business office category was focused on private sector uses such as doctors,
dentists, architects, engineers, consultants, etc. Health care services such as physiotherapy and massage were
included in the Services category, as were hotels (excluding any co-located Restaurants/Taverns). Vacancies
were noted onsite and cross-referenced with commercial real estate listings.
Floor area estimates for the various commercial retail units were converted into Commercial Floor Area totals
as follows:
Commercial Floor Area Commercial Unit Representation Categories
Uses
Retail Clothing and Accessories, Household Furniture/Furnishings, Food Retail,
Specialty Retail
Service (Entertainment) Restaurants/Taverns (and movie theatres)
Service (Other) Services
Office – Private Sector Professional/Business Office
Office – Public/Not for Government/Heritage/Institutional/Community
Profit Sector
Vacant Vacant
The Downtown sub-areas utilized in the 2006 study were carried over into the 2016 exercise for tracking
purposes. (It should be noted that a minor discrepancy in the delineation of Old Town and Downtown North in
the 2006 study may render comparisons for these sub-areas slightly inaccurate).
Lastly, large public sector buildings and venues/attractions were noted separately for each sub-area but excluded
from Commercial Retail Unit Representation calculations. While these uses may not qualify as commercial units
per se, they do have an indirect impact on commercial uses by virtue of providing a nearby employment node
and thus customer base. Noting these inter-relationships facilitates a broader understanding of Downtown
vibrancy.
22.2 Sub-Area Inventory Assessments
2.2.1 Riverfront
Commercial Floor Area Commercial Retail Unit Representation
FLOOR AREA # %
CATEGORY
COMMERCIAL USE 2 2 % UNITS TOTAL
FT M
TOTAL CLOTHING & ACCESSORIES 3 4
RETAIL 13,123 1219 7 GOVT/HERITAGE/INSTIT/COMM 18 22
SERVICE (ENTERTAINMENT) 22,289 2071 12 HH FURNITURE/FURNISHINGS 0 0
SERVICE (OTHER) 85,494 7943 45 PROFESSIONAL/BUSINESS OFFICE 9 11
OFFICE - PRIVATE SECTOR 11,629 1080 6 RESTAURANT/TAVERN 8 10
OFFICE - PUBLIC/NFP SECTOR 41,564 3861 22 RETAIL FOOD 3 4
VACANT 14,717 1367 8 SERVICES 23 28
TOTAL 188,816 17,542 100 SPECIALTY RETAIL 7 9
VACANT 10 12
Venues/Attractions: The Old Fire Hall, Roundhouse, Waterfront TOTAL 81 100
Trolley, Kwanlin Dün Cultural Centre, S.S. Klondike, Shipyards Park,
Rotary Park NEW/REDEVELOPED UNITS 41 51
2
Major Government Buildings: 140,000 ft
RESIDENTIAL UNITS ATTACHED 2 2
Major Observations for Downtown Riverfront
• This area has undergone a significant transformation since 2006 with construction of the Kwanlin Dün
Cultural Centre, Shipyards Park, and Waterfront/Spook Creek stations and redevelopment of the historic
Horwoods, Old Fire Hall and Roundhouse buildings.
• The increased presence of mobile vendors in Rotary Park and Shipyards Park and the Fireweed Farmer’s
Market are all important steps towards maximizing the vibrancy and draw of the waterfront for residents and
visitors.
• Both mixed-use and all-residential areas should be encouraged in this area to provide a sufficiently strong
market base and ensure vibrancy in the daytime as well as evenings and weekends.
• Anchor attractions and venues have created a cultural/arts orientation; this needs to be nurtured with
compelling wayfinding and interpretive signage and careful attention to aesthetics and urban design.
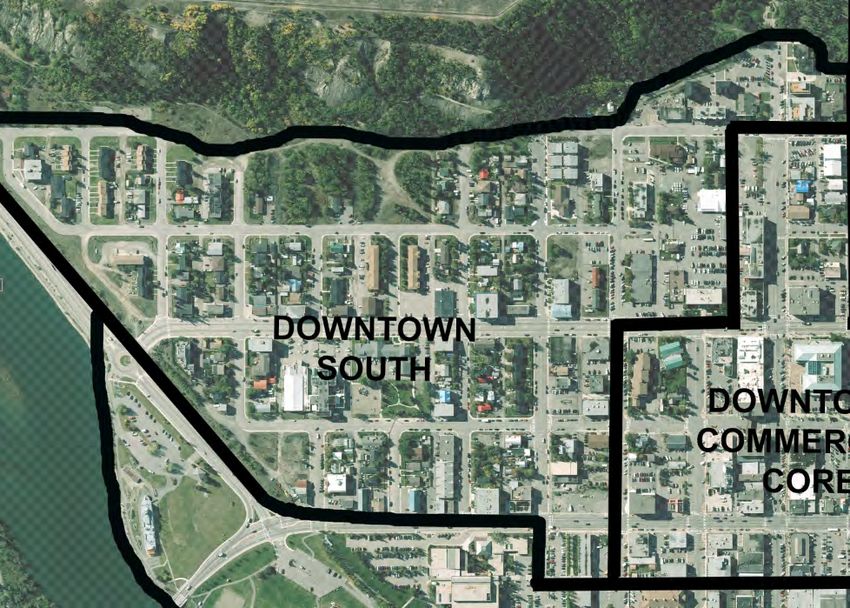
32.2.2 Downtown South
Commercial Floor Area Commercial Retail Unit Representation
FLOOR AREA # %
CATEGORY
COMMERCIAL USE 2 2 % UNITS TOTAL
FT M
TOTAL DRUG STORE/PHARMACY 1 1
RETAIL 24,125 2241 11 GOVT/HERITAGE/INSTIT/COMM 12 15
SERVICE (ENTERTAINMENT) 11,900 1106 5 HH FURNITURE/FURNISHINGS 1 1
SERVICE (OTHER) 99,751 9267 46 PROFESSIONAL/BUSINESS OFFICE 17 21
OFFICE - PRIVATE SECTOR 40,400 3753 19 RESTAURANT/TAVERN 6 7
OFFICE - PUBLIC/NFP SECTOR 35,000 3252 16 RETAIL FOOD 3 4
VACANT 5900 548 3 SERVICES 34 41
TOTAL 217,076 20,167 100 SPECIALTY RETAIL 4 5
VACANT 4 5
Venues/Attractions: Yukon Convention Centre TOTAL 82 100
2
Major Government Buildings: 16,600 ft
NEW/REDEVELOPED UNITS 21 26
RESIDENTIAL UNITS ATTACHED 11 13
Major Observations for Downtown South
• There is an increased footprint of commercial uses throughout this area compared to 2006.
• There has been considerable new construction in this area since 2006, with smaller-scale multi-unit
residential with commercial ground floor space being typical.
• Riverside Grocery remains an important neighbourhood/City-wide serving retail outlet.
• This area is likely to undergo significant future development with proposed mixed residential/commercial
project at Fifth Avenue and Rogers Street and aging government housing building stock. Good connections to
the river and Main Street should remain vital.
42.2.3 Downtown Commercial Core
Commercial Retail Unit Representation
# %
CATEGORY
UNITS TOTAL
AUTOMOTIVE/PARTS SALES 2 1
CLOTHING & ACCESSORIES 4 0.2
DRUG STORE/PHARMACY 1 0.4
GOVT/HERITAGE/INSTIT/COMM 57 24
PROFESSIONAL/BUSINESS OFFICE 37 15
RESTAURANT/TAVERN 24 10
RETAIL FOOD 1 0.4
SERVICES 64 27
SPECIALTY RETAIL 25 10
VACANT 24 10
TOTAL 239 100
NEW/REDEVELOPED UNITS 27 11
RESIDENTIAL UNITS ATTACHED 9 4
Commercial Floor Area
FLOOR AREA
COMMERCIAL USE 2 2 %
FT M Venues/Attractions: Arts Underground,
TOTAL
RETAIL 101,675 9446 15 Lepage Park, MacBride Museum of Yukon
History, Old Log Church, Yukon Theatre
SERVICE (ENTERTAINMENT) 65,050 6043 9
SERVICE (OTHER) 259,252 24,085 37
Major Government Buildings:
OFFICE - PRIVATE SECTOR 70,950 6591 10 131,090 ft
2
OFFICE - PUBLIC/NFP SECTOR 162,759 15,121 23
VACANT 34,400 3196 5
TOTAL 694,086 64,483 100
Major Observations for Downtown Commercial Core
• As in 2006, the Downtown Core is functioning with a healthy level of vitality, with unit vacancy levels at a
reasonable 5%.
• Main Street has retained its diverse mix of retail and service establishments with appeal to both visitors and
residents, as well as numerous government and private sector offices.
• The most notable change since 2006 is the construction of new multi-level office space and redevelopment of
the upper floors of Taku and Hougen’s Centre buildings into office space.
• The west end of Main Street is home to a large undeveloped parcel, as well as retail/service uses (i.e., car lot)
that would be better located elsewhere.
• The pending relocation of a Yukon government department will create about 8000 ft2 of new vacancy in this
sub-area (note: this was not factored into vacancy calculations).
52.2.4 Old Town
Commercial Floor Area Commercial Retail Unit Representation
FLOOR AREA # %
CATEGORY
COMMERCIAL USE 2 2 % UNITS TOTAL
FT M
TOTAL GOVT/HERITAGE/INSTIT/COMM 1 4
RETAIL 4000 372 8 PROFESSIONAL/BUSINESS OFFICE 7 30
SERVICE (ENTERTAINMENT) 4000 372 8 RESTAURANT/TAVERN 1 4
SERVICE (OTHER) 34,125 3170 65 SERVICES 9 39
OFFICE - PRIVATE SECTOR 7250 674 14 SPECIALTY RETAIL 2 9
OFFICE - PUBLIC/NFP SECTOR 875 81 2 VACANT 3 13
VACANT 2500 232 5 TOTAL 23 100
TOTAL 52,750 4901 100
NEW/REDEVELOPED UNITS 7 30
Venues/Attractions: None RESIDENTIAL UNITS ATTACHED 1 4
Major Government Buildings: None
Major Observations for Old Town
• This sub-area is still a relatively low density residential area with limited commercial activity.
• There has been considerable rejuvenation of older residential building stock and construction of smaller
multi-unit residential complexes. This trend toward consolidation of single family lots for redevelopment into
multi-unit residential building forms is likely to continue, at a modest pace, over the next decade.
• High service space proportion has remained consistent and is still appropriate to neighbourhood oriented
commercial nodes.
• Future commercial uses between 5th and 6th avenues should be oriented to the needs of nearby Downtown
residents. The popularity of the recently closed Watershed Café demonstrated a market for a café/meeting
spot not only for neighbourhood use but to complement options in other parts of Downtown.
62.2.5 Downtown North
Commercial Floor Area Commercial Retail Unit Representation
FLOOR AREA %
CATEGORY # UNITS
COMMERCIAL USE 2 2 % TOTAL
FT M
TOTAL AUTOMOTIVE/PARTS SALES 9 4
RETAIL 276,870 25,722 35 CLOTHING & ACCESSORIES 3 1
SERVICE (ENTERTAINMENT) 50,730 4713 6 DRUG STORE/PHARMACY 2 1
SERVICE (OTHER) 244,596 22,724 31 GENERAL RETAIL/DEPT STORE 1 0.5
OFFICE - PRIVATE SECTOR 52,827 4908 7 GOVT/HERITAGE/INSTIT/COMM 28 13
OFFICE - PUBLIC/NFP SECTOR 98,972 9195 13 HH FURNITURE/FURNISHINGS 2 1
VACANT 67,194 6243 8 PROFESSIONAL/BUSINESS OFFICE 21 10
TOTAL 791,189 73,504 100 RESTAURANT/TAVERN 13 6
RETAIL FOOD 8 4
Venues/Attractions: Qwanlin Cinema SERVICES 82 37
2
Major Government Buildings: 73,250 ft SPECIALTY RETAIL 26 12
VACANT 27 12
TOTAL 220 100
Major Observations for Downtown North
• There has been considerable new construction in this NEW/REDEVELOPED UNITS 46 21
area, particularly larger multi-residential unit and some RESIDENTIAL UNITS ATTACHED 19 9
mixed retail/commercial buildings.
• An increased residential population in the 1st to 3rd Avenue blocks of Jarvis/Alexander and near the Kwanlin
Dün Cultural Centre bodes well for entertainment and neighbourhood convenience uses in this area.
• There are interesting new niche developments appearing, specifically a co-working space and the renovation
of a historic building into a pub.
• The redevelopment of anchor tenants at the Qwanlin Mall and the former Canadian Tire building have
improved the aesthetic values and overall vibrancy of the area; however, further improvements could be
made to ensure the success of all business types.
• The pending consolidation of a Yukon government department will create about 10,000 ft2 of vacancy;
however, the offices will relocate about 1.5 blocks north to an even newer multi-storey office complex (note
that this was not factored into vacancy calculations and that the anticipated effect on vacancy rates should be
negligible).
72.2.6 North End Service Commercial
Commercial Floor Area Commercial Retail Unit Representation
FLOOR AREA # %
CATEGORY
COMMERCIAL USE 2 2 % UNITS TOTAL
FT M
TOTAL AUTOMOTIVE/PARTS SALES 10 20
RETAIL 461,807 42,903 77 CLOTHING & ACCESSORIES 3 6
SERVICE (ENTERTAINMENT) 38,277 3556 6 GENERAL RETAIL/DEPT STORE 3 6
SERVICE (OTHER) 75,500 7014 13 GOVT/HERITAGE/INSTIT/COMMUN 2 4
OFFICE - PRIVATE SECTOR 0 0 0 RESTAURANT/TAVERN 9 18
OFFICE - PUBLIC/NFP SECTOR 10,625 987 2 RETAIL FOOD 4 8
VACANT 12,617 1172 2 SERVICES 6 12
TOTAL 598,826 55,633 100 SPECIALTY RETAIL 10 20
VACANT 3 6
Venues/Attractions: None TOTAL 50 100
2
Major Government Buildings: 35,000 ft
NEW/REDEVELOPED UNITS 15 30
RESIDENTIAL UNITS ATTACHED 1 2
Major Observations for North End Service Commercial
• This area has undergone the fewest changes since 2006 as compared to other sub-areas.
• Construction of a major new government office building and transition of the former Klondike Inn (now
Days Inn) to a year-round operation are supportive of overall vibrancy of the area.
• The last remaining large Argus parcels have recently been purchased by the Pattison Group, which has
announced its intention to commence construction of a Save-On Foods in Summer 2016.
• There are virtually no mixed commercial-residential uses in this area.
• The area is highly car-oriented, with poor pedestrian and active transportation links.
• Destination food and specialty retail establishments such as Farmer Robert’s and Icycle Sport offer home-
grown independent retail options in an area that is heavily oriented around national retail chains.
82.3 Downtown Commercial Floor Area and Post-2006 Changes
The total Downtown commercial floor area has increased a total of 32% since 2006, with the addition of
approximately 497,620 ft2 of commercial space for a total of 2,055,620 ft2 (incorporating 2006 categories only).
The largest change in commercial use is attributed to retail, with a 39% increase in floor space. Private sector
office commercial space increased 37%, while service use of floor space increased 25%. This level of growth is in
large part due to the strong trade area population (and thus spending) growth that occurred between 2006 and
2011.
Expanding the calculations to include the 2016 commercial use categories, the consultant team estimates there is
a total of 2,542,743 ft2 of privately owned commercial space in Downtown Whitehorse. Retail and miscellaneous
services comprise the highest proportional use at 35% and 31% of floor space, respectively. Entertainment-
related services (restaurants/taverns and movie theatres) constitute about 8% of commercial use, and private
sector offices comprise about 7%. The proportion of commercial spaces occupied by the public and non-for-
profit sectors are double that of private sector use at 14%. The Downtown-wide vacancy rate is estimated at
5%. Please refer to Table 2.3.
Table 2.3 Summary of Downtown Retail-Commercial Buildings and Changes Since 2006
2016 FLOOR AREA 2006 FLOOR AREA % CHANGE
COMMERCIAL USE 2 2 % % 2 % FLOOR
FT M FT AREA
TOTAL TOTAL TOTAL
RETAIL 881,600 140,571 43 35 632,000 41 +39
SERVICE (ENTERTAINMENT) 192,246 28,610 8 792,000
48 51 +25
SERVICE (OTHER) 798,718 126,032 31 N/A
OFFICE - PRIVATE SECTOR 183,056 28,200 9 7 134,000 8 +37
OFFICE - PUBLIC/NFP N/A N/A N/A N/A
349,795 53,469 14
SECTOR
VACANT 137,328 26,996 N/A 5 N/A N/A N/A
TOTAL – 2006 CATEGORIES 2,055,620 323,414 100 N/A 1,558,000 100 +32
TOTAL 2,542,743 403,879 N/A 100
Typically, retail and service space in a downtown area is either balanced or weighted slightly on the retail side.
As predicted in 2006, the high proportion of service space – attributed to the prevalence of accommodations in
Downtown Whitehorse – decreased slightly from 51% to 48%, retail uses increased 2%, and private sector office
uses increased 1% when comparing 2016 results against 2006 categories.
The relatively small size of the Downtown and high visibility of current vacancies may lead to an impression that
vacancy rates are of concern. Under normal economic conditions, a 5-7% vacancy rate is considered “healthy”
and facilitates the natural movement of businesses at various stages of the life cycle. Considering the private
sector downturn caused by a slumping mining resource sector post-2012, a 5% vacancy rate should be taken as
an encouraging sign.
The consultant team notes the following major changes in the retail-commercial composition of Downtown
Whitehorse since 2006:
• Entry of mid-priced chain restaurants (Ricky’s and Earl’s) into the North End Service Commercial area;
• Entry of several higher-end independent restaurants in other parts of Downtown;
• Increased presence of mobile vendors, particularly in the Riverfront area;
• The successful establishment of micro-retail units in the Horwoods Mall;
9• Increased presence of independent specialty retail stores, particularly in the Riverfront and Downtown
Commercial Core sub-areas;
• Increased representation of independent food retail outlets, including bulk/health food stores,
delicatessans, etc.;
• Redevelopment of the anchor tenants of the Qwanlin Mall and the former Canadian Tire building (now
NVD Place), a key redevelopment opportunity noted in the 2006 study;
• Increased presence of ethnic restaurants since 2006, particularly in the Downtown Commercial Core;
• A geographic redistribution of commercial floor space in the Downtown, with the Downtown North
sub-area space now exceeding that of the North End Service Commercial by about 200,000 ft2) and
Downtown Riverfront business uses almost doubling;
• The emergence of alternatives to traditional office rental arrangements with (co)space, a non-profit co-
working space targeted at local professionals and entrepreneurs; and,
• The establishment of “boutique” pubs/taverns separate from hotels, such as the Dirty Northern Public
House and Woodcutter’s Blanket pursuant to the Liquor Act amendments (also a recommendation of
the 2006 strategy).
The consultant team also notes that several major redevelopment opportunities identified in 2006 remain “in
play”, including the following:
• Yukon Centre Mall (2nd Avenue and Cook Street)
• Jamieson Block
It is important to recognize that while redevelopment in and of itself is a highly positive trend, it is by no means a
guarantee for success for landlords and/or tenants. Whether a space is newly built, redeveloped or other,
attention must be paid to basic principles of retail planning. A mixed-use development should not treat retail and
office spaces equally; retail uses have unique needs (please refer to Part 9.0 for best practices). Redeveloped
properties in Whitehorse have met these principles to varying degrees.
Speaking to broader changes in downtown Whitehorse, all of which directly or indirectly impact the retail and
service sectors, the consultant team offers the following observations:
• A number of large government buildings have been constructed throughout the Downtown area since
2006, including the Health and Social Services/Community Services block in the Downtown North sub-
area and Highways and Public Works/Health and Social Services building on Quartz Road in the North
End Commercial Service sub-area. The result is a more even geographic distribution of
professional/office uses throughout the Downtown and accompanying opportunity for nearby
retail/service clusters, particularly restaurants/cafes.
• A significant building boom has occurred Downtown, particularly higher density mixed residential-
commercial spaces and “high-rise” multi-unit residential buildings (some of which have ground floor
commercial space) in the Downtown North and Riverfront areas. Old Town has undergone a
noticeable revitalization as well. The increased residential density of Downtown and revitalization of
older single family dwellings signals confidence in Whitehorse’s centre as an attractive place to both
live and work. These trends also optimize opportunities for expanding the retail-commercial sectors
and the evening and weekend economies in particular.
• The increased desirability of Downtown as a walkable, compact residential area is likely to render some
commercial uses – particularly those with large space requirements - generally unsuitable for the area.
Two prime examples are the remaining car lots located at the end of Main Street and on 4th Avenue;
these may be better located in closer proximity to other lots in the North End Service area and/or on
Range Road, a short drive from Downtown.
10DOWNTOWN SOUTH RIVERFRONT NORTH END SERVICE COMMERCIAL
2 2 % 2 2 % 2 2 %
COMMERCIAL USE FT M COMMERCIAL USE FT M COMMERCIAL USE FT M
TOTAL TOTAL TOTAL
RETAIL 24,125 2241 11 RETAIL 13,123 1219 7 RETAIL 461,807 42,903 77
SERVICE (ENTERTAINMENT) 11,900 1106 5 SERVICE (ENTERTAINMENT) 22,289 2071 12 SERVICE (ENTERTAINMENT) 38,277 3556 6
SERVICE (OTHER) 99,751 9267 46 SERVICE (OTHER) 85,494 7943 45 SERVICE (OTHER) 75,500 7014 13
OFFICE - PRIVATE SECTOR 40,400 3753 19 OFFICE - PRIVATE SECTOR 11,629 1080 6 OFFICE - PRIVATE SECTOR 0 0 0
OFFICE - PUBLIC/NFP SECTOR 35,000 3252 16 OFFICE - PUBLIC/NFP SECTOR 41,564 3861 22 OFFICE - PUBLIC/NFP SECTOR 10,625 987 2
VACANT 5900 548 3 VACANT 14,717 1367 8 VACANT 12,617 1172 2
TOTAL 217,076 20,167 100 TOTAL 188,816 17,542 100 TOTAL 598,826 55,633 100
DOWNTOWN COMMERCIAL CORE OLD TOWN DOWNTOWN NORTH
RETAIL 101,675 9446 15 RETAIL 4000 372 8 RETAIL 276,870 25,722 35
SERVICE (ENTERTAINMENT) 65,050 6043 8 SERVICE (ENTERTAINMENT) 4000 372 8 SERVICE (ENTERTAINMENT) 43,230 4016 6
SERVICE (OTHER) 259,252 24085 38 SERVICE (OTHER) 34,125 3170 65 SERVICE (OTHER) 244,596 22,724 31
OFFICE - PRIVATE SECTOR 70,950 6591 10 OFFICE - PRIVATE SECTOR 7250 674 14 OFFICE - PRIVATE SECTOR 52,827 4908 7
OFFICE - PUBLIC/NFP SECTOR 162,759 15,121 23 OFFICE - PUBLIC/NFP SECTOR 875 81 2 OFFICE - PUBLIC/NFP SECTOR 98,972 9195 13
VACANT 34,400 3196 5 VACANT 2500 232 5 VACANT 67,194 6243 8
TOTAL 694,086 64,483 100 TOTAL 52,750 4901 100 TOTAL 791,189 73,504 100
113.0 ARTS & ENTERTAINMENT INVENTORY
Arts, culture and entertainment play a prominent role in quality of life for Whitehorse residents and contribute
to the economic and social resilience of the community. The growing recognition of the social and economic
contributions of arts and entertainment is reflected in numerous City plans, policies and strategies in recent
years, including the Community Economic Development Strategy and Strategic Sustainability Plan. The following
sections explore the current status of the arts and entertainment sector and its relationship to Downtown
Whitehorse.
Defining “Entertainment”
3.1 Arts and Entertainment Sector
Structure For the purposes of this study, “entertainment”
includes arts, culture, music, performance, events
The Yukon – and by extension, Whitehorse – is a and festivals. It also includes service sector
uniquely artistic place. A 2014 study by Hill Strategies businesses – specifically restaurants, cafes,
found that the Yukon had the highest percentage of its taverns, etc. - that are often visited for leisure
labour force employed in cultural occupations as and enjoyment. While sport and athletic
compared to other provinces and territories (4.62% competition are generally included under the
versus the national average of 3.82%). A 2004 study1 of banner of “entertainment”, they are not a focus
the cultural sector for the Government of Yukon had for this study.
pegged labour force participation in the cultural
industries at 4.2%; it further noted 10-year growth over 1994 of 33%.
The provision of arts and entertainment in Whitehorse is the domain of a diverse mix of private, public and non-
for-profit organizations, individual artists and performers, and venues and attractions. The following sections
provide a brief overview of the key players.
3.1.1 Artists and Performers
According to Statistics Canada, “artist occupations” include the following:
• Actors and comedians • Musicians and singers
• Artists and craftspersons • Other performers (including circus performers, magicians,
• Authors and writers models, puppeteers, etc.)
• Conductors, composers and arrangers • Producers, directors, choreographers, and related occupations
• Dancers • Visual artists
Zanasi et al. (2004) noted that independent artists/writers/performers constituted the majority of Yukon
workers in fully cultural occupations, followed by employees of heritage institutions, performing arts companies
and radio and television broadcasting. The report,
Occupation Total based on 2001 Statistics Canada data, showed a
Artisans and craftspersons 80 heavy emphasis on artisans, craftspersons and
Musicians and singers 75 musicians in the artistic production occupations.
Writers 35 Please refer to Table 3.1.1.
Producers, directors, choreographers, etc. 30
Graphic designers and illustrating artists 30 An update to the 2004 study was initiated in 2014;
Painters, sculptors and other visual artists 25 however, the data was not available as of the time of
Dancers 20 writing this report. Anecdotally, an estimated 20-25
Actors 10 musicians earn a full-time living from music in
Photographers 10 Whitehorse (Webster, pers. comm). The Yukon
Arts Society lists 47 members, 89 Whitehorse-area
Weavers, knitters, etc. 10
Table 3.1.1 Number of Yukoners in Various Cultural Occupations, 2001
1
Zanasi et al. 2004. The Yukon’s Cultural Labour Force. Study commissioned by the Yukon Arts Centre Corporation. Retrieved from:
http://www.yukonomics.ca/reports/Yukon_Cultural_Labour_Force.pdf
12artists are promoted on the Yukon Department of Tourism and Culture’s Yukon Artist Guide, and 26 artists are
featured on the Yukon Artists at Work website.
3.1.2 Government Organizations
Public governments play a significant role in facilitating arts and entertainment in Whitehorse. Yukon artists
enjoy the highest level of per capita government funding in Canada (Burnet, pers. comm). The Government of
Yukon is the primary funder of arts in the Yukon, and by extension, Whitehorse. The Arts Section of the Yukon
Department of Tourism and Culture administers about $3.84 million in funding annually via the application-
driven Arts Fund, Yukon Cultural Industries Training Fund, Advanced Artist Award, Culture Quest, and Touring
Artist Fund and core funding for the Yukon Arts Centre and The Old Fire Hall via the Yukon Arts Centre
Corporation. The territorial government is a direct buyer of Yukon art via its Yukon Permanent Art Collection.
The government also provides funding support to the territory’s film and sound recording artists via the Yukon
Film and Sound Commission and to the heritage sector via the Museums Unit. The Arts Act provides broad
legislative support for the arts and public appreciation of them.
The City of Whitehorse has an Arts Policy that mandates that 1% of the capital costs of municipal buildings must
be allocated towards the development of public art. The City administers the Recreation and Festivals/Special
Events grants, the Recreation stream including artistic and cultural endeavours. Funding amounts vary from year-
to-year: the Recreation Grant awarded $100,587 and $213,739 in 2012 and 2014, respectively, and the
Festivals/Special Events Grant awarded $108,325 and $20,100 in the same years. The Parks and Trails Branch
lends significant in-kind support to various community events such as the Yukon Sourdough Rendezvous Festival.
The City also owns and maintains Lepage Park, the premier outdoor music venue in Downtown Whitehorse.
Kwanlin Dün First Nation has assumed a leadership role in the arts and culture sector of Whitehorse as the
owner and manager of the Kwanlin Dün Cultural Centre, a waterfront tourism attraction and state-of-the-art
multi-room venue located on the waterfront.
3.1.3 Not-for-Profit Organizations
The Whitehorse arts and entertainment calendar is primarily driven by the activities of a wide range of not-for-
profit (NFP) organizations. A brief overview of key NFP players in Whitehorse is provided in Table 3.1.3.
Table 3.1.3 Key Not-for-Profit Organizations Active in Whitehorse Arts and Entertainment
Category Not-for-Profit Organizations
Visual Arts and Crafts Northern Fibres Guild, Yukon Artists at Work, Yukon Arts Society, Yukon Crafts
Society
Theatre Gwaandak Theatre, Guild Society, Nakai Theatre, Yukon Educational Theatre
First Nation Culture Northern Expressions Cultural Society, Yukon First Nation Cultural and Tourism
Association
Music Frostbite Music Society, Jazz Yukon, Music Yukon, Whitehorse Pop Choir,
Whitehorse Community Choir, Yukon Folk Society, Yukon Women in Music
Dance Breakdancing Yukon Society, Extremely Moving Youth Society, Northern Lights
School of Dance
Film Screen Producers Yukon Association, Yukon Film Society
Heritage/Attractions MacBride Museum, Miles Canyon Historical Railway Society, Old Log Church,
Yukon Historical and Museums Association, Yukon Transportation Museum
NFPs perform a wide range of functions, including developing local artists, staging performances and events,
providing education and training, managing venues and attractions, and creating opportunities for Whitehorse
residents and visitors to view and purchase local arts and crafts. In this latter function, NFPs overlap - and even
compete - with private sector retailers.
133.1.4 Private Sector
The private sector tends to operate in the background of the Whitehorse arts and entertainment scene, but its
role is a critical one nonetheless. The following is a brief overview of the various roles the private sector plays:
Sponsorship – Sponsorship of arts and cultural performances, events, and festivals is one of the most vital roles
that the private sector plays. Most event posters feature numerous sponsors ranging from larger companies to
small consultancies.
Food and beverage – Restaurants and taverns provide the food and beverage portion of the entertainment
spectrum in Whitehorse. They also provide an important venue for local musical performers, with some taverns
featuring musical acts on a frequent basis and restaurants creating weekly musical theme nights.
Retailing - A wide range of “made in Yukon” arts and cultural products – including CDs, books, fine art, and
crafts – are retailed throughout Downtown Whitehorse. The Downtown Commercial Core is the premiere
destination for “made in Yukon” arts and culture-related product; however, there are a few other nodes such as
the Northern Expressions Cultural Society and Fireweed Market retail outlets located in the Downtown North
and North End Service Commercial areas, respectively.
Venues – The Yukon Convention Centre is a privately owned and operated venue that is used for various
entertainment-related events. Arts Underground is a privately owned space that has been donated by the
Hougen family for use by the Yukon Arts Society as a community arts workshop space and gallery.
3.2 Venues and Attractions
Venues and attractions are in many respects the “backbone” of Whitehorse arts and entertainment, typically
providing the space and opportunity through which both Yukoners and visitors interact with local artists and
performers. Please refer to Table 3.2.1 for an overview of Downtown Whitehorse venues and attractions.
Table 3.2.1 Downtown Venues and Attractions
Arts Underground Studio and gallery space on Main Street; home to the Yukon Arts Society and donated
by the Hougen family
Kwanlin Dun Multi-room venue with a range of spaces that can accommodate up to 450 people.
Cultural Centre Features displays of First Nation arts and crafts.
Lepage Park Outdoor performance venue, completed with tiered seating and stage; home to Arts in
the Park in summer
MacBride Museum Located on Front Street, the only heritage attraction in Whitehorse open year-round
Old Log Church Historic church open for visitors in summer and by appointment in winter
Roundhouse & The waterfront trolley operates between Rotary Park and Spook Creek station from
Waterfront Trolley mid-May to mid-September. The Roundhouse is a historic building on Front Street that
serves as the base of trolley operations but is being increasingly used as a venue.
S.S. Klondike Historic sternwheeler managed by Parks Canada via concession each summer
Shipyards Park City of Whitehorse operated park where virtually all major festivals, and the weekly (in
summer) Fireweed Market are staged
The Old Fire Hall Community venue on Front Street managed by the Yukon Arts Centre Corporation;
can accommodate 80-120
Yukon Convention Large venue managed by Coast Hotels/Northern Vision Development
Centre
Yukon Visitor Located on the waterfront, the VIC features a range of interpretive displays and is a key
Information Centre destination for visitors seeking out advice and information.
Other venues and attractions are located outside the Downtown area are shown in Table 3.2.2 as follows:
14Table 3.2.2 Venues and Attractions in Other Parts of Whitehorse
Beringia Centre A Yukon government operated attraction focusing on Ice Age-era Beringia. Open
Sunday and Monday during winter, it includes a theatre that is frequently booked for
community events.
Copperbelt Railway An attraction focusing on Whitehorse/Yukon mining and rail history. Open from
and Mining Museum mid-May to mid-September.
Guild Hall Community theatre space with attached dance school in Porter Creek
Yukon Arts Centre Yukon’s premier arts and cultural facility; includes the mainstage theatre with 428
seats, gallery, and studio space
Yukon Transportation Focusing on the Yukon’s transportation heritage, the museum also functions as a
Museum venue for various community events. Open Sunday and Monday during winter.
It is important to note that both the Kwanlin Dün Cultural Centre and Yukon Convention Centre are typically
busiest during the daytime with government-related conferences, workshops and meetings. A very small
percentage of Yukon Convention Centre bookings are entertainment-related, whereas about 70% of Cultural
Centre bookings are (Robinson, pers. comm). Both reported having considerable evening capacity available.
3.3 Arts and Entertainment Options
3.3.1 Regular Programming and
Events
A look at the various Whitehorse arts and
entertainment calendars in any given week
in will typically yield a broad selection of
options. Stakeholders in the arts and
entertainment community spoke to a shift
in recent years: whereas entertainment
used to be focused around the weekends,
it is now typical to have multiple options
on any day of the week. The following
provides a “snapshot” of regular
programming at a few key arts and cultural
venues in Whitehorse:
Yukon Arts Centre – In 2014/15, the Photo credit: Derek Crowe
Yukon Arts Centre mainstage and studio
were in use a total of 259 and 176 days, respectively. The mainstage was utilized for 43 ticketed YAC events, 75
ticketed events hosted by others, 51 non-ticketed events and 90 rehearsals and technical sessions. The studio
was rented for 145 days; only 31 days were dedicated to YAC use.
The Old Fire Hall – In 2014/15, The Old Fire Hall hosted 179 rental dates during the year, including 33 musical
events, 30 theatre show dates, 14 retail arts and crafts dates, 13 film screenings, 13 community events, 9 talks,
and several book launches.
Wharf – 2014/15 activity included 26 presentations by individual groups, works by 3 visual artists, and 64
performances, workshop and festival events.
Lepage Park – Via the Arts in the Park program, 66 performances and 11 visual artist displays took place from
May to August in 2015.
15You can also read


