2019 Consulate of the Republic of ...
←
→
Page content transcription
If your browser does not render page correctly, please read the page content below

2019


'19 | Latvian Business Guide

TABLE OF CONTENTS
LATVIA IN FACTS								                                         6

LATVIAN ECONOMY OVERVIEW							                                 7

FOREIGN DIRECT INVESTMENT							                               15

INCENTIVES FOR INVESTORS							                                19

PROMISING BUSINESS SECTORS						                               24

HUMAN RESOURCES								                                        27

BUSINESS INFRASTRUCTURE							                                 32

OPERATING ENVIRONMENT							                                   41

FINANCIAL ENVIRONMENT							                                   46

TAXATION									                                              47

QUALITY OF LIFE AND RECREATION						                           50

PROMOTION OF ENTREPRENEURSHIP, INVESTMENT, AND FOREIGN TRADE   53

USEFUL LINKS									                                          66
'19 | Latvian Business Guide

    LATVIA
    IS THE CENTRAL COUNTRY
    OF THE BALTIC STATES
    On the world map, Latvia is located on the east coast of the Baltic Sea at the
    crossroads of Northern and Eastern Europe. Latvia, a parliamentary republic, is
    bordered by Estonia to the north, Russia and Belarus to the east, and Lithuania to the
    south, with a maritime border with Sweden to the west. The total length of Latvia’s
    coastline is 498 km.

    Latvia has almost 2 million inhabitants, of whom almost 1 million live in and around
    the capital city of Riga, the metropolis of the Baltic region. The second largest city
    is Daugavpils, with a population of about 85 000.

    With its relatively small population, Latvia is not a major market, but the country’s
    key advantage is its location, which provides access to its immediate neighbours.
    The population of the three Baltic States totals 6.2 million, approximately equal to
    the population of Denmark. On its doorstep are the Scandinavian countries, with
    25 million people; Russia and the independent CIS states, with a combined population
    of about 280 million; and Eastern Europe, with about 100 million inhabitants. Latvia
    stands out for two major criteria eligible for any investor – infrastructure and labour
    force.

    Latvia’s skilled and multilingual labour force, abundant natural resources, and
    strategic location form a solid foundation for the country’s economy and make Latvia
    the perfect place to develop your business.

4
'19 | Latvian Business Guide

DISCOVER OPPORTUNITIES
FOR YOUR BUSINESS IN LATVIA!
On behalf of the Investment and Development Agency of Latvia (LIAA), I would
like to invite you to discover Latvia and the many opportunities our country
offers your business.

The attraction of foreign investment has been one of our national priorities
and is recognized as a key source of economic growth. LIAA is a state agency
that was set up to promote Latvia as an attractive investment destination and
trade partner. Our services include providing assistance and comprehensive
information on the financial, legal, fiscal, and procedural aspects of doing
business in Latvia, establishing contacts with Latvian partners, and identifying
property options. We tailor our services to suit clients’ individual needs and
provide these services throughout all stages of their investment projects.

One of the key principles of Latvian economic legislation is the equal treatment
of foreign investors and domestic companies. The Latvian government
has acknowledged the importance of establishing a structured dialogue
with foreign investors, represented by the Foreign Investors’ Council, by
implementing majority of the council’s recommendations. Latvia offers
investors a wide array of incentives including support via EU Structural Funds
and a business-friendly environment with appealing tax rebates.

LIAA has developed the POLARIS Process to better serve potential investors,
leading them from their project’s original idea to full implementation using
locally available resources. In this process, central and local governments,
universities and research institutions, and local industry players are brought
together to help potential investors take full advantage of Latvia’s strengths
and advantages.

Latvia can offer its scientific potential to enhance business development
in various fields. We have a number of scientific institutions that already
cooperate in international projects and can offer their services. At the same
time, Latvia continues to support the development of a startup ecosystem,
seeks to promote technology transfer and has also developed a network of
regional business incubators, supported by LIAA.

Businesses operating in Latvia can also take advantage of its EU membership
privileges, which enable the free movement of goods, services, capital
and labour, and its euro-area location. Situated at the very heart of the
economically and culturally vibrant Nordic-Baltic region, companies based in
Latvia can successfully target both the developed economies of the EU and
the emerging markets of its eastern neighbours.

Latvia is now a full-fledged member of the Organisation for Economic
Co-operation and Development (OECD). Following the start of negotiations in
May 2013, Latvia has been subject to a number of technical reviews, which,
among other issues, assessed and approved the quality of public governance
and competition policies.

The Latvian Business Guide, which has been published for more than ten
years, aims to help foreign companies and organizations develop business
contacts with Latvia.

I invite you to discover this newly updated version of the guide and explore
Latvia as a business partner with great potential.

Andris Ozols
Director
Investment and Development Agency of Latvia

                                                                                   5
'19 | Latvian Business Guide

    LATVIA IN FACTS
    International memberships:                         EU and NATO since 2004, WTO since
                                                       1998, OECD since 2016
    Capital:                                           Rīga
    Other major cities:                                Daugavpils, Liepāja, Jelgava, Jūrmala,
                                                       Ventspils, Rēzekne, Valmiera, Jēkabpils
    Population as of 1 January 2017:                   1.950 million
    Time:                                              Eastern European Time (GMT +2 hours)
    Area:                                              64 573 km2
    Language:                                          Latvian (official); Russian, English, and
                                                       German are also widely spoken
    Political system:                                  Republic, parliamentary democracy
    Legal system:                                      Based on civil law
    Main industries (% share in total                  Wholesale and retail trade (14.7%),
    gross value added, 2017)                           manufacturing (12.7%), real estate activities
                                                       (11.7%), transportation and storage (9.2%)
    Exports                                            Wood and wood products, cereals,
                                                       machinery and equipment, transport
                                                       services, financial services, travel
                                                       services, IT services
    Imports                                            Machinery and equipment, food
                                                       products, fuels, chemicals, and vehicles,
                                                       textiles, transport services, travel
                                                       services
    Main trading partners (2017):                      Lithuania, Estonia, Russia, Germany,
                                                       Sweden, the United Kingdom, Poland,
                                                       Denmark, the Netherlands, USA,
                                                       Norway, Finland
    Currency:                                          Euro (EUR)
    GDP at current prices (2017):                      EUR 26.86 billion (USD 30.34 billion)
    GDP per capita (2017):                             EUR 13 855 (USD 15 652)
    GDP growth (2017):                                 4.5%
    GDP growth forecast (2018):                        4.0%
    Inflation rate (2017):                             2.9%
    Accumulated FDI (2017):                            EUR 14.37 billion (USD 16.23 billion)
    Accumulated FDI per capita                         EUR 7 369 (USD 8 325)
    (2017):
    Credit ratings                                     A- / A3 / A- (investment grades)
    (Standard & Poor’s / Moody’s /
    Fitch)

    Sources: Central Statistical Bureau of Latvia, Ministry of Finance of the Republic of Latvia, Bank of Latvia,
    Eurostat, European Central Bank (ECB)

6
'19 | Latvian Business Guide

 LATVIAN ECONOMY OVERVIEW
 Latvia’s economy has experienced one of the highest GDP growth rates in Europe.
 From 2005 to 2007, the average annual GDP growth rate exceeded 10%, when major
 inflows of foreign capital stimulated a significant increase in private consumption.
 In 2008, the country entered a severe recession, as a result of an unsustainable
 current account deficit, collapse of the real estate market, and large private debt
 exposure. During the crisis, GDP fell by a quarter, external debt almost doubled, the
 number of employed persons decreased by 16%, while the real wages of those still
 employed fell by 12%. Latvia successfully emerged from recession at the end of 2010
 and growth has resumed, based mainly on the increasing role of exports.

 From 2011 to 2013, GDP grew by 4.4% per year on average. In 2015, GDP grew by
 2.7%, in 2016 – by 2.0%, while in 2017 – 4.5%. The slowdown of growth in the last
 years was determined by trends in the external environment – slower growth in the
 EU than expected, as well as weakening of the economic situation in Russia.

 However, it must be noted that current export volumes exceed pre-crisis levels by
 more than 25%.

 GDP annual change:

 GDP AND EXPORTS (AT 2010 PRICES), 2010=100
              25

              20

              15
EUR billion

              10

               5

              0
                   2000 2001 2002 2003 2004 2005 2006 2007 2008 2009 2010 2011 2012 2013 2014 2015 2016 2017

                         GDP 			                   Exports of goods and services

 Source: Eurostat

                                                                                                               7
'19 | Latvian Business Guide
The structure of Latvia’s economy has also changed over the years. The proportions
of agriculture, manufacturing and transportation have decreased, while the shares
of trade, tourism, IT and other services have increased.
GROSS VALUE ADDED IN LATVIA BY ACTIVITY TYPE (AT CURRENT PRICES)
100%
A 14.3% 16.5% 15.7% 14.7% 14.7%
B 15.3% 13.0% 13.5% 12.0% 12.7%
C 6.5% 9.5% 10.3% 12.5% 11.7%
D 11.9% 12.3% 10.5% 9.0% 9.2%
E 6.5% 6.9% 8.3% 8.5% 9.0%
F 8.5% 7.3% 7.5% 7.4% 7.5%
G 7.0% 6.7% 5.0% 6.5% 5.9%
H 5.6% 4.6% 4.6% 4.6% 5.0%
I 3.3% 4.4% 3.4% 4.7% 4.0%
J 5.1% 4.3% 4.4% 4.1% 3.9%
K 4.2% 3.2% 4.8% 3.8% 3.8%
L 11.7% 11.3% 11.9% 12.2% 12.6%
0 2000 2005 2010 2015 2017
(A) - Wholesale and retail trade; repair of motor vehicles and motorcycles, (B) - Manufacturing, (C) - Real estate
activities, (D) - Transportation and storage, (E) - Professional, scientific and technical activities; Administrative and
support services; Other services; Households, (F) - Public administration and defence; compulsory social security,
(G) - Construction, (H) - Information and communication, (I) - Financial and insurance activities, (J) - Agriculture,
Forestry and Fishing, (K) - Mining and quarrying; Electricity, gas, steam and air conditioning supply; Water supply,
sewerage, waste management and remediation activities, (L) - Other services.
Source: Central Statistical Bureau of Latvia
In the long-run, Latvia’s GDP per capita has been catching up with the EU average
level. In 1995, it was only at one-third of the EU average, but by 2016 had increased
to two-thirds.
GDP PER CAPITA IN PPS, INDEX (EU28 = 100)
120 116.2 115.5 115.0 113.9 113.8 113.2 113.0 111.9 111.1 110.6 109.8 109.5 109.4 109.0 109.1 108.6 108.6
100
80
62.3 63.8 63.8 64.6
57.1 59.0 56.9 60.5
60 52.6 52.2 52.5
50.4
43.5 45.8
37.9 40.4
40 35.4
20
0
2000 2001 2002 2003 2004 2005 2006 2007 2008 2009 2010 2011 2012 2013 2014 2015 2016
EU(15) EU(28) Latvia
Source: Eurostat
8'19 | Latvian Business Guide
After some moderation in 2014-2016 because of external factors, Latvia’s
economy is set to grow by around 3% per annum over the next years.
According to European Commission forecasts, Latvian economic growth will be
faster than the EU average.
GDP CHANGE, % (FORECAST BY EC)
2018
2019
5,8
Malta 5,1
5,7
Ireland 4,1
4,7
Slovenia 3,6
4,5
Romania 3,9
4,3
Poland 3,7
4,0
Slovakia 4,2
4,0
Hungary 3,2
3,8
Bulgaria 3,7
3,7
Luxembourg 3,5
3,7
Estonia 2,8
3,6
Cyprus 3,3
3,4
Czech Rep. 3,1
3,3
Latvia 3,3
3,1
Lithuania 2,7
3,0
Netherlands 2,6
2,9
Spain 2,4
2,8
Croatia 2,7
2,8
Austria 2,2
2,6
Sweden 2,0
2,5
Finland 2,3
2,3
EU28 2,0
2,3
Germany 2,1
2,3
Euro area 2,0
2,3
Portugal 2,0
2,0
France 1,8
1,9
Greece 2,3
1,8
Denmark 1,9
1,8
Belgium 1,7
1,5
UK 1,2
1,5
Italy 1,2
0,0 0,5 1,0 1,5 2,0 2,5 3,0 3,5 4,0 4,5 5,0 5,5 6,0
Source: Spring 2018 Economic Forecast, European Commission
9'19 | Latvian Business Guide
Latvia is an open economy with close links to trading partners in the region. Latvia’s
main trading partners are EU countries with 75% of total turnover by value of goods.
Broken down by country, the most significant export markets are Lithuania, Estonia,
Russia, Germany and Sweden. The main importers to Latvia are Lithuania, Germany,
Poland, Estonia and Russia.
In recent years, Latvia’s exports have been affected by Russia’s economic downturn and
EU-Russia reciprocal sanctions. As a result, in the period from 2013 to 2016, Latvian
exports to Russia have decreased by 32%, however, it is only 8.4% from total exports
from Latvia.
At the same time, Latvia has increased export volumes to other world markets during
this period. Exports of goods have increased to EU countries, strategically the most
important trading partners. Similarly, Latvian exporters have actively diversified their
operations into more remote regions of the world such as India, Japan and Egypt,
amongst others.
EXPORT OF GOODS FROM LATVIA, BY COUNTRY (EUR BILLION)
10.4 11.4
1.6 6.7
4.1 TOTAL
Lithuania
Estonia
Russia
Germany
Sweden
UK
Poland
Other
2000 2005 2010 2015 2017
Source: Central Statistical Bureau of Latvia
Also import to Latvia comes from EU countries such as Lithuania, Germany, Poland,
having only a small portion of import from Russia.
IMPORT OF GOODS TO LATVIA, BY COUNTRY (EUR BILLION)
2.8 12.5 14.0
6.9 8.4
TOTAL
Lithuania
Germany
Poland
Estonia
Russia
Finland
Netherlands
Other
2000 2005 2010 2015 2017
Source: Central Statistical Bureau of Latvia
10'19 | Latvian Business Guide
Most of Latvia’s exported goods are agricultural and food products (mainly cereal
products), as well as wood and its articles, metals and their articles, vehicles,
construction materials.
EXPORT OF GOODS FROM LATVIA BY GROUPS OF COMMODITIES
(EUR BILLION)
10.4 11.4
1.6 6.7
4.1 TOTAL
Agriculture and
food products
Machinery,
mechanical appliances,
electrical equipment
Wood and
articles of wood
Base metals, articles
of base metal
Products of the chemical
or allied industries
Vehicles, aircraft, vessels;
other transport equipment
Mineral fuels, mineral
oils and products
Other
commodities
2000 2005 2010 2015 2017
Source: Central Statistical Bureau of Latvia
Latvia’s main imported goods are machinery and equipment, food products, fuels,
chemicals, vehicles and textiles.
IMPORT OF GOODS TO LATVIA BY GROUPS OF COMMODITIES
(EUR BILLION)
12.5 14.0
2.8 8.5
6.9
TOTAL
Machinery,
mechanical appliances,
electrical equipment
Agriculture and
food products
Products of the chemical
or allied industries
Vehicles, aircraft, vessels;
other transport equipment
Mineral fuels, mineral
oils and products
Base metals, articles
of base metal
Other
commodities
2000 2005 2010 2015 2017
Source: Central Statistical Bureau of Latvia
11'19 | Latvian Business Guide
The most important exported services from Latvia are transport (by road, sea and
railway). Export revenue from construction, transport (especially post services),
computer and IT services is also increasing.
EXPORT OF SERVICES FROM LATVIA (EUR MILLION)
1107 4355 4890
3050
1990
TOTAL
Transport
Travel
ICT Services
Financial and
insurance
services
Construction
Other
2000 2005 2010 2015 2017
Source: Bank of Latvia
Latvia mainly imports transport services (by air, road and sea) and travel services.
IMPORT OF SERVICES TO LATVIA (EUR MILLION)
625 2276 2645
1293 1749
TOTAL
Transport
Travel
ICT Services
Financial and
insurance
services
Construction
Other
2000 2005 2010 2015 2017
Source: Bank of Latvia
12'19 | Latvian Business Guide
The current account deficit in 2017 was 0.8% of GDP. It should be noted that
the current account deficit has been significantly improved since 2009, which
demonstrates the stable external balance of the Latvian economy.
CURRENT ACCOUNT, % OF GDP
2
38
1
25
S 2
2
1 2
2 2
13 2
S
C 7.8 S
S S S S S
S
C 1.4
0 C 2.0
C - 3.2 C - 2.7 C - 1.7 C - 0.5 C - 0.8
G C - 3.6 G
G
-13 G G
G
G
G G
-25
1
-38
2009 2010 2011 2012 2013 2014 2015 2016 2017
(C) Current Account, (G) Goods, (S) Services, (1) Primary Income, (2) Secondary Income
Source: Bank of Latvia
Latvia’s fiscal policy is focused on ensuring sustainable economic growth and
implementing responsible fiscal policy in line with the conditions of fiscal discipline.
Since the economic crisis, significant improvements have been achieved in Latvia’s
fiscal position. In 2017, the general government budget deficit was € 131.1 million
or 0.5% of GDP. The Saeima (parliament) approved the Law on the State Budget
for 2018 with a budget deficit of 1% of GDP, this being in line with the permissible
budget-deficit amount arising from the specific structural-balance target.
GOVERNMENT DEFICIT, % OF GDP
0 0.1
-0.9 -0.4 -0.5 -0.5
-0.5 -1.2 -1.4
-1.5 -1.2 -1.5 -1.6
-2.3 -1.6 -0.9 -1.0
-2 -2.5 -2.3
-2.8 -2.5
-2.6 -3.2 -2.9
-3.3
-4.2 -4.3 -4.3
-4
-4.6
-6 -6.4
-6.6
-8
-9.1 -8.7
-10
2002 2003 2004 2005 2006 2007 2008 2009 2010 2011 2012 2013 2014 2015 2016 2017
EU Latvia
Source: Eurostat
13'19 | Latvian Business Guide
Latvia’s overall government debt increased during the crisis between 2008 and
2010. After successful completion of its international loan programme, Latvia has
repeatedly proved its ability to attract finance on international financial markets under
favourable conditions, through organising the issuance of public debt securities.
Overall government debt is still one of the lowest in the EU, being € 10.782 billion
or 40.1% of GDP in 2017.
GOVERNMENT CONSOLIDATED GROSS DEBT, % OF GDP
100
83.9 85.8 86.5 84.5
81.5 83.3 81.6
78.9
80 73.4
60.4 60.9 61.5 60.1 60.8
58.8 57.5
60
46.8
42.7 41.2
35.8 39.0 40.9 40.5 40.1
40 36.8
18.2
20 13.7 14.0
13.0 11.4 8.0
9.6
0
2002 2003 2004 2005 2006 2007 2008 2009 2010 2011 2012 2013 2014 2015 2016 2017
EU Latvia
Source: Eurostat
This prudent fiscal discipline has resulted in Latvia improving its sovereign credit
ratings. International credit rating agencies have rated Latvia’s institutional strengths
positively.
LATVIA’S LONG-TERM FOREIGN CURRENCY ISSUER RATINGS
Moody’s S&P / Fitch
Moody’s
A1 A+
A2 A
A3 A-
Baas1 BBB+
Baa2 BBB
Baa3 BBB-
Ba1 BB
Ba2 BB
Ba3 BB-
‘00 ‘01 ‘02 ‘03 ‘04 ‘05 ‘06 ‘07 ‘08 ‘09 ‘10 ‘11 ‘12 ‘13 ‘14 ‘15 ‘16 ‘17 ‘18
S&P
A1 A+
A2 A
A3 A-
Baas1 BBB+
Baa2 BBB
Baa3 BBB-
Ba1 BB
Ba2 BB
Ba3 BB-
‘00 ‘01 ‘02 ‘03 ‘04 ‘05 ‘06 ‘07 ‘08 ‘09 ‘10 ‘11 ‘12 ‘13 ‘14 ‘15 ‘16 ‘17 ‘18
Fitch
A1 A+
A2 A
A3 A-
Baas1 BBB+
Baa2 BBB
Baa3 BBB-
Ba1 BB
Ba2 BB
Ba3 BB-
‘00 ‘01 ‘02 ‘03 ‘04 ‘05 ‘06 ‘07 ‘08 ‘09 ‘10 ‘11 ‘12 ‘13 ‘14 ‘15 ‘16 ‘17 ‘18
Minimum investment grade
Sources: Treasury of the Republic of Latvia
14'19 | Latvian Business Guide
FOREIGN DIRECT INVESTMENT
At the end of 2017, foreign direct investment (FDI) stock in Latvia amounted to € 14.37
billion (53.5% of GDP). FDI split by sectors shows that most investment is attracted
by financial intermediation (24.3%). Others of the largest foreign investments have
been accumulated in trade (14.4%), real estate operations (13.3%) and manufacturing
(11.8%).
FOREIGN DIRECT INVESTMENT BY ACTIVITY TYPE (EUR BILLION)
13.5 13.5 14.4
8.2
4.2 TOTAL
Financial
and insurance
activities
Trade;
Accommodation
and food service
Real estate
activities
Manufacturing
Mining and quarrying;
Electricity and gas supply;
Water supply, sewerage,
waste management
Transporting
and storage
Agriculture,
forestry and fishing
Construction
Information
and communication
Not allocated
economic activity
Other
2005 2010 2015 2016 2017
Source: Bank of Latvia
In 2016, FDI reduced by € 24 million, which is mainly related to the decreasing
value of FDI stock in financial intermediation. It should be noted that cross-border
investment flows have decreased all over the world in general, mainly because
of the instability of the global economy, increased geopolitical risks and political
unpredictability. However, accumulated FDI at the end of 2017 was 6.8% higher than
it was in 2016.
15'19 | Latvian Business Guide
Most of Latvia’s FDI comes from other EU member states. At the end of 2017, FDI
from the EU states represented 78% of all accrued FDI, including 51% represented
by investment from euro-area countries. At the end of 2017 the largest amount
of investment was from Sweden – 19% of the total FDI stock in Latvia’s economy.
Investment from Russia, Estonia, Cyprus, the Netherlands, Lithuania, Luxembourg,
Germany, Denmark and the United Kingdom has also reached high levels.
FDI STOCK IN LATVIA BY COUNTRY, 2017
Sweden 19%
Russia 10%
Estonia 9%
Cyprus 8%
Netherlands 8%
Lithuania 7%
Luxembourg 5%
Germany 5%
Denmark 4%
United Kingdom 3%
Malta 3%
Other ('19 | Latvian Business Guide
SOME OF THE FDI SUCCESS STORIES
Cabot Corporation is a leading global specialty chemicals and performance materials
company from the United States of America. Headquartered in Boston, the 130-year
old company has 44 manufacturing facilities in 21 countries around the world.
Cabot opened its business service centre in Riga, Latvia in 2014. Staffed with over
125 people, the centre provides business, financial, IT, purchasing and customer
services to the company’s operations in Europe, the Middle East and Africa. Latvia’s
highly advanced IT infrastructure, convenient connections to other countries from
the Riga International Airport, the depth of the talent pool, the growing services
capabilities and the cost structure appealed to Cabot.
The young and capable workforce in Latvia have exceeded every expectation on
the quality, the caliber, the enthusiasm and the ambition.
Kvist Industries is one of the leading suppliers of high-quality wood items for the
furniture industry. Headquartered in Årre, Denmark the company now employs more
than 700 people, and around 600 of them are based in the facility in Latvia. With the
long history of wood know-how and the company’s clear vision, Kvist Industries has
become the preferred partner from design to final delivery for many recognizable
Scandinavian brands worldwide.
The Kvist Industries manufacturing facility at Upmalas, Mālpils region began
operations in autumn 2011, when the company finalized the purchase of a plant. With
continuous investments in the manufacturing plant, Kvist Latvia has now become the
leading factory in the group and output has been growing at around 40% annually.
One of the main reasons for choosing Latvia for a location was proximity to the
Scandinavian market, where the majority of the company’s customers are located.
The region’s qualified and skilled workforce, as well as the general conditions of
Latvia’s economy also played important roles in the decision.
French company Axon Cable is a wiring systems designer and manufacturer of
electronic components, including cables and connectors. Established in 1965,
today the company focuses on niche markets, such as servicing the space, medical,
automotive, telecommunications, energy and military industries.
The Axon Cable enterprise in Latvia specializes in the manufacturing of high-tech
cable connections and connectors, being also an expert in plastic over-moulding,
and makes products for Airbus.
17'19 | Latvian Business Guide
In its fifteenth year of operations in Latvia, the company’s annual turnover for this
facility in 2017 was € 25.4 million. In total, the company employs 460 people.
The products manufactured at Axon Cable find their way to the most diverse sectors
of the world market:
• Defence & aerospace – 33%
• Automotive – 25%
• Oil research – 13%
• Others – 29%
The educated labour force, especially with their knowledge of the English and
Russian languages, coupled with the support of the Investment and Development
Agency of Latvia (LIAA) made an impression on the company.
Axon Cable General Manager Alain Guenon, who leads the operations in Latvia,
notes “Our first contact with LIAA was very positive. They helped us to discover
Latvia.”
One of the leading manufacturers of hygienic and cosmetics goods in Russia, iCotton
makes a wide range of products, including wet wipes, baby products, household
goods and household chemicals. iCotton has distribution networks in Ukraine,
Belarus, Kazakhstan, Moldova, Tajikistan and Uzbekistan and is trading mainly in
Poland, Czech Republic, Germany, Hungary, Italy, Scandinavia and CIS countries.
To reach the European markets, iCotton was looking to establish a manufacturing
facility in one of the European Union countries, and began operations in Latvia
in 2011, based on the country’s workforce quality, especially the language skills,
advantageous manufacturing costs and the central location. Located in the Baltic
Sea port city of Liepaja, the company benefits from receiving corporate income tax
(CIT) rebate for its initial long term investment in Latvia.
In 2016, the Italian-Russian joint venture iCotton launched a new production line,
investing EUR 8.1 million, co-financed by European Union funds and Citadele bank. The
new production line that performs a full production cycle starting from non-woven fabric
to cotton pads and a wide range of other products strengthens the company’s position
in the market, making it the leading manufacturer of cotton products in the Baltics.
iCotton Executive Director Sergejs Binkovskis notes, “Latvia impressed us with
accessibility and ease of communication with municipalities and national
government institutions which have been helping us to implement our projects.”
Latvian iCotton has acquired 3,852,200 shares in Harper Hygienics, the Warsaw
Stock Exchange (WSE)-listed producer of skin cleaning products such as cotton pads,
in the tender offer. As a result, the company increased its stake by 6.05 percent to
66 percent.
Source: Investment and Development Agency of Latvia
18'19 | Latvian Business Guide
INCENTIVES FOR INVESTORS
Latvia offers investors a wide array of incentives, including support via EU Structural
Funds and a business-friendly environment with appealing tax rebates. Businesses
operating in Latvia can also take advantage of its EU membership privileges, which
allows the free movement of goods, services, capital and labour, and euro-area
location.
The Latvian government continues to work on developing a favourable climate for
foreign investment by improving the business environment. Legal and administrative
requirements are being eased, thus facilitating cooperation between international
and local non-government partners.
STATE AID PROGRAMMES, 2014-2020
The total amount of state and EU Structural Fund financing granted for
government-support programmes is approximately € 818.95 million up to 2020.
State-aid programmes are focusing on the following three areas:
(1) research, technology development and innovation;
(2) raising the competitiveness of small and medium-sized enterprises (SME) –
including business incubators, initiatives providing financing, development of
industrial areas/parks, support to foster tourism and exporting competitiveness,
and employee-training programmes;
(3) transition to an economy with less carbon emissions in all industries, energy
efficiency and more efficient district-heating systems.
The planned funding for innovation and research is € 195.5 million, for initiatives
targeted at supporting SMEs – € 288.6 million, and for reducing carbon emissions
in all industries, and energy efficiency – € 334.85 million.
Promotion of Innovation
The goal of these activities is to promote business operations with high added value
by providing support for the development of new products and technologies, as well
as fostering cooperation between the research and business sectors.
Innovation is comprised of the following sub-programmes: Competence centres –
€ 64.3 million, Implementation of new products into production – € 60.0 million,
Employee training – € 24.9 million, Technology transfer, Vouchers for innovation and
Activities for attracting highly qualified employees – € 40.6 million, and Activities for
raising motivation – € 5.7 million.
Raising the competitiveness of SMEs
The goal of these activities is to promote business start ups by providing support at
early stages, providing access to finance, as well as facilitating the competitiveness
of Latvian enterprises in foreign markets.
Support for SMEs is comprised of the following sub-programmes: Financing
(guaranties, credits) – € 81.0 million, Risk/Venture capital – € 60.0 million, Business
angels – € 15.0 million, External Markets and Promotion of Latvia as a tourism
destination – € 60.9 million, Business incubators – € 25.7 million, Development
of industrial zones – € 24.8 million, Technology accelerators – € 15.0 million, and
Cluster programmes – € 6.2 million.
19'19 | Latvian Business Guide
Energy efficiency
The goal of these activities is to promote energy efficiency and renewable energy
usage in residential, manufacturing and public buildings, as well as in district-heating
systems.
Energy Efficiency is comprised of the following sub-programmes: Energy
efficiency in residential buildings – € 166.5 million, Energy efficiency in public
buildings – € 82.6 million, Energy efficiency in industrial buildings – € 32.55 million
and District-heating systems € 53.2 million.
TAX INCENTIVES
SPECIAL TAXATION REGIMES
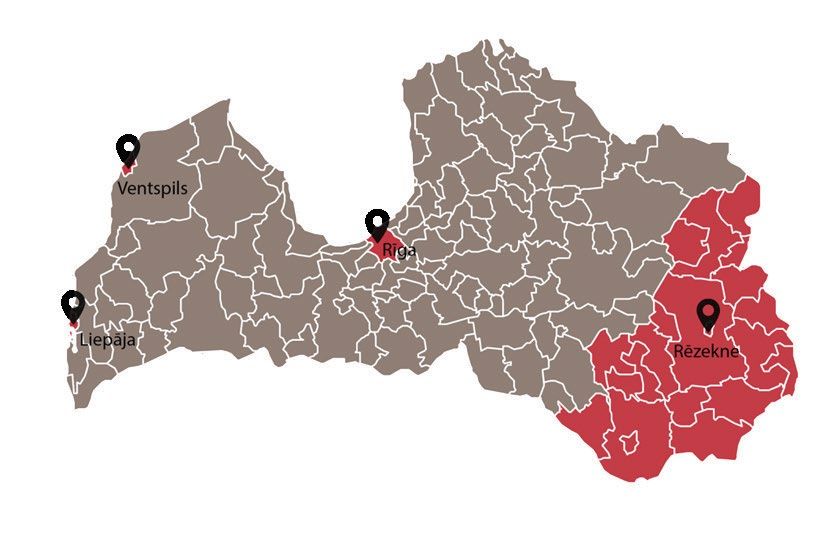
Latvia has five Special Economic Zones (SEZ):
• Riga Free Port (www.freeportofriga.lv),
• Ventspils Free Port (www.portofventspils.lv),
• Liepaja Special Economic Zone (www.liepaja-sez.lv),
• Rezekne Special Economic Zone (www.rsez.lv),
• Latgale Special Economic Zone (www.invest.latgale.lv/en)
The main benefits for companies operating in Free Ports and SEZs are:
• Up to 80% rebate on real estate tax (1.5% in Latvia)*
• 80% rebate on corporate income tax**
• 80% rebate on withholding tax for dividends, management fees and payments
for the use of intellectual property for non-residents (rates for each type of
withholding tax vary)*
* The maximum accumulated amount compensated to the company by these conditions collectively
is 35% (45% for medium and 55% for small enterprises) of the company’s total ongoing investment of
up to 50 million Euros.
** Applies in case of withdrawal of dividends. Otherwise CIT in Latvia is 0%.
Please note that this example is of informative nature only. Exact tax calculations are provided by
respective divisions of State Revenue Service (www.vid.gov.lv).
20'19 | Latvian Business Guide
EXAMPLE (for dividends withdrawal):
Investments = 10 million EUR
Gross Profit = 1 million EUR
Real Estate Cadastral Value = 1 million EUR
Taxation in Latvia:
Tax on Dividends (20%)* = 250 000 EUR
Real Estate Tax (1.5%) = 15 000 EUR
Totally applied = 265 000 EUR
Taxation in SEZ:
Tax on Dividends (4%) = 50 000 EUR
Real Estate Tax (0.3%) = 3 000 EUR
Totally applied = 53 000 EUR
Savings per year:
265 000 EUR - 53 000 EUR = 212 000 EUR
* Before applying tax, dividends are divided by coefficient 0.8, effective tax rate is 25%.
SUPPORT FOR STAFF TRAININGS
The aim of the program is to provide the support for training to facilitate the
attraction of investors
The program is meant for companies who establish businesses in Latvia
Available funding:
1) Total available funding: 2.9 million EUR
2) Approximate amount of public financing provided to individual project:
~250 000 EUR
3) Intensity: 60% for medium and 50% for large enterprises
Eligible trainings:
• All types of training organized by LIAA or provided by linked enterprise which
are necessary for product, process, marketing or introducing innovation in the
organisation
The training has to be aimed at bringing about an innovation - product, process,
marketing or organizational innovation.
21'19 | Latvian Business Guide
Eligible costs:
1) For training organized by LIAA:
a. training course costs
b. transportation costs of employees
c. salaries of employees for training period
2) For training abroad provided by linked enterprise of company:
a. salaries of employees for training period
b. accommodation costs for training period
c. transportation costs of employees
Expected requirements for the company:
1) Total turnover for the linked enterprise group exceeds €5M in the last financial
year
2) At least 10% if equity shares are controlled by foreign company
3) At least 15 jobs created or €1M invested in the equity (from the moment when
the company will submit training project to the completion of the training project)
4) The trained persons employed directly in the company
Companies are eligible to apply for support if their represented business sector
(applied project) falls within one of the “Smart specialization strategy (RIS3)”
identified priority areas:
• Knowledge-intensive bio-economy (research and creation of new products and
services as well as improvement of quality and production efficiency of existing
products and services in bio-sectors - agriculture, food production, forestry and
fisheries sector)
• Biomedicine, medical technology and biotechnology
• Intelligent materials, engineering and technology (for example – smart
communication with customers, smart resources monitoring system, high degree
of automation, intelligent technologies in the transport flow control)
• Smart energy
• Information and Communication Technologies
Additional details
• The training organized by LIAA must be an outsourced service. Trainings abroad
are eligible
• The training abroad must be provided by linked enterprise of the company- term
‘’linked enterprise’’ is defined in European Commission regulation Nr.651/2014
Annex No.1, section 3 paragraph 3
• There will have to be a contract in place between LIAA and the investor
• The training program must have a clearly defined start and finish with highly
predicable outcome
• The training will have to be aimed at bringing about an innovation of a sort;
for example, training is expected to lead to a new product, process, marketing
approach, organizational structuring, etc. (within the company)
22'19 | Latvian Business Guide
THE POLARIS PROCESS
To better serve potential investors, LIAA has developed the POLARIS Process.
The key to this unique methodology is collaboration between all stakeholders,
which enables high-level state institutions, municipalities, universities, industry
associations and private companies to be integrated into a harmonized system for
support and assistance to existing and potential investors, at all stages of investment
projects. The aim of the POLARIS process is to enable efficient communication,
cooperation and execution of tasks among the broad range of stakeholders involved
in investment projects.
LIAA’s support does not end once investors decide to proceed with their investment.
The POLARIS Process starts even before investors meet with LIAA and only ends well
after the project has been implemented. LIAA provides in-depth knowledge of sectors,
project-management support, and project-execution support, and then follow up
and measurement of results in order to keep improving the process. For each step
of the process, POLARIS defines the tasks to be undertaken by each stakeholder.
OPEN AND ATTRACTIVE ENVIRONMENT
FOR BUSINESS
By law, foreign investors have the same
rights and duties as local investors
EQUAL
Foreign companies registered in Latvia
TREATMENT are entitled to buy land and property
OF FOREIGN
INVESTORS
The foreign investor may be the sole
founder and owner of a company
INVESTOR
The foreign investor may request
a temporary residence permit
Efficient start-up procedure (company
registration in 1 day)
Active dialogue between the Foreign
Investors’ Council in Latvia (FICIL)
and government institutions
23'19 | Latvian Business Guide
PROMISING BUSINESS SECTORS
On the basis of Latvia’s comparative advantages, LIAA places particular focus on
eight promising sectors with appealing potential for foreign investment.
WOODWORKING
Summary
The woodworking sector is one of Latvia’s most important export industries and plays
a key role in generating rural and regional employment. The industry’s success is
based on Latvia’s favourable combination of vast forest resources, strategic location,
industry expertise and cost-efficient labour force. Additionally, government policies
aimed at achieving sustainable forestry development have supported the industry’s
success.
Key Advantages
• Traditionally strong sector
• Easy access to raw material
• Abundance of skilled labour
• High private investment in R&D
• Sustainability of the industry
METALWORKING AND MECHANICAL ENGINEERING
Summary
Metal processing and engineering has historically been one of the leading industrial
sectors in Latvia, as the country was one of the high-tech manufacturing centres for
the Soviet military and aerospace industries. Key advantages of the sector include
its skilled and cost-efficient workforce, strong R&D capability, and access to metal
supplies from Russia and markets in the west. Multiple foreign and local companies
have integrated their production processes into the global supply chain, having most
of their production exported.
Key Advantages
• Highly developed logistics and communications infrastructure
• Supportive government policies
• Traditionally a leading sector with historical know-how
• Easy access to raw materials thanks to advantageous geographic location
• Competitive labour force
• Highly competitive in higher value products
• Shift towards more sophisticated production
TRANSPORT AND STORAGE
Summary
Latvia is located at the heart of Europe’s fastest-growing area – the Baltic Sea
region. The transport and storage sector’s success is based on Latvia’s favourable
combination of an advantageous geographic location, providing access to the
Russian and Western European markets; a competitive labour force, and excellent
infrastructure with three ice-free ports, the best railway connection to Russia, and a
growing air transport sector.
24'19 | Latvian Business Guide
Key Advantages
• Historic transport and trade gateway
• Access to Russian and European markets
• Excellent infrastructure
• Diversified alternatives; no bias towards road transport
• Three ice-free ports
• Development of air transport sector
• Riga International Airport is a regional hub serving more than 40% of all Baltic
airline passengers
• Competitive and multilingual labour force
INFORMATION TECHNOLOGY
(INCLUDING GLOBAL BUSINESS SERVICES)
Summary
Latvia’s IT sector provides substantial competitive advantages to investors, mainly
through the availability of highly skilled IT professionals, language skills, and a
combination of Western-style working culture with proximity to and knowledge of the
Russian market. A highly developed communications and logistics infrastructure and
very high labour productivity.
Global Business Services are also rapidly developing in Latvia. It is becoming very
popular for companies from Scandinavian countries to choose Latvia as a place to locate
their business service centres because of language knowledge, cultural compatibility,
accessibility and cost effectiveness. In addition, a number of internationally known
chemical producers have chosen Riga as their destination for shared service centres
(SSC).
Key Advantages
• A skilled, multilingual labour force and high investment in tangible assets
contribute to productivity
• Well-developed export market
• Knowledge of foreign languages among IT professionals
• Superb efficiency of IT infrastructure
• Ease of access from any European country
• Western-style working culture
• Labour cost effectiveness
• Broadband – low cost, high performance
GREEN TECHNOLOGY
Summary
Experienced in renewable energy generation, Latvia provides an excellent
environment for green energy projects. As one of the main exporters of environmental
technology and resources in the EU, Latvia has the potential to expand this sector,
equipped with skilled labour, long-standing experience, and the necessary resources.
Latvia’s efforts to improve energy efficiency and the increasing enrolment in degree
courses relevant to the sector further add to the industry’s potential.
Key Advantages
• Traditionally a leading sector
• Easy access to raw materials thanks to advantageous geographic location
• Excellent logistics infrastructure
• Competitive labour force
• Highly competitive in higher value products
• Shift toward more sophisticated production
25'19 | Latvian Business Guide
HEALTH CARE
Summary
Latvia’s healthcare sector has recently undergone restructuring and budget cuts
aimed at increasing efficiency and facilitating the introduction of additional private
healthcare options. The potential of the sector lies in the combination of highly
qualified personnel, low costs, and first-rate facilities. Medical tourism is an emerging
sector, building on Latvia’s reputation as a spa destination, its convenient location,
and the availability of high-standard health services at a low cost.
Key Advantages
• Recent efforts to improve efficiency.
• Highly qualified workforce at competitive prices
• High standard of health services.
• Promising new business opportunity: medical tourism
• Government support for an efficient and innovative healthcare sector
LIFE SCIENCES
Summary
Latvia’s life-science sector combines strong R&D capability, established manufacturing
infrastructure, and geographic and cultural proximity to eastern and western markets.
A very competitive workforce as well as further investment in raising productivity
levels and fostering R&D related activities have contributed to the potential and
success of the industry.
Key Advantages
• Strong R&D capability
• Established manufacturing infrastructure
• Geographic proximity to eastern markets
• Long-standing traditions in chemistry
• Skilled and competitive workforce
FOOD PROCESSING
Summary
The food and beverage production sector provides investors with a full range
of opportunities for success, including a robust supply chain, an experienced
workforce, and high quality standards. Domestic producers can also effectively track
the quality of their products, from ingredients, through production and transit, to
market – enabling production of the fresh and natural foods that consumers seek.
Key Advantages
• Robust supply chain
• Access to quality ingredients
• Ecological agriculture for natural ingredients
• Abundance of skilled and competitive labour
• Industry standards and sustainability
• Developed transit infrastructure
• Well recognized in CIS markets
26'19 | Latvian Business Guide
HUMAN RESOURCES
Employment relationships in Latvia are regulated by the Labour Law, which transposes
many aspects of EU employment law and social policy directives, such as those
relating to equal treatment, collective redundancy, working hours, and rest breaks.
Monitoring of Labour Law compliance is executed by the State Labour Inspectorate
and representatives of employers and trade unions.
Work productivity is kept high by Latvia’s relatively low number of public holidays:
• 1 January – New Year Holiday.
• 2 days (set yearly) – Good Friday and Easter Monday.
• 1 May – Labour Day.
Qualified • 4 May –Independence Proclamation Day.
talent pool • 23 and 24 June – Midsummer Days.
• 18 November – National Independence Day.
• 24, 25 and 26 December – Christmas Eve and Christmas.
• 31 December – New Year’s Eve.
At the end of 2017, Latvia’s population was 1.931 million, including approximately
50.7% or 0.980 million economically active (age 15-74) people. Economic activity
is concentrated mainly in and around Riga, where around half of the country’s
population lives. Many of the people living in the surrounding districts work in the
capital city.
In March 2018, the unemployment rate was 7.9%, which is between the average rates
in EU-28 (7.1%) and the euro area (8.5%). The highest unemployment levels in Latvia
are among unskilled workers, though there are shortages of qualified specialists
62%
of people in the
in certain areas and positions. Statistics from the State Employment Agency reveal
that in 2017, most vacancies were registered in major groups of medium-skilled
occupations (lorry drivers, retail shop assistants, cooks), followed by highly-skilled
25 - 34 year old age occupations (programmers, sales managers, sales representatives) and low-skilled
group know at least occupations (ancillary workers, cleaners, product markers). Nevertheless, the
two foreign languages greatest increase in demand in comparison to the previous year was registered
precisely in occupations in the medium-skilled group, particularly in the major groups
of skilled workers and craftsmen.
Source: Eurostat
High rates of
university
attendance According to the results of Eurobarometer research, Latvia ranks second among
(74%, gross European states for the percentage of residents, who in addition to their mother
enrolment ratio) tongue can speak at least one foreign language: 95% of Latvia’s residents are fluent
in some foreign language and 54% can speak at least two foreign languages (1st
highest score). 13% can speak at least three foreign languages. Moreover 44% of
respondents acknowledge that they speak a foreign language on a daily basis – at
work or in their private lives.
Source: Eurobarometer
The majority of adults (59%) know Russian, 60% know English, but 18% of the
Large proportion of population know German. Other popular languages in Latvia are Lithuanian, Polish
international students and French.
27'19 | Latvian Business Guide
In Latvian general schools, 99% of pupils are taught foreign languages. In primary
education (grades 1-6), 98.9% of pupils are taught foreign languages, in elementary
education (grades 7-9) – 98.6%, but in secondary education (grades 10-12) 99.8%
are taught foreign languages. 42% of pupils learning foreign languages learn two or
more foreign languages. The majority of pupils (97.6%) are learning English, followed
by Russian (31.8%). German is learnt by 10.8% of pupils, but French – by 2.2%. As
well as the languages already mentioned, pupils are also taught the Arabian, Danish,
Estonian, Italian, Japanese, Jewish, Chinese, Latin, Lithuanian, Norwegian, Polish,
Finnish, Spanish and Swedish languages.
Source: Central Statistical Bureau of Latvia
SALARIES IN LATVIA
Monthly salaries in Latvia range from the minimum wage of € 430 gross for low-skilled
workers in the manufacturing and retail sectors up to € 10 000 gross to top managers
in the largest international companies.
According to the Central Statistical Bureau of Latvia, the average monthly salary in
Latvia in 2017 Q4 was € 961 gross, which is € 700 net. Salaries in the Riga region
are about 10% above the Latvian average, but in other areas they are 15-30% below
average, with the lowest being in Latgale (the eastern region of Latvia). This does
not apply to highly qualified specialists and the most demanded positions, where
salary levels are similar across the country.
For example, highly qualified engineering and production management staff can
often be attracted from Riga to work in regional factories by maintaining appropriate
salary levels.
Salary surveys confirm that the total level of remuneration in Latvia is increasing
by 4-6% annually. However, this average figure is only a trend; wage growth is
increasingly being tied to employees’ individual performance indicators and
companies’ overall results. Consequently, we can anticipate growing salary gaps at
various levels and qualifications in the future.
Sectors with the highest level of remuneration (above average): IT/ Telecom,
Pharmacy, Financial Services, Construction, Wholesale (representative offices).
Compared to other EU countries, the general level of compensation in Latvia is low.
For example, the level of compensation for unskilled jobs is three to four times lower
than in such Western European countries as Germany and France, while in terms
of wage-adjusted labour productivity, Latvia is ahead of most EU member states.
28'19 | Latvian Business Guide
SALARY STUCTURE AND TAXES
Minimum stipulated salary by the State is EUR 430 gross
SALARY STRUCTURE AND TAXES
532 EUR
Employer's part of social
security contribution
24.09%
430 EUR
Social security contribution 11% 11%
Personal income tax 20% 20% 346 EUR*
Employee receives
after
taxes 146 EUR 146 EUR 146 EUR
non--
taxable 200 EUR 200 EUR 200 EUR
amount
Cost to Gross Employee
employer salary receives
*
* Calculation of an employee’s net salary is based on the general algorithm, the actual formula is more
complicated, also taking into account a number of tax discounts, e.g. for dependants.
BONUSES
Additional benefits provided to employees vary between sectors and positions.
The IT and financial-services sectors are among the most generous industries
with benefits including health insurance, paid health and sports activities,
telecommunication services, partly or fully provided catering.
The most common benefit in the manufacturing sector is health, life or/and accident
insurance (varies by industry and profile) as well as compensation for transport costs.
Other most common benefits include discounts on company products or services,
additional holidays, pension funds as well as company cars for managerial and
business development positions.
YOUTH POTENTIAL IN THE LABOUR MARKET
Generally, the majority of Latvia’s young people commence their careers while still
studying, thus numerous young, skilled specialists are already active in the labour
market. These people are self-confident, possess good communication skills,
and are technologically adept. Participation in student exchange programs (e.g.,
Erasmus), youth organizations (e.g., AIESEC), and international communication helps
foster foreign language skills.
Education is a historically developed traditional value in Latvia. Enrolment rates in
universities are among the highest in the world. Although humanitarian and social
study programmes continue to be the most popular, there is increasing interest in
technological sciences and engineering.
29'19 | Latvian Business Guide
Graduates with degrees or qualifications from higher education institutions and
colleges by subject group, 2017
The total number of graduates in 2017 was 14 587
Social sciences,
business and law 38%
Health and welfare 17%
Engineering, manufacturing
and construction 13%
Services 10%
Humanities and art 9%
Natural sciences, mathematics
and information technologies 7%
Education 4%
Agriculture 2%
Source: Central Statistical Bureau of Latvia
There is increased interest among young people in acquiring vocational education.
Thus, the number of students enrolled in vocational education institutions increased
by around 5% in the 2017/18 academic year in comparison with 2015/16.
The most important motivators for young people in Latvia currently are:
• Learning and professional-growth opportunities within the company;
• Interesting job content and working environment: modern technologies (particularly
in IT), opportunities to participate in cross-border and interdepartmental projects;
• Professional management (Team leadership), which motivates and inspires for
growth.
• Opportunities to work for companies rated as good employers. Employees in
Latvia appreciate companies that develop their good employer ratings not only
globally, but are able to adapt their values to local conditions.
30'19 | Latvian Business Guide
Consequently, Management Trainee and similar programmes are widely used both
by global corporations and local organisations in order to attract the most talented
young potential in Latvia.
In order to attract young people without experience or specific competencies for
work in Riga, salaries starting from € 500 net are considered competitive. Salaries
of about € 700 net are an appropriate level for specialists skilled in particular areas
(up to one year’s experience) for work in Riga.
EMPLOYEE SELECTION
Employee selection in Latvia is performed by the head of the company, by an
employee responsible for HR, or with the help of a recruitment company. Foreign
companies and investors most often use the services of a recruitment company, or
publish job advertisements in leading job portals and perform in-house selection.
When creating a job advertisement, the requirements prescribed by the Labour
Law must be taken into account: it is illegal to discriminate on the basis of age, sex,
ethnic origin, etc., and the name and contact details of the employer or recruitment
company must be clearly stated.
The State Employment Agency (Valsts Nodarbinātības aģentūra (NVA)) licenses
the operations of recruitment companies in Latvia. A list of licensed companies is
published on the NVA’s website: www.nva.lv. Around ten professional recruitment
companies in Latvia offer high-quality and value-for-money recruitment services,
most of them being part of international networks. In addition, a number of companies
offer staffing and payroll-outsourcing services.
Candidate selection takes 4-6 weeks, depending on the nature and seniority of the
position.
Because of the relatively narrow Latvian labour market, certain industry-specific
profiles or a combination of required competencies can be represented by only a
few people around the country. Consequently, in order to recruit a professional of
narrow specialization, employers may have to use head hunting or provide in-house
training to young talented specialists. There are already a number of similar positive
examples where companies have provided specific competence training for their
employees, such as foreign languages, work with specific IT systems, etc. This
approach promotes a positive employer rating and increases employee motivation.
31'19 | Latvian Business Guide
BUSINESS INFRASTRUCTURE
TRANSPORT & LOGISTICS
Thanks to its geographical location on the crossroads between the main Eurasian
markets, Latvia is one of the most convenient and practical hubs for transporting
goods from Asia to Europe and vice versa. Latvia forms the European Union’s
external border with Russia and Belarus, thus making the country a bridge between
East and West, as well as North and South. Latvia’s transport system provides an
appropriate infrastructure base to facilitate these trade flows and to serve the needs
of local export/import operators:
• Free ports in Ventspils, Riga, and Liepaja, with total cargo throughput of 60.3
million tonnes during 2017, predominantly transit shipments.
• An extensive and functional road network, connecting with both European and
CIS road networks, as well as Latvia’s ports.
• The shortest route between the EU and the CIS.
• Specialized, high-capacity railway corridor linking Latvian ports with Russia and
the Far East.
• Riga International Airport – a competitive Baltic passenger hub, serving almost
half (44% in 2017) of all airline passengers in the Baltic States; high-speed cargo
distribution centre.
• Pipeline systems for transit and distribution of Russian oil/natural gas.
E67 - Tallinn (200km)
E264 - Tartu (80km)
Saint-Petersburg (400km)
E77 - Pskov (90km)
Saint-Petersburg (360km)
Valmiera
.0
20
5
17.
Ventspils (SEZ) E262 - Pskov (120km)
Saint-Petersburg (390km)
.7
33
5
14.
Rīga (SEZ)
Jūrmala
Jelgava
12.5
6.6
Liepāja (SEZ) Jēkabpils Rēzekne (SEZ)
E22 - Moscow
(620km)
E77 - Siauliai (50km)
E67 - Vilnius (200km)
Latgale (SEZ)
Warsaw (570km)
A5 - Minsk (300km)
Daugavpils
E262 - Vilnius (150km)
Warsaw (600km)
Railway Oil product (diesel fuel) (SEZ) Special Economic Zones 4,2
Cargo turnover in port
pipeline in Ventspils direction (Milions of tons, 2017)
Main railway transit Riga International Airport
Crude oil pipeline
cargo flows Depth of the port
in Ventspils direction 4,2
Important railway junction
Main roads Crude oil pipeline in
Lithuanian direction Major ice-free ports
32You can also read