Fiji Post-Disaster Needs Assessment - gfdrr
←
→
Page content transcription
If your browser does not render page correctly, please read the page content below
Fiji
Post-Disaster Needs Assessment

March 2013

Tropical Cyclone Evan, 17th December 2012

Government of Fiji

              ACP-EU Natural Disaster Risk Reduction Program
              An initiative of the African, Caribbean and Pacific Group, funded by the European Union and managed by GFDRR
DISCLAIMER
Estimates are based on official Government of Fiji data.

Published by:   Applied Geoscience and Technology Division, Secretariat of the Pacific Community
                (SPC-SOPAC) 2013

Layout by:      Sailesh Kumar Sen
                SPC-SOPAC Division

Cover photo:    Government of Fiji

Available from: Ministry of Strategic Planning,             Applied Geoscience and Technology Division (SOPAC)
                National Development & Statistics           Secretariat of the Pacific Community (SPC)
                P O Box 2351                                Private Mail Bag
                Government Buildings                        GPO
                Suva                                        Suva
                Fiji                                        Fiji
                Telephone: +679 331 3411                    Telephone: +679 338 1377
                Fax: +679 3304 809                          Fax: +679 337 0040
                E-mail: pcirikiyasawa001@planning.gov.fj    E-mail: director@sopac.org
                www.plannng.gov.fj                          www.sopac.org
Fiji

Post-Disaster Needs Assessment

Tropical Cyclone Evan, 17th December 2012

             Government of Fiji

                 March 2013
Post-Disaster Needs Assessment

Contents
Foreword....................................................................................................................................................................... ii

Acknowledgements.................................................................................................................................................... iii

Acronyms and Abbreviations.................................................................................................................................. iv

List of Tables.................................................................................................................................................................v

List of Figures.............................................................................................................................................................. vi

EXECUTIVE SUMMARY...................................................................................................................................................... vii

1. INTRODUCTION............................................................................................................................................................. 1
          1.1      Overview of Tropical Cyclone (TC) Evan............................................................................................................................... 2

          1.2      Socio-Economic context of Fiji............................................................................................................................................. 2

          1.3.     Response of Government and Development Partners.......................................................................................................... 3

          1.4      The Post Disaster Needs Assessment Methodology............................................................................................................ 5

2. MACROECONOMIC IMPACT......................................................................................................................................... 6
          2.1      Summary of Total Effect....................................................................................................................................................... 7

          2.2      Pre Disaster Economic Outlook........................................................................................................................................... 8

          2.3      Post Disaster Impact........................................................................................................................................................... 9

          2.4      Affected Population and Labour Force................................................................................................................................. 11

          2.5      Social Impact Assessment................................................................................................................................................... 14

3. DAMAGE AND LOSS...................................................................................................................................................... 18
          3.1      Housing Sector.................................................................................................................................................................... 19

          3.2      Health Sector....................................................................................................................................................................... 23

          3.3      Education Sector................................................................................................................................................................. 26

          3.4      Agriculture........................................................................................................................................................................... 29

          3.5      Tourism Sector..................................................................................................................................................................... 37

          3.6      Commerce Sector................................................................................................................................................................ 39

          3.7 	Infrastructure Sector............................................................................................................................................................. 41

4. CROSS CUTTING ISSUES............................................................................................................................................. 54
          4.1      Gender................................................................................................................................................................................. 55

          4.2      Environment........................................................................................................................................................................ 56

5. DISASTER RISK MANAGEMENT................................................................................................................................... 58

6. RECOVERY AND RECONSTRUCTION NEEDS............................................................................................................. 66

Annexes........................................................................................................................................................................... 75
          Annex 1......................................................................................................................................................................................... 76

          Annex 2 to 10 enclosed on CD

BIBLIOGRAPHY.................................................................................................................................................................. 77

                                                                                                          Fiji PDNA                 Tropical Cyclone Evan, 17th December 2012                                   i
Post-Disaster Needs Assessment

     Foreword
     On 17th December 2012 Tropical Cyclone Evan struck Fiji causing widespread destruction to property and infrastructure,
     disrupted economic activity bringing sorrow to tens of thousands of fellow citizens. Many lost their livelihoods, their
     shelter and their belongings. They endured great misery to weather the cyclone, to ensure the safety of their dear
     ones, and secure or recover their possessions. They also displayed great resilience in the face of adversity, and great
     determination to take stock of damage, get back on their feet, and build back better.

     Fortunately, no lives were lost. We can say that Government’s investment to increase disaster preparedness and
     mitigation measures to pre-position and distribute relief material efficiently, and to coordinate response effectively with
     local and international partners has been a worthwhile investment. We, in Government, are intent on building on these
     achievements and on deploying additional efficiency and effectiveness tools to help us assess the impact of national
     disasters and prioritize rehabilitation activities.

     At the same time, we recognize that each disaster is an opportunity to improve our collective skills and the way we collect,
     process, and interpret data to inform our response. We are certainly not new to conducting damage assessments in
     the aftermath of a disaster, when humanitarian concerns are at the top of the government’s relief and response agenda.
     Initial assessments may, at times, be imperfect but they are absolutely instrumental to shape response and enable us to
     effectively engage with each other within government and with our partners.

     Long term recovery and rehabilitation, however, often requires us to go back to the drawing board and take a fresh look
     at the impact of disaster in order to answer questions such as: What sectors of our economy were hit the hardest? What
     can we say authoritatively about cost of lost production in the manufacturing or agricultural sector, disruption to market
     trading, or loss of environmental assets? And just as importantly, if not more so, who among our citizens was hit the
     hardest, and whose resilience is compromised the most?

     To address these questions we need a whole-of-government approach that assesses the effect of disasters at the
     sector level. With this objective in mind, we chose to pursue a post-disaster needs assessment (PDNA) – the first
     assessment of its kind in Fiji.

     In the PDNA we have a credible, rigorous and globally recognized standard methodology. It enables us to take stock of
     physical damage to property, infrastructure, and productive assets as well as to account for losses resulting from the
     disruption of economic flows brought on by the disaster. This significant loss dimension often did not feature in previous
     assessments. Having a better understanding of both of these measures and how they affect each sector provides the
     Government with a stronger knowledge base to plan and budget.

     Further, the PDNA looks to do justice to the human recovery aspect of the disaster and build a solid disaster risk
     management strategy into the plan to support recovery. Priority areas are set out in a comprehensive framework to
     inform the Government’s budgeting priorities and to engage with donors and partners where necessary.

     Finally, the capacity development component, whereby 60 members of Government staff received training, was influential
     in the choice to pursue a PDNA in Fiji. The tools and methodology will stay with us – with your respective Departments,
     in fact – so that they can be quickly brought to bear when needed in the future, as we institutionalize this instrument.

                                                                                                                           Inia Seruiratu
                                                                                                                               The Minister
                                                                                             Ministry of Agriculture, Fisheries and Forests
                                                            Ministry of Rural & Maritime Development and National Disaster Management

ii   Tropical Cyclone Evan, 17th December 2012       Fiji PDNA
Post-Disaster Needs Assessment

Acknowledgements
The Post-Disaster Needs Assessment (PDNA) is an extensive and labour-intensive exercise that could not have been
made possible without the dedication and support of the various ministries and departments of the Government of Fiji in
providing the time of their staff with their accompanying expertise. Their drive and dedication underpins this Government-
led approach to disaster risk management and is a model for improved co-ordination while working together for a more
resilient Fiji.

Special acknowledgement is extended to Mr Filipe Alifereti, Permanent Secretary for Rural & Maritime Development and
National Disaster Management, and Mr Pita Wise, Permanent Secretary for Strategic Planning, National Development &
Statistics, for their leadership, support and cooperation throughout the assessment.

The PDNA team is grateful for the technical and financial support from the Secretariat of the Pacific Community (SPC)
SOPAC Division as the lead partner and the European Union – African, Caribbean and Pacific Secretariat, via the
World Bank, Global Facility for Disaster Reduction and Recovery (GFDRR) who provided the overall guidance for the
PDNA process. The PDNA greatly benefitted from the dedicated involvement and valuable contribution by the following
persons: Dr Asha Kambon (Consultant, World Bank); Ms Rachel Cipryk (DRM Specialist, World Bank); Ms Samantha
Cook (Consultant, SPC-SOPAC), Ms Dominique Blariaux (Consultant, FAO) Mr Ken Collis (NDMO); Mr David Smith
(Deputy Head and Senior Economist, UNESCAP Pacific Office); Mr Bernardo Cocco (Early Recovery Adviser, UNDP); Ms
Karen Bernard (Disaster Risk Reduction and Recovery Specialist, UNDP); Ms. Katalaine Duaibe and Ms Vilisi Veibataki
(UN Women). A full list of the PDNA report writers and contributors is included in Annex 1. To all of these contributors
the team would like to express their deepest gratitude and appreciation.

                                                               Fiji PDNA       Tropical Cyclone Evan, 17th December 2012     iii
Post-Disaster Needs Assessment

     Acronyms and Abbreviations
     ADB          Asian Development Bank                                 MWTPU     Ministry of Works, Transport & Public Utilities
     AusAID       Australian Agency for International Development        NAP       National Action Plan
     BOP          Balance of Payment                                     NDMO      National Disaster Management Office
     CFW          Cash For Work                                          NDRRF     National Disaster Relief and Rehabilitation Fund
     CPI          Consumer Price Index                                   NGOs      Non-governmental Organizations
     DaLA         Damage and Loss Assessment                             NPP       New Policy Proposal
     DM           Disaster Management                                    OFDA      Office of United States Foreign Disaster
     DOE          Department of Environment                                        Assistance

     DRM          Disaster Risk Management                               PAYE      Pay As You Earn

     DRR          Disaster Risk Reduction                                PDNA      Post-Disaster Needs Assessment

     EC           European Commission                                    PDRMPN    Pacific Disaster Risk Management Partnership
                                                                                   Network
     EM-DAT       International Disaster Database
                                                                         RBF       Reserve Bank of Fiji
     EU           European Union
                                                                         RFA       Regional Framework for Action
     EUS          Employment and Unemployment Survey
                                                                         RHS       Right Hand Side
     F$           Fiji Dollar
                                                                         SIA       Social Impact Assessment
     FAO          Food and Agriculture Organization
                                                                         SLG       Standard Liability Group
     FBOS         Fiji Bureau of Statistics
                                                                         SOPAC     Applied Geoscience and Technology Division,
     FEA          Fiji Electricity Authority                                       Secretariat of the Pacific Community
     FNPF         Fiji National Provident Fund                           SPC       Secretariat of the Pacific Community
     FRA          Fiji Roads Authority                                   TA        Technical Assistance
     GDP          Gross Domestic Product                                 TC        Tropical Cyclone
     GFDRR        Global Facility for Disaster Reduction and             TFL       Telecom Fiji Limited
                  Recovery
                                                                         UN        United Nations
     HAP          Humanitarian Action Plan
                                                                         UNDP      United Nations Development Program
     HART         Housing Assistance Relief Trust
                                                                         UNECLAC   United Nations Economic Commission for Latin
     HDI          Human Development Index                                          America and the Caribbean
     HFA          Hyogo Framework for Action                             UNESCAP   United Nations Economic and Social Commission
     IDA          Initial Damage Assessment                                        for Asia and the Pacific
     IFRCC        International Federation of the Red Crescent and       USAID     United States Aid for International Development
                  Cross                                                  USD       United States Dollar
     IMF          International Monetary Fund                            USP       University of the South Pacific
     IPCC         International Panel for Climate Change                 VAT       Value Added Tax
     JICA         Japan International Cooperation Agency                 WAF       Water Authority of Fiji
     LHS          Left Hand Side                                         WASH      Water, Sanitation and Hygiene
     LTA          Land Transport Authority                               WB        World Bank
     MF           Ministry of Finance                                    WHO       World Health Organization
     MIT          Ministry of Industry & Trade
     MLGHUDE      Ministry Local Government, Housing, Urban
                  Development & Environment
     MoA          Ministry of Agriculture
     MoE          Ministry of Education
     MoH          Ministry of Health
     MoT          Ministry of Tourism
     MRMDNDM      Ministry of Rural & Maritime Development &
                  National Disaster Management
                                                                                   Currency and equivalents
     MSPNDS       Ministry of Strategic Planning, National
                                                                                   Currency Unit = Fiji Dollar
                  Development & Statistics
                                                                                   F$1=USD0.5564
     MWSWPA       Ministry of Women, Social Welfare & Poverty                      Fiscal Year
                  Alleviation                                                      January 1st – December 31st

iv   Tropical Cyclone Evan, 17th December 2012               Fiji PDNA
Post-Disaster Needs Assessment

List of Tables
Table 1: Summary of Cyclone Evan’s Total Economic Effect in Fiji
Table 2: Summary of Recovery, Reconstruction and Disaster-Risk Reduction Needs
Table 3: Key Development Indicators 2010
Table 4: Summary of Evacuation Centres and Evacuees During and After TC Evan
Table 5: Summary of Foreign Aid Assistance from Development Partners
Table 6: Summary of Damage and Losses Due To TC Evan
Table 7: Balance of Payments
Table 8: Summary of Rehabilitation Requirements
Table 9: Employment by Economic Sectors
Table 10: Estimation on Disaster Impact on Income
Table 11: Recovery Recommendations
Table 12: Pre-Disaster Situation by Category of House Type, Division and Province
Table 13: Summary of Damage and Loss in the Housing Sector
Table 14: Recovery Needs for the Housing Sector
Table 15: Reconstruction Needs for the Housing Sector
Table 16: Total Health Facilities
Table 17:	Impact of Disaster to the Health Sector
Table 18:	Identified Recovery Needs
Table 19:	Identified Reconstruction Needs
Table 20: School Distribution in 2012
Table 21: Summary of Damage and Loss for the Education Sector
Table 22: Recovery Needs for the Education Sector
Table 23: Reconstruction Needs for the Education Sector
Table 24: Pre-Disaster Annual Crop Production [2011] by Division and Crop Classification
Table 25: Pre-Disaster Livestock Production
Table 26: Summary of Damage and Loss in the Agriculture Sector
Table 27: Post-Disaster Crop Situation by Province and Crop Classification
Table 28: Recovery Needs for Agriculture Sector
Table 29: Reconstruction Needs for the Agriculture Sector
Table 30: Baseline Tourism Data
Table 31: Damage and Loss for the Tourism Sector
Table 32: Recovery Needs for the Tourism Sector
Table 33: Reconstruction Needs for the Tourism Sector
Table 34: Stock of Business by Division
Table 35: Sector contribution to GDP
Table 36: SMEs in the Northern and Western Division
Table 37: Summary of Damage and Loss for the Commerce Sector
Table 38: Summary of Damage and Loss for the Infrastructure Sector
Table 39: Fiji Road Network Statistics by Division
Table 40: Damage and Loss to the Transport Sub-Sector
Table 41: Damage and Loss to Roads and Highways
Table 42: Damage and Loss to Airports and Ports
Table 43: Recovery Needs for the Transport Sub-Sector
Table 44: Reconstruction Needs for the Transport Sub-Sector
Table 45: Total Power Generation supplied by FEA
Table 46: Damage and Loss to the Electricity Sub-Sector
Table 47: Recovery Needs for the Electricity Sub-Sector
Table 48: Reconstruction Needs for the Electricity Sub-Sector
Table 49: Land Based Communication Infrastructure
Table 50: Damage and Loss to the Communication Sub-Sector
Table 51: Recovery Needs for the Communication Sub-Sector
Table 52: Reconstruction Needs for the Communication Sub-Sector
Table 53: Government Building Infrastructure
Table 54: Damage and Loss to Government Buildings
Table 55: Recovery Needs for Government Building Infrastructure
Table 56: Reconstruction Needs for Government Building Infrastructure
Table 57: Water Supply Assets
Table 58: Sewerage System Assets
Table 59: Damage and Loss to Water and Sanitation Sub-Sector
Table 60: Recovery Needs for Water and Sanitation Sub-Sector
Table 61: Reconstruction Needs for Water and Sanitation Sub-Sector
Table 62: Past Tropical Cyclones in Fiji 1972-2012
Table 63: Summary of Total Recovery and Reconstruction Needs
Table 64: Total Recovery Needs
Table 65: Total Reconstruction Needs

                                                  Fiji PDNA        Tropical Cyclone Evan, 17th December 2012   v
Post-Disaster Needs Assessment

                       List of Figures
                       Figure 1: Post Disaster GDP Forecast 2012 – 2015
                       Figure 2: Proportion of the Total Housing Stock Affected
                       Figure 3: Proportion of Damage and Loss by Agriculture Sub-Sector
                       Figure 4: TC Evan Tracking Map
                       Figure 5: Total Damage and Loss Ratio
                       Figure 6: Total Damage and Loss by Sector
                       Figure 7: Pre-Disaster GDP Forecast for 2012f-2013f
                       Figure 8: Post-Disaster GDP Forecast for 2012f-2015f
                       Figure 9: Tourism Earnings
                       Figure 10: Proportion of Divisional Population Affected
                       Figure 11: Primary, Secondary and Tertiary Affected Population
                       Figure 12: Effect of TC Evan on the Housing Stock
                       Figure 13: Percentage of Affected Households by Division
                       Figure 14: Total Damage and Loss for the Health Sector
                       Figure 15: Total Number of Schools Affected by TC Evan
                       Figure 16: Percentage of Damage and Loss by Division – Agriculture Sector
                       Figure 17: Share of Damage and Loss by Sub-Sector
                       Figure 18: Share of Damage and Losses in Agriculture
                       Figure 19: Pre-Disaster Annual Production by Division
                       Figure 20: Distribution of Damage of the Livestock Sub-Sector in the Western Division
                       Figure 21: Distribution of Damage to Livestock in the Central Division
                       Figure 22: Distribution of Livestock Damage Cost Between Commercial and Smallholder Farmers
                       Figure 23: Distribution of Losses to the Crop Sub-Sector
                       Figure 24: Losses in Livestock Production by Commodity
                       Figure 25: Cost of Past Events [RHS] and Number of Fatalities [LHS] 1972-2010
                       Figure 26: National Disaster Management Structure

vi   Tropical Cyclone Evan, 17th December 2012          Fiji PDNA
Post-Disaster Needs Assessment
EXECUTIVE SUMMARY
Fiji PDNA Tropical Cyclone Evan, 17th December 2012 viiPost-Disaster Needs Assessment
Tropical Cyclone Evan (TC Evan) − a massive Category 4 cyclone that ravaged Northern Vanua Levu and Western Viti
Levu on 16-17 December 2012 − is considered one of the worst to ever hit Fiji in recent history.
The cyclone left widespread destruction in its path – but luckily no deaths or major injuries to persons. Dwellings and
their contents were damaged or destroyed, infrastructure was damaged and crops ruined. The livelihoods of many of
those affected were significantly compromised and economic activity disrupted. The impact of Evan compounded the
damage experienced by some of the same communities and businesses in the wake of the Western Floods of January
and March 2012.
The emergency response was well coordinated and managed. Early warning advisories issued by the National Disaster
Management Office of the Government were broadcast throughout the country. As a result many residents and tourists
were relocated from the outer islands to the relative safety of Nadi. Generally, the public felt that they were well informed
and able to make adequate preparations. More importantly, as a result of these communications no fatalities were
reported.
The Government, through Cabinet Decision 465, endorsed the recommendation that a Humanitarian Action Plan (HAP)
be prepared through the national cluster system – a coordination mechanism that brings together key government
agencies, stakeholders and partners for each sector – focusing on urgent disaster response and immediate rehabilitation
activities. In addition, the Government requested that a longer-term recovery framework be developed based on a Post-
Disaster Needs Assessment (PDNA) methodology.
SUMMARY OF DAMAGE AND LOSS
The total economic value of the disaster effects caused by the TC Evan is estimated at around F$194.9 million (USD108.4
million) equivalent to approximately 2.6 percent of Fiji’s Gross Domestic Product (GDP), thus demonstrating the scale
of the cyclone.
Total damage from TC Evan, that is the value of the destruction or damage to physical assets existing in the affected
areas, was estimated to be F$121.5 million. An additional F$73.4 million was identified as losses to the economic flows
that are expected to occur over the short to medium term (see Table 1).
Table 1 – Summary of Cyclone Evan’s total economic effect in Fiji.
Total Effect
Production Production Loss Total Damage Total Damage Contribution to
Sectors Damage Value and Loss Effect And loss Effect Total Damage
Value (USD) 0.5564 and Loss
Productive Sectors
Agriculture 6,660,435.50 31,007,228 37,667,664 20,958,288 19.6
Forestry 6,254,000 6,254,000 3,479,726 3.3
Hotels & Restaurants 40,000,000 28,157,764 68,157,764 37,922,980 35.5
Commerce 834,371 4,634,856 5,469,227 3,043,078 2.8
Infrastructure Sector
Transport 5,701,641 4,215,812 9,917,453 5,518,071 5.2
Communication 1,141,000 294,150 1,435,150 798,517 0.7
Electricity 4,300,000 1,455,673 5,755,673 3,202,456 3.0
Water 2,945,000 104,152 3,049,152 1,696,548 1.6
Government Building 421,493 20,000 441,493 245,647 0.2
Housing 46,879,095 3,138,364 50,017,459 27,829,714 26.1
Social Sector
Health 504,537 359,463 863,999 480,729 0.5
Education 5,887,572 44,190 5,931,762 3,300,432 3.1
Total 121,529,145 73,431,652 194,960,796 108,476,187
Source: Estimates based on official Government of Fiji data.
viii Tropical Cyclone Evan, 17th December 2012 Fiji PDNAPost-Disaster Needs Assessment
The assessment highlighted that while the productive sectors (agriculture, forestry, commerce, hotels and restaurants)
recorded the second largest proportion of damage, and their economic loss accounted for 87 percent of the total loss.
Infrastructure, which includes transport, electricity, communication, government building and housing suffered total
damage of around F$58.4 million and a loss of about $9.2 million. Damage and loss to the social sectors for health and
education was around F$6.4 million and F$0.4 million, respectively.
It is estimated that 83 percent of the combined damage and loss (or around F$160 million) is attributable to the private
sector while the remaining 17 percent of damage and loss (or F$32.6 million) falls on the fiscal purse.
MACROECONOMIC IMPACT
Given that TC Evan struck Fiji only three weeks before the end of the year, the impact on GDP in 2012 was minimal as
most economic activities/business production for the year had been completed. It is anticipated that the impact of TC
Evan will be greater in 2013.
Figure 1: Post Disaster GDP Forecast 2012–2015.
3.0%
2.6
2.4 2.4
2.5% 2.2 2.2 2.2
1.9
2.0% 1.8
1.5%
1.0%
0.5%
0.0%
2012f 2013f 2014f 2015f
Baseline Forecast Pre Disaster Post Disaster Forecast
Source: Estimates based on official Government of Fiji data.
Overall the impact of TC Evan in 2012 is expected to create a decline by 0.1 percentage point to the existing GDP forecast.
This is due to expected declines in the agriculture sector production, lower revenues in the hotels and restaurants sector
caused by lower visitor arrivals. These effects are coupled with an expected slowdown in the communications sector
largely due to the high cost of repairs and a decline in revenue due to service interruption caused by power outages.
The impact on sugar cane production is also expected to be felt in 2013, as at the time of TC Evan, the 2012 crushing
season had already ended. In addition, since most of the non-cane crops affected in December 2012 were expected to
be harvested in 2013, the negative impact on the agriculture sector is expected to have a greater effect in 2013.
The impact on exports at the national level is expected to be marginal, as most of the primary products are seasonal
crops hence the impact of the damage is anticipated to occur in 2013. Produce for fruit and vegetable export sustained
considerable damage and the impact is anticipated to be realized in the short- to medium-term.
The impact of TC Evan on Fiji’s Balance of Payment (BOP) position in 2012 will have no effect on the trade deficit as
the cyclone arrived just two weeks away from the year end. Nevertheless, some impact is expected in 2013 with an
estimated increase of imports by 1.5 percent, driven by the expected decline in the export of sugar, dalo, coconut oil
and yaqona.
SOCIAL IMPACT
Approximately 60 percent of the total population were affected in the post-disaster period. The Northern division
recorded the highest percentage of affected population (52 percent) as a proportion of their total population, followed
by the Western Division (38 percent) and the Central and Eastern divisions (23 percent).
Given the extent of damage sustained by each economic sector, total income loss for wage and salary earners was
estimated to be around F$9.6 million for one day. This is based on the amount of foregone earnings from one day where
workers remained at home after being officially informed. Employees in the agriculture sector have the highest expected
income loss of F$5.3 million which accounts for 55.6 percent of the total income lost.
Fiji PDNA Tropical Cyclone Evan, 17th December 2012 ixPost-Disaster Needs Assessment
The health sector sustained minor damage and loss to health facilities in the Western and Northern Division. The total
effect of TC Evan for the health sector was estimated to be approximately F$0.8 million. The brunt of the damage was
experienced in the Western Division with 84.8 percent of total damage to health facilities, followed by the Northern
Division which accounted for 12.4 percent and 2.2 percent of damage in the Central Division. The Eastern Division did
not report any incidence of damage to health facilities. In terms of total loss, approximately F$0.3 million was recorded
and F$1 million estimated for recovery and reconstruction needs for the sector. In the education sector, TC Evan
damage to schools was estimated to be approximately F$5.9 million. This amount includes the economic loss incurred
by the sector as well as the cost of ensuring the smooth resumption of the 2013 academic year.
A focused social impact assessment was conducted using qualitative research (focus group discussions, key informant
interviews, and researcher observations, and rapid questionnaires for businesses) from eight affected sites in the
Western Division. The research focused on key social issues related to livelihoods, social cohesion and traditional social
safety nets, shelter, and access to social services. The key findings of this limited-scope assessment, which are covered
in detail in Chapter 2, include:
• Food security and income earning opportunities are a key concern for two categories of sample populations:
1) farm labourers; and
2) residents of the Yasawa islands whose subsistence crops were devastated.
• While livelihoods have been heavily impacted in the Western Division, the majority of households are making
good progress in recovery, assisted by the provision of basic food rations.
• Traditional safety nets remain intact, but have been stretched in affected areas and are unlikely to be providing
the full support to poor affected households.
• Health services were unaffected, but access to education for some low-income affected households has been
difficult (difficulty in paying school fees).
IMPACT ON INFRASTRUCTURE
Infrastructure development remains vital for Fiji’s economic growth. The Government has invested significantly in
infrastructure with budget allocation to the sector averaging around F$228 million for the last three years (2010 to 2012).
In 2013, the Government has allocated F$483 million to the sector, almost 67 percent of the total capital budget. The
majority of the funding allocated in 2013 is for the upgrade of roads and construction of jetties.
The total effect of TC Evan on the infrastructure sector is estimated to be approximately F$21 million. The highest levels
of damage were recorded by the transport sub-sector, approximately F$10 million, followed by electricity sub-sector
with F$6 million, water and sanitation sub-sector at F$3 million, and communications1 sub-sector at F$1.4 million. In
addition, damage to Government buildings was estimated to be approximately F$1.2 million.
TC Evan affected approximately 5 percent of the total housing stock in Fiji (Figure 2). The total number of houses affected
was 8,497, of which 2,094 were totally destroyed and the balance of 6,403 suffered some degree of damage. The total
value of damage and loss identified for the Housing Sector has been estimated at just over F$50 million. As well as the
assessment for partially damaged and completely destroyed houses, this figure includes damage to household contents
and associated costs due to estimated demolition and rental losses. Approximately 8 percent of this is attributable to
publicly owned housing. The bulk of the damage and loss is thus attributable to privately owned housing, including
commercial and private homes.
Figure 2: Proportion of the Total Housing Stock Affected.
4% Effect of TC Evan on the Housing Stock in Fiji
1%
Unaffected Housing Stock
Percentage damaged
Percentage destroyed
95%
Source: Estimates based on official Government of Fiji data.
1
Only Telecom Fiji Limited (TFL). Other telecommunication service providers such Vodafone and Digicel are not captured as part of this exercise.
x Tropical Cyclone Evan, 17th December 2012 Fiji PDNAPost-Disaster Needs Assessment
IMPACT ON PRODUCTIVE SECTORS
In the agriculture sector, the division that experienced the highest proportion of damage and loss from TC Evan was the
Western Division, which accounts for 60 percent of the total damage and loss, followed by Northern Division with 29
percent. The Central and Eastern divisions experienced a much lower proportion of total damage and loss with 8 and
3 percent, respectively.
Figure 3 shows that the sub-sector of agriculture most affected by TC Evan was crops (67 percent of Damage and
Loss). In the livestock sub-sector, damage occurred mainly in the Western and Central divisions, accounting for 19
percent of total damage and loss. In the forestry sub-sector, the timber industry in the Western Division suffered from
high winds damage to infrastructure and trees – accounting for the remaining 14 percent.
Figure 3: Proportion of Damage and Loss by Agriculture Sub-sector.
Share of damage and loss from TC Evan in
19% Agriculture sub-sector
Livestock
Crop
14% Forestry
67%
Source: Estimates based on official Government of Fiji data.
The total effect to the agriculture sector amounts to F$43.9 million of which F$12.9 million is damage and F$31.0 million
is loss. Of the total effect, 86 percent is attributable to the private sector and 14 percent to the public sector.
The impact of TC Evan on the tourism industry was substantial with far reaching effects across a variety of sectors. While
TC Evan caused some damage to infrastructure and the environment, the reaction of the national authorities through the
Tourism Disaster Committee to mitigate and subdue any negative impact on future tourist arrivals effect is a key feature
of the resilience within the tourism industry.
Most of the structural damage to hotels and resorts was minimized due to the high building standards. Insurance plays a
vital role in this sector with most of the seriously affected hotels/resorts relying on those funds to repair or rebuild without
relying on the Government for financial assistance.
The effect of TC Evan on the sector contribution to the growth of the economy is expected to be fair without substantial
losses. It is expected that all hotels and resorts will be operating normally with visitor arrivals and tourism earnings back
on track by the end of 2013.
The total effect on commerce is thought to be about F$5.46 million. It should be noted that for the purposes of
this assessment the commercial sector is measured according to the level of wholesale and retail activities only, and
excludes manufacturing and service activities. Total damage to the sector at the national level is estimated to be less
than F$1 million. The loss to the commercial sector was estimated to be F$4.6 million based on the assumption that
businesses were closed for seven days on average. Most commercial owners were reportedly able to restore their
activities and restart their businesses anywhere from a day, to two weeks after the disaster.
CROSS CUTTING ISSUES
Disaster Risk Management
Looking back over a 40 year period Fiji has experienced tropical cyclone events almost every year or biennially. Fiji’s
disaster management arrangements are covered under the Natural Disaster Management Act 1998 and the National
Disaster Management Plan 1995. A number of good practices came to light, which include the following:
• Effective and timely deployment of DRM system. Fiji was able to activate and mobilise the national and local
structures for cyclone management in a timely and effective fashion. Consequently, no lives were lost, the cyclone
warnings were communicated clearly to the entire population, and all people at risk were safely evacuated prior
to landfall. Information management and information flows in general worked well during this event, among key
players: Meteorology Office, DISMAC, Division and District Offices and communities.
Fiji PDNA Tropical Cyclone Evan, 17th December 2012 xiPost-Disaster Needs Assessment
• Public-private partnerships for DRM. Numerous private sector companies contributed in-kind or cash donations
after TC Evan, including: Fiji Water, Value City, Yacht Partners Fiji, Colgate Palmolive, Digicel and many others. Fiji
has been able to capitalize well on such opportunities for innovative partnerships with the private sector, which is
a win-win situation, as it allows private companies to advertise their goodwill and thus retain and gain customers.
• Concessions and incentives. The government offers range of incentives and concessions to facilitate funding
for repair and recovery. People and businesses which donate to the PM’s relief fund receive a 200 percent tax
rebate for their donations, if F$1000 or more. Duty free concessions are given to companies donating items and
materials. Fees for dumping condemned food, cyclone debris and green waste at Naboro landfill were waived,
to expedite post-disaster clean-up. Town rates (taxes) were waived for a 3-month period for the affected areas.
TC Evan exacerbated poverty in already poor and vulnerable communities. DRM activities at the sector level were
identified and recommendations for DRM are detailed in Chapter 5.
Gender
The inclusion of gender considerations in any disaster-related policy, strategy and/or program is critical to ensuring
that the different needs and interests of the most affected population are adequately addressed. Accordingly, post-
disaster damage and loss assessments must be gender responsive and equitable. Central to such assessments is
the disaggregation of data by age and sex, including wherever possible other diversities like ethnicities and disabilities,
in order to clearly see trends or impacts across geographic regions, which in turn informs equitable recovery and
reconstruction programs.
No fundamental gender issues became apparent during the assessment. The sectors in which gender differences were
considered featured: agriculture, tourism and housing. During the baseline data collection phase, sectors were asked
as much as possible to disaggregate their data by gender; however, this proved to be a challenge as the classifications
vary across the sectors.
RECOVERY AND RECONSTRUCTION NEEDS
The total damage and loss from TC Evan of F$194.9 million can be attributed in the main to tourism, housing and
agriculture (35.5, 26.1 and 19.6 percent, respectively). Recovery and reconstruction for these sectors will have to
be managed so as to ensure that other affected sectors are not left unaddressed. The recovery and reconstruction
framework seeks to ensure that recovery and reconstruction needs that have multi-sectoral implications (such as the
restoration of transport infrastructure) are given significance, to secure a robust recovery.
Table 2 provides a summary of estimated costs for reconstruction and recovery. Total recovery and reconstruction
costs are estimated at F$134.0 million, of which F$22.7 million is required for recovery costs and F$121.3 million for
reconstruction from damages. The bulk of the costs are in tourism (32 percent), housing (25 percent) and infrastructure
services (20 percent). Detailed tables for the recovery and reconstruction initiatives can be found in Chapter 6.
Table 2 – Summary of Recovery, Reconstruction and Disaster Risk Reduction Needs.
Sector Sub Sector Recovery (F$) Reconstruction (F$) Total (F$)
Housing 500,000 35,510,000 36,010,000
Health 654,377 433,507 1,087,884
Education 672,450 4,640,000 5,312,450
Agriculture Crops 5,321,958 0 5,321,958
Livestock 103,628 5,354,498 5,458,126
Forestry 0 6,879,400 6,879,400
Tourism 2,400,000 44,000,000 46,400,000
Infrastructure Road and Highways 4,705,229 2,892,994 7,598,223
Airports & Ports 250,000 2034345 250,000
Electricity 5,705,423 5,300,000 21,005,423
Telecom 1,154,000 2,225,814 3,379,814
Government Building 20,000 421,493 441,493
Sanitation 100,000 0 100,000
xii Tropical Cyclone Evan, 17th December 2012 Fiji PDNAPost-Disaster Needs Assessment
Water 125,000 3,642,500 3,767,500
Social Impact Assessment 999,016 0 999,016
Total 22,711,080 111,300,206 144,011,286
Source: Estimates Based on official Government Data.
Note: No reconstruction and recovery needs in Commerce Sector.
WAY FORWARD
Overall, the PDNA has highlighted the following key findings that should inform further the Government’s recovery and
reconstruction strategy:
• The macroeconomic impact of TC Evan is limited. However, additional resources will be required to finance the
reconstruction and recovery of the infrastructure, agriculture, housing and education sectors, given the significant
damages and losses incurred.
• 17 percent of the total economic effect – or a cost of F$32.6 million as calculated by aggregating damages and
loss in each affected sector – fell on the public sector, whose infrastructure, physical stock, and revenue flows
were affected.
• The assessment highlighted the significant social impact borne by the population at large – particularly those
whose livelihood depends heavily on subsistence agriculture and sale of produce. Recovery efforts must
necessarily focus on these affected communities.
• The disaster has highlighted good disaster risk management practices in the way of effectiveness of response,
relief, and early recovery operations. Together with the HAP, it has also identified areas for improvement.
• The reconstruction and recovery framework contained in the document provides a number of elements for
the Government to consider. These proposed interventions need to be prioritized to identify what needs to be
addressed in the short term to cushion the impact on the most effected sectors. To complement budgetary re-
deployments to date in response to the event, Government should consider approaching development partners
selectively to seek support on specific priority actions.
Fiji PDNA Tropical Cyclone Evan, 17th December 2012 xiiiPost-Disaster Needs Assessment
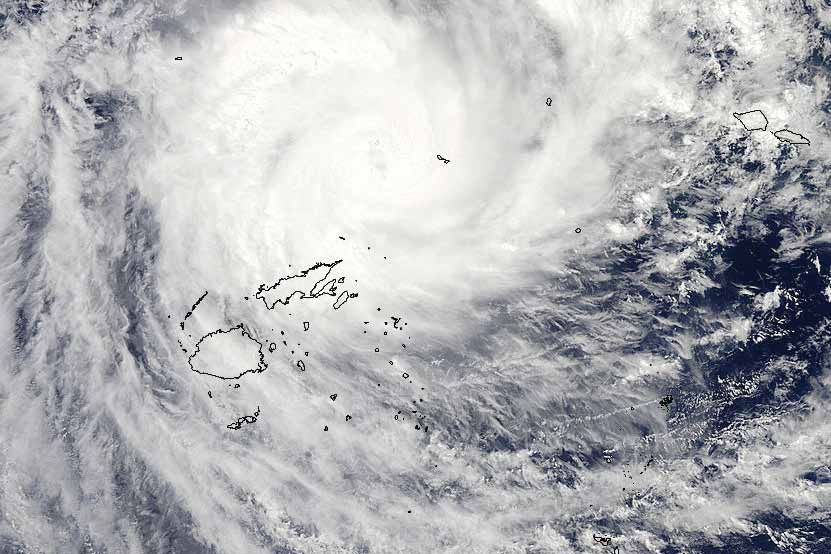
1.
Aqua/MODIS 2012/351 Acquired: 12/16/2012 01:35 UTC, Tropical Cyclone Evan (04P) over the Fiji Islands
Introduction
1 Tropical Cyclone Evan, 17th December 2012 Fiji PDNAPost-Disaster Needs Assessment
1.1 OVERVIEW OF TROPICAL CYCLONE (TC)
EVAN
On 17th December 2012 TC Evan had reached its peak intensity with wind speeds of 210 km/h (130 mph), equivalent
to a category 4 cyclone, near the North West coast of Vanua Levu. The following day (18th December) the Regional
Specialised Meteorological Centre (RSMC) in Nadi reported that TC Evan had weakened into a category 3 TC and was
located near the west coast of Viti Levu (see Figure 4).
Figure 4: TC Evan Tracking Map.
Source: RMSC Nadi.
The Government had advance notice of the event and many tourists were relocated from the outer islands to the relative
safety of Nadi. The effective communications meant that no fatalities were reported. The Initial Damage Assessment
(IDA) from the Government estimated damage to be approximately F$75 million2.
TC Evan was one of three significant weather events that affected Fiji in 2012, the other two being the severe flooding in
the areas of Ra, Tavua, Ba, Lautoka, Nadi, Nadroga, Sigatoka, and Rewa in January 2012 and again in March 2012 the
same areas were affected again but with greater intensity. The Government of Fiji estimated that damage from the 2012
floods was at approximately F$71 million. This suggests that Fiji experienced damage of F$146 million in 2012 alone.
1.2 SOCIO-ECONOMIC CONTEXT OF FIJI
Fiji has a land area of 18,273 square km comprising 332 islands of which 110 are populated by approximately 862,2333
inhabitants. The majority of the population live on the two main islands of Viti Levu and Vanua Levu.
The basic structure of Fiji’s economy has not changed significantly over the years. It remains dependent upon primary
sectors and industries. Fiji has gone through a structural transformation, with the decline in the agricultural sector as
a result of poor performance of the sugar industry and price of sugar overseas. The main drivers of the economy are
the transport, storage and communication sectors, which account for 15 percent of GDP. Meanwhile the agriculture,
2
Government of Fiji 2012, CP (12), Cabinet Memorandum: Report on the Tropical Cyclone Evan Relief Response, Rehabilitation and Recovery
(For Discussion), December.
3
Based on the 2012 projections of FBOS.
Fiji PDNA Tropical Cyclone Evan, 17th December 2012 2Post-Disaster Needs Assessment
forestry and fisheries sector and the manufacturing and wholesale sectors account for 14 percent of GDP each. The
retail sector accounts for 12.0 percent of GDP, and real estate and business services and financial intermediation around
9.0 and 8.0 percent, respectively. The hotels and restaurants sector contributed around 5.0 percent towards GDP.
In 2010, GDP per capita was estimated to be in the region of F$5,390 per person which places it at the mid-point
for earnings when compared to other Pacific Island Countries and Territories (PICTs). This could be an indication of
increasing poverty as a result of declines in the sugar and garment industries coupled with increasing prices for food and
fuel from the global markets. In 2009, almost 53 percent of the population were living in urban areas (see Table 3) which
may suggest the incidence of urban drift as people relocate to the urban areas in pursuit of higher wages.
Table 3 – Key Development Indicators for Fiji in 2010.
Key Development Indicators
Population 862,233
Annual Growth Rate in the Population (percent) 0.5
Life Expectancy 65.75
Population in the Urban areas (percent) 52.90
GDP per capita (F$) 5,390
Human Development Index 0.688
Source: SPC, ADB and Reserve Bank of Fiji.
The Human Development Index (HDI) gives an indication of well-being by measuring three basic dimensions of human
development: health, education and income. Fiji has a HDI of 0.688, ranking 100 out of 187 countries among those that
provide data for its calculation. Comparatively, the HDI of East Asia and the Pacific as a region increased from 0.428 in
1980 to 0.671 today, placing Fiji above the regional average.
While poverty in Fiji has reduced from 39.8 percent in 2002-03 to 35.2 percent in 2008-09, there remains significant
income inequalities. Rural poverty has increased and income distribution has deteriorated between 2002-03 and 2008-
09 for Fiji in aggregate4.
1.3 RESPONSE OF GOVERNMENT AND
DEVELOPMENT PARTNERS
On the 15th December 2012 the National Emergency Operation Centre as well as the Divisional and District Operations
Centres were activated and public advisories were issued to warn members of the approach of TC Evan. A state of
Natural Disaster was declared for the Northern and Western divisions on the 18th December and was in effect for 22
days.
On the 20th December the Prime Minister, Commodore Frank Bainimarama, activated the Cyclone Housing Relief
Assistance to assist with the immediate reconstruction of damaged houses.
During TC Evan approximately 14,000 people were accommodated in 242 evacuation centres in Northern, Western,
Central and Eastern divisions (see Table 4). Within a month, this number declined to almost zero.
Table 4 – Summary of Evacuation Centres (EC) and Evacuees During and After TC Evan.
16/12/12 17/12/12 20/12/12
Division
# of EC # of Evacuees # of EC # of Evacuees # of EC # of Evacuees
Northern 7 387 45 3,646 98 5,692
Western 44 1,993 98 5,707
Eastern 10 356 1 50
Central 38 2,021 45 2,590
Total 7 387 137 8,016 242 14,039
Source: DISMAC
4
Fiji Bureau of Statistics, Poverty and Household Incomes in Fiji in 2008-09.
3 Tropical Cyclone Evan, 17th December 2012 Fiji PDNAPost-Disaster Needs Assessment
The Government of Fiji in collaboration with local and international partners distributed emergency relief supplies,
including food rations, at an estimated cost of F$1.2 million.
The National Disaster Relief and Rehabilitation Fund (NDRRF), also referred to as the Prime Minister’s Fund enables
business in key sectors, development partners and members of the public to make contributions. On the 29th January
2013, an addition of F$0.5 million had been deposited into the Prime Minister’s Fund from members of the public and
development partners. To assist with the reconstruction efforts in the housing sector F$1 million was allocated from the
Prime Minister’s Fund to complement the F$4 million that was reallocated from the National Budget to assist this effort.
In total the Government has reallocated F$7 million from the National Budget.
To encourage contributions from members of the public, the Fiji Revenue and Customs Authority, indicated that a 200
percent tax deduction was available for those who deposited cash contributions of F$1,000 and over to the Prime
Minister’s Fund. Duty-free concessions were also made for those donating items and materials.
Local authorities, to help facilitate the rebuilding, made the filing of re-building permits easier, waiving of fees related to
disposal of debris and contaminated foods, and other town/municipal fees.
Approximately F$9 million was received from development partners, international organizations, local non-government
organizations, businesses and individuals in the form of cash grants and aid-in-kind e.g. the provision of tarpaulins,
water purification tablets, water containers, blankets, soap, vector disinfectants, tool/shelter kits, generators and food
packs (see Table 5).
Table 5 – Summary of Foreign Aid Assistance From Development Partners.
In-Kind Cash-Grant
Donor Remarks
(F$) (F$)
ADB 1,770,000 Funding will be channelled for improving DISMAC communication
capabilities (US$1 million)
AusAID 4,847,599 This includes 2 shipments of relief items of F$958,230 logistics
support of F$189,369 (A$100,000) for aerial survey and F$3.7 million
committed by the Embassy for assistance in education, health and
root crops.
NZAID 332,840 30,000 F$30,000 to support NDMO logistic operations
JICA 64,958 Aid in kind to NDMO
USAID 1,534,909 Donated to Fiji Red Cross (US$877,191)
British High Commission 270,971 Donated to Fiji Red Cross (EU$117,329)
Embassy of France n/a Items received by NDMO include: 8 motorized pumps; 3 generators;
jerry can; wood saws; tents; and other materials. Other batch of
items provided to FRC
UNDP 140,176 US$80,000 for development of Humanitarian Action Plan (HAP) for
immediate term recovery planning
UNFPA 244,651 This includes items worth F$14,277.48 to Fiji Red Cross. Also,
F$179,388.22 for media production of response and emergency and
F$50,985.37 to MoH (wash kits, water tank, etc). Other donations
include more WASH kits and units of Oral Rehydration Therapy
packets
UNICEF 182,007 Aid in kind to NDMO
Embassy of Israel 8,000 This is the assistance from the Israeli Government through its
Embassy in Canberra. Provided to Ministry of Health.
Total 5,680,055 3,746,056
Source: DISMAC
As part of its response and recovery strategy, the Government, through Cabinet Decision 465, endorsed a Humanitarian
Action Plan (HAP) through the national cluster system5 focusing on immediate disaster response and rehabilitation
activities for the three months following TC Evan.
In addition to the HAP, the Government of Fiji requested support from the World Bank and SPC-SOPAC to work
with relevant line ministries to develop a Post Disaster Needs Assessment (PDNA) to support the Government in the
development of a recovery framework, and in doing so ensure that the capacity for future post disaster damage and loss
assessment within the Government was strengthened.
The Post Disaster Needs Assessment (PDNA) was conducted between 13th February and 8th March 2013.
5
A coordination mechanism that brings together key government agencies, stakeholders and partners for each sector.
Fiji PDNA Tropical Cyclone Evan, 17th December 2012 4Post-Disaster Needs Assessment
1.4 THE POST DISASTER NEEDS ASSESSMENT
METHODOLOGY
The PDNA is a synthesis of the Damage and Loss Assessment (DaLA) and the human recovery needs assessment
templates. The PDNA has gained universal acceptance as the template for assessing net disaster impact. It typically
includes a recovery and reconstruction framework that guides the post-disaster recovery strategy. A unique aspect of
the PDNA is that it is led and owned by the Government of the affected country and assisted by a multi-disciplinary, multi-
agency team in this instance comprising the World Bank, GFDRR, certain UN agencies, the European Commission, the
Secretariat of the Pacific Community and other relevant stakeholders.
The PDNA contains:
• Damage, loss, and macro-economic impacts on the affected economy.
• Impacts on livelihoods, incomes, and human development.
• Short, medium, and long-term recovery and reconstruction needs.
• Measures for mainstreaming disaster risk reduction in post-disaster recovery and reconstruction plans.
The core of the methodology, the DaLA, was developed by the United Nations Economic Commission for Latin America
and the Caribbean (ECLAC), based on its work in Central America in the early 1970’s and the Caribbean in the eighties
and nineties6.
The Conceptual Framework
The core methodology for undertaking an assessment of the effects of a disaster or extreme event is a bottom-up
approach, capturing the information about the effects of the event, sector by sector and aggregating this data to arrive
at the total effect of the event on the society and the economy. The methodology makes use of the national accounting
framework of a country for valuation of the damage and loss and the categorization of the effects.
The effects are described as damage (total or partial destruction of assets) and losses or the subsequent changes to the
economic flows of income, as a result of the disaster.
In keeping with the standard definitions in use:
Damage is defined as total or partial destruction of physical assets existing in the affected area. Damage occurs during
and immediately after the disaster and is measured in physical units (i.e. square meters of housing, kilometres of roads,
etc.). Its monetary value is expressed in terms of replacement costs according to prices prevailing just before the event7.
Losses are defined as changes in economic flows arising from the disaster. They occur until full economic recovery
and reconstruction is achieved, in some cases lasting for several years. Typical losses include the decline in output in
productive sectors (agriculture, livestock, fisheries, industry, commerce, tourism)8.
The task of estimation of the damage and loss is one of the critical components of the assessment methodology. The
second critical component is the impact analysis on the economy and the society, which is based largely on the estimate
of losses. Its outcome can be used in planning for recovery and reconstruction. The value of damage is used as the
basis for estimating reconstruction needs while the value of losses provides the means for estimating the financial needs
for economic recovery.
It is important to note that damage and loss have a temporal dimension, damage occurring at the time or immediately
after an event and losses occurring from the time of the event for a period that could continue anytime from months to
years, when full recovery and reconstruction take place.
The ultimate goal of the assessment is to measure in monetary and social terms the impact of disasters on the society,
economy and the environment of the affected country or region and to enable the quantification of the financial needs
for economic recovery and reconstruction, with risk reduction.
6
The terminology of the Methodology has been changed over time to better reflect the intent of its use. More expansive explanations can
be found in the detailed Handbook (Volume 1,2,3,4) published by ECLAC, the SIDS Manual, published by ECLAC/Caribbean Development
Corporation Committee (CDCC) and the more recently published, Damage and Loss and Needs Assessment Guidance Notes (Volume 1,2,3)
published by (GFDRR) the Global Facility for Disaster Reduction and Recovery, of the World Bank.
7
Damage, Loss and Needs Assessment: Guidance Notes Volume 2 (2010). The International Bank for Reconstruction and Development/the
World Bank. pg. 2.
8
Ibid.
5 Tropical Cyclone Evan, 17th December 2012 Fiji PDNAYou can also read


