UPPER NORTH ISLAND KEY SECTOR TRENDS TO 2015 AND LABOUR DEMAND TO 2020 - Summary Report - Infometrics
←
→
Page content transcription
If your browser does not render page correctly, please read the page content below

UPPER NORTH ISLAND KEY
SECTOR TRENDS TO 2015 AND
LABOUR DEMAND TO 2020

Summary Report

June 2016
Authorship: This summary report has been prepared for the Upper North Island Strategic Alliance by
            MartinJenkins and Infometrics.
Background
At the end of August 2015, Upper North Island (UNI) councils1 commissioned MartinJenkins and
Infometrics to:
identify criteria for selecting key industry sectors for the UNI and identify a subset of such sectors
identify value chains for these sectors and the extent of connectedness across the UNI
identify emerging constraints to and opportunities for growth of these sectors
develop growth scenarios for the sectors in the UNI region and forecast the demand and supply
of labour and skills for these sectors, taking into account demographic, economic and
technological trends
identify and assess actions that could be taken to improve the matching of supply and demand by
reviewing existing skill-based initiatives in the selected sectors in the region
allow UNI councils to understand the extent to which the UNI operates as an economic unit and,
as a result, the extent to which it is important that industry development decisions are made
within a UNI context for the success of New Zealand and individual regions and cities.
The UNI economy and labour market
UNI Gross Domestic Product (GDP) in 2015 was $117 billion, over half of the New Zealand economy
($220 billion). With average annual GDP growth of 2.1 percent over the last ten years, the UNI has
grown slightly faster than the rest of New Zealand (1.7 percent per annum). However, over the last five
years, the UNI’s average GDP growth rate of 3.0 percent per annum was well ahead of the rest of the
country (1.9 percent per annum).
The UNI area had an estimated resident population of 2.46 million
people in 2015, 54 percent of New Zealand’s population.
Within the UNI area, Auckland has the largest share of the population at 1.57 million, followed by
Waikato (439,000), Bay of Plenty (287,000), and then Northland (168,000). Growing at 1.4 percent
annually over the last ten years, the population in the UNI area is expanding at twice the rate of the
rest of New Zealand.
1
The Upper North Island Strategic Alliance (UNISA) is a grouping of seven councils. These are the four regional/unitary councils of
Northland, Auckland, Waikato and Bay of Plenty, and the major city/district councils in Whangārei, Hamilton and Tauranga. There are
several other councils that fall within the UNI area but are not part of the UNISA. These include the Far North, Kaipara, Hauraki, Matamata-
Piako, Thames-Coromandel, Waikato, Waipa, Waitomo, Otorohanga, South Waikato, Taupō, Rotorua, Ōpōtiki, Kawerau, and Western Bay
of Plenty. In all there are 22 local or regional authorities within the UNI area.
1
There were 1.19 million filled jobs in the UNI in 2015, almost 52 percent
of all filled jobs in New Zealand.

Within the UNI, most of the jobs were in Auckland (787,000), followed by Waikato (197,000), Bay of
Plenty (135,000), then Northland (65,900). Over the last ten years, employment in the UNI has grown
by 1.3 percent per annum, 40 percent faster than the 0.9 percent per annum growth in the rest of
New Zealand.
Higher levels of educational attainment are linked to improved labour force status. The UNI performs
at a similar, although slightly better, level than the rest of New Zealand on several key indicators. For
example, in 2013, 21 percent of UNI residents had bachelor degree qualifications or higher compared
to 19 percent in the rest of New Zealand. 20 percent of UNI residents had no qualifications compared
to 22 percent in the rest of New Zealand. In 2015, UNI’s youth NEET (Not in Employment, Education
or Training) rate of 11.5 percent was similar to the national rate of 11.3 percent.

In general, people tend to reside in the region where they work and there
is little inter-regional movement of people for work within the UNI.

Waikato has the highest level of out-of-region commuting in the UNI (8 percent), mainly to Auckland.
Given the limited inter-regional commuting, it should not be expected that skill demands in one region
could be easily met by an over-supply of labour in another region in the short-term.
However, over the longer term, research shows that New Zealanders respond to regional shortages
and are prepared to relocate where job opportunities occur, but not to the point where differences in
labour market outcomes are completely eliminated.2 2013 Census figures show that inter-regional
migration between the UNI regions has been strongest from Auckland to Northland (8,700 people in
Northland in 2013 previously resided in Auckland five years earlier), from Auckland to Waikato (15,700
people in Waikato in 2013 had lived in Auckland five years earlier), from Waikato to Auckland (17,450
people), from Auckland to Bay of Plenty (7,770) and from Waikato to Bay of Plenty (7,820). Figure 1
shows the proportion of each UNI region’s population that lived in other regions five years earlier.

2
    Mare D. and Timmins J. (2003). “Moving to Jobs?”, Motu Working Paper #2003-07. Motu Economic and Public Policy Research Trust. The
    report clearly shows that internal migration flows are related to relative local labour market conditions. The report notes that the link
    between migration and local conditions does not mean that regional differences in labour market outcomes are eliminated. There is a good
    deal of persistence in relative labour market outcomes. It would appear that migration provides a means of smoothing fluctuations in local
    demand, but not in removing longer-term differences in relative labour market outcomes.

2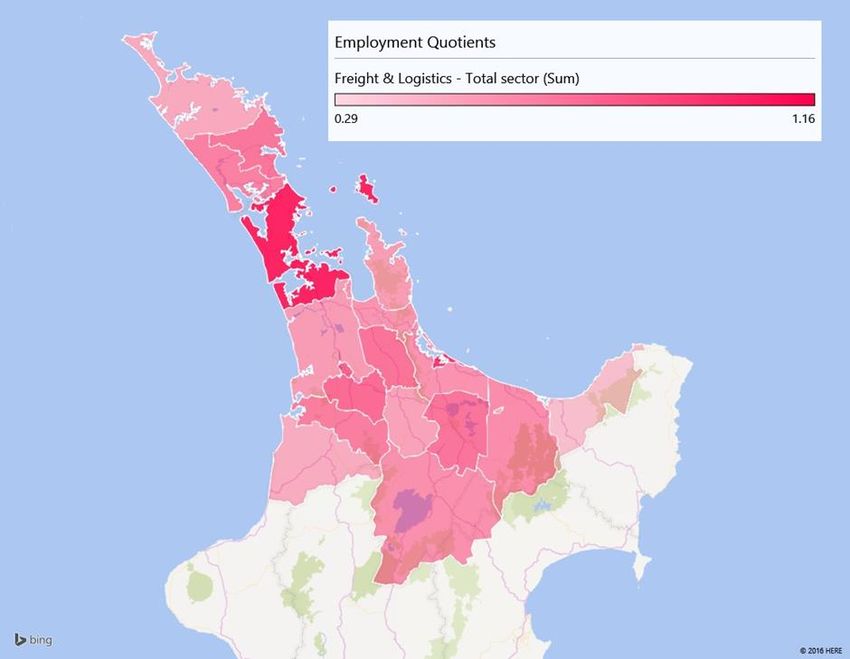
Figure 1. Inward migration to UNI regions
Northland, 70%
6.0% 0.6%
0.5% 1.2% 4.1% 2.5% 0.4%
0.5%
Bay of Plenty
Auckland, 73%
3% 70%
2.4%
3%
4.0%
4.1%
0.8% 9.6%
0.6% 2.1%
5.4%
Waikato, 71%
Rest of New
3.7% Zealand
5.3%
Overseas
Source: MartinJenkins based on Census 2013. The arrows show the direction of migration from each region, with the proportions representing the
percentage of the destination region’s population that resided in the source region in 2008. Thicker arrows represent a larger proportion of the
destination region’s population.
In sum, although the numbers are relatively small, the largest volume of flows of people between UNI
regions has been from the larger urban regions to their neighbouring regions. A relatively large source
of migrants is from overseas. Assuming these flows continue, they suggest where UNI regions are
more likely to source labour over the medium to long-term.
Key sectors
Key sectors are defined as those that offer the greatest potential for
output and employment growth within the UNI regions.
An assessment of the competitive strength of each sector (based on each sector’s level of
concentration in the UNI and employment, productivity and value added scale and growth), sector
market opportunities (domestic and export growth) and the broader impacts that each sector has on
the economy identified the following as key sectors for the UNI:
Forestry & wood processing
Construction & construction-related services
Dairy & dairy related services
3
Food & beverage cultivation & processing Tourism Freight & logistics Business & professional services Health services & residential care. Future labour supply The baseline forecast suggests that the UNI labour force will grow from 1.24 million in 2013 to 1.53 million in 2033. This growth rate of 1.1 percent per annum is lower than the 1.9 percent per annum growth rate that the UNI has experienced since 2000. This suggests that labour supply could impose a constraint on growth in the future. Future labour supply is dependent on the number of school and tertiary education leavers and migration. Nationally, and in the UNI, the overall number of young people leaving schools is not expected to grow over the coming five years, with the overall number of school leavers in the UNI projected to decline 1.7 percent (by 500 people) over the next five years. A total of 33,000 school leavers are likely to be available for work over the 5-year period to 2020. Drawing on current and historic enrolment and completion data at a regional level, the number of graduates from tertiary education organisations in the UNI that will be available for work can be estimated over the 2016 to 2020 period. We estimate that, over the 5-year period, 228,000 graduates from tertiary education in the UNI will make themselves available for work in the year after graduation. The UNI will also gain workers through net international and regional migration (from other locations in New Zealand). We estimate that a net additional 134,000 people of working age could migrate to the UNI between 2016 and 2020. Almost three quarters of these migrants (73 percent) are likely to come from overseas. Overall, over the 2016 to 2020 period, there will be an estimated additional 395,000 people in the UNI available for work. Of this additional pool of labour, 45 percent (177,000 people) are expected to have a level 1-3 qualification as their highest qualification and 33 percent (131,000 people) are expected to have a Bachelor Degree or Higher. 4
Demand for labour
In forecasting the demand for labour, we first established a baseline forecast based on a number of
assumptions related to future economic growth. Nationally, the baseline forecasts assume moderate
growth in the economy in the five years to 2020 (2.6 percent per annum) and more limited growth in
employment (1.5 percent per annum). Strong net migration inflows and a lift in building activity are
expected to more than offset continued weak global demand and a lower New Zealand dollar.
The BAU forecasts estimate employment growth in the UNI of 1.9
percent per annum over the five years to 2020, compared with the 1.8
percent per annum achieved over the five years to March 2015.
The BAU forecasts suggest that an additional 115,400 jobs will be created between 2016 and 2020.
This equates to a growth rate of 1.9 percent per annum over the period, which is faster than
employment growth of 1.5 percent per annum that is forecast nationally.
Forecast growth was broken down by region and by sector in the UNI and these forecasts were tested
against industry research and with a number of businesses and industry organisations. Key factors
that influence the demand for labour were considered:
Resource availability – for example, the expected availability of core inputs for some sectors such
as logs in forestry and crops in food and beverage
Market demand – particularly expected changes in global demand for primary products and
tourism, in consumer demand resulting from population growth, and due to the pipeline of
infrastructure investment (including visitor infrastructure) planned in regions
Production capacity – for example, if we were aware of new investments in processing plants,
ports and freight hubs
Innovation and technological changes – such as automation and R&D which will increase
productivity and may reduce the demand for labour in certain sectors (e.g., robotics, larger
vehicles).
As a result of the more detailed research and feedback, employment forecasts were moderated for
some sectors and regions.
Following moderation:
Auckland is the only region that is forecast to grow at a faster rate than nationally, at 2.2 percent
per annum. The weakest employment growth is forecast to be in Northland (0.9 percent per
annum) followed by Waikato (1.3 percent per annum). Employment in Bay of Plenty is forecast to
grow by 1.5 percent per annum.
5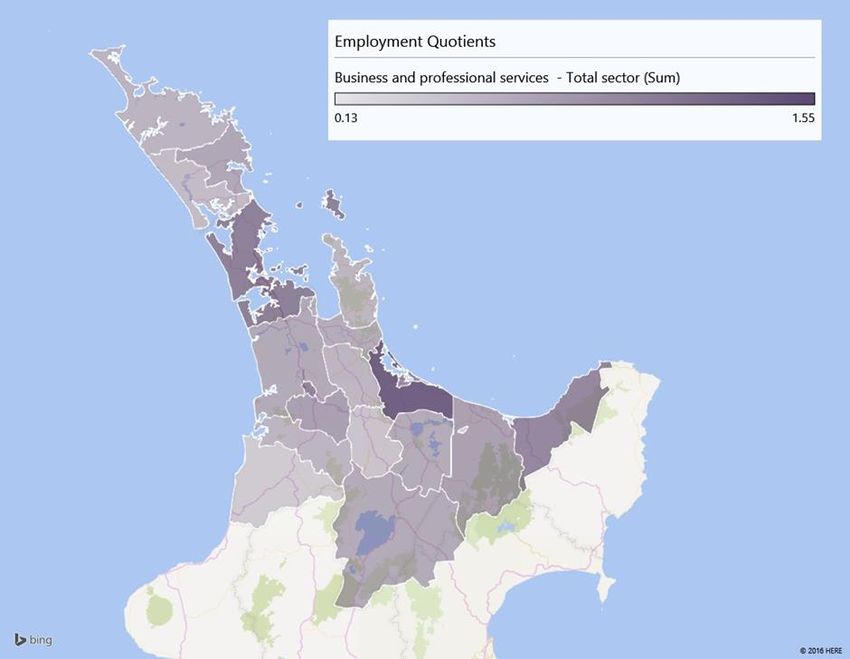
Strong growth in employment in the UNI is forecast for construction and related services (5.5
percent per annum), business and professional services (2.4 percent per annum), health services
and residential care (2.2 percent per annum) and tourism (2.0 percent per annum). Low or
negative employment growth is forecast for freight and logistics (0.7 percent per annum), dairy
and related processing (-0.1 percent per annum), food and beverage (0.5 percent per annum) and
forestry and wood processing (-1.2 percent per annum).
In addition to new jobs, workers will be required to replace workers who leave jobs to work in different
industries or who leave the labour market (e.g., retire, leave the country). The forecasts estimate that
an additional 247,300 workers will be required to meet this replacement demand over 2016-2020.
Combining the demand for workers to fill new jobs and replacing existing
jobs, an additional 363,000 workers are likely to be required in the UNI
over the 2016 to 2020 period. This is just over 6.1 percent of the total
number of filled jobs in 2015, on an annualised basis.
The greatest demand for jobs will be for people with a level 1-3 qualification (152,000, 42 percent).
There is also likely to be strong demand in jobs requiring people with a Bachelor degree or higher,
with 30 percent of all job openings in the UNI likely to require people with these qualifications.
About 209,000 of these job openings over 2016 to 2020 are expected to be in the key sectors, with
over half of these (52 percent) in the construction and related services and business and professional
services sectors (Figure 2).
Figure 2. Forecast UNI job openings by key sector, 2016 to 2020
Source: Infometrics
6Not surprisingly, Auckland is expected to have the largest absolute share of job openings, accounting
for 68 percent of all openings. The next major source of job openings is Waikato (15 percent), followed
by Bay of Plenty (12 percent) and Northland (5 percent).
Match between demand and supply
Over 2016-2020 the forecasts estimated there will be a net oversupply of labour of 32,400. However,
there are years (2016/17 and 2017/18) where demand for labour exceeds supply of labour. In the final
year (2019/20) there is a relatively small surplus of labour, which will make matching skills to jobs
more difficult (Figure 3).
Figure 3. Skill imbalances in the UNI by individual year, 2016 to 2020
Source: Infometrics
Although the forecasts suggest a net oversupply of labour over the 2016
to 2020 period at the aggregate level, this does not mean there will not
be shortages of certain skills.
Only if there was a very good match between the type of new skills produced and the type of skills
required by employers would there be no skill shortages. The greater the available supply, the more
likely skills can be matched to jobs.
Our modelling finds that there are several occupations where there are expected to be an undersupply
of workers over 2016 to 2020. As shown in Figure 4, large shortages are forecast in occupations
related to construction (e.g., project builders, carpenters, painting trades workers), transport and
logistics (e.g., truck drivers, storepersons) and tourism (e.g., retail managers, kitchenhands).
7Figure 4. Forecast occupational shortages in the UNI, 2016 to 2020 Source: Infometrics Sector forecasts and labour challenges Forestry and wood processing The forestry and wood processing sector is a relatively large sector in the UNI, contributing $2.0 billion to GDP and employing 16,700 people, and generating exports of $2.8 billion. The sector grew at a slower rate than the UNI economy over the last ten years and, while GDP increased by 0.3 percent per annum, employment declined by 2.5 percent per annum. Within the sector, close to three times as many people are employed in wood product manufacturing than in forestry and logging or pulp and paper product manufacturing. Although several major industries experienced an increase in GDP over the last five and ten years, a large number of processing industries experienced a decline in employment. The sector has a higher proportion of low skilled (56 percent compared to 38 percent) and medium- skilled workers (17 compared to 13 percent) relative to the UNI economy as a whole. The top occupations in the sector in the UNI are forestry workers (6.7 percent of total employment), wood processing machine operators (5.2 percent), sawmill or timber yard workers (4.9 percent) and labourers (4.8 percent). The sector is concentrated in Bay of Plenty, Waikato and Northland regions, and even more so in certain districts such as Kawerau, South Waikato, Taupō and Rotorua (Figure 5). Auckland is also important to the sector as a large proportion of further processing for the domestic market occurs there. 8
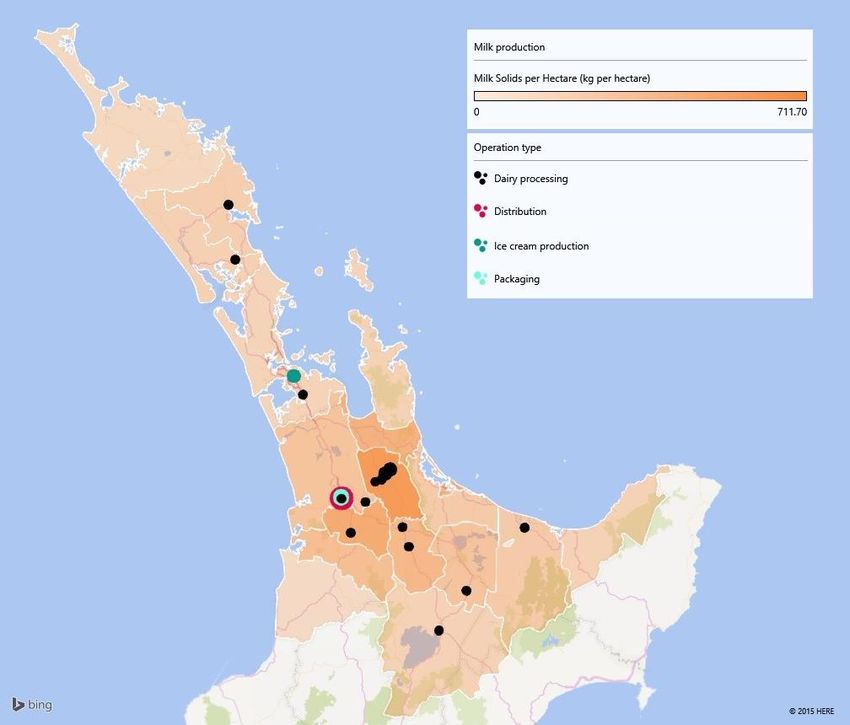
From a geographic and logistics perspective, sector activity is self-contained within the UNI. Most
processing is located close to where the trees are harvested or near final demand. The majority of
inputs are purchased, and outputs are moved, within the UNI. Moreover, each sub-region’s output is
largely used within that particular sub-region or exported through the nearest port (with the exception
of some movement of product from Auckland and Waikato to Bay of Plenty, presumably for export,
and limited movement of product from Bay of Plenty to Auckland for processing). There is also
relatively limited commuting of workers in the sector between UNI regions.

Figure 5:       Forestry & wood processing, concentration of employment by territorial authority
                and export value by port

Source: Infometrics, Deloitte, 2014. Note: the darker coloured districts are where sector employment is more highly concentrated.

Forestry and wood processing sector employment in the UNI is forecast to decrease by 1.2 percent
per annum over 2016 to 2020, with expected increased production and processing offset by increased
efficiency in the use of labour. The fall in employment is expected to be the strongest in Auckland (-2.0
percent per annum). Northland will see the lowest decline in employment at -0.4 percent per annum
(Figure 6).

                                                                                                                                    9
Figure 6: Forestry & wood processing, historical and forecast employment growth by UNI
region, 2010 to 2020
Source: Infometrics
Over the five years to 2020 the number of jobs in the sector is expected to reduce by 1,020. However,
an additional 3,590 people will be required to replace people leaving existing jobs. This suggests that
about 2,580 job openings will need to be filled over the next five years.
Our modelling suggests that 5 of the 11 key occupations employed in the forestry & wood processing
sector will be undersupplied over the next five years. The key occupations with the highest expected
undersupply are: wood processing machine operators (-178), saw mill or timber yard workers (-77),
production managers-forestry (-42) cabinetmakers (-34) and wood machinists (-8).
Job openings in the sector are expected to be spread across UNI regions, with the largest proportion
of openings expected in Bay of Plenty, followed by Waikato (Figure 7).
Figure 7: Forestry & wood processing, job openings by UNI region, 2016 to 2020
Source: Infometrics
10A relatively high proportion of job openings for forestry production managers will be in Bay of Plenty. A
relatively high proportion of job openings for joiners, cabinetmakers and wood machine operators will
be in Auckland.
Our view is that, although there are expected to be some occupational
shortages for the forestry and wood processing sector, the numbers are
not large and we do not consider additional skill or labour initiatives are
required for this sector at the UNI level.
Businesses interviewed for this study were not experiencing skills or hiring constraints. They
considered that there were a sufficient number of people being trained, and that training programmes
were of sufficient quality.
In order to continue to attract sufficient numbers of people, the sector needs to continue to improve its
safety record and perceptions of the quality of the work. The industry is committed to improving its
health and safety record and, in conjunction with government agencies, is implementing the
recommendations from the Independent Forestry Safety Review (2014).
Construction and related services sector
The construction and related services sector contributed $8.18 billion to GDP in the UNI and employed
115,000 people in 2015 (close to 10 percent of the UNI workforce). Over the last five years, GDP and
employment in the sector has grown more rapidly than the UNI economy, driven by population growth,
household and business confidence and investment in infrastructure.
Close to two and a half times as many people are employed in construction services than in building
construction. Heavy and civil engineering construction employs the lowest number of construction
sector workers. The greatest growth in employment over the last ten years has been in other
residential building construction, other building installation services, and other heavy and civil
engineering construction.
The sector has experienced employment growth across all UNI regions over the last ten years. The
strongest growth has been in Auckland and Bay of Plenty. Growth in Auckland and Bay of Plenty has
picked up even further over the last five years, despite the financial crisis, whereas it has slowed in
Waikato and declined in Northland.
The construction and related services sector has a higher proportion of medium-skilled employees (31
percent compared to 13 percent) relative to the UNI economy as a whole, and a much lower
proportion of low-skilled workers (24 percent compared to 38 percent). The top occupations in the
sector in the UNI are project builders (10.1 percent of total employment), electricians (5.3 percent),
carpenters (3.8 percent) and painting trades workers (3.3 percent).
Over 65 percent of the sector’s employment in the UNI is based in Auckland. Districts within the UNI
that stand out as having a high ratio of workers in the construction sector are Thames-Coromandel,
Hamilton City and Taupō in Waikato, and Tauranga City in Bay of Plenty (Figure 8).
11Figure 8: Construction & related services, concentration of employment by TA Source: Infometrics. Note: the darker coloured districts are where sector employment is more highly concentrated. This sector is also quite self-contained within the UNI (only 11 percent of the sector’s purchases are imported into the region) and is geared toward providing services within defined geographic areas, although there are linkages across UNI regions. Larger engineering and national construction companies work across regional boundaries although they tend to have divisions or franchises responsible for different areas. Previous research on inter-regional labour movements indicates that inflows of domestic construction labour into UNI regions tend to come from other UNI regions. There is a reasonable degree of commuting of workers in this sector within the UNI, with over 6 percent of Northland’s construction workforce and over 5 percent of Waikato’s workforce coming from other UNI regions. More than 1200 construction sector workers in Auckland come from Waikato. This suggests that, even in the short-term, construction workforce demands in one UNI region may be able to be met from labour in other UNI regions. Employment in the UNI is forecast to grow by 5.5 percent per annum over the five years to 2020, led by Auckland and Bay of Plenty (both 5.9 percent per annum). Sector employment growth in Waikato and Northland is also forecast to be strong at 4.3 percent per annum and 3.5 percent per annum respectively (Figure 9). Sector growth will be driven by strong population growth, an undersupply of housing in Auckland, significant non-residential projects and a need for continued investment in infrastructure. Over the five years to 2020, the number of new jobs in the sector is expected to increase by 35,400. In addition, a further 25,600 job openings will be required to replace people leaving existing jobs in the sector. Altogether, a total of 61,100 construction job openings will need to be filled over the next five years in the UNI. 12
Figure 9:       Construction and related services, historical and forecast employment growth by
                UNI region, 2010 to 2020

Source: Infometrics

The forecasts indicate that 15 of the 20 key occupations employed in the construction & related
services sector will be undersupplied over the next five years. Those with the highest projected
undersupply are project builders (-4,410), painting trades workers (-1,270), and carpenters (-1,130).
Job openings in the sector are expected to be heavily concentrated in Auckland, which is estimated to
have around 70 percent of the job openings over 2016-2020 (Figure 10). However, there are still large
numbers of job openings also expected in Waikato and Bay of Plenty.

Figure 10: Construction and related services, job openings by UNI region, 2016 to 2020

Source: Infometrics

Discussions with industry suggest that there are indeed employment constraints. There is a general
view that an insufficient number of people are being trained, that training is fragmented and that some
training programmes do not provide the necessary level of quality. The industry indicated that the
future of critical parts of the recruitment pipeline need to be assessed such as Gateway and
Apprenticeship subsidies.

                                                                                                        13
There are other issues that the industry needs to address to attract and retain workers, including:
the limited management capability of small firms to manage high workloads and to respond to
fluctuations in demand
the sector has a relatively high level of work related accidents and injuries. A poor safety record
and perceptions of poor health and safety practices can make the industry less attractive for
prospective employees and also result in higher than average employee turnover
industry representatives have indicated that the sector is not particularly attractive to younger
workers, female workers or older workers; is perceived as low-skilled, involving hard work and
long-hours; and that there is a general lack of understanding of career opportunities in the sector
employees can have low levels of literacy and numeracy, which impacts on retention and career
progression.
the cyclical nature of the industry makes it difficult to retain workers during periods of low
demand.
There are a large range of initiatives underway across the UNI to address skill shortages in this sector.
These include:
the Auckland construction sector workforce roadmap to assist tertiary education providers to
respond to employment growth driven by the growing level of construction activity in the region
the Auckland ARA initiative that aims to maximise local job opportunities resulting from the
Airport’s major redevelopment programme
Maori and Pasifika Trades Training initiatives throughout the UNI that are focused on the sector.
There are also a range of national programmes relevant to the sector. However, given the expected
number of jobs required, there will need to be a significant increase in recruitment and training of key
occupations. Existing UNI initiatives will require expansion and likely replication in other areas with
incremental change unlikely to be sufficient. We note, however, that there may be a sizeable
workforce that will be available from Canterbury after construction activity in that region peaks in 2017.
In order to smooth construction sector demand and facilitate inter-
regional movement of scarce labour, it may also be beneficial if the
sector and local and central government coordinate the timing of major
infrastructure investment and explore procurement approaches across
the UNI.
Dairy and related processing
The dairy and related processing sector in the UNI contributed $3.10 billion to GDP, employed 26,300
people and generated exports of $7.6 billion in 2015. The sector has been growing more slowly than
the rest of the region in terms of GDP, employment and productivity over the last ten years, although
exports from the sector have grown significantly.
14The performance of the sector is heavily influenced by dairy cattle farming as this is where the
greatest proportion of value add and employment occurs. In 2015, dairy cattle farming accounted for
74 percent of GDP and 70 percent of jobs. However, the greatest growth in GDP and jobs over the
last decade has been in the manufacturing and support services industries within the sector. The
number of filled jobs in dairy cattle farming has fallen over the last ten years.
Reflecting this, the sector has experienced the strongest growth in GDP over the last decade in
Auckland. Average GDP growth in the other UNI regions has been quite limited, although jobs in the
sector have grown in all UNI regions over the last five years.
The dairy and related processing sector in the UNI has a higher proportion of high skilled workers (55
percent compared to 38 percent) relative to the UNI economy as a whole, but a much lower proportion
of medium and medium-high skilled workers (6 percent compared to 24 percent). The top occupations
in the sector in the UNI are dairy cattle farmers (38.5 percent of total employment), mixed crop and
livestock farm workers (10.7 percent) and dairy cattle farm workers (6.3 percent).
Figure 11: Concentration of milksolids production and location of dairy processing in the UNI
Source: Infometrics. Note: the darker coloured districts are where sector employment is more highly concentrated.
Waikato is the epicentre of the dairy industry in the UNI and can also be considered the centre of the
industry nationally, contributing two thirds of the sector’s GDP and 57 percent of employment. Most
key processing plants are in Waikato (Figure 11). There are also strong pockets of activity in
Northland (Kaipara) and Bay of Plenty (eastern BOP). Auckland plays an important processing role
(e.g., all Fonterra ice cream), although only contributes ten percent of the sector’s employment in the
UNI.
15This industry is also largely self-contained within the UNI, with the majority of inputs sourced and
outputs moved within the UNI. Moreover, each sub-region’s output is largely used or moved within the
particular sub-region, with the exception of freight of manufactured dairy products from Waikato to Bay
of Plenty for export and freight of liquid milk products from Auckland to Northland and Waikato. There
are also very few workers in the sector commuting between UNI regions. That suggests that each UNI
region will need to meet labour demands for this sector from largely within their own region in the
short-term.
Dairy sector employment in the UNI is forecast to decline by 0.1 percent per annum from 2016 to
2020. The sector is currently facing tough times due to the reduction in global dairy prices and planned
conversions of other forms of agriculture (e.g., forestry) to dairy have halted. Milk prices and
production are not expected to recover until the medium to long-term. There are a range of planned
processing plant expansions in the UNI, although growth in employment from expected increases in
processing is expected to be offset by technological and efficiency gains. The forecasts do suggest
that there will be some employment growth in Bay of Plenty and Auckland reflecting processing
growth. Employment in Waikato and Northland is expected to fall, reflecting the maturity of dairy
farming in those regions.
Figure 12: Dairy & related processing, historical and forecast employment growth by UNI
region, 2010 to 2020
Source: Infometrics
While the number of jobs in the sector is expected to decline by 106 in the five years to 2020, an
additional 4,700 people will be required to replace people leaving existing jobs. This suggests that
4,600 job openings will need to be filled over the next five years across the UNI.
Our modelling suggests that only two of the 10 key occupations employed in the dairy and related
processing sector will be under-supplied over the next five years and both are technical occupations:
chemistry technicians (-73) and agricultural technicians (-39).
More than half of the forecast job openings will be in Waikato (2,440), with another quarter in Bay of
Plenty (1,130). The greatest number of job openings are expected for dairy cattle farmers, mixed crop
and livestock farm workers and dairy cattle farm workers.
16Figure 13: Dairy & related processing, job openings by UNI region, 2016 to 2020
Source: Infometrics
Industry representatives we talked to indicated that, despite the tough conditions, there are shortages
of dairy farmers in some areas and shortages of technical skills related to processing, such as food
technologists and food safety experts. Industry feedback suggests that young people are not attracted
to the industry because of the long hours, hard work and isolation of farming. The industry itself needs
to promote career paths and opportunities in the sector.
However, overall it does not appear there will be major skill shortages faced by this sector in the UNI
over the next five years. The labour market for the sector is relatively self-contained to each region,
which does not lend itself to cross-UNI interventions.
If specific constraints emerge for the dairy sector in the UNI, these are
likely best addressed through industry initiatives and locally focused
actions rather than UNI-wide initiatives.
Food and beverage cultivation and processing
The food and beverage cultivation and processing (food and beverage) sector in the UNI contributed
$2.5 billion to GDP, employed 28,800 people, and generated exports of $3.3 billion in 2015. The
sector’s GDP, employment and exports grew more slowly than the rest of the UNI economy over the
ten and five years to 2015.
Within the sector, the largest proportion of GDP and/or filled jobs is in the other food products
manufacturing industry (13 percent of GDP and 16 percent of jobs) followed by bakery product
manufacturing (10 percent of GDP and 12 percent of jobs) and kiwifruit growing (5 percent of GDP
and 9 percent of jobs). Soft drink and syrup manufacturing and wine and other alcoholic beverage
manufacturing contribute a large proportion of GDP (13 percent each) but make a smaller contribution
to employment.
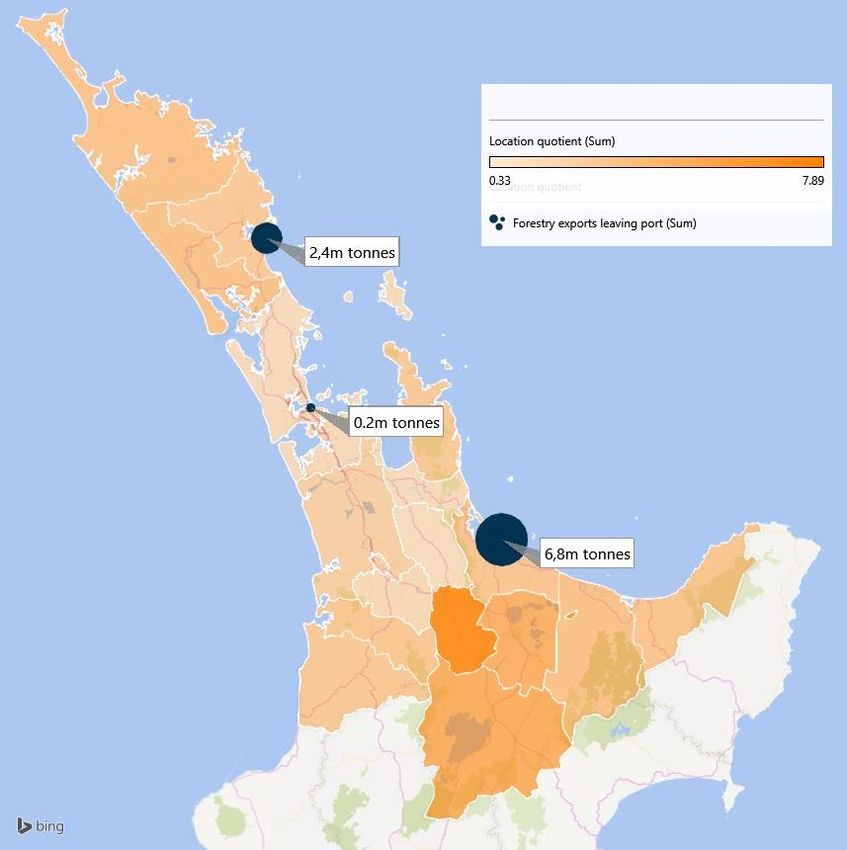
17The strongest growth in employment over the last ten years has been in other crop growing (12.2 percent per annum), beekeeping (7.8 percent per annum), beer manufacturing (6.1 percent per annum) and grape growing (5.0 percent per annum). The food and beverage sector experienced relatively strong growth in Waikato over 2005 to 2015 and 2010 to 2015 and in Northland over 2010 to 2015. There has been low growth in the other UNI regions. Despite the relatively low growth compared to the UNI economy as whole, the sector’s employment growth in the UNI has been above the national sector average over 2010-2015. The sector in the region has a higher proportion of low skilled workers (53 percent compared to 38 percent) relative to the UNI economy as a whole, and a lower proportion of medium and higher skilled workers. The top occupations in the food and beverage sector in the UNI are fruit or nut growers (5.5 percent of total employment in the sector), bakers (5.3 percent), labourers (4.7 percent), sales assistants (3.8 percent) and container fillers (3.3 percent). Auckland accounts for almost 60 percent of the sector’s jobs in the UNI. Bay of Plenty has a high concentration of the sector, with Western Bay of Plenty, Opotiki, Waikato, Kaipara, Waipa, Whakatāne and Far North also having a concentration of food and beverage activity. The greatest concentration of food and beverage cultivation is in Opotiki and Western Bay of Plenty while the greatest concentration of processing is in Auckland, Waikato District and Western Bay of Plenty (Figure 14). The sector purchases inputs from a range of other sectors, particularly livestock farming and meat processing, dairy and related processing, freight and logistics and business and professional services, and hence is reliant on the performance of these sectors. There are also some strong linkages in the sector across UNI regions, particularly from regional areas into Auckland. For example, more than a quarter of Northland’s and Waikato’s horticultural freight is transported to Auckland. Similarly, 20 percent of Northland’s and 25 percent of Waikato’s freight of other food products are transported to Auckland. In Northland and Waikato, relatively large proportions of the sector’s workforce (8 percent and 6 percent respectively) commute from other areas of the UNI, particularly Auckland. This suggests that the sector’s labour force in Auckland will be reasonably affected by growth in the sector in other UNI regions. It also suggests that some of the demand for food and beverage workers in the other UNI regions may be able to be met from the Auckland labour market. 18
Figure 14: Food & beverage, concentration of employment in cultivation and processing
           industries by territorial authority
 Cultivation

 Processing

Source: Infometrics. Note: the darker coloured districts are where sector employment is more highly concentrated.

Employment in the food & beverage sector in the UNI is forecast to grow by 0.5 percent per annum
over 2016-2020. As with other primary sectors, employment growth from expected increases in
production and processing will be offset to a degree by technological and efficiency gains.
Employment growth is expected to be strongest in Bay of Plenty (1.0 percent per annum) followed by
Auckland (0.6 percent per annum). Employment in the sector is forecast to decline over the next five
years in Northland (-0.6 percent per annum) and Waikato (-0.2 percent per annum) (Figure 15).

                                                                                                                    19
Figure 15: Food and beverage cultivation and processing, historical and forecast employment
growth by UNI region, 2010 to 2020
Source: Infometrics
The number of jobs in the food and beverage sector is expected to increase by 690 over 2016 to
2020. However, an additional 5,900 people will also be required to replace people leaving existing
jobs. This suggests about 6,600 job openings will need to be filled in the sector over the next five
years.
Our modelling suggests that 3 of the 14 key occupations employed in the food & beverage sector will
be under-supplied over the next five years. These occupations are container fillers (-484), food & drink
factory workers (-163), and baking factory workers (-12). Occupations expected to be undersupplied
are all low qualification jobs (level 1-3).
Auckland is expected to have the majority of job openings (59 percent), with close to a quarter of job
openings expected in Bay of Plenty and another 13 percent in Waikato (Figure 16).
Figure 16: Food and beverage cultivation & processing, job openings by UNI region, 2016 to
2020
Source: Infometrics
20Based on the findings and our review of research, the major labour force
issue facing the food and beverage sector is the difficulty the horticulture
segment has in finding lower skilled workers for cultivation, particularly in
high seasons.
For example, labour shortages for kiwifruit crop-picking are an ongoing problem in Bay of Plenty.
Kiwifruit orchards rely on attracting a high number of pickers from outside the region and,
predominantly, from overseas. There has been limited success with sharing labour resources across
industries (e.g., kiwifruit and avocado growers), with the intention to create a more stable workforce.
The Recognised Seasonal Employer (RSE) policy is regarded by the industry as critical as it helps to
address seasonal labour and skills shortages that cannot be readily filled from the available
New Zealand labour pool.
There are two key projects underway nationally to address skill shortages and seasonality issues: a)
supplementing RSE with a similar scheme for New Zealand workers, and b) further demand/labour
analysis for the horticulture and viticulture sector to underpin the development of longer-term labour
and skills strategy for the sector. It is not apparent that any further effort needs to be made by UNISA
at this stage, other than encouraging the sector in the UNI to participate in the application of these
initiatives.
Tourism
The tourism sector in the UNI contributed $4.4 billion to GDP, employed 86,300 people, and captured
$4.3 billion in international visitor spend in 2015. The sector has experienced GDP growth at close to
the same rate as the UNI over the last decade, but no employment growth (on average) over that
period.
Within the sector, the food and beverage serving services segment has experienced the strongest
growth in employment and GDP over the last decade (2.4 and 3.4 percent per annum respectively),
followed by passenger transport (1.7 and 2.7 percent per annum respectively). The retail sales
segment has experienced strong GDP growth but low employment growth. Accommodation activity
has grown slowly over the last ten years, but this has picked up over the last five years, experiencing
the second fastest employment growth at 2.2 percent annually.
There was close to $10.6 billion of visitor spending in the UNI in the year ended March 2015, with 40
percent of that being international visitor expenditure. Visitor expenditure grew by 3.2 percent per
annum over 2010-2015, slightly slower than the 3.3 percent per annum growth nationally. Guest nights
in the UNI have grown by 2.9 percent per annum over the same period.
Auckland accounts for the greatest share of economic activity in the sector (65 percent of GDP and 60
percent of employment), followed by Waikato, Bay of Plenty, then Northland. The greatest intensity of
employment is in the key tourist destinations of Taupō, Rotorua, Thames-Coromandel, and Far North
(Figure 17).
21Figure 17: Tourism, concentration of employment by territorial authority Source: Infometrics. Note: the darker coloured districts are where sector employment is more highly concentrated. The strongest growth in sector GDP has been in Auckland and Waikato, with Northland GDP only growing at a third of the national rate. On the other hand, growth in tourism sector employment in the UNI has lagged well behind New Zealand over the last ten years. None of the UNI regions’ tourism sectors grew as fast as tourism nationally over the last decade and Northland has seen a decline in tourism sector employment over the last ten years. Although employment has improved over the last five years, only Auckland’s tourism sector grew at a faster rate than nationally. The sector in the region has a significantly higher proportion of medium skilled workers than the UNI economy as a whole (25 percent compared to 13 percent). Contrary to what might be expected, the share of low skilled workers in the sector is far less than for the UNI economy as a whole (22 percent compared to 38 percent). The largest occupations in the sector in the UNI are sales assistants (6.7 percent of total employment in the sector), chefs (4.6 percent), waiters (3.8 percent), café or restaurant managers (3.0 percent), commercial cleaners (2.8 percent) and retail managers (2.7 percent). Tourism is well connected with a range of other sectors, with close to 50 percent of visitor expenditure in the sector going into purchasing services and intermediate goods from a wide range of other industries, including construction, food processing, wholesaling, business and professional services. The sector is also strongly linked across the UNI, with the majority (55 percent) of domestic visitor expenditure in the UNI derived from visitors within the UNI itself. Just over a third of Auckland’s, 74 percent of Bay of Plenty’s, 84 percent of Northland’s and 74 percent of Waikato’s domestic visitor expenditure is derived from visitors from other UNI regions. These interconnections suggest that constraints in and labour demands from one UNI region will have flow-on impacts to other regions. Tourism sector employment in the UNI is forecast to increase by 2.0 percent per annum over 2016 to 2020 (Figure 18). Employment growth is expected to be strongest in Auckland (2.4 percent per annum) followed by Waikato and Bay of Plenty (both 1.3 percent per annum), then Northland (0.9 percent per annum). 22
Figure 18: Tourism, historical and forecast employment growth by UNI region, 2010 to 2020

Source: Infometrics

The number of new jobs in the sector is expected to increase by 8,860 over the five years to 2020.
However, to replace people leaving existing jobs, an additional 19,530 people will be required. This
suggests that about 28,400 job openings will need to be filled over the next five years.
Of the total job openings, the majority will be in Auckland (18,300, 65 percent) followed by Waikato (18
percent), Bay of Plenty (12 percent) then Northland (5 percent). The greatest number of job openings
are in food service jobs such as waiters, chefs, kitchenhands and café workers.

Figure 19: Tourism, job openings by UNI region, 2016 to 2020

Source: Infometrics

The forecasts suggest that there will be an undersupply in nine of the 16 most relevant jobs in the
tourism sector over the next five years. The occupations with the greatest expected undersupply are
kitchenhands (-1,530), waiters (-910), café or restaurant managers (-710) and hotel or motel
managers (-320).

                                                                                                       23
Industry representatives consulted confirmed that tourism businesses are experiencing labour and skill constraints. Specific occupations already in high demand include chefs, waiters and hotel/accommodation managers. Demand for labour is very seasonal and temporary migrant labour is making up an increasing proportion of the workforce and will continue to play an important role in meeting demand. There is not a clear education and training pathway into some tourism sector occupations. Previous research also suggests that the sector is poorly promoted as a career and the generally low pay also impacts on the attractiveness of the sector. These issues are well known and there are several regional initiatives underway to address constraints, such as the new tourism training college that is opening in Northland. Service IQ is also developing regional tourism workforce roadmaps that are focused on actions to address shortages. Auckland is one of the first three roadmaps being completed and it is intended that roadmaps will also be developed for Northland, Taupō and Bay of Plenty. At a national level, joint work is also underway between the sector and government on supporting and enabling the transition of beneficiaries into employment into the tourism industry, increasing the capability of businesses in the sector, and promoting tourism as a career in schools. Given the importance of the tourism sector to all UNI regions and the interconnected nature of tourism flows and demands across the UNI, UNISA could play a role in encouraging the application of national initiatives to the region as a matter of priority. Freight and logistics The freight and logistics sector is significant in scale in the UNI. In 2015 it contributed $12.2 billion to GDP and employed 118,000 people. Over the last ten years the sector has experienced annual average GDP growth of around two-thirds of the UNI average and employment growth of around a third of the UNI average. The largest industry in the sector by far in terms of employment and GDP is road freight transport, representing around 9 percent of GDP and 13 percent of employment. It employs twice as many people as the next largest industry, which is other electrical and electronic goods wholesaling (responsible for 6 percent of both GDP and employment). Other large industries within the sector are other goods wholesaling, air and space transport and other grocery wholesaling. Freight and logistics industries that have grown strongly in the UNI are typically wholesaling industries, such as other machinery and equipment wholesaling, general line grocery wholesaling, other agricultural product wholesaling and professional and scientific goods wholesaling. The sector is dominated by Auckland, which accounted for over three quarters of employment in 2015 (77 percent). Waikato accounted for another 11 percent and Bay of Plenty accounted for 9 percent. Employment growth over the last ten years has been the fastest in Auckland and Bay of Plenty (both 0.5 percent annually) while declining in Waikato (-0.1 percent per annum). 24
The sector has a higher proportion of low skilled employees (54 percent compared to 38 percent)
relative to the UNI economy as a whole, and lower proportions of medium, medium-high and high
skilled workers. The top occupations in the sector in the UNI are truck drivers, closely followed by
sales representatives (both 6.8 percent of total employment), then storepersons and sales assistants
(both 5.1 percent) and then sales and marketing managers (5.0 percent).
Freight and logistics is a key input for most sectors, particularly primary sectors and those with a high
export component or bulky products. Inputs into the sector tend to be of a service nature – business
and professional services, financial services, property services, personal services and ICT. Given this,
the sector is well connected with other sectors. Geographically the sector tends to cluster around
transport routes and freight distribution hubs (seaports and airports), areas with good access to the
main road networks and major domestic markets. Not surprisingly, the sector is particularly
concentrated in Auckland and Tauranga (Figure 20).

Figure 20: Freight & logistics, concentration of employment by territorial authority

Source: Infometrics. Note: the darker coloured districts are where sector employment is more highly concentrated.

There are strong intra-UNI connections within the sector. In terms of the inter-regional movement of
freight, the National Freight Demand Survey (2014) showed that most freight generated within each
UNI region is freighted within that region or to other UNI regions, rather than being transported across
other regions. Road freight flows tend to be into Auckland from the other regions, from Auckland into
Bay of Plenty, and between Waikato and Bay of Plenty. This reflects the importance of the Ports of
Auckland and Tauranga in exporting goods and also Auckland’s position as a major market.

There is also a reasonable proportion of rail freight transported across UNI regions, particularly from
Auckland and Waikato to Bay of Plenty. However, there is limited movement of freight between the
Ports in the UNI.

                                                                                                                    25
Moreover, there is a relatively high level of commuting of workers in the sector between some UNI
regions. Six percent of Northland’s freight and logistics workforce lives in Auckland (285 workers), and
over 1500 of Auckland’s workforce comes from Waikato.
Despite the relatively strong growth in freight that is forecast over the period, capital investment and
efficiency improvements (e.g., through improved ports, roads, technology) means that employment is
unlikely to increase at the same rate as economic activity. Freight and logistics employment in the UNI
is forecast to increase by 0.7 percent per annum in the five years to 2020 (Figure 21). Employment
growth is expected to be strongest in Auckland (0.8 percent per annum) followed by Waikato (0.6
percent per annum) then Northland and Bay of Plenty (both 0.5 percent per annum).
Figure 21: Freight & logistics, historical and forecast employment growth by UNI region, 2010
to 2020
Source: Infometrics
The number of jobs in the sector is expected to increase by 4,410 in the five years to 2020. However,
to replace people leaving existing jobs, an additional 23,500 people will be required. This suggests
that about 27,900 job openings will need to be filled over the next five years.
Our modelling suggests that eight of the top 18 key occupations in the freight and logistics sector are
expected to be undersupplied over the next five years. Key occupations that are expected to be
undersupplied are storepersons (-966), truck drivers (-802), motor mechanics (general) (-413),
container fillers (-484) and corporate services managers (-549).
Over three quarters of the job openings in the sector are expected to be in Auckland (Figure 22). Job
openings for truck drivers and motor mechanics (general) will be spread more evenly across the UNI
regions.
26Figure 22: Freight & logistics, job openings by UNI region, 2016 to 2020
Source: Infometrics
Feedback from industry representatives suggests that generally the sector is not experiencing
skill/hiring constraints except in two areas: logistical support staff in service centres and truck drivers.
The industry has been vocal about a shortage of truck drivers for several years. There are concerns
that young people are not entering the truck driving profession and that there is a lack of clear
pathways for young people into truck driving. As it can take several years to get a full class 5 license
to operate heavy vehicles, there can be lags in addressing these shortages. Given this, employers are
turning to migrant labour as an alternative way to recruit drivers.
New qualifications have been developed by MITO, NZQA and industry, which will provide clearer
career pathways in the sector. The Ministry of Transport has also recently released a discussion
document on the driver licensing review, which includes suggestions for improving the process for
getting a class 5 license.
Our view is that the most significant current and future skills issue facing
the freight and logistics sector in the UNI is a lack of truck drivers.
UNISA is already playing a role in addressing skills issues for this sector as it has signed up to the
Upper North Island Transport Accord, which includes, as one of the action areas, ‘a future-fit freight
workforce’. Actions already underway include a working group that is undertaking further analysis to
determine the scope of workforce capacity issues, and an examination of the impact of the Graduated
Driver Licensing System on heavy vehicle training as part of the review of driver licensing.
Two key initiatives in the UNI which could also warrant UNISA attention are:
Bay of Plenty Polytechnic offers a truck driver course which accelerates the time it takes students
to get from class 1 to class 5 and has been expanding delivery of the course into Waikato. It is
discussing setting up the course in Auckland with National Road Carriers Inc.
27 The Auckland Chamber of Commerce has also proposed a joint venture with the haulage and
logistics sector to develop a group employment and training scheme for Class 5 licensed truck
drivers in Auckland. The Chamber is developing a proposal for central government consideration.
Given the significance of the sector to the UNI and the forecast demands for key occupations, UNISA
could discuss with Bay of Plenty Polytechnic, National Road Carriers, Chamber of Commerce and
central government whether and how these initiatives could be applied to the broader UNI.
Business and professional services
The business and professional services sector in the UNI contributed $9.2 billion to GDP, employed
144,000 people, and generated exports of $763 million in 2015. Over the last ten years, GDP has
been growing slightly slower, and employment slightly faster, than the rest of the UNI. This has
resulted in slower productivity growth at about half the UNI average.
Within the sector, management consulting services (19 percent of GDP and 15 percent of
employment) and corporate head office management services (15 percent of GDP and 12 percent of
employment) are the largest industries in value and employment terms. Other large employing
industries in the UNI are labour supply services (10 percent of employment), accounting services (9
percent) and building cleaning services (8 percent). Together these five industries contribute more
than 50 percent of the sector’s employment.
Non-financial intangible assets leasing and other professional, scientific and technical services have
enjoyed the strongest employment growth over the last ten and five years, at close to 10 percent per
annum, although they are relatively small in scale. Employment in most of the sector’s industries has
grown over the last five and ten years.
Auckland accounts for 75 percent of all employment in the sector in the UNI. Employment has
increased in all regions over the last ten years, led by Bay of Plenty (2.8 percent per annum), with
Waikato experiencing the slowest growth in employment at 1.2 percent per annum.
Not surprisingly, the sector has a higher proportion of high skilled workers than the UNI economy as a
whole (46 percent compared to 38 percent). It has a smaller share of low, medium and medium-high
skilled workers than the UNI economy overall. The top two occupations in the sector, commercial
cleaners and accountants, each employ over 8,000 people and account for 12 percent of employment
in the sector. Other major occupations are solicitors (3.3 percent), general clerks (2.9 percent) and
chief executives or managing directors (2.8 percent).
Business and professional services are strongly linked with other sectors. They are an input into all
other sectors and the sector purchases services from several other sectors, particularly freight and
logistics, property and ICT. However, inter-regional linkages are more limited as business and
professional service firms tend to service the locality and region in which they are based. However,
more specialised services in the larger centres, such as Auckland, Tauranga and Hamilton, do service
other regions.
The sector is reasonably concentrated in the three major cities but is not particularly concentrated in
other region centres such as Rotorua, Whangārei or Taupō (Figure 23). However, there is a
reasonably high concentration of the sector in Western Bay of Plenty and Ōpōtiki.
28You can also read